Project
Illumina Body Map 2 (GSE30611)
Navigation
Downloads
Results for AGAUCAG
Z-value: 0.05
Motif logo

miRNA associated with seed AGAUCAG
| Name | miRBASE accession |
|---|---|
|
hsa-miR-383-5p.2
|
Activity profile of AGAUCAG motif
Sorted Z-values of AGAUCAG motif
| Promoter | Log-likelihood | Transcript | Gene | Gene Info |
|---|---|---|---|---|
| chr18_+_22169580 | 0.03 |
ENST00000269216.10
|
GATA6
|
GATA binding protein 6 |
| chr6_-_33009568 | 0.03 |
ENST00000374813.1
ENST00000229829.7 |
HLA-DOA
|
major histocompatibility complex, class II, DO alpha |
| chrX_-_134915232 | 0.01 |
ENST00000370783.8
|
MOSPD1
|
motile sperm domain containing 1 |
| chr5_+_64505981 | 0.01 |
ENST00000334025.3
|
RGS7BP
|
regulator of G protein signaling 7 binding protein |
| chr7_-_84194781 | 0.01 |
ENST00000265362.9
|
SEMA3A
|
semaphorin 3A |
| chr14_-_70809494 | 0.01 |
ENST00000381250.8
ENST00000554752.7 ENST00000555993.6 |
MAP3K9
|
mitogen-activated protein kinase kinase kinase 9 |
| chr22_+_21417357 | 0.01 |
ENST00000407464.7
|
HIC2
|
HIC ZBTB transcriptional repressor 2 |
| chr12_-_110583305 | 0.01 |
ENST00000354300.5
|
PPTC7
|
protein phosphatase targeting COQ7 |
| chr5_-_14871757 | 0.01 |
ENST00000284268.8
|
ANKH
|
ANKH inorganic pyrophosphate transport regulator |
| chr17_+_48997377 | 0.00 |
ENST00000290341.8
|
IGF2BP1
|
insulin like growth factor 2 mRNA binding protein 1 |
| chr3_+_32817990 | 0.00 |
ENST00000383763.6
|
TRIM71
|
tripartite motif containing 71 |
| chr16_+_50548387 | 0.00 |
ENST00000268459.6
|
NKD1
|
NKD inhibitor of WNT signaling pathway 1 |
| chr20_+_6767678 | 0.00 |
ENST00000378827.5
|
BMP2
|
bone morphogenetic protein 2 |
| chr4_-_98929092 | 0.00 |
ENST00000280892.10
ENST00000511644.5 ENST00000504432.5 ENST00000450253.7 ENST00000505992.1 |
EIF4E
|
eukaryotic translation initiation factor 4E |
| chr15_+_41660397 | 0.00 |
ENST00000219905.12
ENST00000566586.6 |
MGA
|
MAX dimerization protein MGA |
| chr2_+_14632688 | 0.00 |
ENST00000331243.4
ENST00000295092.3 |
LRATD1
|
LRAT domain containing 1 |
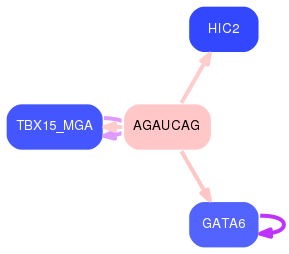
Network of associatons between targets according to the STRING database.
