Project
Illumina Body Map 2 (GSE30611)
Navigation
Downloads
Results for AGCAGCA
Z-value: 0.89
Motif logo

miRNA associated with seed AGCAGCA
| Name | miRBASE accession |
|---|---|
|
hsa-miR-15a-5p
|
MIMAT0000068 |
|
hsa-miR-15b-5p
|
MIMAT0000417 |
|
hsa-miR-16-5p
|
MIMAT0000069 |
|
hsa-miR-195-5p
|
MIMAT0000461 |
|
hsa-miR-424-5p
|
MIMAT0001341 |
|
hsa-miR-497-5p
|
MIMAT0002820 |
|
hsa-miR-6838-5p
|
MIMAT0027578 |
Activity profile of AGCAGCA motif
Sorted Z-values of AGCAGCA motif
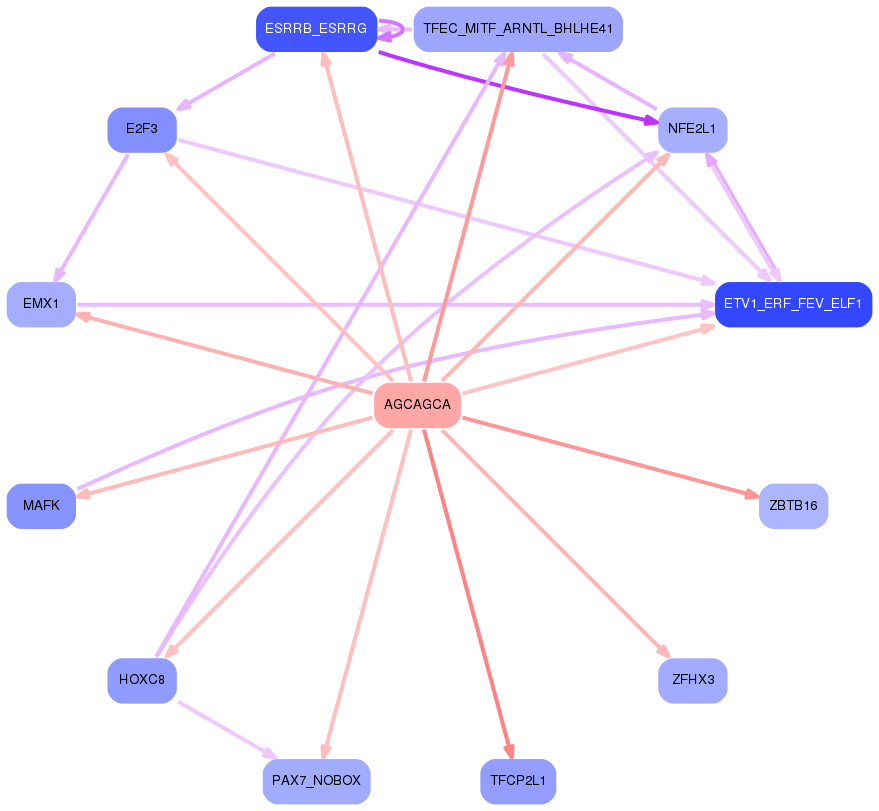
Network of associatons between targets according to the STRING database.

First level regulatory network of AGCAGCA
Gene Ontology Analysis
Gene overrepresentation in biological process category:
| Log-likelihood per target | Total log-likelihood | Term | Description |
|---|---|---|---|
| 0.6 | 1.8 | GO:0035981 | tongue muscle cell differentiation(GO:0035981) positive regulation of skeletal muscle fiber differentiation(GO:1902811) regulation of tongue muscle cell differentiation(GO:2001035) positive regulation of tongue muscle cell differentiation(GO:2001037) |
| 0.3 | 1.0 | GO:0003365 | establishment of cell polarity involved in ameboidal cell migration(GO:0003365) |
| 0.3 | 0.9 | GO:0061300 | cerebellum vasculature development(GO:0061300) |
| 0.3 | 1.5 | GO:0090290 | positive regulation of osteoclast proliferation(GO:0090290) |
| 0.3 | 1.7 | GO:0051138 | positive regulation of NK T cell differentiation(GO:0051138) |
| 0.3 | 0.8 | GO:0051041 | positive regulation of calcium-independent cell-cell adhesion(GO:0051041) |
| 0.3 | 1.0 | GO:0038018 | Wnt receptor catabolic process(GO:0038018) |
| 0.2 | 1.5 | GO:0046340 | diacylglycerol catabolic process(GO:0046340) |
| 0.2 | 0.9 | GO:0043091 | nitric oxide production involved in inflammatory response(GO:0002537) lysine import(GO:0034226) L-arginine import(GO:0043091) L-lysine import(GO:0061461) arginine import(GO:0090467) L-arginine transmembrane transport(GO:1903400) L-lysine import into cell(GO:1903410) |
| 0.2 | 0.7 | GO:0070634 | transepithelial ammonium transport(GO:0070634) |
| 0.2 | 1.5 | GO:0086048 | membrane depolarization during bundle of His cell action potential(GO:0086048) |
| 0.2 | 1.0 | GO:0071596 | ubiquitin-dependent protein catabolic process via the N-end rule pathway(GO:0071596) |
| 0.2 | 0.8 | GO:0031106 | septin ring assembly(GO:0000921) septin ring organization(GO:0031106) |
| 0.2 | 0.6 | GO:1903570 | regulation of protein kinase D signaling(GO:1903570) positive regulation of protein kinase D signaling(GO:1903572) |
| 0.2 | 0.7 | GO:2000393 | negative regulation of lamellipodium morphogenesis(GO:2000393) |
| 0.2 | 0.9 | GO:0061034 | olfactory bulb mitral cell layer development(GO:0061034) |
| 0.2 | 2.3 | GO:0008354 | germ cell migration(GO:0008354) |
| 0.2 | 2.5 | GO:0007028 | cytoplasm organization(GO:0007028) |
| 0.2 | 0.6 | GO:0044691 | tooth eruption(GO:0044691) |
| 0.2 | 0.5 | GO:1903774 | positive regulation of viral budding via host ESCRT complex(GO:1903774) |
| 0.2 | 0.5 | GO:1903526 | negative regulation of membrane tubulation(GO:1903526) |
| 0.1 | 0.6 | GO:0098971 | anterograde dendritic transport of neurotransmitter receptor complex(GO:0098971) |
| 0.1 | 0.4 | GO:0043449 | olfactory learning(GO:0008355) cellular alkene metabolic process(GO:0043449) |
| 0.1 | 0.4 | GO:1904849 | positive regulation of cell chemotaxis to fibroblast growth factor(GO:1904849) positive regulation of endothelial cell chemotaxis to fibroblast growth factor(GO:2000546) |
| 0.1 | 0.4 | GO:0090176 | microtubule cytoskeleton organization involved in establishment of planar polarity(GO:0090176) |
| 0.1 | 0.8 | GO:0098917 | retrograde trans-synaptic signaling(GO:0098917) retrograde trans-synaptic signaling by soluble gas(GO:0098923) trans-synaptic signaling by soluble gas(GO:0099543) |
| 0.1 | 0.4 | GO:0014813 | skeletal muscle satellite cell commitment(GO:0014813) |
| 0.1 | 0.5 | GO:0038060 | nitric oxide-cGMP-mediated signaling pathway(GO:0038060) |
| 0.1 | 0.5 | GO:0048377 | lateral mesodermal cell fate commitment(GO:0048372) lateral mesodermal cell fate specification(GO:0048377) regulation of lateral mesodermal cell fate specification(GO:0048378) |
| 0.1 | 0.7 | GO:0072709 | cellular response to sorbitol(GO:0072709) |
| 0.1 | 0.6 | GO:1904059 | regulation of locomotor rhythm(GO:1904059) |
| 0.1 | 0.5 | GO:1990926 | short-term synaptic potentiation(GO:1990926) |
| 0.1 | 0.5 | GO:2000638 | regulation of SREBP signaling pathway(GO:2000638) negative regulation of SREBP signaling pathway(GO:2000639) |
| 0.1 | 0.5 | GO:0032474 | otolith morphogenesis(GO:0032474) |
| 0.1 | 0.7 | GO:1900220 | semaphorin-plexin signaling pathway involved in bone trabecula morphogenesis(GO:1900220) |
| 0.1 | 0.6 | GO:0015891 | iron chelate transport(GO:0015688) siderophore transport(GO:0015891) |
| 0.1 | 0.5 | GO:0044376 | RNA polymerase II complex import to nucleus(GO:0044376) RNA polymerase III complex localization to nucleus(GO:1990022) |
| 0.1 | 2.0 | GO:0044341 | sodium-dependent phosphate transport(GO:0044341) |
| 0.1 | 0.6 | GO:1901093 | regulation of protein tetramerization(GO:1901090) negative regulation of protein tetramerization(GO:1901091) regulation of protein homotetramerization(GO:1901093) negative regulation of protein homotetramerization(GO:1901094) |
| 0.1 | 0.3 | GO:0090365 | regulation of mRNA modification(GO:0090365) |
| 0.1 | 0.9 | GO:0033353 | S-adenosylmethionine cycle(GO:0033353) |
| 0.1 | 0.3 | GO:1903826 | arginine transmembrane transport(GO:1903826) |
| 0.1 | 0.1 | GO:1902534 | single-organism membrane invagination(GO:1902534) |
| 0.1 | 0.3 | GO:1990709 | presynaptic active zone organization(GO:1990709) |
| 0.1 | 0.7 | GO:0018032 | protein amidation(GO:0018032) |
| 0.1 | 1.4 | GO:0016191 | synaptic vesicle uncoating(GO:0016191) |
| 0.1 | 0.9 | GO:0000255 | allantoin metabolic process(GO:0000255) |
| 0.1 | 1.2 | GO:0019375 | galactosylceramide biosynthetic process(GO:0006682) galactolipid biosynthetic process(GO:0019375) |
| 0.1 | 0.8 | GO:0038033 | positive regulation of endothelial cell chemotaxis by VEGF-activated vascular endothelial growth factor receptor signaling pathway(GO:0038033) |
| 0.1 | 0.3 | GO:1904693 | midbrain morphogenesis(GO:1904693) |
| 0.1 | 0.4 | GO:0098957 | anterograde axonal transport of mitochondrion(GO:0098957) |
| 0.1 | 1.0 | GO:2000601 | positive regulation of Arp2/3 complex-mediated actin nucleation(GO:2000601) |
| 0.1 | 0.3 | GO:0046338 | phosphatidylethanolamine catabolic process(GO:0046338) |
| 0.1 | 1.1 | GO:0051005 | negative regulation of lipoprotein lipase activity(GO:0051005) |
| 0.1 | 0.4 | GO:1901165 | positive regulation of trophoblast cell migration(GO:1901165) |
| 0.1 | 0.4 | GO:0030806 | negative regulation of cyclic nucleotide catabolic process(GO:0030806) negative regulation of cAMP catabolic process(GO:0030821) |
| 0.1 | 0.5 | GO:0097676 | histone H3-K36 dimethylation(GO:0097676) |
| 0.1 | 1.2 | GO:0099525 | presynaptic dense core granule exocytosis(GO:0099525) |
| 0.1 | 0.8 | GO:0001957 | intramembranous ossification(GO:0001957) direct ossification(GO:0036072) |
| 0.1 | 1.8 | GO:0010510 | regulation of acetyl-CoA biosynthetic process from pyruvate(GO:0010510) |
| 0.1 | 1.0 | GO:0043569 | negative regulation of insulin-like growth factor receptor signaling pathway(GO:0043569) |
| 0.1 | 0.2 | GO:1902617 | response to fluoride(GO:1902617) |
| 0.1 | 0.2 | GO:0097010 | eukaryotic translation initiation factor 4F complex assembly(GO:0097010) |
| 0.1 | 0.2 | GO:0003420 | regulation of growth plate cartilage chondrocyte proliferation(GO:0003420) histone H3-R2 methylation(GO:0034970) |
| 0.1 | 0.2 | GO:1903537 | meiotic spindle elongation(GO:0051232) meiotic cell cycle process involved in oocyte maturation(GO:1903537) regulation of meiotic cell cycle process involved in oocyte maturation(GO:1903538) |
| 0.1 | 0.5 | GO:0060011 | Sertoli cell proliferation(GO:0060011) |
| 0.1 | 0.8 | GO:0051549 | positive regulation of keratinocyte migration(GO:0051549) |
| 0.1 | 1.0 | GO:0097105 | presynaptic membrane assembly(GO:0097105) |
| 0.1 | 0.3 | GO:0018283 | metal incorporation into metallo-sulfur cluster(GO:0018282) iron incorporation into metallo-sulfur cluster(GO:0018283) |
| 0.1 | 0.2 | GO:1902594 | viral penetration into host nucleus(GO:0075732) multi-organism nuclear import(GO:1902594) |
| 0.1 | 0.3 | GO:0090071 | negative regulation of ribosome biogenesis(GO:0090071) |
| 0.1 | 0.4 | GO:0048388 | endosomal lumen acidification(GO:0048388) |
| 0.1 | 0.1 | GO:0071676 | negative regulation of mononuclear cell migration(GO:0071676) |
| 0.1 | 0.8 | GO:0050882 | voluntary musculoskeletal movement(GO:0050882) |
| 0.1 | 1.1 | GO:0042670 | retinal cone cell differentiation(GO:0042670) retinal cone cell development(GO:0046549) |
| 0.1 | 1.1 | GO:0035331 | negative regulation of hippo signaling(GO:0035331) |
| 0.1 | 0.5 | GO:0021869 | forebrain ventricular zone progenitor cell division(GO:0021869) |
| 0.1 | 1.4 | GO:0045792 | negative regulation of cell size(GO:0045792) |
| 0.1 | 0.6 | GO:0035766 | cell chemotaxis to fibroblast growth factor(GO:0035766) endothelial cell chemotaxis to fibroblast growth factor(GO:0035768) regulation of cell chemotaxis to fibroblast growth factor(GO:1904847) regulation of endothelial cell chemotaxis to fibroblast growth factor(GO:2000544) |
| 0.1 | 0.3 | GO:0072137 | condensed mesenchymal cell proliferation(GO:0072137) |
| 0.1 | 1.5 | GO:0086027 | AV node cell action potential(GO:0086016) AV node cell to bundle of His cell signaling(GO:0086027) |
| 0.1 | 0.5 | GO:1903385 | regulation of homophilic cell adhesion(GO:1903385) |
| 0.1 | 0.2 | GO:0016094 | polyprenol biosynthetic process(GO:0016094) |
| 0.1 | 0.2 | GO:1904976 | response to bleomycin(GO:1904975) cellular response to bleomycin(GO:1904976) |
| 0.1 | 0.3 | GO:0016240 | autophagosome docking(GO:0016240) |
| 0.1 | 0.6 | GO:0042271 | susceptibility to natural killer cell mediated cytotoxicity(GO:0042271) |
| 0.1 | 0.3 | GO:0035927 | RNA import into mitochondrion(GO:0035927) |
| 0.1 | 0.4 | GO:0044805 | late nucleophagy(GO:0044805) |
| 0.1 | 0.2 | GO:0033341 | regulation of collagen binding(GO:0033341) |
| 0.1 | 0.8 | GO:1904263 | positive regulation of TORC1 signaling(GO:1904263) |
| 0.1 | 0.3 | GO:1903613 | regulation of protein tyrosine phosphatase activity(GO:1903613) positive regulation of protein tyrosine phosphatase activity(GO:1903615) |
| 0.1 | 0.3 | GO:0009298 | GDP-mannose biosynthetic process(GO:0009298) |
| 0.1 | 1.3 | GO:1902260 | negative regulation of delayed rectifier potassium channel activity(GO:1902260) |
| 0.1 | 0.3 | GO:1903070 | negative regulation of ER-associated ubiquitin-dependent protein catabolic process(GO:1903070) |
| 0.1 | 0.5 | GO:2000490 | negative regulation of hepatic stellate cell activation(GO:2000490) |
| 0.1 | 0.5 | GO:0042997 | negative regulation of Golgi to plasma membrane protein transport(GO:0042997) |
| 0.1 | 0.7 | GO:0060449 | bud elongation involved in lung branching(GO:0060449) |
| 0.1 | 0.2 | GO:1902683 | regulation of receptor localization to synapse(GO:1902683) |
| 0.1 | 0.6 | GO:0071787 | endoplasmic reticulum tubular network assembly(GO:0071787) |
| 0.1 | 0.5 | GO:0018317 | protein C-linked glycosylation(GO:0018103) peptidyl-tryptophan modification(GO:0018211) protein C-linked glycosylation via tryptophan(GO:0018317) protein C-linked glycosylation via 2'-alpha-mannosyl-L-tryptophan(GO:0018406) |
| 0.1 | 0.3 | GO:1903974 | mammary gland fat development(GO:0060611) positive regulation of macrophage colony-stimulating factor signaling pathway(GO:1902228) positive regulation of response to macrophage colony-stimulating factor(GO:1903971) positive regulation of cellular response to macrophage colony-stimulating factor stimulus(GO:1903974) positive regulation of microglial cell migration(GO:1904141) |
| 0.1 | 1.9 | GO:0055003 | cardiac myofibril assembly(GO:0055003) |
| 0.1 | 1.1 | GO:2000480 | negative regulation of cAMP-dependent protein kinase activity(GO:2000480) |
| 0.1 | 0.2 | GO:0016062 | adaptation of rhodopsin mediated signaling(GO:0016062) light adaption(GO:0036367) |
| 0.0 | 0.2 | GO:0003221 | right ventricular cardiac muscle tissue morphogenesis(GO:0003221) |
| 0.0 | 0.8 | GO:0070444 | oligodendrocyte progenitor proliferation(GO:0070444) regulation of oligodendrocyte progenitor proliferation(GO:0070445) |
| 0.0 | 0.2 | GO:0001732 | formation of cytoplasmic translation initiation complex(GO:0001732) translation reinitiation(GO:0002188) |
| 0.0 | 1.4 | GO:0010944 | negative regulation of transcription by competitive promoter binding(GO:0010944) |
| 0.0 | 0.2 | GO:0002528 | regulation of vascular permeability involved in acute inflammatory response(GO:0002528) |
| 0.0 | 0.1 | GO:0070541 | response to platinum ion(GO:0070541) |
| 0.0 | 0.8 | GO:0015939 | pantothenate metabolic process(GO:0015939) |
| 0.0 | 0.2 | GO:0009436 | glyoxylate catabolic process(GO:0009436) |
| 0.0 | 0.5 | GO:2000580 | regulation of ATP-dependent microtubule motor activity, plus-end-directed(GO:2000580) positive regulation of ATP-dependent microtubule motor activity, plus-end-directed(GO:2000582) |
| 0.0 | 0.5 | GO:0032525 | somite rostral/caudal axis specification(GO:0032525) |
| 0.0 | 0.1 | GO:0090526 | regulation of gluconeogenesis involved in cellular glucose homeostasis(GO:0090526) |
| 0.0 | 0.7 | GO:0060068 | vagina development(GO:0060068) |
| 0.0 | 0.6 | GO:0019368 | fatty acid elongation, saturated fatty acid(GO:0019367) fatty acid elongation, unsaturated fatty acid(GO:0019368) fatty acid elongation, monounsaturated fatty acid(GO:0034625) fatty acid elongation, polyunsaturated fatty acid(GO:0034626) |
| 0.0 | 0.0 | GO:0071284 | cellular response to lead ion(GO:0071284) |
| 0.0 | 0.7 | GO:0098719 | sodium ion import across plasma membrane(GO:0098719) sodium ion import into cell(GO:1990118) |
| 0.0 | 0.3 | GO:0035990 | tendon cell differentiation(GO:0035990) tendon formation(GO:0035992) |
| 0.0 | 1.1 | GO:1904262 | negative regulation of TORC1 signaling(GO:1904262) |
| 0.0 | 0.1 | GO:0061577 | calcium ion transmembrane transport via high voltage-gated calcium channel(GO:0061577) |
| 0.0 | 0.5 | GO:0006987 | activation of signaling protein activity involved in unfolded protein response(GO:0006987) |
| 0.0 | 0.2 | GO:2000687 | negative regulation of rubidium ion transport(GO:2000681) negative regulation of rubidium ion transmembrane transporter activity(GO:2000687) |
| 0.0 | 0.5 | GO:1903690 | negative regulation of wound healing, spreading of epidermal cells(GO:1903690) |
| 0.0 | 0.1 | GO:0001828 | inner cell mass cell fate commitment(GO:0001827) inner cell mass cellular morphogenesis(GO:0001828) |
| 0.0 | 0.2 | GO:0072365 | regulation of cellular ketone metabolic process by negative regulation of transcription from RNA polymerase II promoter(GO:0072365) |
| 0.0 | 0.8 | GO:2000465 | regulation of glycogen (starch) synthase activity(GO:2000465) |
| 0.0 | 0.3 | GO:0008626 | granzyme-mediated apoptotic signaling pathway(GO:0008626) |
| 0.0 | 0.4 | GO:0002158 | osteoclast proliferation(GO:0002158) |
| 0.0 | 0.5 | GO:0061734 | parkin-mediated mitophagy in response to mitochondrial depolarization(GO:0061734) |
| 0.0 | 0.5 | GO:0070257 | positive regulation of mucus secretion(GO:0070257) |
| 0.0 | 0.3 | GO:0070345 | negative regulation of fat cell proliferation(GO:0070345) |
| 0.0 | 1.2 | GO:0031115 | negative regulation of microtubule polymerization(GO:0031115) |
| 0.0 | 0.6 | GO:0045722 | positive regulation of gluconeogenesis(GO:0045722) |
| 0.0 | 0.6 | GO:0032000 | positive regulation of fatty acid beta-oxidation(GO:0032000) |
| 0.0 | 0.4 | GO:0097091 | synaptic vesicle clustering(GO:0097091) |
| 0.0 | 0.3 | GO:0007549 | dosage compensation(GO:0007549) dosage compensation by inactivation of X chromosome(GO:0009048) |
| 0.0 | 0.4 | GO:1904896 | ESCRT complex disassembly(GO:1904896) ESCRT III complex disassembly(GO:1904903) |
| 0.0 | 0.3 | GO:0061590 | calcium activated phospholipid scrambling(GO:0061588) calcium activated phosphatidylcholine scrambling(GO:0061590) calcium activated galactosylceramide scrambling(GO:0061591) |
| 0.0 | 1.2 | GO:0000038 | very long-chain fatty acid metabolic process(GO:0000038) |
| 0.0 | 0.8 | GO:0005513 | detection of calcium ion(GO:0005513) |
| 0.0 | 0.6 | GO:0017121 | phospholipid scrambling(GO:0017121) |
| 0.0 | 0.1 | GO:0019046 | release from viral latency(GO:0019046) regulation of DNA strand elongation(GO:0060382) |
| 0.0 | 2.0 | GO:0060314 | regulation of ryanodine-sensitive calcium-release channel activity(GO:0060314) |
| 0.0 | 0.6 | GO:0043562 | cellular response to nitrogen starvation(GO:0006995) cellular response to nitrogen levels(GO:0043562) |
| 0.0 | 0.5 | GO:0007021 | tubulin complex assembly(GO:0007021) |
| 0.0 | 0.4 | GO:0070831 | basement membrane assembly(GO:0070831) |
| 0.0 | 0.2 | GO:0014050 | negative regulation of glutamate secretion(GO:0014050) |
| 0.0 | 0.7 | GO:0043517 | positive regulation of DNA damage response, signal transduction by p53 class mediator(GO:0043517) |
| 0.0 | 0.3 | GO:0048280 | vesicle fusion with Golgi apparatus(GO:0048280) |
| 0.0 | 0.1 | GO:0090611 | ubiquitin-independent protein catabolic process via the multivesicular body sorting pathway(GO:0090611) |
| 0.0 | 0.7 | GO:0045292 | mRNA cis splicing, via spliceosome(GO:0045292) |
| 0.0 | 0.5 | GO:0010452 | histone H3-K36 methylation(GO:0010452) |
| 0.0 | 0.3 | GO:1904321 | response to forskolin(GO:1904321) cellular response to forskolin(GO:1904322) |
| 0.0 | 0.8 | GO:0070571 | negative regulation of axon regeneration(GO:0048681) negative regulation of neuron projection regeneration(GO:0070571) |
| 0.0 | 0.6 | GO:0006853 | carnitine shuttle(GO:0006853) |
| 0.0 | 0.2 | GO:0044806 | G-quadruplex DNA unwinding(GO:0044806) |
| 0.0 | 0.1 | GO:1900126 | negative regulation of hyaluronan biosynthetic process(GO:1900126) |
| 0.0 | 0.5 | GO:0019800 | peptide cross-linking via chondroitin 4-sulfate glycosaminoglycan(GO:0019800) |
| 0.0 | 0.5 | GO:0061635 | regulation of protein complex stability(GO:0061635) |
| 0.0 | 0.3 | GO:0006662 | glycerol ether metabolic process(GO:0006662) |
| 0.0 | 0.9 | GO:0014046 | dopamine secretion(GO:0014046) regulation of dopamine secretion(GO:0014059) |
| 0.0 | 0.8 | GO:0016338 | calcium-independent cell-cell adhesion via plasma membrane cell-adhesion molecules(GO:0016338) |
| 0.0 | 0.1 | GO:0044335 | canonical Wnt signaling pathway involved in neural crest cell differentiation(GO:0044335) |
| 0.0 | 0.1 | GO:0014004 | microglia differentiation(GO:0014004) microglia development(GO:0014005) smooth endoplasmic reticulum calcium ion homeostasis(GO:0051563) response to norepinephrine(GO:0071873) cellular response to norepinephrine stimulus(GO:0071874) |
| 0.0 | 4.9 | GO:0007156 | homophilic cell adhesion via plasma membrane adhesion molecules(GO:0007156) |
| 0.0 | 1.2 | GO:1903959 | regulation of anion transmembrane transport(GO:1903959) |
| 0.0 | 0.2 | GO:0046604 | positive regulation of mitotic centrosome separation(GO:0046604) |
| 0.0 | 0.4 | GO:0008627 | intrinsic apoptotic signaling pathway in response to osmotic stress(GO:0008627) |
| 0.0 | 0.1 | GO:0030579 | ubiquitin-dependent SMAD protein catabolic process(GO:0030579) |
| 0.0 | 0.1 | GO:1904075 | regulation of trophectodermal cell proliferation(GO:1904073) positive regulation of trophectodermal cell proliferation(GO:1904075) |
| 0.0 | 1.0 | GO:0001893 | maternal placenta development(GO:0001893) |
| 0.0 | 0.8 | GO:0019228 | neuronal action potential(GO:0019228) |
| 0.0 | 0.3 | GO:0001682 | tRNA 5'-leader removal(GO:0001682) |
| 0.0 | 0.2 | GO:0061767 | positive regulation of transforming growth factor beta3 production(GO:0032916) negative regulation of lung blood pressure(GO:0061767) |
| 0.0 | 0.3 | GO:0033327 | Leydig cell differentiation(GO:0033327) |
| 0.0 | 0.5 | GO:0071294 | cellular response to zinc ion(GO:0071294) |
| 0.0 | 0.5 | GO:1903830 | magnesium ion transmembrane transport(GO:1903830) |
| 0.0 | 1.3 | GO:1901385 | regulation of voltage-gated calcium channel activity(GO:1901385) |
| 0.0 | 0.1 | GO:0098532 | histone H3-K27 trimethylation(GO:0098532) |
| 0.0 | 0.1 | GO:0061534 | gamma-aminobutyric acid secretion, neurotransmission(GO:0061534) |
| 0.0 | 0.8 | GO:0019054 | modulation by virus of host process(GO:0019054) |
| 0.0 | 0.2 | GO:0048478 | replication fork protection(GO:0048478) |
| 0.0 | 0.2 | GO:2000381 | negative regulation of mesoderm development(GO:2000381) |
| 0.0 | 0.1 | GO:1990168 | protein K27-linked deubiquitination(GO:1990167) protein K33-linked deubiquitination(GO:1990168) |
| 0.0 | 0.2 | GO:0070236 | negative regulation of activation-induced cell death of T cells(GO:0070236) |
| 0.0 | 0.6 | GO:0035584 | calcium-mediated signaling using intracellular calcium source(GO:0035584) |
| 0.0 | 0.1 | GO:0060151 | peroxisome localization(GO:0060151) microtubule-based peroxisome localization(GO:0060152) |
| 0.0 | 0.5 | GO:0090036 | regulation of protein kinase C signaling(GO:0090036) |
| 0.0 | 0.1 | GO:1990314 | cellular response to insulin-like growth factor stimulus(GO:1990314) |
| 0.0 | 0.1 | GO:0071651 | positive regulation of chemokine (C-C motif) ligand 5 production(GO:0071651) |
| 0.0 | 0.2 | GO:0015812 | gamma-aminobutyric acid transport(GO:0015812) |
| 0.0 | 0.1 | GO:0060836 | lymphatic endothelial cell differentiation(GO:0060836) |
| 0.0 | 0.6 | GO:0006783 | heme biosynthetic process(GO:0006783) |
| 0.0 | 0.3 | GO:0060576 | intestinal epithelial cell development(GO:0060576) |
| 0.0 | 0.4 | GO:0033622 | integrin activation(GO:0033622) |
| 0.0 | 0.1 | GO:0009236 | cobalamin biosynthetic process(GO:0009236) |
| 0.0 | 0.4 | GO:0034063 | stress granule assembly(GO:0034063) |
| 0.0 | 0.1 | GO:0061084 | regulation of protein refolding(GO:0061083) negative regulation of protein refolding(GO:0061084) |
| 0.0 | 0.3 | GO:0071468 | cellular response to acidic pH(GO:0071468) |
| 0.0 | 0.4 | GO:0030322 | stabilization of membrane potential(GO:0030322) |
| 0.0 | 0.2 | GO:0046940 | nucleoside monophosphate phosphorylation(GO:0046940) |
| 0.0 | 0.2 | GO:0035268 | protein mannosylation(GO:0035268) |
| 0.0 | 0.3 | GO:0016048 | detection of temperature stimulus(GO:0016048) |
| 0.0 | 0.1 | GO:0044407 | biofilm formation(GO:0042710) single-species biofilm formation(GO:0044010) single-species biofilm formation in or on host organism(GO:0044407) regulation of single-species biofilm formation(GO:1900190) negative regulation of single-species biofilm formation(GO:1900191) regulation of single-species biofilm formation in or on host organism(GO:1900228) negative regulation of single-species biofilm formation in or on host organism(GO:1900229) |
| 0.0 | 0.2 | GO:0060174 | limb bud formation(GO:0060174) |
| 0.0 | 0.2 | GO:0007253 | cytoplasmic sequestering of NF-kappaB(GO:0007253) |
| 0.0 | 0.1 | GO:0042819 | pyridoxine metabolic process(GO:0008614) pyridoxine biosynthetic process(GO:0008615) vitamin B6 biosynthetic process(GO:0042819) |
| 0.0 | 0.8 | GO:0051898 | negative regulation of protein kinase B signaling(GO:0051898) |
| 0.0 | 0.1 | GO:0018343 | protein farnesylation(GO:0018343) |
| 0.0 | 0.2 | GO:0016926 | protein desumoylation(GO:0016926) |
| 0.0 | 0.3 | GO:0045008 | depyrimidination(GO:0045008) |
| 0.0 | 1.1 | GO:0015701 | bicarbonate transport(GO:0015701) |
| 0.0 | 0.1 | GO:0017062 | respiratory chain complex III assembly(GO:0017062) mitochondrial respiratory chain complex III assembly(GO:0034551) |
| 0.0 | 0.5 | GO:0006099 | tricarboxylic acid cycle(GO:0006099) |
| 0.0 | 0.3 | GO:0060670 | branching involved in labyrinthine layer morphogenesis(GO:0060670) |
| 0.0 | 0.2 | GO:0021694 | cerebellar Purkinje cell layer formation(GO:0021694) cerebellar Purkinje cell differentiation(GO:0021702) |
| 0.0 | 0.1 | GO:0060136 | embryonic process involved in female pregnancy(GO:0060136) |
| 0.0 | 0.7 | GO:0050435 | beta-amyloid metabolic process(GO:0050435) |
| 0.0 | 0.1 | GO:0003096 | renal sodium ion transport(GO:0003096) renal sodium ion absorption(GO:0070294) |
| 0.0 | 0.1 | GO:1903588 | negative regulation of blood vessel endothelial cell proliferation involved in sprouting angiogenesis(GO:1903588) |
| 0.0 | 0.2 | GO:0035970 | peptidyl-threonine dephosphorylation(GO:0035970) |
| 0.0 | 0.2 | GO:0031936 | negative regulation of chromatin silencing(GO:0031936) |
| 0.0 | 0.1 | GO:0014038 | regulation of Schwann cell differentiation(GO:0014038) |
| 0.0 | 0.2 | GO:0030208 | dermatan sulfate biosynthetic process(GO:0030208) |
| 0.0 | 1.1 | GO:0042273 | ribosomal large subunit biogenesis(GO:0042273) |
| 0.0 | 0.2 | GO:0031293 | membrane protein intracellular domain proteolysis(GO:0031293) |
| 0.0 | 0.4 | GO:0097237 | cellular response to toxic substance(GO:0097237) |
| 0.0 | 0.2 | GO:0035493 | SNARE complex assembly(GO:0035493) |
| 0.0 | 0.2 | GO:0015074 | DNA integration(GO:0015074) |
| 0.0 | 0.8 | GO:0032781 | positive regulation of ATPase activity(GO:0032781) |
| 0.0 | 0.1 | GO:0006621 | protein retention in ER lumen(GO:0006621) maintenance of protein localization in endoplasmic reticulum(GO:0035437) |
Gene overrepresentation in cellular component category:
| Log-likelihood per target | Total log-likelihood | Term | Description |
|---|---|---|---|
| 0.3 | 0.9 | GO:0070195 | growth hormone receptor complex(GO:0070195) |
| 0.2 | 0.7 | GO:0070931 | Golgi-associated vesicle lumen(GO:0070931) |
| 0.2 | 0.7 | GO:0098855 | HCN channel complex(GO:0098855) |
| 0.2 | 2.3 | GO:0030314 | junctional membrane complex(GO:0030314) |
| 0.1 | 1.3 | GO:1990635 | proximal dendrite(GO:1990635) |
| 0.1 | 0.7 | GO:1990742 | microvesicle(GO:1990742) |
| 0.1 | 0.7 | GO:0071149 | TEAD-1-YAP complex(GO:0071148) TEAD-2-YAP complex(GO:0071149) |
| 0.1 | 0.4 | GO:0043259 | laminin-1 complex(GO:0005606) laminin-10 complex(GO:0043259) laminin-11 complex(GO:0043260) |
| 0.1 | 0.6 | GO:0005899 | insulin receptor complex(GO:0005899) |
| 0.1 | 0.5 | GO:0097629 | extrinsic component of omegasome membrane(GO:0097629) |
| 0.1 | 2.8 | GO:0001518 | voltage-gated sodium channel complex(GO:0001518) |
| 0.1 | 0.2 | GO:0034666 | integrin alpha2-beta1 complex(GO:0034666) |
| 0.1 | 0.9 | GO:0002116 | semaphorin receptor complex(GO:0002116) |
| 0.1 | 0.8 | GO:0097443 | sorting endosome(GO:0097443) |
| 0.1 | 0.8 | GO:0005826 | actomyosin contractile ring(GO:0005826) |
| 0.1 | 0.5 | GO:0070032 | synaptobrevin 2-SNAP-25-syntaxin-1a-complexin I complex(GO:0070032) |
| 0.1 | 0.7 | GO:0044305 | calyx of Held(GO:0044305) |
| 0.1 | 0.3 | GO:1990425 | ryanodine receptor complex(GO:1990425) |
| 0.1 | 0.4 | GO:0044308 | axonal spine(GO:0044308) |
| 0.1 | 0.4 | GO:0034680 | integrin alpha10-beta1 complex(GO:0034680) |
| 0.1 | 0.5 | GO:1990452 | Parkin-FBXW7-Cul1 ubiquitin ligase complex(GO:1990452) |
| 0.1 | 1.5 | GO:1990454 | L-type voltage-gated calcium channel complex(GO:1990454) |
| 0.1 | 0.8 | GO:0042587 | glycogen granule(GO:0042587) |
| 0.1 | 0.4 | GO:0048787 | presynaptic active zone membrane(GO:0048787) |
| 0.0 | 0.1 | GO:0034657 | GID complex(GO:0034657) |
| 0.0 | 0.2 | GO:0043614 | multi-eIF complex(GO:0043614) |
| 0.0 | 0.7 | GO:0031462 | Cul2-RING ubiquitin ligase complex(GO:0031462) |
| 0.0 | 0.3 | GO:1990131 | Gtr1-Gtr2 GTPase complex(GO:1990131) |
| 0.0 | 0.3 | GO:0002081 | inner acrosomal membrane(GO:0002079) outer acrosomal membrane(GO:0002081) |
| 0.0 | 0.4 | GO:0000235 | astral microtubule(GO:0000235) aster(GO:0005818) |
| 0.0 | 0.8 | GO:0061700 | GATOR2 complex(GO:0061700) |
| 0.0 | 0.8 | GO:0035253 | ciliary rootlet(GO:0035253) |
| 0.0 | 0.5 | GO:0030981 | cortical microtubule cytoskeleton(GO:0030981) |
| 0.0 | 0.2 | GO:0032449 | CBM complex(GO:0032449) |
| 0.0 | 1.0 | GO:0031045 | dense core granule(GO:0031045) |
| 0.0 | 0.3 | GO:1990682 | CSF1-CSF1R complex(GO:1990682) |
| 0.0 | 0.7 | GO:0031588 | nucleotide-activated protein kinase complex(GO:0031588) |
| 0.0 | 0.5 | GO:0044233 | ER-mitochondrion membrane contact site(GO:0044233) |
| 0.0 | 1.1 | GO:0030687 | preribosome, large subunit precursor(GO:0030687) |
| 0.0 | 0.7 | GO:0005890 | sodium:potassium-exchanging ATPase complex(GO:0005890) |
| 0.0 | 2.6 | GO:0043198 | dendritic shaft(GO:0043198) |
| 0.0 | 0.2 | GO:0002177 | manchette(GO:0002177) |
| 0.0 | 0.4 | GO:0098839 | postsynaptic density membrane(GO:0098839) |
| 0.0 | 0.1 | GO:0005953 | CAAX-protein geranylgeranyltransferase complex(GO:0005953) |
| 0.0 | 0.4 | GO:1990712 | HFE-transferrin receptor complex(GO:1990712) |
| 0.0 | 0.2 | GO:0033018 | sarcoplasmic reticulum lumen(GO:0033018) |
| 0.0 | 0.3 | GO:0030681 | multimeric ribonuclease P complex(GO:0030681) |
| 0.0 | 1.7 | GO:0033017 | sarcoplasmic reticulum membrane(GO:0033017) |
| 0.0 | 0.8 | GO:0005868 | cytoplasmic dynein complex(GO:0005868) |
| 0.0 | 2.3 | GO:0030669 | clathrin-coated endocytic vesicle membrane(GO:0030669) |
| 0.0 | 0.5 | GO:0000815 | ESCRT III complex(GO:0000815) |
| 0.0 | 1.2 | GO:0031258 | lamellipodium membrane(GO:0031258) |
| 0.0 | 0.6 | GO:0070971 | endoplasmic reticulum exit site(GO:0070971) |
| 0.0 | 0.1 | GO:0030132 | clathrin coat of coated pit(GO:0030132) |
| 0.0 | 0.7 | GO:0032839 | dendrite cytoplasm(GO:0032839) |
| 0.0 | 0.1 | GO:0071942 | XPC complex(GO:0071942) |
| 0.0 | 0.2 | GO:0097136 | Bcl-2 family protein complex(GO:0097136) |
| 0.0 | 0.7 | GO:0030877 | beta-catenin destruction complex(GO:0030877) |
| 0.0 | 0.4 | GO:0031089 | platelet dense granule lumen(GO:0031089) |
| 0.0 | 0.8 | GO:0030140 | trans-Golgi network transport vesicle(GO:0030140) |
| 0.0 | 0.1 | GO:0016939 | kinesin II complex(GO:0016939) |
| 0.0 | 1.2 | GO:0005891 | voltage-gated calcium channel complex(GO:0005891) |
| 0.0 | 2.2 | GO:0005901 | caveola(GO:0005901) |
| 0.0 | 1.2 | GO:0008180 | COP9 signalosome(GO:0008180) |
| 0.0 | 0.7 | GO:0030118 | clathrin coat(GO:0030118) |
| 0.0 | 0.6 | GO:0010369 | chromocenter(GO:0010369) |
| 0.0 | 0.1 | GO:0097125 | cyclin B1-CDK1 complex(GO:0097125) |
| 0.0 | 1.2 | GO:0019005 | SCF ubiquitin ligase complex(GO:0019005) |
| 0.0 | 0.3 | GO:0008074 | guanylate cyclase complex, soluble(GO:0008074) |
| 0.0 | 1.4 | GO:0005871 | kinesin complex(GO:0005871) |
| 0.0 | 0.5 | GO:0031306 | intrinsic component of mitochondrial outer membrane(GO:0031306) |
| 0.0 | 0.5 | GO:0071782 | endoplasmic reticulum tubular network(GO:0071782) |
| 0.0 | 0.1 | GO:0033596 | TSC1-TSC2 complex(GO:0033596) |
| 0.0 | 1.9 | GO:0031093 | platelet alpha granule lumen(GO:0031093) |
| 0.0 | 0.6 | GO:0032809 | neuronal cell body membrane(GO:0032809) cell body membrane(GO:0044298) |
| 0.0 | 2.2 | GO:0042641 | actomyosin(GO:0042641) |
| 0.0 | 0.2 | GO:0071144 | SMAD2-SMAD3 protein complex(GO:0071144) |
| 0.0 | 0.2 | GO:0031298 | replication fork protection complex(GO:0031298) |
| 0.0 | 0.2 | GO:0030478 | actin cap(GO:0030478) |
| 0.0 | 1.6 | GO:0016328 | lateral plasma membrane(GO:0016328) |
| 0.0 | 0.1 | GO:0000835 | ER ubiquitin ligase complex(GO:0000835) Hrd1p ubiquitin ligase complex(GO:0000836) |
| 0.0 | 2.8 | GO:0001650 | fibrillar center(GO:0001650) |
| 0.0 | 2.1 | GO:0032587 | ruffle membrane(GO:0032587) |
| 0.0 | 0.5 | GO:0032391 | photoreceptor connecting cilium(GO:0032391) |
| 0.0 | 0.1 | GO:0045252 | oxoglutarate dehydrogenase complex(GO:0045252) |
| 0.0 | 0.4 | GO:0005680 | anaphase-promoting complex(GO:0005680) |
| 0.0 | 0.1 | GO:0031313 | extrinsic component of endosome membrane(GO:0031313) |
| 0.0 | 0.3 | GO:0016327 | apicolateral plasma membrane(GO:0016327) |
Gene overrepresentation in molecular function category:
| Log-likelihood per target | Total log-likelihood | Term | Description |
|---|---|---|---|
| 0.5 | 1.5 | GO:0086057 | voltage-gated calcium channel activity involved in bundle of His cell action potential(GO:0086057) |
| 0.5 | 1.5 | GO:0033878 | hormone-sensitive lipase activity(GO:0033878) |
| 0.4 | 2.3 | GO:0042392 | sphingosine-1-phosphate phosphatase activity(GO:0042392) |
| 0.4 | 1.8 | GO:0008401 | retinoic acid 4-hydroxylase activity(GO:0008401) |
| 0.3 | 1.1 | GO:0030379 | neurotensin receptor activity, non-G-protein coupled(GO:0030379) |
| 0.3 | 0.8 | GO:0031737 | CX3C chemokine receptor binding(GO:0031737) |
| 0.3 | 0.8 | GO:0016419 | [acyl-carrier-protein] S-malonyltransferase activity(GO:0004314) S-malonyltransferase activity(GO:0016419) malonyltransferase activity(GO:0016420) |
| 0.3 | 0.8 | GO:2001069 | glycogen binding(GO:2001069) |
| 0.2 | 0.9 | GO:0005292 | high-affinity basic amino acid transmembrane transporter activity(GO:0005287) high-affinity arginine transmembrane transporter activity(GO:0005289) high-affinity lysine transmembrane transporter activity(GO:0005292) |
| 0.2 | 2.0 | GO:0015319 | sodium:inorganic phosphate symporter activity(GO:0015319) |
| 0.2 | 0.7 | GO:0008511 | sodium:potassium:chloride symporter activity(GO:0008511) |
| 0.2 | 0.9 | GO:0072591 | citrate-L-glutamate ligase activity(GO:0072591) |
| 0.2 | 1.3 | GO:0004740 | pyruvate dehydrogenase (acetyl-transferring) kinase activity(GO:0004740) |
| 0.2 | 1.7 | GO:0043426 | MRF binding(GO:0043426) |
| 0.2 | 0.7 | GO:0008798 | beta-aspartyl-peptidase activity(GO:0008798) |
| 0.2 | 0.9 | GO:0016524 | latrotoxin receptor activity(GO:0016524) |
| 0.1 | 1.5 | GO:0086006 | voltage-gated sodium channel activity involved in cardiac muscle cell action potential(GO:0086006) |
| 0.1 | 1.2 | GO:0032184 | SUMO polymer binding(GO:0032184) |
| 0.1 | 0.7 | GO:0005173 | stem cell factor receptor binding(GO:0005173) |
| 0.1 | 0.9 | GO:0016802 | adenosylhomocysteinase activity(GO:0004013) trialkylsulfonium hydrolase activity(GO:0016802) |
| 0.1 | 0.5 | GO:0005483 | soluble NSF attachment protein activity(GO:0005483) |
| 0.1 | 0.5 | GO:0047888 | fatty acid peroxidase activity(GO:0047888) |
| 0.1 | 0.6 | GO:0043183 | vascular endothelial growth factor receptor 1 binding(GO:0043183) |
| 0.1 | 1.9 | GO:0052658 | inositol-1,4,5-trisphosphate 5-phosphatase activity(GO:0052658) |
| 0.1 | 0.3 | GO:0030943 | mitochondrion targeting sequence binding(GO:0030943) |
| 0.1 | 0.5 | GO:0005010 | insulin-like growth factor-activated receptor activity(GO:0005010) |
| 0.1 | 0.7 | GO:0004598 | peptidylglycine monooxygenase activity(GO:0004504) peptidylamidoglycolate lyase activity(GO:0004598) |
| 0.1 | 0.5 | GO:0050816 | phosphothreonine binding(GO:0050816) |
| 0.1 | 0.3 | GO:0031071 | cysteine desulfurase activity(GO:0031071) |
| 0.1 | 0.4 | GO:0004449 | isocitrate dehydrogenase (NAD+) activity(GO:0004449) |
| 0.1 | 0.3 | GO:0008193 | tRNA guanylyltransferase activity(GO:0008193) |
| 0.1 | 1.9 | GO:0010314 | phosphatidylinositol-5-phosphate binding(GO:0010314) |
| 0.1 | 0.7 | GO:0005222 | intracellular cAMP activated cation channel activity(GO:0005222) |
| 0.1 | 0.3 | GO:0004615 | phosphomannomutase activity(GO:0004615) |
| 0.1 | 0.5 | GO:0004741 | [pyruvate dehydrogenase (lipoamide)] phosphatase activity(GO:0004741) |
| 0.1 | 0.2 | GO:0034057 | RNA strand-exchange activity(GO:0034057) |
| 0.1 | 0.7 | GO:0098821 | BMP receptor activity(GO:0098821) |
| 0.1 | 0.6 | GO:0004517 | nitric-oxide synthase activity(GO:0004517) |
| 0.1 | 0.3 | GO:0004307 | ethanolaminephosphotransferase activity(GO:0004307) |
| 0.1 | 0.5 | GO:0043515 | kinetochore binding(GO:0043515) |
| 0.1 | 1.5 | GO:0004716 | receptor signaling protein tyrosine kinase activity(GO:0004716) |
| 0.1 | 1.0 | GO:0046975 | histone methyltransferase activity (H3-K36 specific)(GO:0046975) |
| 0.1 | 0.2 | GO:0002094 | polyprenyltransferase activity(GO:0002094) |
| 0.1 | 0.4 | GO:0016941 | natriuretic peptide receptor activity(GO:0016941) |
| 0.1 | 0.6 | GO:0098639 | collagen binding involved in cell-matrix adhesion(GO:0098639) |
| 0.1 | 0.3 | GO:0015181 | arginine transmembrane transporter activity(GO:0015181) |
| 0.1 | 2.8 | GO:0070064 | proline-rich region binding(GO:0070064) |
| 0.1 | 0.6 | GO:0005052 | peroxisome matrix targeting signal-1 binding(GO:0005052) |
| 0.1 | 1.9 | GO:0005523 | tropomyosin binding(GO:0005523) |
| 0.1 | 0.5 | GO:0071535 | RING-like zinc finger domain binding(GO:0071535) |
| 0.1 | 0.9 | GO:0000182 | rDNA binding(GO:0000182) |
| 0.1 | 0.3 | GO:0046899 | nucleoside triphosphate adenylate kinase activity(GO:0046899) |
| 0.1 | 0.7 | GO:0051920 | peroxiredoxin activity(GO:0051920) |
| 0.1 | 0.3 | GO:0008113 | peptide-methionine (S)-S-oxide reductase activity(GO:0008113) |
| 0.0 | 0.4 | GO:0099529 | neurotransmitter receptor activity involved in regulation of postsynaptic membrane potential(GO:0099529) transmitter-gated ion channel activity involved in regulation of postsynaptic membrane potential(GO:1904315) |
| 0.0 | 0.5 | GO:0050682 | AF-2 domain binding(GO:0050682) |
| 0.0 | 1.4 | GO:0008510 | sodium:bicarbonate symporter activity(GO:0008510) |
| 0.0 | 1.3 | GO:0042813 | Wnt-activated receptor activity(GO:0042813) |
| 0.0 | 1.3 | GO:0005247 | voltage-gated chloride channel activity(GO:0005247) |
| 0.0 | 0.7 | GO:0015386 | potassium:proton antiporter activity(GO:0015386) |
| 0.0 | 0.1 | GO:1904854 | proteasome core complex binding(GO:1904854) |
| 0.0 | 0.2 | GO:1904455 | ubiquitin-specific protease activity involved in negative regulation of ERAD pathway(GO:1904455) |
| 0.0 | 0.1 | GO:0031871 | proteinase activated receptor binding(GO:0031871) |
| 0.0 | 1.1 | GO:0004862 | cAMP-dependent protein kinase inhibitor activity(GO:0004862) |
| 0.0 | 1.2 | GO:1905030 | voltage-gated sodium channel activity(GO:0005248) voltage-gated ion channel activity involved in regulation of postsynaptic membrane potential(GO:1905030) |
| 0.0 | 0.2 | GO:0047757 | chondroitin-glucuronate 5-epimerase activity(GO:0047757) |
| 0.0 | 0.6 | GO:0009922 | fatty acid elongase activity(GO:0009922) 3-oxo-arachidoyl-CoA synthase activity(GO:0102336) 3-oxo-cerotoyl-CoA synthase activity(GO:0102337) 3-oxo-lignoceronyl-CoA synthase activity(GO:0102338) |
| 0.0 | 1.0 | GO:0031957 | very long-chain fatty acid-CoA ligase activity(GO:0031957) |
| 0.0 | 1.2 | GO:0008499 | UDP-galactose:beta-N-acetylglucosamine beta-1,3-galactosyltransferase activity(GO:0008499) |
| 0.0 | 0.6 | GO:0045504 | dynein heavy chain binding(GO:0045504) |
| 0.0 | 0.2 | GO:0070905 | serine binding(GO:0070905) |
| 0.0 | 1.7 | GO:0015269 | calcium-activated potassium channel activity(GO:0015269) |
| 0.0 | 0.9 | GO:0017128 | phospholipid scramblase activity(GO:0017128) |
| 0.0 | 0.6 | GO:0004679 | AMP-activated protein kinase activity(GO:0004679) |
| 0.0 | 0.8 | GO:0001206 | transcriptional repressor activity, RNA polymerase II distal enhancer sequence-specific binding(GO:0001206) |
| 0.0 | 0.4 | GO:0000774 | adenyl-nucleotide exchange factor activity(GO:0000774) |
| 0.0 | 1.0 | GO:0050811 | GABA receptor binding(GO:0050811) |
| 0.0 | 2.4 | GO:0005245 | voltage-gated calcium channel activity(GO:0005245) |
| 0.0 | 0.3 | GO:0005157 | macrophage colony-stimulating factor receptor binding(GO:0005157) |
| 0.0 | 0.6 | GO:1990459 | transferrin receptor binding(GO:1990459) |
| 0.0 | 0.2 | GO:0070137 | ubiquitin-like protein-specific endopeptidase activity(GO:0070137) SUMO-specific endopeptidase activity(GO:0070139) |
| 0.0 | 0.9 | GO:0008574 | ATP-dependent microtubule motor activity, plus-end-directed(GO:0008574) |
| 0.0 | 0.4 | GO:0003997 | acyl-CoA oxidase activity(GO:0003997) |
| 0.0 | 1.8 | GO:0017075 | syntaxin-1 binding(GO:0017075) |
| 0.0 | 1.2 | GO:0005001 | transmembrane receptor protein tyrosine phosphatase activity(GO:0005001) transmembrane receptor protein phosphatase activity(GO:0019198) |
| 0.0 | 0.1 | GO:0043273 | CTPase activity(GO:0043273) |
| 0.0 | 0.1 | GO:0097363 | protein O-GlcNAc transferase activity(GO:0097363) |
| 0.0 | 0.7 | GO:0070402 | NADPH binding(GO:0070402) |
| 0.0 | 1.5 | GO:0051428 | peptide hormone receptor binding(GO:0051428) |
| 0.0 | 0.3 | GO:0043023 | ribosomal large subunit binding(GO:0043023) |
| 0.0 | 0.2 | GO:0016807 | cysteine-type carboxypeptidase activity(GO:0016807) cysteine-type exopeptidase activity(GO:0070004) |
| 0.0 | 0.1 | GO:0004662 | CAAX-protein geranylgeranyltransferase activity(GO:0004662) |
| 0.0 | 0.2 | GO:0016833 | oxo-acid-lyase activity(GO:0016833) |
| 0.0 | 0.2 | GO:0042030 | ATPase inhibitor activity(GO:0042030) |
| 0.0 | 0.1 | GO:0016309 | 1-phosphatidylinositol-5-phosphate 4-kinase activity(GO:0016309) |
| 0.0 | 0.3 | GO:0097506 | uracil DNA N-glycosylase activity(GO:0004844) deaminated base DNA N-glycosylase activity(GO:0097506) |
| 0.0 | 0.3 | GO:0004526 | ribonuclease P activity(GO:0004526) |
| 0.0 | 0.2 | GO:0005332 | gamma-aminobutyric acid:sodium symporter activity(GO:0005332) |
| 0.0 | 0.9 | GO:0008239 | dipeptidyl-peptidase activity(GO:0008239) |
| 0.0 | 0.2 | GO:0004594 | pantothenate kinase activity(GO:0004594) |
| 0.0 | 0.4 | GO:0005078 | MAP-kinase scaffold activity(GO:0005078) |
| 0.0 | 0.3 | GO:0005227 | calcium activated cation channel activity(GO:0005227) |
| 0.0 | 0.3 | GO:0047499 | calcium-independent phospholipase A2 activity(GO:0047499) |
| 0.0 | 0.2 | GO:0035242 | protein-arginine omega-N asymmetric methyltransferase activity(GO:0035242) |
| 0.0 | 0.7 | GO:0044548 | S100 protein binding(GO:0044548) |
| 0.0 | 0.2 | GO:0031962 | mineralocorticoid receptor binding(GO:0031962) |
| 0.0 | 0.6 | GO:0005095 | GTPase inhibitor activity(GO:0005095) |
| 0.0 | 0.1 | GO:0017002 | activin-activated receptor activity(GO:0017002) |
| 0.0 | 0.5 | GO:0015095 | magnesium ion transmembrane transporter activity(GO:0015095) |
| 0.0 | 0.4 | GO:0008179 | adenylate cyclase binding(GO:0008179) |
| 0.0 | 0.8 | GO:0004435 | phosphatidylinositol phospholipase C activity(GO:0004435) |
| 0.0 | 1.2 | GO:0050699 | WW domain binding(GO:0050699) |
| 0.0 | 0.8 | GO:0001671 | ATPase activator activity(GO:0001671) |
| 0.0 | 0.4 | GO:0034452 | dynactin binding(GO:0034452) |
| 0.0 | 0.5 | GO:0001608 | G-protein coupled nucleotide receptor activity(GO:0001608) G-protein coupled purinergic nucleotide receptor activity(GO:0045028) |
| 0.0 | 0.2 | GO:0010859 | calcium-dependent cysteine-type endopeptidase inhibitor activity(GO:0010859) |
| 0.0 | 0.1 | GO:0030628 | pre-mRNA 3'-splice site binding(GO:0030628) |
| 0.0 | 0.2 | GO:0008142 | oxysterol binding(GO:0008142) |
| 0.0 | 2.3 | GO:0008307 | structural constituent of muscle(GO:0008307) |
| 0.0 | 0.9 | GO:0051721 | protein phosphatase 2A binding(GO:0051721) |
| 0.0 | 0.7 | GO:0008139 | nuclear localization sequence binding(GO:0008139) |
| 0.0 | 0.4 | GO:0022841 | potassium ion leak channel activity(GO:0022841) |
| 0.0 | 0.1 | GO:0061628 | H3K27me3 modified histone binding(GO:0061628) |
| 0.0 | 0.5 | GO:0005251 | delayed rectifier potassium channel activity(GO:0005251) |
| 0.0 | 0.5 | GO:0000030 | mannosyltransferase activity(GO:0000030) |
| 0.0 | 0.0 | GO:0016532 | copper-exporting ATPase activity(GO:0004008) phosphoglycerate kinase activity(GO:0004618) superoxide dismutase copper chaperone activity(GO:0016532) copper-transporting ATPase activity(GO:0043682) |
| 0.0 | 0.9 | GO:0001786 | phosphatidylserine binding(GO:0001786) |
| 0.0 | 0.2 | GO:0097157 | pre-mRNA intronic binding(GO:0097157) |
| 0.0 | 0.2 | GO:0051400 | BH domain binding(GO:0051400) |
| 0.0 | 0.3 | GO:0070411 | I-SMAD binding(GO:0070411) |
| 0.0 | 1.7 | GO:0001190 | transcriptional activator activity, RNA polymerase II transcription factor binding(GO:0001190) transcriptional repressor activity, RNA polymerase II activating transcription factor binding(GO:0098811) |
| 0.0 | 0.1 | GO:0051425 | PTB domain binding(GO:0051425) |
| 0.0 | 1.7 | GO:0032947 | protein complex scaffold(GO:0032947) |
| 0.0 | 0.1 | GO:0022821 | potassium ion antiporter activity(GO:0022821) |
| 0.0 | 1.2 | GO:0003777 | microtubule motor activity(GO:0003777) |
| 0.0 | 0.1 | GO:0004591 | oxoglutarate dehydrogenase (succinyl-transferring) activity(GO:0004591) |
| 0.0 | 0.2 | GO:0070016 | armadillo repeat domain binding(GO:0070016) |
| 0.0 | 0.1 | GO:0003828 | alpha-N-acetylneuraminate alpha-2,8-sialyltransferase activity(GO:0003828) |
| 0.0 | 0.2 | GO:0004089 | carbonate dehydratase activity(GO:0004089) |
| 0.0 | 0.3 | GO:0030215 | semaphorin receptor binding(GO:0030215) |
| 0.0 | 0.4 | GO:0050750 | low-density lipoprotein particle receptor binding(GO:0050750) |
| 0.0 | 0.4 | GO:0004708 | MAP kinase kinase activity(GO:0004708) |
| 0.0 | 0.5 | GO:0042056 | chemoattractant activity(GO:0042056) |
Gene overrepresentation in curated gene sets: canonical pathways category:
| Log-likelihood per target | Total log-likelihood | Term | Description |
|---|---|---|---|
| 0.1 | 0.3 | PID ER NONGENOMIC PATHWAY | Plasma membrane estrogen receptor signaling |
| 0.1 | 1.2 | PID VEGF VEGFR PATHWAY | VEGF and VEGFR signaling network |
| 0.0 | 0.2 | PID WNT NONCANONICAL PATHWAY | Noncanonical Wnt signaling pathway |
| 0.0 | 0.2 | PID IL2 PI3K PATHWAY | IL2 signaling events mediated by PI3K |
| 0.0 | 0.3 | PID PI3KCI AKT PATHWAY | Class I PI3K signaling events mediated by Akt |
| 0.0 | 0.8 | PID P38 GAMMA DELTA PATHWAY | Signaling mediated by p38-gamma and p38-delta |
| 0.0 | 0.3 | PID P38 MK2 PATHWAY | p38 signaling mediated by MAPKAP kinases |
| 0.0 | 1.4 | PID MTOR 4PATHWAY | mTOR signaling pathway |
| 0.0 | 0.8 | PID ECADHERIN KERATINOCYTE PATHWAY | E-cadherin signaling in keratinocytes |
| 0.0 | 0.4 | PID INTEGRIN4 PATHWAY | Alpha6 beta4 integrin-ligand interactions |
| 0.0 | 1.1 | NABA PROTEOGLYCANS | Genes encoding proteoglycans |
| 0.0 | 0.9 | PID GLYPICAN 1PATHWAY | Glypican 1 network |
| 0.0 | 1.6 | PID DELTA NP63 PATHWAY | Validated transcriptional targets of deltaNp63 isoforms |
| 0.0 | 2.4 | PID HIF1 TFPATHWAY | HIF-1-alpha transcription factor network |
| 0.0 | 2.1 | PID P75 NTR PATHWAY | p75(NTR)-mediated signaling |
| 0.0 | 1.3 | PID ECADHERIN STABILIZATION PATHWAY | Stabilization and expansion of the E-cadherin adherens junction |
| 0.0 | 0.8 | PID INSULIN PATHWAY | Insulin Pathway |
| 0.0 | 1.6 | PID ERBB1 INTERNALIZATION PATHWAY | Internalization of ErbB1 |
| 0.0 | 0.6 | PID INTEGRIN CS PATHWAY | Integrin family cell surface interactions |
| 0.0 | 2.8 | PID P53 DOWNSTREAM PATHWAY | Direct p53 effectors |
| 0.0 | 1.2 | ST FAS SIGNALING PATHWAY | Fas Signaling Pathway |
| 0.0 | 0.3 | PID LPA4 PATHWAY | LPA4-mediated signaling events |
| 0.0 | 0.3 | PID TOLL ENDOGENOUS PATHWAY | Endogenous TLR signaling |
| 0.0 | 0.5 | PID PI3K PLC TRK PATHWAY | Trk receptor signaling mediated by PI3K and PLC-gamma |
| 0.0 | 0.2 | PID AVB3 INTEGRIN PATHWAY | Integrins in angiogenesis |
| 0.0 | 0.1 | PID HIF1A PATHWAY | Hypoxic and oxygen homeostasis regulation of HIF-1-alpha |
| 0.0 | 0.6 | ST WNT BETA CATENIN PATHWAY | Wnt/beta-catenin Pathway |
| 0.0 | 0.2 | PID ERB GENOMIC PATHWAY | Validated nuclear estrogen receptor beta network |
| 0.0 | 0.4 | PID HDAC CLASSIII PATHWAY | Signaling events mediated by HDAC Class III |
Gene overrepresentation in curated gene sets: REACTOME pathways category:
| Log-likelihood per target | Total log-likelihood | Term | Description |
|---|---|---|---|
| 0.1 | 1.8 | REACTOME REGULATION OF PYRUVATE DEHYDROGENASE PDH COMPLEX | Genes involved in Regulation of pyruvate dehydrogenase (PDH) complex |
| 0.1 | 2.9 | REACTOME SIGNALING BY HIPPO | Genes involved in Signaling by Hippo |
| 0.1 | 1.2 | REACTOME VEGF LIGAND RECEPTOR INTERACTIONS | Genes involved in VEGF ligand-receptor interactions |
| 0.1 | 1.1 | REACTOME SIGNALING BY ACTIVATED POINT MUTANTS OF FGFR1 | Genes involved in Signaling by activated point mutants of FGFR1 |
| 0.0 | 0.5 | REACTOME SIGNALING BY EGFR IN CANCER | Genes involved in Signaling by EGFR in Cancer |
| 0.0 | 0.9 | REACTOME VITAMIN B5 PANTOTHENATE METABOLISM | Genes involved in Vitamin B5 (pantothenate) metabolism |
| 0.0 | 1.4 | REACTOME RETROGRADE NEUROTROPHIN SIGNALLING | Genes involved in Retrograde neurotrophin signalling |
| 0.0 | 1.0 | REACTOME CLASS C 3 METABOTROPIC GLUTAMATE PHEROMONE RECEPTORS | Genes involved in Class C/3 (Metabotropic glutamate/pheromone receptors) |
| 0.0 | 2.9 | REACTOME VOLTAGE GATED POTASSIUM CHANNELS | Genes involved in Voltage gated Potassium channels |
| 0.0 | 1.5 | REACTOME HORMONE SENSITIVE LIPASE HSL MEDIATED TRIACYLGLYCEROL HYDROLYSIS | Genes involved in Hormone-sensitive lipase (HSL)-mediated triacylglycerol hydrolysis |
| 0.0 | 1.2 | REACTOME PROLACTIN RECEPTOR SIGNALING | Genes involved in Prolactin receptor signaling |
| 0.0 | 0.9 | REACTOME NOREPINEPHRINE NEUROTRANSMITTER RELEASE CYCLE | Genes involved in Norepinephrine Neurotransmitter Release Cycle |
| 0.0 | 0.7 | REACTOME REGULATION OF RHEB GTPASE ACTIVITY BY AMPK | Genes involved in Regulation of Rheb GTPase activity by AMPK |
| 0.0 | 0.4 | REACTOME UNBLOCKING OF NMDA RECEPTOR GLUTAMATE BINDING AND ACTIVATION | Genes involved in Unblocking of NMDA receptor, glutamate binding and activation |
| 0.0 | 5.8 | REACTOME TRANSPORT OF INORGANIC CATIONS ANIONS AND AMINO ACIDS OLIGOPEPTIDES | Genes involved in Transport of inorganic cations/anions and amino acids/oligopeptides |
| 0.0 | 0.6 | REACTOME SOS MEDIATED SIGNALLING | Genes involved in SOS-mediated signalling |
| 0.0 | 0.9 | REACTOME ENDOSOMAL SORTING COMPLEX REQUIRED FOR TRANSPORT ESCRT | Genes involved in Endosomal Sorting Complex Required For Transport (ESCRT) |
| 0.0 | 1.8 | REACTOME CYTOCHROME P450 ARRANGED BY SUBSTRATE TYPE | Genes involved in Cytochrome P450 - arranged by substrate type |
| 0.0 | 1.3 | REACTOME INTERACTION BETWEEN L1 AND ANKYRINS | Genes involved in Interaction between L1 and Ankyrins |
| 0.0 | 0.3 | REACTOME IRAK2 MEDIATED ACTIVATION OF TAK1 COMPLEX UPON TLR7 8 OR 9 STIMULATION | Genes involved in IRAK2 mediated activation of TAK1 complex upon TLR7/8 or 9 stimulation |
| 0.0 | 0.4 | REACTOME REGULATION OF AMPK ACTIVITY VIA LKB1 | Genes involved in Regulation of AMPK activity via LKB1 |
| 0.0 | 0.3 | REACTOME APOPTOSIS INDUCED DNA FRAGMENTATION | Genes involved in Apoptosis induced DNA fragmentation |
| 0.0 | 0.5 | REACTOME P2Y RECEPTORS | Genes involved in P2Y receptors |
| 0.0 | 0.4 | REACTOME ALPHA LINOLENIC ACID ALA METABOLISM | Genes involved in alpha-linolenic acid (ALA) metabolism |
| 0.0 | 0.5 | REACTOME ACTIVATED TAK1 MEDIATES P38 MAPK ACTIVATION | Genes involved in activated TAK1 mediates p38 MAPK activation |
| 0.0 | 0.6 | REACTOME ENOS ACTIVATION AND REGULATION | Genes involved in eNOS activation and regulation |
| 0.0 | 0.3 | REACTOME SYNTHESIS OF SUBSTRATES IN N GLYCAN BIOSYTHESIS | Genes involved in Synthesis of substrates in N-glycan biosythesis |
| 0.0 | 0.3 | REACTOME ADENYLATE CYCLASE ACTIVATING PATHWAY | Genes involved in Adenylate cyclase activating pathway |
| 0.0 | 0.7 | REACTOME SYNTHESIS OF VERY LONG CHAIN FATTY ACYL COAS | Genes involved in Synthesis of very long-chain fatty acyl-CoAs |
| 0.0 | 1.1 | REACTOME BMAL1 CLOCK NPAS2 ACTIVATES CIRCADIAN EXPRESSION | Genes involved in BMAL1:CLOCK/NPAS2 Activates Circadian Expression |
| 0.0 | 1.5 | REACTOME LOSS OF NLP FROM MITOTIC CENTROSOMES | Genes involved in Loss of Nlp from mitotic centrosomes |
| 0.0 | 0.2 | REACTOME APOBEC3G MEDIATED RESISTANCE TO HIV1 INFECTION | Genes involved in APOBEC3G mediated resistance to HIV-1 infection |
| 0.0 | 1.2 | REACTOME TRAFFICKING OF AMPA RECEPTORS | Genes involved in Trafficking of AMPA receptors |
| 0.0 | 0.6 | REACTOME SIGNALING BY NODAL | Genes involved in Signaling by NODAL |
| 0.0 | 0.4 | REACTOME CITRIC ACID CYCLE TCA CYCLE | Genes involved in Citric acid cycle (TCA cycle) |
| 0.0 | 0.4 | REACTOME REGULATION OF KIT SIGNALING | Genes involved in Regulation of KIT signaling |
| 0.0 | 0.2 | REACTOME NA CL DEPENDENT NEUROTRANSMITTER TRANSPORTERS | Genes involved in Na+/Cl- dependent neurotransmitter transporters |
| 0.0 | 0.4 | REACTOME PHOSPHORYLATION OF THE APC C | Genes involved in Phosphorylation of the APC/C |
| 0.0 | 0.6 | REACTOME METAL ION SLC TRANSPORTERS | Genes involved in Metal ion SLC transporters |
| 0.0 | 1.2 | REACTOME NCAM1 INTERACTIONS | Genes involved in NCAM1 interactions |
| 0.0 | 0.2 | REACTOME PLATELET ADHESION TO EXPOSED COLLAGEN | Genes involved in Platelet Adhesion to exposed collagen |
| 0.0 | 0.2 | REACTOME MTORC1 MEDIATED SIGNALLING | Genes involved in mTORC1-mediated signalling |
| 0.0 | 0.3 | REACTOME CHYLOMICRON MEDIATED LIPID TRANSPORT | Genes involved in Chylomicron-mediated lipid transport |
| 0.0 | 0.4 | REACTOME CELL EXTRACELLULAR MATRIX INTERACTIONS | Genes involved in Cell-extracellular matrix interactions |
| 0.0 | 0.2 | REACTOME PROTEOLYTIC CLEAVAGE OF SNARE COMPLEX PROTEINS | Genes involved in Proteolytic cleavage of SNARE complex proteins |
| 0.0 | 0.8 | REACTOME GOLGI ASSOCIATED VESICLE BIOGENESIS | Genes involved in Golgi Associated Vesicle Biogenesis |
| 0.0 | 0.5 | REACTOME GENERATION OF SECOND MESSENGER MOLECULES | Genes involved in Generation of second messenger molecules |