Project
Illumina Body Map 2 (GSE30611)
Navigation
Downloads
Results for AGCCCUU
Z-value: 0.94
Motif logo

miRNA associated with seed AGCCCUU
| Name | miRBASE accession |
|---|---|
|
hsa-miR-129-1-3p
|
MIMAT0004548 |
|
hsa-miR-129-2-3p
|
MIMAT0004605 |
Activity profile of AGCCCUU motif
Sorted Z-values of AGCCCUU motif
Network of associatons between targets according to the STRING database.

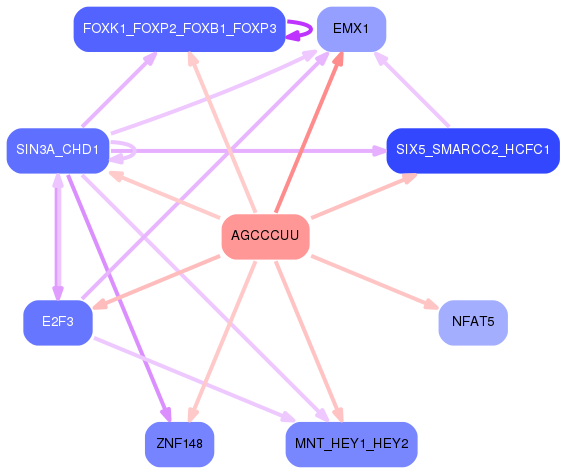
First level regulatory network of AGCCCUU
Gene Ontology Analysis
Gene overrepresentation in biological process category:
| Log-likelihood per target | Total log-likelihood | Term | Description |
|---|---|---|---|
| 1.3 | 3.9 | GO:0071206 | establishment of protein localization to juxtaparanode region of axon(GO:0071206) |
| 0.4 | 2.8 | GO:0090258 | negative regulation of mitochondrial fission(GO:0090258) |
| 0.4 | 3.6 | GO:0060373 | regulation of ventricular cardiac muscle cell membrane depolarization(GO:0060373) |
| 0.3 | 1.2 | GO:1903371 | regulation of endoplasmic reticulum tubular network organization(GO:1903371) |
| 0.3 | 0.9 | GO:1902948 | regulation of choline O-acetyltransferase activity(GO:1902769) positive regulation of choline O-acetyltransferase activity(GO:1902771) negative regulation of tau-protein kinase activity(GO:1902948) positive regulation of early endosome to recycling endosome transport(GO:1902955) negative regulation of aspartic-type endopeptidase activity involved in amyloid precursor protein catabolic process(GO:1902960) negative regulation of neurofibrillary tangle assembly(GO:1902997) negative regulation of aspartic-type peptidase activity(GO:1905246) |
| 0.3 | 1.2 | GO:0044313 | protein K6-linked deubiquitination(GO:0044313) |
| 0.3 | 1.1 | GO:1903061 | positive regulation of protein lipidation(GO:1903061) |
| 0.3 | 2.2 | GO:2000671 | regulation of motor neuron apoptotic process(GO:2000671) |
| 0.2 | 0.7 | GO:0042245 | RNA repair(GO:0042245) |
| 0.2 | 0.7 | GO:0032053 | ciliary basal body organization(GO:0032053) |
| 0.2 | 0.6 | GO:0045175 | basal protein localization(GO:0045175) |
| 0.2 | 1.0 | GO:0030806 | negative regulation of cyclic nucleotide catabolic process(GO:0030806) negative regulation of cAMP catabolic process(GO:0030821) |
| 0.2 | 0.7 | GO:1902809 | regulation of skeletal muscle fiber differentiation(GO:1902809) |
| 0.2 | 2.2 | GO:0051581 | negative regulation of neurotransmitter uptake(GO:0051581) regulation of serotonin uptake(GO:0051611) negative regulation of serotonin uptake(GO:0051612) |
| 0.2 | 0.5 | GO:2000374 | regulation of oxygen metabolic process(GO:2000374) |
| 0.2 | 3.6 | GO:2000480 | negative regulation of cAMP-dependent protein kinase activity(GO:2000480) |
| 0.2 | 0.5 | GO:0043490 | malate-aspartate shuttle(GO:0043490) |
| 0.2 | 2.2 | GO:0090336 | positive regulation of brown fat cell differentiation(GO:0090336) |
| 0.1 | 0.6 | GO:0016256 | N-glycan processing to lysosome(GO:0016256) |
| 0.1 | 0.4 | GO:0035668 | TRAM-dependent toll-like receptor signaling pathway(GO:0035668) TRAM-dependent toll-like receptor 4 signaling pathway(GO:0035669) |
| 0.1 | 0.8 | GO:0019075 | virus maturation(GO:0019075) |
| 0.1 | 0.6 | GO:0035927 | RNA import into mitochondrion(GO:0035927) |
| 0.1 | 1.0 | GO:0033353 | S-adenosylmethionine cycle(GO:0033353) |
| 0.1 | 0.4 | GO:0038018 | Wnt receptor catabolic process(GO:0038018) |
| 0.1 | 2.7 | GO:0048172 | regulation of short-term neuronal synaptic plasticity(GO:0048172) |
| 0.1 | 0.4 | GO:0070650 | endoplasmic reticulum polarization(GO:0061163) actin filament bundle retrograde transport(GO:0061573) actin filament bundle distribution(GO:0070650) |
| 0.1 | 0.4 | GO:0046619 | optic placode formation involved in camera-type eye formation(GO:0046619) |
| 0.1 | 1.8 | GO:0070445 | oligodendrocyte progenitor proliferation(GO:0070444) regulation of oligodendrocyte progenitor proliferation(GO:0070445) |
| 0.1 | 0.4 | GO:0021965 | spinal cord ventral commissure morphogenesis(GO:0021965) |
| 0.1 | 0.3 | GO:1900149 | positive regulation of Schwann cell migration(GO:1900149) regulation of Schwann cell chemotaxis(GO:1904266) positive regulation of Schwann cell chemotaxis(GO:1904268) Schwann cell chemotaxis(GO:1990751) |
| 0.1 | 0.4 | GO:1902683 | regulation of receptor localization to synapse(GO:1902683) |
| 0.1 | 1.5 | GO:0048875 | chemical homeostasis within a tissue(GO:0048875) |
| 0.1 | 2.0 | GO:2001256 | regulation of store-operated calcium entry(GO:2001256) |
| 0.1 | 0.4 | GO:2001016 | positive regulation of skeletal muscle cell differentiation(GO:2001016) |
| 0.1 | 1.1 | GO:0032286 | central nervous system myelin maintenance(GO:0032286) |
| 0.1 | 0.3 | GO:0061027 | umbilical cord morphogenesis(GO:0036304) umbilical cord development(GO:0061027) |
| 0.1 | 1.0 | GO:0010739 | positive regulation of protein kinase A signaling(GO:0010739) |
| 0.1 | 1.1 | GO:1903690 | negative regulation of wound healing, spreading of epidermal cells(GO:1903690) |
| 0.1 | 0.7 | GO:0034316 | negative regulation of Arp2/3 complex-mediated actin nucleation(GO:0034316) |
| 0.1 | 0.5 | GO:0019065 | receptor-mediated endocytosis of virus by host cell(GO:0019065) endocytosis involved in viral entry into host cell(GO:0075509) |
| 0.1 | 0.8 | GO:2000582 | regulation of ATP-dependent microtubule motor activity, plus-end-directed(GO:2000580) positive regulation of ATP-dependent microtubule motor activity, plus-end-directed(GO:2000582) |
| 0.1 | 2.4 | GO:2000311 | regulation of alpha-amino-3-hydroxy-5-methyl-4-isoxazole propionate selective glutamate receptor activity(GO:2000311) |
| 0.1 | 1.5 | GO:0098703 | calcium ion import across plasma membrane(GO:0098703) calcium ion import into cell(GO:1990035) |
| 0.1 | 3.3 | GO:0060292 | long term synaptic depression(GO:0060292) |
| 0.1 | 0.3 | GO:0032849 | positive regulation of cellular pH reduction(GO:0032849) |
| 0.1 | 0.4 | GO:0033564 | anterior/posterior axon guidance(GO:0033564) |
| 0.1 | 0.3 | GO:1903361 | protein localization to basolateral plasma membrane(GO:1903361) |
| 0.0 | 0.5 | GO:0050882 | voluntary musculoskeletal movement(GO:0050882) |
| 0.0 | 0.4 | GO:0070345 | negative regulation of fat cell proliferation(GO:0070345) |
| 0.0 | 0.6 | GO:0019367 | fatty acid elongation, saturated fatty acid(GO:0019367) fatty acid elongation, unsaturated fatty acid(GO:0019368) fatty acid elongation, monounsaturated fatty acid(GO:0034625) fatty acid elongation, polyunsaturated fatty acid(GO:0034626) |
| 0.0 | 0.5 | GO:0006657 | CDP-choline pathway(GO:0006657) |
| 0.0 | 0.7 | GO:0048227 | plasma membrane to endosome transport(GO:0048227) |
| 0.0 | 2.4 | GO:0007214 | gamma-aminobutyric acid signaling pathway(GO:0007214) |
| 0.0 | 0.3 | GO:1903593 | regulation of histamine secretion by mast cell(GO:1903593) |
| 0.0 | 0.7 | GO:0030422 | production of siRNA involved in RNA interference(GO:0030422) |
| 0.0 | 1.8 | GO:2000300 | regulation of synaptic vesicle exocytosis(GO:2000300) |
| 0.0 | 0.3 | GO:1902231 | positive regulation of intrinsic apoptotic signaling pathway in response to DNA damage(GO:1902231) |
| 0.0 | 0.6 | GO:0019317 | fucose catabolic process(GO:0019317) L-fucose metabolic process(GO:0042354) L-fucose catabolic process(GO:0042355) |
| 0.0 | 2.0 | GO:0070884 | regulation of calcineurin-NFAT signaling cascade(GO:0070884) |
| 0.0 | 0.4 | GO:0018401 | peptidyl-proline hydroxylation to 4-hydroxy-L-proline(GO:0018401) |
| 0.0 | 0.1 | GO:0048073 | regulation of eye pigmentation(GO:0048073) |
| 0.0 | 1.8 | GO:0035235 | ionotropic glutamate receptor signaling pathway(GO:0035235) |
| 0.0 | 0.3 | GO:0035093 | spermatogenesis, exchange of chromosomal proteins(GO:0035093) |
| 0.0 | 0.1 | GO:0031204 | posttranslational protein targeting to membrane, translocation(GO:0031204) |
| 0.0 | 0.3 | GO:0071947 | protein deubiquitination involved in ubiquitin-dependent protein catabolic process(GO:0071947) |
| 0.0 | 0.5 | GO:0015886 | heme transport(GO:0015886) |
| 0.0 | 0.5 | GO:0071372 | cellular response to follicle-stimulating hormone stimulus(GO:0071372) |
| 0.0 | 0.6 | GO:0090084 | negative regulation of inclusion body assembly(GO:0090084) |
| 0.0 | 1.3 | GO:0010763 | positive regulation of fibroblast migration(GO:0010763) |
| 0.0 | 0.4 | GO:0007258 | JUN phosphorylation(GO:0007258) |
| 0.0 | 1.2 | GO:0007398 | ectoderm development(GO:0007398) |
| 0.0 | 0.6 | GO:0035988 | chondrocyte proliferation(GO:0035988) |
| 0.0 | 0.6 | GO:0048739 | cardiac muscle fiber development(GO:0048739) |
| 0.0 | 0.5 | GO:0070072 | proton-transporting V-type ATPase complex assembly(GO:0070070) vacuolar proton-transporting V-type ATPase complex assembly(GO:0070072) |
| 0.0 | 0.8 | GO:0016048 | detection of temperature stimulus(GO:0016048) |
| 0.0 | 0.2 | GO:0071313 | cellular response to caffeine(GO:0071313) cellular response to purine-containing compound(GO:0071415) |
| 0.0 | 0.3 | GO:1901409 | positive regulation of phosphorylation of RNA polymerase II C-terminal domain(GO:1901409) |
| 0.0 | 0.3 | GO:0006268 | DNA unwinding involved in DNA replication(GO:0006268) |
| 0.0 | 2.1 | GO:0010812 | negative regulation of cell-substrate adhesion(GO:0010812) |
| 0.0 | 0.5 | GO:0036148 | phosphatidylglycerol acyl-chain remodeling(GO:0036148) |
| 0.0 | 0.4 | GO:0007253 | cytoplasmic sequestering of NF-kappaB(GO:0007253) |
| 0.0 | 0.7 | GO:0045956 | positive regulation of calcium ion-dependent exocytosis(GO:0045956) |
| 0.0 | 0.3 | GO:0032464 | positive regulation of protein homooligomerization(GO:0032464) |
| 0.0 | 0.1 | GO:2000616 | negative regulation of histone H3-K9 acetylation(GO:2000616) |
| 0.0 | 0.4 | GO:1902514 | regulation of calcium ion transmembrane transport via high voltage-gated calcium channel(GO:1902514) |
| 0.0 | 0.2 | GO:0060836 | lymphatic endothelial cell differentiation(GO:0060836) |
| 0.0 | 0.1 | GO:0030950 | establishment or maintenance of actin cytoskeleton polarity(GO:0030950) |
| 0.0 | 0.8 | GO:0048265 | response to pain(GO:0048265) |
| 0.0 | 1.3 | GO:0015701 | bicarbonate transport(GO:0015701) |
| 0.0 | 0.2 | GO:0042998 | positive regulation of Golgi to plasma membrane protein transport(GO:0042998) |
| 0.0 | 0.7 | GO:0018345 | protein palmitoylation(GO:0018345) |
| 0.0 | 0.5 | GO:0072673 | lamellipodium morphogenesis(GO:0072673) |
| 0.0 | 0.1 | GO:0006398 | mRNA 3'-end processing by stem-loop binding and cleavage(GO:0006398) |
| 0.0 | 0.0 | GO:0007412 | axon target recognition(GO:0007412) |
| 0.0 | 0.2 | GO:0045198 | establishment of epithelial cell apical/basal polarity(GO:0045198) |
| 0.0 | 0.5 | GO:0071425 | hematopoietic stem cell proliferation(GO:0071425) |
| 0.0 | 1.5 | GO:1903779 | regulation of cardiac conduction(GO:1903779) |
| 0.0 | 0.2 | GO:0007220 | Notch receptor processing(GO:0007220) |
| 0.0 | 0.4 | GO:0050435 | beta-amyloid metabolic process(GO:0050435) |
Gene overrepresentation in cellular component category:
| Log-likelihood per target | Total log-likelihood | Term | Description |
|---|---|---|---|
| 0.5 | 2.5 | GO:0038039 | G-protein coupled receptor heterodimeric complex(GO:0038039) |
| 0.3 | 2.8 | GO:0045298 | tubulin complex(GO:0045298) |
| 0.3 | 1.2 | GO:0032127 | dense core granule membrane(GO:0032127) |
| 0.2 | 2.5 | GO:0001518 | voltage-gated sodium channel complex(GO:0001518) |
| 0.1 | 1.0 | GO:0009331 | glycerol-3-phosphate dehydrogenase complex(GO:0009331) |
| 0.1 | 2.0 | GO:0030314 | junctional membrane complex(GO:0030314) |
| 0.1 | 0.4 | GO:0070931 | Golgi-associated vesicle lumen(GO:0070931) |
| 0.1 | 1.0 | GO:0033018 | sarcoplasmic reticulum lumen(GO:0033018) |
| 0.1 | 1.1 | GO:0030868 | smooth endoplasmic reticulum membrane(GO:0030868) smooth endoplasmic reticulum part(GO:0097425) |
| 0.1 | 6.0 | GO:0033268 | node of Ranvier(GO:0033268) |
| 0.1 | 1.1 | GO:0030981 | cortical microtubule cytoskeleton(GO:0030981) |
| 0.1 | 0.5 | GO:0043291 | RAVE complex(GO:0043291) |
| 0.1 | 4.6 | GO:0032281 | AMPA glutamate receptor complex(GO:0032281) |
| 0.1 | 0.6 | GO:0070852 | cell body fiber(GO:0070852) |
| 0.1 | 1.5 | GO:0032426 | stereocilium tip(GO:0032426) |
| 0.1 | 0.4 | GO:0097441 | basilar dendrite(GO:0097441) |
| 0.1 | 1.3 | GO:0017146 | NMDA selective glutamate receptor complex(GO:0017146) |
| 0.1 | 0.6 | GO:0005742 | mitochondrial outer membrane translocase complex(GO:0005742) |
| 0.0 | 0.1 | GO:0031085 | BLOC-3 complex(GO:0031085) |
| 0.0 | 0.9 | GO:0005641 | nuclear envelope lumen(GO:0005641) |
| 0.0 | 0.8 | GO:0000813 | ESCRT I complex(GO:0000813) |
| 0.0 | 0.3 | GO:0097422 | tubular endosome(GO:0097422) |
| 0.0 | 0.3 | GO:0097025 | MPP7-DLG1-LIN7 complex(GO:0097025) |
| 0.0 | 0.8 | GO:0016461 | unconventional myosin complex(GO:0016461) |
| 0.0 | 0.5 | GO:0031209 | SCAR complex(GO:0031209) |
| 0.0 | 0.2 | GO:0031313 | extrinsic component of endosome membrane(GO:0031313) |
| 0.0 | 1.8 | GO:0048786 | presynaptic active zone(GO:0048786) |
| 0.0 | 0.3 | GO:0035686 | sperm fibrous sheath(GO:0035686) |
| 0.0 | 0.2 | GO:0070765 | gamma-secretase complex(GO:0070765) |
| 0.0 | 1.0 | GO:0032839 | dendrite cytoplasm(GO:0032839) |
| 0.0 | 1.2 | GO:0032809 | neuronal cell body membrane(GO:0032809) cell body membrane(GO:0044298) |
| 0.0 | 0.4 | GO:0008290 | F-actin capping protein complex(GO:0008290) |
| 0.0 | 0.3 | GO:0008024 | cyclin/CDK positive transcription elongation factor complex(GO:0008024) |
| 0.0 | 1.1 | GO:0009925 | basal plasma membrane(GO:0009925) |
| 0.0 | 0.4 | GO:0060077 | inhibitory synapse(GO:0060077) |
| 0.0 | 2.2 | GO:0031903 | peroxisomal membrane(GO:0005778) microbody membrane(GO:0031903) |
| 0.0 | 0.7 | GO:0044295 | axonal growth cone(GO:0044295) |
| 0.0 | 1.4 | GO:0005891 | voltage-gated calcium channel complex(GO:0005891) |
| 0.0 | 0.3 | GO:0031045 | dense core granule(GO:0031045) |
| 0.0 | 0.4 | GO:0031265 | CD95 death-inducing signaling complex(GO:0031265) |
| 0.0 | 1.5 | GO:0014704 | intercalated disc(GO:0014704) |
| 0.0 | 0.3 | GO:0005662 | DNA replication factor A complex(GO:0005662) |
| 0.0 | 0.3 | GO:0031362 | anchored component of external side of plasma membrane(GO:0031362) |
| 0.0 | 0.3 | GO:0005892 | acetylcholine-gated channel complex(GO:0005892) |
Gene overrepresentation in molecular function category:
| Log-likelihood per target | Total log-likelihood | Term | Description |
|---|---|---|---|
| 0.7 | 2.8 | GO:0099609 | microtubule lateral binding(GO:0099609) |
| 0.5 | 1.5 | GO:0015275 | stretch-activated, cation-selective, calcium channel activity(GO:0015275) |
| 0.5 | 3.3 | GO:0008273 | calcium, potassium:sodium antiporter activity(GO:0008273) |
| 0.4 | 2.5 | GO:0004965 | G-protein coupled GABA receptor activity(GO:0004965) |
| 0.3 | 2.5 | GO:0086006 | voltage-gated sodium channel activity involved in cardiac muscle cell action potential(GO:0086006) |
| 0.2 | 0.6 | GO:0030943 | mitochondrion targeting sequence binding(GO:0030943) |
| 0.2 | 1.8 | GO:0008597 | calcium-dependent protein serine/threonine phosphatase regulator activity(GO:0008597) |
| 0.2 | 0.8 | GO:0097677 | STAT family protein binding(GO:0097677) |
| 0.2 | 0.7 | GO:0035514 | DNA demethylase activity(GO:0035514) |
| 0.2 | 1.1 | GO:0043515 | kinetochore binding(GO:0043515) |
| 0.1 | 1.2 | GO:1904288 | BAT3 complex binding(GO:1904288) |
| 0.1 | 1.5 | GO:0030160 | GKAP/Homer scaffold activity(GO:0030160) |
| 0.1 | 1.0 | GO:0016802 | adenosylhomocysteinase activity(GO:0004013) trialkylsulfonium hydrolase activity(GO:0016802) |
| 0.1 | 0.5 | GO:0008427 | calcium-dependent protein kinase inhibitor activity(GO:0008427) |
| 0.1 | 3.6 | GO:0004862 | cAMP-dependent protein kinase inhibitor activity(GO:0004862) |
| 0.1 | 2.2 | GO:0004865 | protein serine/threonine phosphatase inhibitor activity(GO:0004865) |
| 0.1 | 1.2 | GO:0030348 | syntaxin-3 binding(GO:0030348) |
| 0.1 | 1.8 | GO:0004972 | NMDA glutamate receptor activity(GO:0004972) |
| 0.1 | 0.5 | GO:0004605 | diacylglycerol cholinephosphotransferase activity(GO:0004142) phosphatidate cytidylyltransferase activity(GO:0004605) |
| 0.1 | 0.6 | GO:0003976 | UDP-N-acetylglucosamine-lysosomal-enzyme N-acetylglucosaminephosphotransferase activity(GO:0003976) |
| 0.1 | 0.4 | GO:0008798 | beta-aspartyl-peptidase activity(GO:0008798) |
| 0.1 | 0.4 | GO:0005042 | netrin receptor activity(GO:0005042) |
| 0.1 | 1.0 | GO:0030346 | protein phosphatase 2B binding(GO:0030346) |
| 0.1 | 0.5 | GO:0015183 | L-aspartate transmembrane transporter activity(GO:0015183) |
| 0.1 | 2.1 | GO:0008191 | metalloendopeptidase inhibitor activity(GO:0008191) |
| 0.1 | 0.3 | GO:0005169 | neurotrophin TRKB receptor binding(GO:0005169) |
| 0.1 | 0.4 | GO:0035276 | ethanol binding(GO:0035276) |
| 0.1 | 1.4 | GO:0031545 | peptidyl-proline 4-dioxygenase activity(GO:0031545) |
| 0.1 | 0.3 | GO:0008332 | low voltage-gated calcium channel activity(GO:0008332) |
| 0.1 | 0.3 | GO:0035939 | microsatellite binding(GO:0035939) |
| 0.1 | 2.8 | GO:0004708 | MAP kinase kinase activity(GO:0004708) |
| 0.1 | 0.4 | GO:0005105 | type 1 fibroblast growth factor receptor binding(GO:0005105) |
| 0.1 | 0.2 | GO:0048763 | calcium-induced calcium release activity(GO:0048763) |
| 0.1 | 0.2 | GO:0004421 | hydroxymethylglutaryl-CoA synthase activity(GO:0004421) |
| 0.0 | 0.3 | GO:0032422 | purine-rich negative regulatory element binding(GO:0032422) |
| 0.0 | 0.6 | GO:0046920 | alpha-(1->3)-fucosyltransferase activity(GO:0046920) |
| 0.0 | 3.5 | GO:0005245 | voltage-gated calcium channel activity(GO:0005245) |
| 0.0 | 0.6 | GO:0009922 | fatty acid elongase activity(GO:0009922) 3-oxo-arachidoyl-CoA synthase activity(GO:0102336) 3-oxo-cerotoyl-CoA synthase activity(GO:0102337) 3-oxo-lignoceronyl-CoA synthase activity(GO:0102338) |
| 0.0 | 0.9 | GO:0030306 | ADP-ribosylation factor binding(GO:0030306) |
| 0.0 | 1.3 | GO:0008510 | sodium:bicarbonate symporter activity(GO:0008510) |
| 0.0 | 0.9 | GO:0016493 | C-C chemokine receptor activity(GO:0016493) |
| 0.0 | 0.7 | GO:0071933 | Arp2/3 complex binding(GO:0071933) |
| 0.0 | 5.0 | GO:0043621 | protein self-association(GO:0043621) |
| 0.0 | 0.5 | GO:0015232 | heme transporter activity(GO:0015232) |
| 0.0 | 0.5 | GO:0046790 | virion binding(GO:0046790) |
| 0.0 | 1.2 | GO:0005251 | delayed rectifier potassium channel activity(GO:0005251) |
| 0.0 | 1.0 | GO:0050811 | GABA receptor binding(GO:0050811) |
| 0.0 | 1.6 | GO:0017091 | AU-rich element binding(GO:0017091) |
| 0.0 | 0.5 | GO:0047144 | 2-acylglycerol-3-phosphate O-acyltransferase activity(GO:0047144) |
| 0.0 | 0.6 | GO:0005176 | ErbB-2 class receptor binding(GO:0005176) |
| 0.0 | 0.2 | GO:0031849 | olfactory receptor binding(GO:0031849) |
| 0.0 | 0.8 | GO:0045505 | dynein intermediate chain binding(GO:0045505) |
| 0.0 | 0.3 | GO:0034452 | dynactin binding(GO:0034452) |
| 0.0 | 1.0 | GO:0019707 | protein-cysteine S-palmitoyltransferase activity(GO:0019706) protein-cysteine S-acyltransferase activity(GO:0019707) |
| 0.0 | 0.6 | GO:0070628 | proteasome binding(GO:0070628) |
| 0.0 | 0.6 | GO:0045295 | gamma-catenin binding(GO:0045295) |
| 0.0 | 0.4 | GO:0005167 | neurotrophin TRK receptor binding(GO:0005167) neurotrophin TRKA receptor binding(GO:0005168) |
| 0.0 | 0.6 | GO:0070006 | metalloaminopeptidase activity(GO:0070006) |
| 0.0 | 0.3 | GO:0097322 | 7SK snRNA binding(GO:0097322) |
| 0.0 | 0.4 | GO:0010314 | phosphatidylinositol-5-phosphate binding(GO:0010314) |
| 0.0 | 0.1 | GO:1904455 | ubiquitin-specific protease activity involved in negative regulation of ERAD pathway(GO:1904455) |
| 0.0 | 0.2 | GO:0071253 | connexin binding(GO:0071253) |
| 0.0 | 0.6 | GO:0051371 | muscle alpha-actinin binding(GO:0051371) |
| 0.0 | 0.2 | GO:0001665 | alpha-N-acetylgalactosaminide alpha-2,6-sialyltransferase activity(GO:0001665) |
| 0.0 | 0.4 | GO:0015467 | G-protein activated inward rectifier potassium channel activity(GO:0015467) |
| 0.0 | 0.3 | GO:0097016 | L27 domain binding(GO:0097016) |
| 0.0 | 0.2 | GO:0017002 | activin-activated receptor activity(GO:0017002) |
| 0.0 | 1.5 | GO:0005546 | phosphatidylinositol-4,5-bisphosphate binding(GO:0005546) |
| 0.0 | 0.3 | GO:0004089 | carbonate dehydratase activity(GO:0004089) |
| 0.0 | 0.7 | GO:0030742 | GTP-dependent protein binding(GO:0030742) |
| 0.0 | 0.1 | GO:0008318 | protein prenyltransferase activity(GO:0008318) |
| 0.0 | 0.6 | GO:0008266 | poly(U) RNA binding(GO:0008266) |
| 0.0 | 1.0 | GO:0017080 | sodium channel regulator activity(GO:0017080) |
| 0.0 | 2.1 | GO:0005179 | hormone activity(GO:0005179) |
| 0.0 | 0.8 | GO:0005227 | calcium activated cation channel activity(GO:0005227) |
| 0.0 | 0.4 | GO:0017056 | structural constituent of nuclear pore(GO:0017056) |
| 0.0 | 0.4 | GO:0043395 | heparan sulfate proteoglycan binding(GO:0043395) |
| 0.0 | 2.2 | GO:0043130 | ubiquitin binding(GO:0043130) |
| 0.0 | 0.6 | GO:0005547 | phosphatidylinositol-3,4,5-trisphosphate binding(GO:0005547) |
| 0.0 | 0.5 | GO:0016881 | acid-amino acid ligase activity(GO:0016881) |
| 0.0 | 0.2 | GO:0051011 | microtubule minus-end binding(GO:0051011) |
Gene overrepresentation in curated gene sets: canonical pathways category:
| Log-likelihood per target | Total log-likelihood | Term | Description |
|---|---|---|---|
| 0.1 | 2.8 | PID P38 GAMMA DELTA PATHWAY | Signaling mediated by p38-gamma and p38-delta |
| 0.1 | 3.3 | PID CONE PATHWAY | Visual signal transduction: Cones |
| 0.0 | 2.8 | PID TCR CALCIUM PATHWAY | Calcium signaling in the CD4+ TCR pathway |
| 0.0 | 1.4 | PID HIF1A PATHWAY | Hypoxic and oxygen homeostasis regulation of HIF-1-alpha |
| 0.0 | 0.2 | SA G2 AND M PHASES | Cdc25 activates the cdc2/cyclin B complex to induce the G2/M transition. |
| 0.0 | 2.1 | NABA PROTEOGLYCANS | Genes encoding proteoglycans |
| 0.0 | 2.0 | PID P38 ALPHA BETA PATHWAY | Regulation of p38-alpha and p38-beta |
| 0.0 | 0.8 | ST G ALPHA S PATHWAY | G alpha s Pathway |
| 0.0 | 0.4 | ST DIFFERENTIATION PATHWAY IN PC12 CELLS | Differentiation Pathway in PC12 Cells; this is a specific case of PAC1 Receptor Pathway. |
| 0.0 | 0.9 | ST P38 MAPK PATHWAY | p38 MAPK Pathway |
| 0.0 | 1.3 | PID REELIN PATHWAY | Reelin signaling pathway |
| 0.0 | 0.4 | PID LPA4 PATHWAY | LPA4-mediated signaling events |
| 0.0 | 2.1 | PID ILK PATHWAY | Integrin-linked kinase signaling |
| 0.0 | 0.8 | PID NETRIN PATHWAY | Netrin-mediated signaling events |
| 0.0 | 0.4 | PID NEPHRIN NEPH1 PATHWAY | Nephrin/Neph1 signaling in the kidney podocyte |
| 0.0 | 0.2 | PID SYNDECAN 3 PATHWAY | Syndecan-3-mediated signaling events |
Gene overrepresentation in curated gene sets: REACTOME pathways category:
| Log-likelihood per target | Total log-likelihood | Term | Description |
|---|---|---|---|
| 0.1 | 2.5 | REACTOME CLASS C 3 METABOTROPIC GLUTAMATE PHEROMONE RECEPTORS | Genes involved in Class C/3 (Metabotropic glutamate/pheromone receptors) |
| 0.1 | 0.5 | REACTOME ACYL CHAIN REMODELLING OF PG | Genes involved in Acyl chain remodelling of PG |
| 0.1 | 2.8 | REACTOME CASPASE MEDIATED CLEAVAGE OF CYTOSKELETAL PROTEINS | Genes involved in Caspase-mediated cleavage of cytoskeletal proteins |
| 0.1 | 2.6 | REACTOME RAS ACTIVATION UOPN CA2 INFUX THROUGH NMDA RECEPTOR | Genes involved in Ras activation uopn Ca2+ infux through NMDA receptor |
| 0.0 | 3.4 | REACTOME TRAFFICKING OF AMPA RECEPTORS | Genes involved in Trafficking of AMPA receptors |
| 0.0 | 2.5 | REACTOME INTERACTION BETWEEN L1 AND ANKYRINS | Genes involved in Interaction between L1 and Ankyrins |
| 0.0 | 0.8 | REACTOME ROLE OF DCC IN REGULATING APOPTOSIS | Genes involved in Role of DCC in regulating apoptosis |
| 0.0 | 1.4 | REACTOME JNK C JUN KINASES PHOSPHORYLATION AND ACTIVATION MEDIATED BY ACTIVATED HUMAN TAK1 | Genes involved in JNK (c-Jun kinases) phosphorylation and activation mediated by activated human TAK1 |
| 0.0 | 1.4 | REACTOME OXYGEN DEPENDENT PROLINE HYDROXYLATION OF HYPOXIA INDUCIBLE FACTOR ALPHA | Genes involved in Oxygen-dependent Proline Hydroxylation of Hypoxia-inducible Factor Alpha |
| 0.0 | 2.9 | REACTOME NCAM1 INTERACTIONS | Genes involved in NCAM1 interactions |
| 0.0 | 0.4 | REACTOME CDC6 ASSOCIATION WITH THE ORC ORIGIN COMPLEX | Genes involved in CDC6 association with the ORC:origin complex |
| 0.0 | 0.8 | REACTOME ACTIVATION OF BH3 ONLY PROTEINS | Genes involved in Activation of BH3-only proteins |
| 0.0 | 1.0 | REACTOME SYNTHESIS OF PA | Genes involved in Synthesis of PA |
| 0.0 | 4.6 | REACTOME TRANSPORT OF INORGANIC CATIONS ANIONS AND AMINO ACIDS OLIGOPEPTIDES | Genes involved in Transport of inorganic cations/anions and amino acids/oligopeptides |
| 0.0 | 0.4 | REACTOME PROLONGED ERK ACTIVATION EVENTS | Genes involved in Prolonged ERK activation events |
| 0.0 | 1.1 | REACTOME MITOCHONDRIAL PROTEIN IMPORT | Genes involved in Mitochondrial Protein Import |
| 0.0 | 0.3 | REACTOME REVERSIBLE HYDRATION OF CARBON DIOXIDE | Genes involved in Reversible Hydration of Carbon Dioxide |
| 0.0 | 1.2 | REACTOME VOLTAGE GATED POTASSIUM CHANNELS | Genes involved in Voltage gated Potassium channels |
| 0.0 | 0.2 | REACTOME SIGNALING BY NOTCH3 | Genes involved in Signaling by NOTCH3 |
| 0.0 | 0.6 | REACTOME SYNTHESIS OF VERY LONG CHAIN FATTY ACYL COAS | Genes involved in Synthesis of very long-chain fatty acyl-CoAs |
| 0.0 | 0.5 | REACTOME EGFR DOWNREGULATION | Genes involved in EGFR downregulation |
| 0.0 | 0.4 | REACTOME HS GAG DEGRADATION | Genes involved in HS-GAG degradation |