Project
Illumina Body Map 2 (GSE30611)
Navigation
Downloads
Results for AGUGCAA
Z-value: 0.91
Motif logo

miRNA associated with seed AGUGCAA
| Name | miRBASE accession |
|---|---|
|
hsa-miR-130a-3p
|
MIMAT0000425 |
|
hsa-miR-130b-3p
|
MIMAT0000691 |
|
hsa-miR-301a-3p
|
MIMAT0000688 |
|
hsa-miR-301b-3p
|
MIMAT0004958 |
|
hsa-miR-3666
|
MIMAT0018088 |
|
hsa-miR-4295
|
MIMAT0016844 |
|
hsa-miR-454-3p
|
MIMAT0003885 |
Activity profile of AGUGCAA motif
Sorted Z-values of AGUGCAA motif
Network of associatons between targets according to the STRING database.

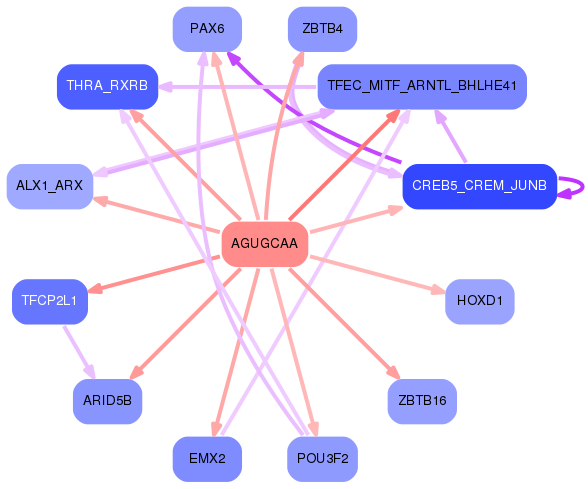
First level regulatory network of AGUGCAA
Gene Ontology Analysis
Gene overrepresentation in biological process category:
| Log-likelihood per target | Total log-likelihood | Term | Description |
|---|---|---|---|
| 0.7 | 2.9 | GO:1990926 | short-term synaptic potentiation(GO:1990926) |
| 0.5 | 1.4 | GO:1904395 | positive regulation of skeletal muscle acetylcholine-gated channel clustering(GO:1904395) |
| 0.5 | 1.4 | GO:0043490 | malate-aspartate shuttle(GO:0043490) |
| 0.4 | 1.3 | GO:1901383 | negative regulation of chorionic trophoblast cell proliferation(GO:1901383) |
| 0.4 | 1.1 | GO:1904204 | regulation of skeletal muscle hypertrophy(GO:1904204) |
| 0.4 | 1.1 | GO:0038162 | erythropoietin-mediated signaling pathway(GO:0038162) mast cell proliferation(GO:0070662) |
| 0.3 | 0.9 | GO:1905006 | negative regulation of epithelial to mesenchymal transition involved in endocardial cushion formation(GO:1905006) |
| 0.3 | 1.1 | GO:0044313 | protein K6-linked deubiquitination(GO:0044313) |
| 0.3 | 1.1 | GO:0010645 | regulation of cell communication by chemical coupling(GO:0010645) positive regulation of cell communication by chemical coupling(GO:0010652) |
| 0.3 | 0.8 | GO:1902938 | regulation of intracellular calcium activated chloride channel activity(GO:1902938) |
| 0.2 | 0.7 | GO:1903526 | negative regulation of membrane tubulation(GO:1903526) |
| 0.2 | 0.9 | GO:0044837 | assembly of actomyosin apparatus involved in cytokinesis(GO:0000912) actomyosin contractile ring assembly(GO:0000915) actomyosin contractile ring organization(GO:0044837) |
| 0.2 | 0.8 | GO:0030185 | nitric oxide transport(GO:0030185) regulation of prostaglandin-endoperoxide synthase activity(GO:0060584) positive regulation of prostaglandin-endoperoxide synthase activity(GO:0060585) |
| 0.2 | 1.0 | GO:0007206 | phospholipase C-activating G-protein coupled glutamate receptor signaling pathway(GO:0007206) |
| 0.2 | 1.4 | GO:0033029 | regulation of neutrophil apoptotic process(GO:0033029) |
| 0.2 | 0.6 | GO:0090274 | regulation of somatostatin secretion(GO:0090273) positive regulation of somatostatin secretion(GO:0090274) |
| 0.2 | 0.8 | GO:0061763 | multivesicular body-lysosome fusion(GO:0061763) |
| 0.2 | 0.9 | GO:1904693 | midbrain morphogenesis(GO:1904693) |
| 0.2 | 0.6 | GO:1903031 | regulation of microtubule plus-end binding(GO:1903031) positive regulation of microtubule plus-end binding(GO:1903033) |
| 0.2 | 3.2 | GO:1904321 | response to forskolin(GO:1904321) cellular response to forskolin(GO:1904322) |
| 0.2 | 1.2 | GO:1902498 | regulation of protein autoubiquitination(GO:1902498) |
| 0.2 | 0.7 | GO:1902683 | regulation of receptor localization to synapse(GO:1902683) |
| 0.2 | 0.8 | GO:0045925 | positive regulation of female receptivity(GO:0045925) |
| 0.1 | 1.5 | GO:0016560 | protein import into peroxisome matrix, docking(GO:0016560) |
| 0.1 | 0.7 | GO:0097195 | pilomotor reflex(GO:0097195) |
| 0.1 | 1.2 | GO:0035502 | metanephric part of ureteric bud development(GO:0035502) |
| 0.1 | 0.8 | GO:0044861 | protein transport into plasma membrane raft(GO:0044861) |
| 0.1 | 1.3 | GO:0060029 | convergent extension involved in organogenesis(GO:0060029) |
| 0.1 | 0.8 | GO:0098532 | histone H3-K27 trimethylation(GO:0098532) |
| 0.1 | 0.8 | GO:0090283 | regulation of protein glycosylation in Golgi(GO:0090283) |
| 0.1 | 0.6 | GO:0009099 | branched-chain amino acid biosynthetic process(GO:0009082) leucine biosynthetic process(GO:0009098) valine biosynthetic process(GO:0009099) |
| 0.1 | 2.2 | GO:0016081 | synaptic vesicle docking(GO:0016081) |
| 0.1 | 0.9 | GO:0071896 | protein localization to adherens junction(GO:0071896) |
| 0.1 | 0.5 | GO:0032474 | otolith morphogenesis(GO:0032474) |
| 0.1 | 1.5 | GO:0016198 | axon choice point recognition(GO:0016198) |
| 0.1 | 0.3 | GO:2000584 | regulation of platelet-derived growth factor receptor-alpha signaling pathway(GO:2000583) negative regulation of platelet-derived growth factor receptor-alpha signaling pathway(GO:2000584) |
| 0.1 | 1.0 | GO:1990253 | cellular response to leucine(GO:0071233) cellular response to leucine starvation(GO:1990253) |
| 0.1 | 0.5 | GO:0006408 | snRNA export from nucleus(GO:0006408) |
| 0.1 | 0.3 | GO:2000560 | CD24 biosynthetic process(GO:0035724) activation of meiosis involved in egg activation(GO:0060466) negative regulation of monocyte extravasation(GO:2000438) regulation of CD24 biosynthetic process(GO:2000559) positive regulation of CD24 biosynthetic process(GO:2000560) |
| 0.1 | 0.3 | GO:0001579 | medium-chain fatty acid transport(GO:0001579) |
| 0.1 | 1.1 | GO:0070649 | formin-nucleated actin cable assembly(GO:0070649) |
| 0.1 | 1.2 | GO:0019375 | galactosylceramide biosynthetic process(GO:0006682) galactolipid biosynthetic process(GO:0019375) |
| 0.1 | 1.5 | GO:0060385 | axonogenesis involved in innervation(GO:0060385) |
| 0.1 | 1.0 | GO:0098728 | germ-line stem cell division(GO:0042078) male germ-line stem cell asymmetric division(GO:0048133) germline stem cell asymmetric division(GO:0098728) |
| 0.1 | 0.4 | GO:0002541 | activation of plasma proteins involved in acute inflammatory response(GO:0002541) |
| 0.1 | 1.3 | GO:0007028 | cytoplasm organization(GO:0007028) |
| 0.1 | 0.4 | GO:0038018 | Wnt receptor catabolic process(GO:0038018) |
| 0.1 | 0.4 | GO:0010701 | positive regulation of norepinephrine secretion(GO:0010701) |
| 0.1 | 0.4 | GO:0048388 | endosomal lumen acidification(GO:0048388) |
| 0.1 | 0.3 | GO:0045175 | basal protein localization(GO:0045175) |
| 0.1 | 1.1 | GO:2000576 | positive regulation of microtubule motor activity(GO:2000576) |
| 0.1 | 0.6 | GO:1903385 | regulation of homophilic cell adhesion(GO:1903385) |
| 0.1 | 0.3 | GO:1901069 | guanosine-containing compound catabolic process(GO:1901069) |
| 0.1 | 0.3 | GO:0005988 | lactose metabolic process(GO:0005988) lactose biosynthetic process(GO:0005989) |
| 0.1 | 0.6 | GO:0075509 | receptor-mediated endocytosis of virus by host cell(GO:0019065) endocytosis involved in viral entry into host cell(GO:0075509) |
| 0.1 | 0.3 | GO:1903823 | regulation of telomere maintenance via recombination(GO:0032207) negative regulation of telomere maintenance via recombination(GO:0032208) negative regulation of single strand break repair(GO:1903517) negative regulation of beta-galactosidase activity(GO:1903770) telomere single strand break repair(GO:1903823) negative regulation of telomere single strand break repair(GO:1903824) |
| 0.1 | 0.7 | GO:0021759 | globus pallidus development(GO:0021759) embryonic olfactory bulb interneuron precursor migration(GO:0021831) |
| 0.1 | 0.6 | GO:0015015 | heparan sulfate proteoglycan biosynthetic process, enzymatic modification(GO:0015015) |
| 0.1 | 0.9 | GO:0086024 | adrenergic receptor signaling pathway involved in positive regulation of heart rate(GO:0086024) |
| 0.1 | 0.4 | GO:0042853 | L-alanine metabolic process(GO:0042851) L-alanine catabolic process(GO:0042853) |
| 0.1 | 1.8 | GO:0061162 | establishment of monopolar cell polarity(GO:0061162) |
| 0.1 | 1.0 | GO:0001886 | endothelial cell morphogenesis(GO:0001886) |
| 0.1 | 0.2 | GO:0019858 | cytosine metabolic process(GO:0019858) |
| 0.1 | 0.4 | GO:0090611 | ubiquitin-independent protein catabolic process via the multivesicular body sorting pathway(GO:0090611) |
| 0.1 | 0.7 | GO:0043615 | astrocyte cell migration(GO:0043615) |
| 0.1 | 1.9 | GO:0006012 | galactose metabolic process(GO:0006012) |
| 0.1 | 0.6 | GO:0002036 | regulation of L-glutamate transport(GO:0002036) |
| 0.1 | 0.8 | GO:0032525 | somite rostral/caudal axis specification(GO:0032525) |
| 0.1 | 1.2 | GO:0048671 | negative regulation of collateral sprouting(GO:0048671) |
| 0.1 | 0.2 | GO:0006147 | guanine catabolic process(GO:0006147) |
| 0.1 | 0.5 | GO:0032487 | regulation of Rap protein signal transduction(GO:0032487) |
| 0.1 | 0.2 | GO:1905150 | regulation of voltage-gated sodium channel activity(GO:1905150) |
| 0.1 | 1.2 | GO:0001514 | selenocysteine incorporation(GO:0001514) translational readthrough(GO:0006451) |
| 0.1 | 0.4 | GO:0023016 | signal transduction by trans-phosphorylation(GO:0023016) |
| 0.1 | 0.5 | GO:0030242 | pexophagy(GO:0030242) |
| 0.1 | 0.3 | GO:1902228 | mammary gland fat development(GO:0060611) positive regulation of macrophage colony-stimulating factor signaling pathway(GO:1902228) positive regulation of response to macrophage colony-stimulating factor(GO:1903971) positive regulation of cellular response to macrophage colony-stimulating factor stimulus(GO:1903974) positive regulation of microglial cell migration(GO:1904141) |
| 0.1 | 0.2 | GO:0090176 | microtubule cytoskeleton organization involved in establishment of planar polarity(GO:0090176) |
| 0.1 | 0.9 | GO:1900028 | negative regulation of ruffle assembly(GO:1900028) |
| 0.1 | 0.4 | GO:0099558 | maintenance of synapse structure(GO:0099558) |
| 0.1 | 0.3 | GO:0061026 | cardiac muscle tissue regeneration(GO:0061026) |
| 0.1 | 1.6 | GO:0010944 | negative regulation of transcription by competitive promoter binding(GO:0010944) |
| 0.1 | 0.4 | GO:0032439 | endosome localization(GO:0032439) |
| 0.1 | 0.3 | GO:0016240 | autophagosome docking(GO:0016240) |
| 0.1 | 0.9 | GO:0042670 | retinal cone cell differentiation(GO:0042670) retinal cone cell development(GO:0046549) |
| 0.1 | 0.5 | GO:0010265 | SCF complex assembly(GO:0010265) |
| 0.1 | 0.3 | GO:0097498 | endothelial tube lumen extension(GO:0097498) |
| 0.0 | 0.3 | GO:0044034 | negative stranded viral RNA replication(GO:0039689) multi-organism biosynthetic process(GO:0044034) |
| 0.0 | 0.5 | GO:0010724 | regulation of definitive erythrocyte differentiation(GO:0010724) |
| 0.0 | 1.0 | GO:1990118 | sodium ion import across plasma membrane(GO:0098719) sodium ion import into cell(GO:1990118) |
| 0.0 | 0.8 | GO:1990845 | adaptive thermogenesis(GO:1990845) |
| 0.0 | 0.5 | GO:0018401 | peptidyl-proline hydroxylation to 4-hydroxy-L-proline(GO:0018401) |
| 0.0 | 0.3 | GO:0061083 | regulation of protein refolding(GO:0061083) negative regulation of protein refolding(GO:0061084) |
| 0.0 | 0.4 | GO:0009597 | detection of virus(GO:0009597) |
| 0.0 | 0.4 | GO:0060136 | embryonic process involved in female pregnancy(GO:0060136) |
| 0.0 | 0.2 | GO:1903615 | regulation of protein tyrosine phosphatase activity(GO:1903613) positive regulation of protein tyrosine phosphatase activity(GO:1903615) |
| 0.0 | 0.1 | GO:0045196 | establishment or maintenance of neuroblast polarity(GO:0045196) establishment of neuroblast polarity(GO:0045200) |
| 0.0 | 0.3 | GO:0030860 | regulation of polarized epithelial cell differentiation(GO:0030860) |
| 0.0 | 0.3 | GO:0015888 | thiamine transport(GO:0015888) |
| 0.0 | 1.3 | GO:0001573 | ganglioside metabolic process(GO:0001573) |
| 0.0 | 1.1 | GO:0015671 | oxygen transport(GO:0015671) |
| 0.0 | 0.1 | GO:0006407 | rRNA export from nucleus(GO:0006407) |
| 0.0 | 1.3 | GO:0071850 | mitotic cell cycle arrest(GO:0071850) |
| 0.0 | 1.2 | GO:0090331 | negative regulation of platelet aggregation(GO:0090331) |
| 0.0 | 0.1 | GO:0071879 | positive regulation of adrenergic receptor signaling pathway(GO:0071879) |
| 0.0 | 0.6 | GO:0031580 | membrane raft polarization(GO:0001766) membrane raft distribution(GO:0031580) |
| 0.0 | 0.5 | GO:0008343 | adult feeding behavior(GO:0008343) |
| 0.0 | 0.8 | GO:1902514 | regulation of calcium ion transmembrane transport via high voltage-gated calcium channel(GO:1902514) |
| 0.0 | 0.5 | GO:0015693 | magnesium ion transport(GO:0015693) |
| 0.0 | 1.4 | GO:0032012 | regulation of ARF protein signal transduction(GO:0032012) |
| 0.0 | 0.8 | GO:0021796 | cerebral cortex regionalization(GO:0021796) |
| 0.0 | 0.8 | GO:0006853 | carnitine shuttle(GO:0006853) |
| 0.0 | 0.6 | GO:0090360 | platelet-derived growth factor production(GO:0090360) regulation of platelet-derived growth factor production(GO:0090361) |
| 0.0 | 0.1 | GO:0060279 | positive regulation of ovulation(GO:0060279) |
| 0.0 | 0.2 | GO:1900126 | negative regulation of hyaluronan biosynthetic process(GO:1900126) |
| 0.0 | 0.3 | GO:2000601 | positive regulation of Arp2/3 complex-mediated actin nucleation(GO:2000601) |
| 0.0 | 0.3 | GO:0015860 | purine nucleoside transmembrane transport(GO:0015860) |
| 0.0 | 0.1 | GO:0072720 | response to dithiothreitol(GO:0072720) |
| 0.0 | 0.3 | GO:0006657 | CDP-choline pathway(GO:0006657) |
| 0.0 | 1.2 | GO:0007184 | SMAD protein import into nucleus(GO:0007184) |
| 0.0 | 0.5 | GO:0003322 | pancreatic A cell development(GO:0003322) |
| 0.0 | 0.5 | GO:0021869 | forebrain ventricular zone progenitor cell division(GO:0021869) |
| 0.0 | 0.2 | GO:0007185 | transmembrane receptor protein tyrosine phosphatase signaling pathway(GO:0007185) |
| 0.0 | 0.5 | GO:0000290 | deadenylation-dependent decapping of nuclear-transcribed mRNA(GO:0000290) |
| 0.0 | 0.5 | GO:0070102 | interleukin-6-mediated signaling pathway(GO:0070102) |
| 0.0 | 0.3 | GO:0006686 | sphingomyelin biosynthetic process(GO:0006686) |
| 0.0 | 0.2 | GO:0014846 | esophagus smooth muscle contraction(GO:0014846) |
| 0.0 | 0.4 | GO:0097084 | vascular smooth muscle cell development(GO:0097084) |
| 0.0 | 0.3 | GO:0031577 | spindle checkpoint(GO:0031577) |
| 0.0 | 1.1 | GO:0008053 | mitochondrial fusion(GO:0008053) |
| 0.0 | 0.1 | GO:0017196 | N-terminal peptidyl-methionine acetylation(GO:0017196) |
| 0.0 | 0.4 | GO:0010909 | regulation of heparan sulfate proteoglycan biosynthetic process(GO:0010908) positive regulation of heparan sulfate proteoglycan biosynthetic process(GO:0010909) positive regulation of proteoglycan biosynthetic process(GO:1902730) |
| 0.0 | 0.7 | GO:0071420 | cellular response to histamine(GO:0071420) |
| 0.0 | 0.4 | GO:0048227 | plasma membrane to endosome transport(GO:0048227) |
| 0.0 | 0.4 | GO:0030043 | actin filament fragmentation(GO:0030043) |
| 0.0 | 0.1 | GO:0006227 | dUDP biosynthetic process(GO:0006227) dTDP biosynthetic process(GO:0006233) pyrimidine nucleoside diphosphate biosynthetic process(GO:0009139) pyrimidine deoxyribonucleoside diphosphate metabolic process(GO:0009196) pyrimidine deoxyribonucleoside diphosphate biosynthetic process(GO:0009197) dTDP metabolic process(GO:0046072) dUDP metabolic process(GO:0046077) |
| 0.0 | 0.2 | GO:0097338 | response to clozapine(GO:0097338) |
| 0.0 | 0.3 | GO:1904871 | regulation of protein localization to Cajal body(GO:1904869) positive regulation of protein localization to Cajal body(GO:1904871) |
| 0.0 | 0.1 | GO:0007506 | gonadal mesoderm development(GO:0007506) |
| 0.0 | 0.1 | GO:0072675 | osteoclast fusion(GO:0072675) |
| 0.0 | 0.1 | GO:0051697 | protein delipidation(GO:0051697) |
| 0.0 | 0.5 | GO:0071786 | endoplasmic reticulum tubular network organization(GO:0071786) |
| 0.0 | 0.2 | GO:0035871 | protein K11-linked deubiquitination(GO:0035871) |
| 0.0 | 0.4 | GO:0036158 | outer dynein arm assembly(GO:0036158) |
| 0.0 | 0.3 | GO:0070389 | chaperone cofactor-dependent protein refolding(GO:0070389) |
| 0.0 | 0.2 | GO:0007549 | dosage compensation(GO:0007549) dosage compensation by inactivation of X chromosome(GO:0009048) |
| 0.0 | 0.2 | GO:0046600 | negative regulation of centriole replication(GO:0046600) aggresome assembly(GO:0070842) |
| 0.0 | 0.2 | GO:2000042 | negative regulation of double-strand break repair via homologous recombination(GO:2000042) |
| 0.0 | 0.8 | GO:0010738 | regulation of protein kinase A signaling(GO:0010738) |
| 0.0 | 0.1 | GO:1990166 | protein localization to site of double-strand break(GO:1990166) |
| 0.0 | 0.2 | GO:0060012 | synaptic transmission, glycinergic(GO:0060012) |
| 0.0 | 0.0 | GO:0035790 | platelet-derived growth factor receptor-alpha signaling pathway(GO:0035790) |
| 0.0 | 0.6 | GO:0002091 | negative regulation of receptor internalization(GO:0002091) |
| 0.0 | 0.3 | GO:0006228 | UTP biosynthetic process(GO:0006228) |
| 0.0 | 0.4 | GO:0046130 | purine nucleoside catabolic process(GO:0006152) purine ribonucleoside catabolic process(GO:0046130) |
| 0.0 | 0.2 | GO:0032957 | inositol trisphosphate metabolic process(GO:0032957) |
| 0.0 | 0.7 | GO:0070536 | protein K63-linked deubiquitination(GO:0070536) |
| 0.0 | 0.3 | GO:1902916 | positive regulation of protein polyubiquitination(GO:1902916) |
| 0.0 | 0.9 | GO:0060292 | long term synaptic depression(GO:0060292) |
| 0.0 | 0.3 | GO:0090161 | Golgi ribbon formation(GO:0090161) |
| 0.0 | 0.3 | GO:0007253 | cytoplasmic sequestering of NF-kappaB(GO:0007253) |
| 0.0 | 0.2 | GO:0021902 | commitment of neuronal cell to specific neuron type in forebrain(GO:0021902) |
| 0.0 | 0.2 | GO:0001767 | establishment of lymphocyte polarity(GO:0001767) |
| 0.0 | 1.8 | GO:0010812 | negative regulation of cell-substrate adhesion(GO:0010812) |
| 0.0 | 0.4 | GO:0070886 | positive regulation of calcineurin-NFAT signaling cascade(GO:0070886) |
| 0.0 | 0.1 | GO:0044828 | negative regulation by host of viral genome replication(GO:0044828) |
| 0.0 | 0.2 | GO:0042347 | negative regulation of NF-kappaB import into nucleus(GO:0042347) |
| 0.0 | 0.7 | GO:0006376 | mRNA splice site selection(GO:0006376) |
| 0.0 | 0.5 | GO:0042276 | error-prone translesion synthesis(GO:0042276) |
| 0.0 | 0.1 | GO:0022027 | interkinetic nuclear migration(GO:0022027) |
| 0.0 | 0.7 | GO:0033120 | positive regulation of RNA splicing(GO:0033120) |
| 0.0 | 0.2 | GO:0042415 | norepinephrine metabolic process(GO:0042415) |
| 0.0 | 0.1 | GO:1902231 | positive regulation of intrinsic apoptotic signaling pathway in response to DNA damage(GO:1902231) |
| 0.0 | 0.6 | GO:0030262 | apoptotic nuclear changes(GO:0030262) |
| 0.0 | 0.7 | GO:1903861 | positive regulation of dendrite extension(GO:1903861) |
| 0.0 | 0.1 | GO:0051694 | pointed-end actin filament capping(GO:0051694) |
| 0.0 | 1.0 | GO:0045839 | negative regulation of mitotic nuclear division(GO:0045839) |
| 0.0 | 1.7 | GO:0006334 | nucleosome assembly(GO:0006334) |
| 0.0 | 1.0 | GO:0043392 | negative regulation of DNA binding(GO:0043392) |
| 0.0 | 0.2 | GO:0060573 | ventral spinal cord interneuron specification(GO:0021521) cell fate specification involved in pattern specification(GO:0060573) |
| 0.0 | 0.0 | GO:0060595 | mammary gland specification(GO:0060594) fibroblast growth factor receptor signaling pathway involved in mammary gland specification(GO:0060595) mammary gland bud formation(GO:0060615) branch elongation involved in salivary gland morphogenesis(GO:0060667) mesenchymal cell differentiation involved in lung development(GO:0060915) |
| 0.0 | 1.0 | GO:0048278 | vesicle docking(GO:0048278) |
| 0.0 | 0.2 | GO:0015886 | heme transport(GO:0015886) |
| 0.0 | 0.3 | GO:0042759 | long-chain fatty acid biosynthetic process(GO:0042759) |
| 0.0 | 0.7 | GO:0060612 | adipose tissue development(GO:0060612) |
| 0.0 | 0.1 | GO:0060979 | vasculogenesis involved in coronary vascular morphogenesis(GO:0060979) |
| 0.0 | 0.1 | GO:0035878 | nail development(GO:0035878) |
| 0.0 | 0.4 | GO:0008045 | motor neuron axon guidance(GO:0008045) |
Gene overrepresentation in cellular component category:
| Log-likelihood per target | Total log-likelihood | Term | Description |
|---|---|---|---|
| 0.4 | 2.9 | GO:0070032 | synaptobrevin 2-SNAP-25-syntaxin-1a-complexin I complex(GO:0070032) |
| 0.3 | 0.9 | GO:0034686 | integrin alphav-beta8 complex(GO:0034686) |
| 0.3 | 0.8 | GO:0048237 | rough endoplasmic reticulum lumen(GO:0048237) |
| 0.2 | 2.0 | GO:0032584 | growth cone membrane(GO:0032584) |
| 0.2 | 1.2 | GO:0048179 | activin receptor complex(GO:0048179) |
| 0.2 | 1.0 | GO:1990131 | Gtr1-Gtr2 GTPase complex(GO:1990131) |
| 0.1 | 2.7 | GO:0008074 | guanylate cyclase complex, soluble(GO:0008074) |
| 0.1 | 1.3 | GO:0044305 | calyx of Held(GO:0044305) |
| 0.1 | 0.9 | GO:0097149 | centralspindlin complex(GO:0097149) |
| 0.1 | 0.7 | GO:0030485 | smooth muscle contractile fiber(GO:0030485) |
| 0.1 | 1.1 | GO:0042567 | insulin-like growth factor ternary complex(GO:0042567) |
| 0.1 | 0.6 | GO:0005784 | Sec61 translocon complex(GO:0005784) translocon complex(GO:0071256) |
| 0.1 | 0.4 | GO:0070557 | PCNA-p21 complex(GO:0070557) |
| 0.1 | 1.4 | GO:0016600 | flotillin complex(GO:0016600) |
| 0.1 | 0.3 | GO:0097629 | extrinsic component of omegasome membrane(GO:0097629) |
| 0.1 | 0.5 | GO:0031467 | Cul7-RING ubiquitin ligase complex(GO:0031467) |
| 0.1 | 0.1 | GO:0043260 | laminin-11 complex(GO:0043260) |
| 0.1 | 1.0 | GO:0044354 | pinosome(GO:0044352) macropinosome(GO:0044354) |
| 0.1 | 1.1 | GO:0000815 | ESCRT III complex(GO:0000815) |
| 0.1 | 0.3 | GO:0044214 | spanning component of plasma membrane(GO:0044214) spanning component of membrane(GO:0089717) |
| 0.1 | 1.0 | GO:0097427 | microtubule bundle(GO:0097427) |
| 0.0 | 0.7 | GO:0030478 | actin cap(GO:0030478) |
| 0.0 | 1.1 | GO:0005916 | fascia adherens(GO:0005916) |
| 0.0 | 2.4 | GO:0033268 | node of Ranvier(GO:0033268) |
| 0.0 | 0.4 | GO:0016011 | dystroglycan complex(GO:0016011) sarcoglycan complex(GO:0016012) |
| 0.0 | 0.6 | GO:0072546 | ER membrane protein complex(GO:0072546) |
| 0.0 | 0.3 | GO:0000308 | cytoplasmic cyclin-dependent protein kinase holoenzyme complex(GO:0000308) |
| 0.0 | 1.0 | GO:0034045 | pre-autophagosomal structure membrane(GO:0034045) |
| 0.0 | 1.2 | GO:0031362 | anchored component of external side of plasma membrane(GO:0031362) |
| 0.0 | 0.4 | GO:0036157 | outer dynein arm(GO:0036157) |
| 0.0 | 0.3 | GO:1990682 | CSF1-CSF1R complex(GO:1990682) |
| 0.0 | 0.4 | GO:0031233 | intrinsic component of external side of plasma membrane(GO:0031233) |
| 0.0 | 0.5 | GO:0044233 | ER-mitochondrion membrane contact site(GO:0044233) |
| 0.0 | 0.2 | GO:1990498 | mitotic spindle microtubule(GO:1990498) |
| 0.0 | 0.8 | GO:0032433 | filopodium tip(GO:0032433) |
| 0.0 | 0.6 | GO:0097433 | dense body(GO:0097433) |
| 0.0 | 1.8 | GO:1990752 | microtubule end(GO:1990752) |
| 0.0 | 1.4 | GO:0090545 | NuRD complex(GO:0016581) CHD-type complex(GO:0090545) |
| 0.0 | 0.6 | GO:0035253 | ciliary rootlet(GO:0035253) |
| 0.0 | 1.0 | GO:0005942 | phosphatidylinositol 3-kinase complex(GO:0005942) |
| 0.0 | 1.1 | GO:0042629 | mast cell granule(GO:0042629) |
| 0.0 | 3.2 | GO:0043195 | terminal bouton(GO:0043195) |
| 0.0 | 0.2 | GO:0000120 | RNA polymerase I transcription factor complex(GO:0000120) |
| 0.0 | 0.3 | GO:0001939 | female pronucleus(GO:0001939) |
| 0.0 | 1.4 | GO:0043034 | costamere(GO:0043034) |
| 0.0 | 0.4 | GO:0043083 | synaptic cleft(GO:0043083) |
| 0.0 | 2.2 | GO:0032154 | cleavage furrow(GO:0032154) cell surface furrow(GO:0097610) |
| 0.0 | 0.2 | GO:0030891 | VCB complex(GO:0030891) |
| 0.0 | 0.1 | GO:0033596 | TSC1-TSC2 complex(GO:0033596) |
| 0.0 | 0.3 | GO:0070187 | telosome(GO:0070187) |
| 0.0 | 0.3 | GO:0031209 | SCAR complex(GO:0031209) |
| 0.0 | 0.2 | GO:0005818 | astral microtubule(GO:0000235) aster(GO:0005818) |
| 0.0 | 0.7 | GO:0031235 | intrinsic component of the cytoplasmic side of the plasma membrane(GO:0031235) |
| 0.0 | 0.3 | GO:0030056 | hemidesmosome(GO:0030056) |
| 0.0 | 0.6 | GO:0030122 | AP-2 adaptor complex(GO:0030122) |
| 0.0 | 0.1 | GO:0031417 | NatC complex(GO:0031417) |
| 0.0 | 0.5 | GO:0000145 | exocyst(GO:0000145) |
| 0.0 | 1.3 | GO:0030173 | integral component of Golgi membrane(GO:0030173) |
| 0.0 | 1.0 | GO:0031201 | SNARE complex(GO:0031201) |
| 0.0 | 0.7 | GO:1902711 | GABA-A receptor complex(GO:1902711) |
| 0.0 | 0.5 | GO:0005614 | interstitial matrix(GO:0005614) |
| 0.0 | 0.2 | GO:0071203 | WASH complex(GO:0071203) |
| 0.0 | 0.0 | GO:0075341 | host cell PML body(GO:0075341) |
| 0.0 | 1.6 | GO:0031903 | peroxisomal membrane(GO:0005778) microbody membrane(GO:0031903) |
| 0.0 | 0.4 | GO:0005868 | cytoplasmic dynein complex(GO:0005868) |
| 0.0 | 0.3 | GO:0005832 | chaperonin-containing T-complex(GO:0005832) |
| 0.0 | 1.0 | GO:0005881 | cytoplasmic microtubule(GO:0005881) |
| 0.0 | 2.4 | GO:0005875 | microtubule associated complex(GO:0005875) |
| 0.0 | 1.7 | GO:0034704 | calcium channel complex(GO:0034704) |
| 0.0 | 0.1 | GO:0031313 | extrinsic component of endosome membrane(GO:0031313) |
| 0.0 | 0.5 | GO:0071782 | endoplasmic reticulum tubular network(GO:0071782) |
Gene overrepresentation in molecular function category:
| Log-likelihood per target | Total log-likelihood | Term | Description |
|---|---|---|---|
| 0.4 | 1.3 | GO:0038100 | nodal binding(GO:0038100) |
| 0.2 | 1.6 | GO:0008273 | calcium, potassium:sodium antiporter activity(GO:0008273) |
| 0.2 | 1.4 | GO:0015183 | L-aspartate transmembrane transporter activity(GO:0015183) |
| 0.2 | 2.0 | GO:0035727 | lysophosphatidic acid binding(GO:0035727) |
| 0.2 | 0.8 | GO:0017077 | oxidative phosphorylation uncoupler activity(GO:0017077) |
| 0.2 | 0.8 | GO:0061628 | H3K27me3 modified histone binding(GO:0061628) |
| 0.2 | 0.9 | GO:1990430 | extracellular matrix protein binding(GO:1990430) |
| 0.2 | 0.8 | GO:0004157 | dihydropyrimidinase activity(GO:0004157) |
| 0.2 | 1.5 | GO:0005052 | peroxisome matrix targeting signal-1 binding(GO:0005052) |
| 0.2 | 1.2 | GO:0005499 | vitamin D binding(GO:0005499) |
| 0.2 | 0.8 | GO:1903135 | cupric ion binding(GO:1903135) |
| 0.2 | 0.9 | GO:0034714 | type III transforming growth factor beta receptor binding(GO:0034714) |
| 0.2 | 1.2 | GO:0035368 | selenocysteine insertion sequence binding(GO:0035368) |
| 0.1 | 1.1 | GO:0004614 | phosphoglucomutase activity(GO:0004614) |
| 0.1 | 0.8 | GO:0031708 | endothelin B receptor binding(GO:0031708) |
| 0.1 | 0.4 | GO:0004021 | L-alanine:2-oxoglutarate aminotransferase activity(GO:0004021) alanine-oxo-acid transaminase activity(GO:0047635) |
| 0.1 | 2.7 | GO:0004383 | guanylate cyclase activity(GO:0004383) |
| 0.1 | 0.6 | GO:0052654 | branched-chain-amino-acid transaminase activity(GO:0004084) L-leucine transaminase activity(GO:0052654) L-valine transaminase activity(GO:0052655) L-isoleucine transaminase activity(GO:0052656) |
| 0.1 | 1.1 | GO:0043426 | MRF binding(GO:0043426) |
| 0.1 | 3.3 | GO:0042813 | Wnt-activated receptor activity(GO:0042813) |
| 0.1 | 1.1 | GO:0086075 | gap junction channel activity involved in cardiac conduction electrical coupling(GO:0086075) |
| 0.1 | 0.5 | GO:0005169 | neurotrophin TRKB receptor binding(GO:0005169) |
| 0.1 | 0.4 | GO:0072320 | volume-sensitive chloride channel activity(GO:0072320) |
| 0.1 | 0.9 | GO:1904288 | BAT3 complex binding(GO:1904288) |
| 0.1 | 0.4 | GO:0047676 | arachidonate-CoA ligase activity(GO:0047676) |
| 0.1 | 2.8 | GO:0008191 | metalloendopeptidase inhibitor activity(GO:0008191) |
| 0.1 | 0.5 | GO:0003963 | RNA-3'-phosphate cyclase activity(GO:0003963) |
| 0.1 | 5.9 | GO:0017075 | syntaxin-1 binding(GO:0017075) |
| 0.1 | 0.8 | GO:0001517 | N-acetylglucosamine 6-O-sulfotransferase activity(GO:0001517) |
| 0.1 | 0.3 | GO:0071987 | WD40-repeat domain binding(GO:0071987) |
| 0.1 | 0.8 | GO:0005237 | inhibitory extracellular ligand-gated ion channel activity(GO:0005237) |
| 0.1 | 1.1 | GO:0031995 | insulin-like growth factor II binding(GO:0031995) |
| 0.1 | 0.6 | GO:0008467 | [heparan sulfate]-glucosamine 3-sulfotransferase 1 activity(GO:0008467) |
| 0.1 | 0.2 | GO:0052825 | inositol tetrakisphosphate 1-kinase activity(GO:0047325) inositol-1,3,4-trisphosphate 6-kinase activity(GO:0052725) inositol-1,3,4-trisphosphate 5-kinase activity(GO:0052726) inositol-1,3,4,5,6-pentakisphosphate 1-phosphatase activity(GO:0052825) inositol-1,3,4,6-tetrakisphosphate 6-phosphatase activity(GO:0052830) inositol-1,3,4,6-tetrakisphosphate 1-phosphatase activity(GO:0052831) inositol-3,4,6-trisphosphate 1-kinase activity(GO:0052835) |
| 0.1 | 0.3 | GO:0051185 | coenzyme transporter activity(GO:0051185) |
| 0.1 | 0.4 | GO:0019912 | cyclin-dependent protein kinase activating kinase activity(GO:0019912) |
| 0.1 | 1.4 | GO:0004716 | receptor signaling protein tyrosine kinase activity(GO:0004716) |
| 0.1 | 1.1 | GO:0000182 | rDNA binding(GO:0000182) |
| 0.1 | 1.0 | GO:0035005 | 1-phosphatidylinositol-4-phosphate 3-kinase activity(GO:0035005) |
| 0.1 | 0.3 | GO:0033300 | dehydroascorbic acid transporter activity(GO:0033300) |
| 0.1 | 0.2 | GO:0008892 | guanine deaminase activity(GO:0008892) |
| 0.1 | 0.3 | GO:0004605 | diacylglycerol cholinephosphotransferase activity(GO:0004142) phosphatidate cytidylyltransferase activity(GO:0004605) |
| 0.1 | 1.0 | GO:0045504 | dynein heavy chain binding(GO:0045504) |
| 0.1 | 0.3 | GO:0050220 | prostaglandin-E synthase activity(GO:0050220) |
| 0.1 | 1.0 | GO:0022821 | potassium ion antiporter activity(GO:0022821) |
| 0.1 | 0.5 | GO:0031849 | olfactory receptor binding(GO:0031849) |
| 0.1 | 0.5 | GO:0003828 | alpha-N-acetylneuraminate alpha-2,8-sialyltransferase activity(GO:0003828) |
| 0.1 | 2.0 | GO:0005545 | 1-phosphatidylinositol binding(GO:0005545) |
| 0.0 | 0.2 | GO:0017153 | sodium:dicarboxylate symporter activity(GO:0017153) |
| 0.0 | 1.1 | GO:0005344 | oxygen transporter activity(GO:0005344) |
| 0.0 | 0.5 | GO:0017040 | ceramidase activity(GO:0017040) |
| 0.0 | 0.3 | GO:0033188 | sphingomyelin synthase activity(GO:0033188) ceramide cholinephosphotransferase activity(GO:0047493) |
| 0.0 | 0.9 | GO:0070324 | thyroid hormone binding(GO:0070324) |
| 0.0 | 0.4 | GO:0048408 | epidermal growth factor binding(GO:0048408) |
| 0.0 | 0.9 | GO:0051011 | microtubule minus-end binding(GO:0051011) |
| 0.0 | 0.5 | GO:0038132 | neuregulin binding(GO:0038132) |
| 0.0 | 0.4 | GO:0051766 | inositol trisphosphate kinase activity(GO:0051766) |
| 0.0 | 0.1 | GO:0015275 | stretch-activated, cation-selective, calcium channel activity(GO:0015275) |
| 0.0 | 1.0 | GO:0035256 | G-protein coupled glutamate receptor binding(GO:0035256) |
| 0.0 | 0.4 | GO:0030160 | GKAP/Homer scaffold activity(GO:0030160) |
| 0.0 | 0.5 | GO:0016413 | O-acetyltransferase activity(GO:0016413) |
| 0.0 | 0.9 | GO:0052629 | phosphatidylinositol-3,5-bisphosphate 3-phosphatase activity(GO:0052629) |
| 0.0 | 0.3 | GO:0005157 | macrophage colony-stimulating factor receptor binding(GO:0005157) |
| 0.0 | 0.1 | GO:0033862 | UMP kinase activity(GO:0033862) |
| 0.0 | 0.6 | GO:0005004 | GPI-linked ephrin receptor activity(GO:0005004) |
| 0.0 | 0.2 | GO:0005105 | type 1 fibroblast growth factor receptor binding(GO:0005105) |
| 0.0 | 0.4 | GO:0016286 | small conductance calcium-activated potassium channel activity(GO:0016286) |
| 0.0 | 0.7 | GO:0017147 | Wnt-protein binding(GO:0017147) |
| 0.0 | 1.7 | GO:0005086 | ARF guanyl-nucleotide exchange factor activity(GO:0005086) |
| 0.0 | 0.5 | GO:0070700 | BMP receptor binding(GO:0070700) |
| 0.0 | 0.9 | GO:0031698 | beta-2 adrenergic receptor binding(GO:0031698) |
| 0.0 | 0.6 | GO:0019911 | structural constituent of myelin sheath(GO:0019911) |
| 0.0 | 0.3 | GO:0003964 | telomerase activity(GO:0003720) RNA-directed DNA polymerase activity(GO:0003964) |
| 0.0 | 0.5 | GO:0031545 | peptidyl-proline 4-dioxygenase activity(GO:0031545) |
| 0.0 | 0.7 | GO:0008574 | ATP-dependent microtubule motor activity, plus-end-directed(GO:0008574) |
| 0.0 | 0.6 | GO:0004000 | adenosine deaminase activity(GO:0004000) |
| 0.0 | 1.3 | GO:0005484 | SNAP receptor activity(GO:0005484) |
| 0.0 | 0.4 | GO:0022889 | L-serine transmembrane transporter activity(GO:0015194) serine transmembrane transporter activity(GO:0022889) |
| 0.0 | 1.1 | GO:0030159 | receptor signaling complex scaffold activity(GO:0030159) |
| 0.0 | 0.5 | GO:0015095 | magnesium ion transmembrane transporter activity(GO:0015095) |
| 0.0 | 0.8 | GO:0017160 | Ral GTPase binding(GO:0017160) |
| 0.0 | 1.2 | GO:0015020 | glucuronosyltransferase activity(GO:0015020) |
| 0.0 | 0.8 | GO:0051010 | microtubule plus-end binding(GO:0051010) |
| 0.0 | 0.8 | GO:0005001 | transmembrane receptor protein tyrosine phosphatase activity(GO:0005001) transmembrane receptor protein phosphatase activity(GO:0019198) |
| 0.0 | 0.1 | GO:0016005 | phospholipase A2 activator activity(GO:0016005) |
| 0.0 | 0.1 | GO:0004105 | choline-phosphate cytidylyltransferase activity(GO:0004105) |
| 0.0 | 0.3 | GO:0000774 | adenyl-nucleotide exchange factor activity(GO:0000774) |
| 0.0 | 0.5 | GO:0015643 | toxic substance binding(GO:0015643) |
| 0.0 | 0.3 | GO:0035612 | AP-2 adaptor complex binding(GO:0035612) |
| 0.0 | 0.6 | GO:0042043 | neurexin family protein binding(GO:0042043) |
| 0.0 | 0.9 | GO:0043015 | gamma-tubulin binding(GO:0043015) |
| 0.0 | 0.6 | GO:0051428 | peptide hormone receptor binding(GO:0051428) |
| 0.0 | 0.3 | GO:0031957 | very long-chain fatty acid-CoA ligase activity(GO:0031957) |
| 0.0 | 0.8 | GO:0031210 | phosphatidylcholine binding(GO:0031210) |
| 0.0 | 0.3 | GO:0004551 | nucleotide diphosphatase activity(GO:0004551) |
| 0.0 | 0.2 | GO:0008449 | N-acetylglucosamine-6-sulfatase activity(GO:0008449) |
| 0.0 | 0.9 | GO:0003785 | actin monomer binding(GO:0003785) |
| 0.0 | 0.6 | GO:0034237 | protein kinase A regulatory subunit binding(GO:0034237) |
| 0.0 | 0.2 | GO:0098505 | G-rich strand telomeric DNA binding(GO:0098505) |
| 0.0 | 0.6 | GO:0008327 | methyl-CpG binding(GO:0008327) |
| 0.0 | 1.5 | GO:0032947 | protein complex scaffold(GO:0032947) |
| 0.0 | 0.3 | GO:0042809 | vitamin D receptor binding(GO:0042809) |
| 0.0 | 0.4 | GO:0019870 | potassium channel inhibitor activity(GO:0019870) |
| 0.0 | 0.4 | GO:0003993 | acid phosphatase activity(GO:0003993) |
| 0.0 | 0.5 | GO:0070064 | proline-rich region binding(GO:0070064) |
| 0.0 | 0.2 | GO:0033592 | RNA strand annealing activity(GO:0033592) |
| 0.0 | 0.1 | GO:0005173 | stem cell factor receptor binding(GO:0005173) |
| 0.0 | 0.2 | GO:0046920 | alpha-(1->3)-fucosyltransferase activity(GO:0046920) |
| 0.0 | 0.1 | GO:0097108 | hedgehog family protein binding(GO:0097108) |
| 0.0 | 0.1 | GO:0060002 | plus-end directed microfilament motor activity(GO:0060002) |
| 0.0 | 0.2 | GO:0015232 | heme transporter activity(GO:0015232) |
| 0.0 | 4.9 | GO:0008017 | microtubule binding(GO:0008017) |
| 0.0 | 0.2 | GO:0032051 | clathrin light chain binding(GO:0032051) |
| 0.0 | 0.0 | GO:0005111 | type 2 fibroblast growth factor receptor binding(GO:0005111) |
| 0.0 | 0.3 | GO:0000062 | fatty-acyl-CoA binding(GO:0000062) |
| 0.0 | 0.1 | GO:0016176 | superoxide-generating NADPH oxidase activator activity(GO:0016176) |
| 0.0 | 0.3 | GO:0005176 | ErbB-2 class receptor binding(GO:0005176) |
| 0.0 | 0.8 | GO:0030971 | receptor tyrosine kinase binding(GO:0030971) |
| 0.0 | 2.8 | GO:0017124 | SH3 domain binding(GO:0017124) |
| 0.0 | 0.4 | GO:0005251 | delayed rectifier potassium channel activity(GO:0005251) |
| 0.0 | 0.1 | GO:0003876 | AMP deaminase activity(GO:0003876) adenosine-phosphate deaminase activity(GO:0047623) |
| 0.0 | 0.1 | GO:0015277 | kainate selective glutamate receptor activity(GO:0015277) |
| 0.0 | 0.1 | GO:0017176 | phosphatidylinositol N-acetylglucosaminyltransferase activity(GO:0017176) |
| 0.0 | 0.1 | GO:0015220 | choline transmembrane transporter activity(GO:0015220) |
| 0.0 | 0.4 | GO:0030742 | GTP-dependent protein binding(GO:0030742) |
Gene overrepresentation in curated gene sets: canonical pathways category:
| Log-likelihood per target | Total log-likelihood | Term | Description |
|---|---|---|---|
| 0.1 | 0.8 | PID GLYPICAN 1PATHWAY | Glypican 1 network |
| 0.1 | 2.5 | PID LPA4 PATHWAY | LPA4-mediated signaling events |
| 0.1 | 0.4 | ST PAC1 RECEPTOR PATHWAY | PAC1 Receptor Pathway |
| 0.1 | 1.6 | ST G ALPHA S PATHWAY | G alpha s Pathway |
| 0.0 | 2.9 | PID LIS1 PATHWAY | Lissencephaly gene (LIS1) in neuronal migration and development |
| 0.0 | 0.6 | PID EPHA FWDPATHWAY | EPHA forward signaling |
| 0.0 | 3.1 | PID NCADHERIN PATHWAY | N-cadherin signaling events |
| 0.0 | 2.4 | NABA PROTEOGLYCANS | Genes encoding proteoglycans |
| 0.0 | 1.3 | PID CONE PATHWAY | Visual signal transduction: Cones |
| 0.0 | 2.7 | SIG REGULATION OF THE ACTIN CYTOSKELETON BY RHO GTPASES | Genes related to regulation of the actin cytoskeleton |
| 0.0 | 3.2 | PID ERBB1 INTERNALIZATION PATHWAY | Internalization of ErbB1 |
| 0.0 | 1.0 | PID HEDGEHOG 2PATHWAY | Signaling events mediated by the Hedgehog family |
| 0.0 | 1.2 | PID P38 MKK3 6PATHWAY | p38 MAPK signaling pathway |
| 0.0 | 0.4 | SA G2 AND M PHASES | Cdc25 activates the cdc2/cyclin B complex to induce the G2/M transition. |
| 0.0 | 1.3 | PID PI3K PLC TRK PATHWAY | Trk receptor signaling mediated by PI3K and PLC-gamma |
| 0.0 | 0.7 | ST GA12 PATHWAY | G alpha 12 Pathway |
| 0.0 | 2.5 | PID HIF1 TFPATHWAY | HIF-1-alpha transcription factor network |
| 0.0 | 1.5 | PID MTOR 4PATHWAY | mTOR signaling pathway |
| 0.0 | 0.1 | SIG IL4RECEPTOR IN B LYPHOCYTES | Genes related to IL4 rceptor signaling in B lymphocytes |
| 0.0 | 1.1 | PID ARF6 PATHWAY | Arf6 signaling events |
| 0.0 | 0.5 | PID EPHB FWD PATHWAY | EPHB forward signaling |
| 0.0 | 0.3 | PID IL8 CXCR1 PATHWAY | IL8- and CXCR1-mediated signaling events |
| 0.0 | 0.2 | PID ECADHERIN NASCENT AJ PATHWAY | E-cadherin signaling in the nascent adherens junction |
| 0.0 | 0.9 | PID RAC1 PATHWAY | RAC1 signaling pathway |
| 0.0 | 0.5 | PID ERBB2 ERBB3 PATHWAY | ErbB2/ErbB3 signaling events |
| 0.0 | 0.8 | NABA BASEMENT MEMBRANES | Genes encoding structural components of basement membranes |
Gene overrepresentation in curated gene sets: REACTOME pathways category:
| Log-likelihood per target | Total log-likelihood | Term | Description |
|---|---|---|---|
| 0.1 | 4.2 | REACTOME PROTEOLYTIC CLEAVAGE OF SNARE COMPLEX PROTEINS | Genes involved in Proteolytic cleavage of SNARE complex proteins |
| 0.1 | 2.7 | REACTOME ADENYLATE CYCLASE ACTIVATING PATHWAY | Genes involved in Adenylate cyclase activating pathway |
| 0.0 | 1.3 | REACTOME GAP JUNCTION DEGRADATION | Genes involved in Gap junction degradation |
| 0.0 | 1.1 | REACTOME REGULATION OF INSULIN LIKE GROWTH FACTOR IGF ACTIVITY BY INSULIN LIKE GROWTH FACTOR BINDING PROTEINS IGFBPS | Genes involved in Regulation of Insulin-like Growth Factor (IGF) Activity by Insulin-like Growth Factor Binding Proteins (IGFBPs) |
| 0.0 | 1.0 | REACTOME REGULATION OF SIGNALING BY CBL | Genes involved in Regulation of signaling by CBL |
| 0.0 | 0.7 | REACTOME SHC MEDIATED SIGNALLING | Genes involved in SHC-mediated signalling |
| 0.0 | 1.0 | REACTOME REGULATION OF KIT SIGNALING | Genes involved in Regulation of KIT signaling |
| 0.0 | 1.3 | REACTOME SIGNALING BY NODAL | Genes involved in Signaling by NODAL |
| 0.0 | 0.7 | REACTOME RAS ACTIVATION UOPN CA2 INFUX THROUGH NMDA RECEPTOR | Genes involved in Ras activation uopn Ca2+ infux through NMDA receptor |
| 0.0 | 0.4 | REACTOME AKT PHOSPHORYLATES TARGETS IN THE CYTOSOL | Genes involved in AKT phosphorylates targets in the cytosol |
| 0.0 | 0.3 | REACTOME REGULATION OF INSULIN SECRETION BY ACETYLCHOLINE | Genes involved in Regulation of Insulin Secretion by Acetylcholine |
| 0.0 | 0.7 | REACTOME DCC MEDIATED ATTRACTIVE SIGNALING | Genes involved in DCC mediated attractive signaling |
| 0.0 | 0.3 | REACTOME PACKAGING OF TELOMERE ENDS | Genes involved in Packaging Of Telomere Ends |
| 0.0 | 1.0 | REACTOME OXYGEN DEPENDENT PROLINE HYDROXYLATION OF HYPOXIA INDUCIBLE FACTOR ALPHA | Genes involved in Oxygen-dependent Proline Hydroxylation of Hypoxia-inducible Factor Alpha |
| 0.0 | 0.7 | REACTOME ACTIVATION OF RAC | Genes involved in Activation of Rac |
| 0.0 | 0.4 | REACTOME ROLE OF DCC IN REGULATING APOPTOSIS | Genes involved in Role of DCC in regulating apoptosis |
| 0.0 | 0.6 | REACTOME BRANCHED CHAIN AMINO ACID CATABOLISM | Genes involved in Branched-chain amino acid catabolism |
| 0.0 | 1.4 | REACTOME MITOCHONDRIAL PROTEIN IMPORT | Genes involved in Mitochondrial Protein Import |
| 0.0 | 0.7 | REACTOME ENDOSOMAL SORTING COMPLEX REQUIRED FOR TRANSPORT ESCRT | Genes involved in Endosomal Sorting Complex Required For Transport (ESCRT) |
| 0.0 | 0.6 | REACTOME EGFR DOWNREGULATION | Genes involved in EGFR downregulation |
| 0.0 | 0.6 | REACTOME RECYCLING PATHWAY OF L1 | Genes involved in Recycling pathway of L1 |
| 0.0 | 0.8 | REACTOME SIGNALING BY ROBO RECEPTOR | Genes involved in Signaling by Robo receptor |
| 0.0 | 0.9 | REACTOME KINESINS | Genes involved in Kinesins |
| 0.0 | 1.3 | REACTOME TRAFFICKING OF AMPA RECEPTORS | Genes involved in Trafficking of AMPA receptors |
| 0.0 | 0.3 | REACTOME N GLYCAN ANTENNAE ELONGATION | Genes involved in N-Glycan antennae elongation |
| 0.0 | 0.7 | REACTOME KERATAN SULFATE BIOSYNTHESIS | Genes involved in Keratan sulfate biosynthesis |
| 0.0 | 1.1 | REACTOME DARPP 32 EVENTS | Genes involved in DARPP-32 events |
| 0.0 | 0.4 | REACTOME INSULIN SYNTHESIS AND PROCESSING | Genes involved in Insulin Synthesis and Processing |
| 0.0 | 0.7 | REACTOME GABA A RECEPTOR ACTIVATION | Genes involved in GABA A receptor activation |
| 0.0 | 0.2 | REACTOME LIGAND GATED ION CHANNEL TRANSPORT | Genes involved in Ligand-gated ion channel transport |
| 0.0 | 0.6 | REACTOME DOWNREGULATION OF ERBB2 ERBB3 SIGNALING | Genes involved in Downregulation of ERBB2:ERBB3 signaling |
| 0.0 | 0.3 | REACTOME SIGNALING BY EGFR IN CANCER | Genes involved in Signaling by EGFR in Cancer |
| 0.0 | 0.5 | REACTOME DEGRADATION OF THE EXTRACELLULAR MATRIX | Genes involved in Degradation of the extracellular matrix |
| 0.0 | 0.2 | REACTOME REMOVAL OF THE FLAP INTERMEDIATE FROM THE C STRAND | Genes involved in Removal of the Flap Intermediate from the C-strand |
| 0.0 | 0.5 | REACTOME PROLACTIN RECEPTOR SIGNALING | Genes involved in Prolactin receptor signaling |
| 0.0 | 0.4 | REACTOME PURINE SALVAGE | Genes involved in Purine salvage |
| 0.0 | 0.5 | REACTOME SYNTHESIS SECRETION AND INACTIVATION OF GIP | Genes involved in Synthesis, Secretion, and Inactivation of Glucose-dependent Insulinotropic Polypeptide (GIP) |
| 0.0 | 0.4 | REACTOME AMINO ACID SYNTHESIS AND INTERCONVERSION TRANSAMINATION | Genes involved in Amino acid synthesis and interconversion (transamination) |
| 0.0 | 1.1 | REACTOME ACTIVATION OF CHAPERONE GENES BY XBP1S | Genes involved in Activation of Chaperone Genes by XBP1(S) |
| 0.0 | 0.3 | REACTOME FACILITATIVE NA INDEPENDENT GLUCOSE TRANSPORTERS | Genes involved in Facilitative Na+-independent glucose transporters |
| 0.0 | 0.4 | REACTOME FORMATION OF FIBRIN CLOT CLOTTING CASCADE | Genes involved in Formation of Fibrin Clot (Clotting Cascade) |
| 0.0 | 0.2 | REACTOME BILE SALT AND ORGANIC ANION SLC TRANSPORTERS | Genes involved in Bile salt and organic anion SLC transporters |
| 0.0 | 0.5 | REACTOME SPHINGOLIPID DE NOVO BIOSYNTHESIS | Genes involved in Sphingolipid de novo biosynthesis |
| 0.0 | 0.2 | REACTOME PURINE CATABOLISM | Genes involved in Purine catabolism |
| 0.0 | 2.2 | REACTOME TRANSPORT OF INORGANIC CATIONS ANIONS AND AMINO ACIDS OLIGOPEPTIDES | Genes involved in Transport of inorganic cations/anions and amino acids/oligopeptides |