Project
Illumina Body Map 2 (GSE30611)
Navigation
Downloads
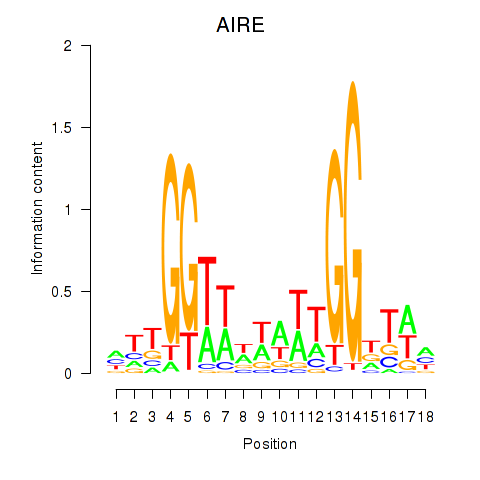
Results for AIRE
Z-value: 0.80
Motif logo
Transcription factors associated with AIRE
| Gene Symbol | Gene ID | Gene Info |
|---|---|---|
|
AIRE
|
ENSG00000160224.17 | autoimmune regulator |
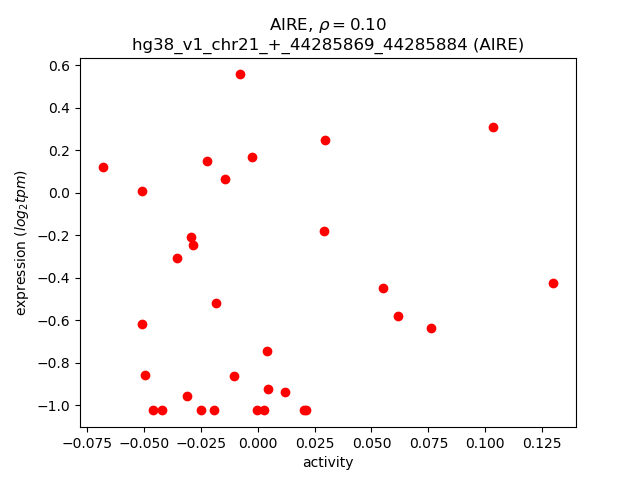
Activity-expression correlation:
| Gene | Promoter | Pearson corr. coef. | P-value | Plot |
|---|---|---|---|---|
| AIRE | hg38_v1_chr21_+_44285869_44285884 | 0.10 | 5.9e-01 | Click! |
Activity profile of AIRE motif
Sorted Z-values of AIRE motif
| Promoter | Log-likelihood | Transcript | Gene | Gene Info |
|---|---|---|---|---|
| chr8_-_24956604 | 4.42 |
ENST00000610854.2
|
NEFL
|
neurofilament light |
| chr12_+_75480800 | 3.31 |
ENST00000456650.7
|
GLIPR1
|
GLI pathogenesis related 1 |
| chrX_-_140784366 | 2.98 |
ENST00000674533.1
|
CDR1
|
cerebellar degeneration related protein 1 |
| chr6_-_31546552 | 2.73 |
ENST00000303892.10
ENST00000376151.4 |
ATP6V1G2
|
ATPase H+ transporting V1 subunit G2 |
| chr2_-_240820945 | 2.56 |
ENST00000428768.2
ENST00000650053.1 ENST00000650130.1 |
KIF1A
|
kinesin family member 1A |
| chr12_+_75480745 | 2.20 |
ENST00000266659.8
|
GLIPR1
|
GLI pathogenesis related 1 |
| chr15_+_51751587 | 2.16 |
ENST00000539962.6
ENST00000249700.9 |
TMOD2
|
tropomodulin 2 |
| chr12_-_62192762 | 2.15 |
ENST00000416284.8
|
TAFA2
|
TAFA chemokine like family member 2 |
| chr12_+_75481204 | 2.15 |
ENST00000550491.1
|
GLIPR1
|
GLI pathogenesis related 1 |
| chr6_-_31546716 | 1.99 |
ENST00000483251.1
|
ATP6V1G2
|
ATPase H+ transporting V1 subunit G2 |
| chr17_-_40565459 | 1.92 |
ENST00000578085.1
ENST00000246657.2 |
CCR7
|
C-C motif chemokine receptor 7 |
| chr3_+_46370854 | 1.90 |
ENST00000292303.4
|
CCR5
|
C-C motif chemokine receptor 5 |
| chr10_-_96359273 | 1.85 |
ENST00000393871.5
ENST00000419479.5 ENST00000393870.3 |
OPALIN
|
oligodendrocytic myelin paranodal and inner loop protein |
| chr1_+_40374648 | 1.74 |
ENST00000372708.5
|
SMAP2
|
small ArfGAP2 |
| chr7_-_36724457 | 1.73 |
ENST00000617537.5
ENST00000435386.1 |
AOAH
|
acyloxyacyl hydrolase |
| chr7_-_36724380 | 1.64 |
ENST00000617267.4
|
AOAH
|
acyloxyacyl hydrolase |
| chr2_-_224947030 | 1.63 |
ENST00000409592.7
|
DOCK10
|
dedicator of cytokinesis 10 |
| chr7_-_36724543 | 1.57 |
ENST00000612871.4
|
AOAH
|
acyloxyacyl hydrolase |
| chr19_-_23687163 | 1.55 |
ENST00000601010.5
ENST00000601935.5 ENST00000600313.5 ENST00000596211.5 ENST00000359788.9 ENST00000599168.1 |
ZNF675
|
zinc finger protein 675 |
| chr12_-_6470667 | 1.52 |
ENST00000361716.8
ENST00000396308.4 |
VAMP1
|
vesicle associated membrane protein 1 |
| chr14_-_106511856 | 1.46 |
ENST00000390622.2
|
IGHV1-46
|
immunoglobulin heavy variable 1-46 |
| chr20_+_59628609 | 1.38 |
ENST00000541461.5
|
PHACTR3
|
phosphatase and actin regulator 3 |
| chr12_+_20695553 | 1.29 |
ENST00000545102.1
|
SLCO1C1
|
solute carrier organic anion transporter family member 1C1 |
| chr12_-_6470643 | 1.27 |
ENST00000535180.5
ENST00000400911.7 |
VAMP1
|
vesicle associated membrane protein 1 |
| chr12_-_75209701 | 1.27 |
ENST00000350228.6
ENST00000298972.5 |
KCNC2
|
potassium voltage-gated channel subfamily C member 2 |
| chr13_-_29586788 | 1.26 |
ENST00000450494.1
|
SLC7A1
|
solute carrier family 7 member 1 |
| chr3_-_49429252 | 1.25 |
ENST00000615713.4
|
NICN1
|
nicolin 1 |
| chr15_-_51751525 | 1.18 |
ENST00000454181.6
|
LYSMD2
|
LysM domain containing 2 |
| chr20_+_46008900 | 1.16 |
ENST00000372330.3
|
MMP9
|
matrix metallopeptidase 9 |
| chr15_-_51751434 | 1.16 |
ENST00000558126.1
|
LYSMD2
|
LysM domain containing 2 |
| chrX_+_108582484 | 1.11 |
ENST00000483338.1
|
COL4A5
|
collagen type IV alpha 5 chain |
| chr18_+_74534594 | 1.10 |
ENST00000582365.1
|
CNDP1
|
carnosine dipeptidase 1 |
| chr4_-_65670478 | 1.08 |
ENST00000613740.5
ENST00000622150.4 ENST00000511294.1 |
EPHA5
|
EPH receptor A5 |
| chr7_+_149872955 | 1.06 |
ENST00000421974.7
ENST00000456496.7 |
ATP6V0E2
|
ATPase H+ transporting V0 subunit e2 |
| chr2_+_165294031 | 1.05 |
ENST00000283256.10
|
SCN2A
|
sodium voltage-gated channel alpha subunit 2 |
| chr1_-_51990679 | 1.03 |
ENST00000371655.4
|
RAB3B
|
RAB3B, member RAS oncogene family |
| chrX_-_153926254 | 1.03 |
ENST00000393721.5
ENST00000370028.7 ENST00000350060.10 |
ARHGAP4
|
Rho GTPase activating protein 4 |
| chr8_+_90940517 | 1.03 |
ENST00000521366.1
|
NECAB1
|
N-terminal EF-hand calcium binding protein 1 |
| chr5_+_119355313 | 1.03 |
ENST00000504642.1
|
TNFAIP8
|
TNF alpha induced protein 8 |
| chr20_+_45408276 | 1.02 |
ENST00000372710.5
ENST00000443296.1 |
DBNDD2
|
dysbindin domain containing 2 |
| chr12_-_101830926 | 1.00 |
ENST00000299314.12
|
GNPTAB
|
N-acetylglucosamine-1-phosphate transferase subunits alpha and beta |
| chr9_-_110999458 | 0.97 |
ENST00000374430.6
|
LPAR1
|
lysophosphatidic acid receptor 1 |
| chr12_+_40310431 | 0.95 |
ENST00000681696.1
|
LRRK2
|
leucine rich repeat kinase 2 |
| chr13_-_46182136 | 0.94 |
ENST00000323076.7
|
LCP1
|
lymphocyte cytosolic protein 1 |
| chr3_-_33645433 | 0.93 |
ENST00000635664.1
ENST00000485378.6 ENST00000313350.10 ENST00000487200.5 |
CLASP2
|
cytoplasmic linker associated protein 2 |
| chr6_+_167111789 | 0.92 |
ENST00000400926.5
|
CCR6
|
C-C motif chemokine receptor 6 |
| chr7_-_65006678 | 0.90 |
ENST00000394323.3
|
ERV3-1
|
endogenous retrovirus group 3 member 1, envelope |
| chr6_-_149484965 | 0.85 |
ENST00000409806.8
|
ZC3H12D
|
zinc finger CCCH-type containing 12D |
| chr18_-_72638510 | 0.83 |
ENST00000581073.1
|
CBLN2
|
cerebellin 2 precursor |
| chr1_-_154627906 | 0.83 |
ENST00000679899.1
|
ADAR
|
adenosine deaminase RNA specific |
| chrX_-_153926220 | 0.82 |
ENST00000370016.5
|
ARHGAP4
|
Rho GTPase activating protein 4 |
| chr5_+_119354771 | 0.81 |
ENST00000503646.1
|
TNFAIP8
|
TNF alpha induced protein 8 |
| chr10_+_89283685 | 0.80 |
ENST00000638108.1
|
IFIT2
|
interferon induced protein with tetratricopeptide repeats 2 |
| chr13_+_52455429 | 0.78 |
ENST00000468284.1
ENST00000378034.7 ENST00000378037.9 ENST00000258607.10 |
CKAP2
|
cytoskeleton associated protein 2 |
| chr22_+_39926591 | 0.78 |
ENST00000420971.5
|
GRAP2
|
GRB2 related adaptor protein 2 |
| chr7_+_142469521 | 0.77 |
ENST00000390371.3
|
TRBV6-6
|
T cell receptor beta variable 6-6 |
| chr14_+_22112280 | 0.75 |
ENST00000390454.2
|
TRAV25
|
T cell receptor alpha variable 25 |
| chr1_+_207496229 | 0.74 |
ENST00000367051.6
ENST00000367053.6 ENST00000367052.6 |
CR1
|
complement C3b/C4b receptor 1 (Knops blood group) |
| chr8_+_53851786 | 0.74 |
ENST00000297313.8
ENST00000344277.10 |
RGS20
|
regulator of G protein signaling 20 |
| chr3_+_141262614 | 0.73 |
ENST00000504264.5
|
PXYLP1
|
2-phosphoxylose phosphatase 1 |
| chr16_+_32066065 | 0.69 |
ENST00000354689.6
|
IGHV3OR16-9
|
immunoglobulin heavy variable 3/OR16-9 (non-functional) |
| chr8_+_123768431 | 0.66 |
ENST00000334705.12
ENST00000521166.5 |
FAM91A1
|
family with sequence similarity 91 member A1 |
| chr1_+_207496147 | 0.66 |
ENST00000400960.7
ENST00000367049.9 |
CR1
|
complement C3b/C4b receptor 1 (Knops blood group) |
| chr3_-_49429304 | 0.65 |
ENST00000636166.1
ENST00000273598.8 ENST00000436744.2 |
ENSG00000283189.2
NICN1
|
novel protein nicolin 1 |
| chr1_+_111473972 | 0.65 |
ENST00000369718.4
|
C1orf162
|
chromosome 1 open reading frame 162 |
| chrX_-_153926757 | 0.64 |
ENST00000461052.5
ENST00000422091.1 |
ARHGAP4
|
Rho GTPase activating protein 4 |
| chr13_-_26221703 | 0.64 |
ENST00000381570.7
ENST00000346166.7 |
RNF6
|
ring finger protein 6 |
| chr5_+_140786136 | 0.64 |
ENST00000378133.4
ENST00000504120.4 |
PCDHA1
|
protocadherin alpha 1 |
| chr4_-_87529443 | 0.63 |
ENST00000434434.5
|
SPARCL1
|
SPARC like 1 |
| chr6_+_46129930 | 0.61 |
ENST00000321037.5
|
ENPP4
|
ectonucleotide pyrophosphatase/phosphodiesterase 4 |
| chr1_-_154627945 | 0.61 |
ENST00000681683.1
ENST00000368471.8 ENST00000649042.1 ENST00000680270.1 ENST00000649022.2 ENST00000681056.1 ENST00000649724.1 |
ADAR
|
adenosine deaminase RNA specific |
| chr1_-_243163310 | 0.60 |
ENST00000492145.1
ENST00000490813.5 ENST00000464936.5 |
CEP170
|
centrosomal protein 170 |
| chr5_-_78549151 | 0.58 |
ENST00000515007.6
|
LHFPL2
|
LHFPL tetraspan subfamily member 2 |
| chr3_+_107599309 | 0.58 |
ENST00000406780.5
|
BBX
|
BBX high mobility group box domain containing |
| chr16_+_50025217 | 0.57 |
ENST00000427478.7
|
CNEP1R1
|
CTD nuclear envelope phosphatase 1 regulatory subunit 1 |
| chr13_+_111241185 | 0.55 |
ENST00000478679.5
|
ARHGEF7
|
Rho guanine nucleotide exchange factor 7 |
| chr6_+_27810041 | 0.54 |
ENST00000369163.3
|
H3C10
|
H3 clustered histone 10 |
| chr4_-_119322128 | 0.54 |
ENST00000274024.4
|
FABP2
|
fatty acid binding protein 2 |
| chr4_-_87529460 | 0.52 |
ENST00000418378.5
|
SPARCL1
|
SPARC like 1 |
| chr14_-_100569780 | 0.51 |
ENST00000355173.7
|
BEGAIN
|
brain enriched guanylate kinase associated |
| chr1_+_207496268 | 0.51 |
ENST00000529814.1
|
CR1
|
complement C3b/C4b receptor 1 (Knops blood group) |
| chr1_-_154627576 | 0.51 |
ENST00000648311.1
|
ADAR
|
adenosine deaminase RNA specific |
| chr9_+_87497222 | 0.50 |
ENST00000358077.9
|
DAPK1
|
death associated protein kinase 1 |
| chr22_+_24806265 | 0.50 |
ENST00000400359.4
|
SGSM1
|
small G protein signaling modulator 1 |
| chr9_-_76652516 | 0.48 |
ENST00000424866.1
|
PRUNE2
|
prune homolog 2 with BCH domain |
| chr3_-_36739791 | 0.48 |
ENST00000416516.2
|
DCLK3
|
doublecortin like kinase 3 |
| chr20_+_8789517 | 0.48 |
ENST00000437439.2
|
PLCB1
|
phospholipase C beta 1 |
| chr2_-_135876382 | 0.47 |
ENST00000264156.3
|
MCM6
|
minichromosome maintenance complex component 6 |
| chr2_-_165204042 | 0.46 |
ENST00000283254.12
ENST00000453007.1 |
SCN3A
|
sodium voltage-gated channel alpha subunit 3 |
| chr6_+_26538338 | 0.46 |
ENST00000377575.3
|
HMGN4
|
high mobility group nucleosomal binding domain 4 |
| chr16_+_57092570 | 0.46 |
ENST00000290776.13
ENST00000535318.6 |
CPNE2
|
copine 2 |
| chr4_-_87529383 | 0.46 |
ENST00000541496.1
|
SPARCL1
|
SPARC like 1 |
| chr1_+_162497805 | 0.45 |
ENST00000538489.5
ENST00000489294.2 |
UHMK1
|
U2AF homology motif kinase 1 |
| chr3_+_136819069 | 0.45 |
ENST00000393079.3
ENST00000446465.3 |
SLC35G2
|
solute carrier family 35 member G2 |
| chr7_-_87220567 | 0.44 |
ENST00000433078.5
|
TMEM243
|
transmembrane protein 243 |
| chr13_-_48413105 | 0.44 |
ENST00000620633.5
|
LPAR6
|
lysophosphatidic acid receptor 6 |
| chr4_-_65670339 | 0.43 |
ENST00000273854.7
|
EPHA5
|
EPH receptor A5 |
| chr14_+_22105305 | 0.43 |
ENST00000390453.1
|
TRAV24
|
T cell receptor alpha variable 24 |
| chr12_-_24949026 | 0.42 |
ENST00000539780.5
ENST00000546285.1 ENST00000342945.9 ENST00000261192.12 |
BCAT1
|
branched chain amino acid transaminase 1 |
| chr8_+_24384275 | 0.41 |
ENST00000256412.8
|
ADAMDEC1
|
ADAM like decysin 1 |
| chr1_+_78649818 | 0.40 |
ENST00000370747.9
ENST00000438486.1 |
IFI44
|
interferon induced protein 44 |
| chr4_-_75724362 | 0.40 |
ENST00000677583.1
|
G3BP2
|
G3BP stress granule assembly factor 2 |
| chr4_+_70721953 | 0.39 |
ENST00000381006.8
ENST00000226328.8 |
RUFY3
|
RUN and FYVE domain containing 3 |
| chr4_-_174829212 | 0.38 |
ENST00000340217.5
ENST00000274093.8 |
GLRA3
|
glycine receptor alpha 3 |
| chr19_-_43883964 | 0.37 |
ENST00000587539.2
|
ZNF404
|
zinc finger protein 404 |
| chr2_-_197675578 | 0.35 |
ENST00000295049.9
|
RFTN2
|
raftlin family member 2 |
| chr18_-_55321640 | 0.35 |
ENST00000637169.2
|
TCF4
|
transcription factor 4 |
| chr16_-_89418292 | 0.35 |
ENST00000683497.1
ENST00000642443.1 ENST00000644784.1 ENST00000647238.1 |
ENSG00000288715.1
ANKRD11
|
novel protein ankyrin repeat domain 11 |
| chr12_-_76068933 | 0.34 |
ENST00000552056.5
|
NAP1L1
|
nucleosome assembly protein 1 like 1 |
| chr16_+_11345429 | 0.33 |
ENST00000576027.1
ENST00000312499.6 ENST00000648619.1 |
RMI2
|
RecQ mediated genome instability 2 |
| chr17_+_47694053 | 0.33 |
ENST00000578982.5
|
TBKBP1
|
TBK1 binding protein 1 |
| chr6_-_127342398 | 0.33 |
ENST00000531582.1
|
ECHDC1
|
ethylmalonyl-CoA decarboxylase 1 |
| chr16_+_50025271 | 0.33 |
ENST00000562576.5
|
CNEP1R1
|
CTD nuclear envelope phosphatase 1 regulatory subunit 1 |
| chr11_-_85665077 | 0.32 |
ENST00000527447.2
|
CREBZF
|
CREB/ATF bZIP transcription factor |
| chr2_-_199456046 | 0.30 |
ENST00000428695.5
|
SATB2
|
SATB homeobox 2 |
| chr5_-_64768619 | 0.28 |
ENST00000513458.9
|
SREK1IP1
|
SREK1 interacting protein 1 |
| chr1_-_85708382 | 0.28 |
ENST00000370574.4
ENST00000431532.6 |
ZNHIT6
|
zinc finger HIT-type containing 6 |
| chr8_-_109648746 | 0.28 |
ENST00000528045.5
|
SYBU
|
syntabulin |
| chr16_+_14708944 | 0.28 |
ENST00000526520.5
ENST00000531598.6 |
NPIPA3
|
nuclear pore complex interacting protein family member A3 |
| chr19_+_13151975 | 0.27 |
ENST00000588173.1
|
IER2
|
immediate early response 2 |
| chr19_+_11345223 | 0.27 |
ENST00000588790.5
|
CCDC159
|
coiled-coil domain containing 159 |
| chr6_-_118710065 | 0.27 |
ENST00000392500.7
ENST00000368488.9 ENST00000434604.5 |
CEP85L
|
centrosomal protein 85 like |
| chr21_+_29300111 | 0.25 |
ENST00000451655.5
|
BACH1
|
BTB domain and CNC homolog 1 |
| chr8_-_140718345 | 0.25 |
ENST00000521562.5
|
PTK2
|
protein tyrosine kinase 2 |
| chr5_+_141392616 | 0.25 |
ENST00000398604.3
|
PCDHGA8
|
protocadherin gamma subfamily A, 8 |
| chr1_-_35031905 | 0.24 |
ENST00000317538.9
ENST00000357182.9 |
ZMYM6
|
zinc finger MYM-type containing 6 |
| chr3_+_88149947 | 0.24 |
ENST00000318887.8
ENST00000486971.1 |
C3orf38
|
chromosome 3 open reading frame 38 |
| chr14_-_81436447 | 0.23 |
ENST00000649389.1
ENST00000557055.5 |
STON2
|
stonin 2 |
| chr1_-_21783134 | 0.23 |
ENST00000308271.14
|
USP48
|
ubiquitin specific peptidase 48 |
| chr3_-_19934189 | 0.23 |
ENST00000295824.14
|
EFHB
|
EF-hand domain family member B |
| chr2_-_240821363 | 0.21 |
ENST00000675940.1
|
KIF1A
|
kinesin family member 1A |
| chr11_-_117098415 | 0.20 |
ENST00000445177.6
ENST00000375300.6 ENST00000446921.6 |
SIK3
|
SIK family kinase 3 |
| chr8_-_140764386 | 0.19 |
ENST00000520151.5
ENST00000519024.5 ENST00000519465.5 |
PTK2
|
protein tyrosine kinase 2 |
| chr11_+_94305592 | 0.19 |
ENST00000328458.5
ENST00000440961.6 |
IZUMO1R
|
IZUMO1 receptor, JUNO |
| chr1_-_161238196 | 0.18 |
ENST00000367983.9
ENST00000506209.5 ENST00000367980.6 ENST00000628566.2 |
NR1I3
|
nuclear receptor subfamily 1 group I member 3 |
| chr6_-_11044275 | 0.18 |
ENST00000354666.4
|
ELOVL2
|
ELOVL fatty acid elongase 2 |
| chr6_-_131628165 | 0.18 |
ENST00000368053.8
ENST00000354577.8 ENST00000368060.7 ENST00000368068.8 |
MED23
|
mediator complex subunit 23 |
| chr21_+_29300770 | 0.18 |
ENST00000447177.5
|
BACH1
|
BTB domain and CNC homolog 1 |
| chr2_+_11534039 | 0.17 |
ENST00000381486.7
|
GREB1
|
growth regulating estrogen receptor binding 1 |
| chr19_-_52048561 | 0.16 |
ENST00000594154.5
ENST00000598745.5 ENST00000597273.1 |
ZNF432
|
zinc finger protein 432 |
| chr21_-_18485878 | 0.16 |
ENST00000422787.1
|
TMPRSS15
|
transmembrane serine protease 15 |
| chr6_+_28267044 | 0.15 |
ENST00000316606.10
|
ZSCAN26
|
zinc finger and SCAN domain containing 26 |
| chr1_-_161238223 | 0.15 |
ENST00000515452.1
|
NR1I3
|
nuclear receptor subfamily 1 group I member 3 |
| chr17_+_75459707 | 0.14 |
ENST00000581519.5
|
TMEM94
|
transmembrane protein 94 |
| chr20_-_35147285 | 0.14 |
ENST00000374491.3
ENST00000374492.8 |
EDEM2
|
ER degradation enhancing alpha-mannosidase like protein 2 |
| chr20_-_10420737 | 0.14 |
ENST00000649912.1
|
ENSG00000285723.1
|
novel protein |
| chr6_-_16328281 | 0.13 |
ENST00000642969.1
ENST00000683730.1 |
ATXN1
ENSG00000288708.1
|
ataxin 1 novel protein |
| chr1_+_174874434 | 0.13 |
ENST00000478442.5
ENST00000465412.5 |
RABGAP1L
|
RAB GTPase activating protein 1 like |
| chr2_-_197676012 | 0.13 |
ENST00000429081.1
|
RFTN2
|
raftlin family member 2 |
| chr1_+_241652275 | 0.13 |
ENST00000366552.6
ENST00000437684.7 |
WDR64
|
WD repeat domain 64 |
| chr6_-_106325735 | 0.12 |
ENST00000635758.2
ENST00000369076.8 ENST00000636437.1 |
ATG5
|
autophagy related 5 |
| chr3_-_88149815 | 0.12 |
ENST00000467332.1
ENST00000462901.5 |
CGGBP1
|
CGG triplet repeat binding protein 1 |
| chr2_+_37950476 | 0.12 |
ENST00000402091.3
|
RMDN2
|
regulator of microtubule dynamics 2 |
| chr4_-_47463649 | 0.11 |
ENST00000381571.6
|
COMMD8
|
COMM domain containing 8 |
| chr14_+_45135917 | 0.11 |
ENST00000267430.10
ENST00000556036.5 ENST00000542564.6 |
FANCM
|
FA complementation group M |
| chr5_+_68292486 | 0.10 |
ENST00000519025.5
|
PIK3R1
|
phosphoinositide-3-kinase regulatory subunit 1 |
| chr19_-_52048803 | 0.09 |
ENST00000221315.10
|
ZNF432
|
zinc finger protein 432 |
| chrY_-_23694579 | 0.07 |
ENST00000343584.10
|
PRYP3
|
PTPN13 like Y-linked pseudogene 3 |
| chr19_-_10380558 | 0.07 |
ENST00000524462.5
ENST00000525621.6 ENST00000531836.5 |
TYK2
|
tyrosine kinase 2 |
| chr19_-_10380454 | 0.06 |
ENST00000530829.1
ENST00000529370.5 |
TYK2
|
tyrosine kinase 2 |
| chr2_-_165953750 | 0.06 |
ENST00000243344.8
ENST00000679799.1 ENST00000679840.1 ENST00000681606.1 ENST00000680448.1 |
TTC21B
|
tetratricopeptide repeat domain 21B |
| chr14_-_24442662 | 0.05 |
ENST00000554698.5
|
SDR39U1
|
short chain dehydrogenase/reductase family 39U member 1 |
| chr11_+_18172837 | 0.04 |
ENST00000314254.3
|
MRGPRX4
|
MAS related GPR family member X4 |
| chr10_-_45535346 | 0.04 |
ENST00000453424.7
ENST00000395769.6 |
MARCHF8
|
membrane associated ring-CH-type finger 8 |
| chr1_-_169734064 | 0.03 |
ENST00000333360.12
|
SELE
|
selectin E |
| chr14_-_55191534 | 0.03 |
ENST00000395425.6
ENST00000247191.7 |
DLGAP5
|
DLG associated protein 5 |
| chr9_-_65285209 | 0.02 |
ENST00000377420.1
|
FOXD4L5
|
forkhead box D4 like 5 |
| chr17_+_35844077 | 0.01 |
ENST00000604694.1
|
TAF15
|
TATA-box binding protein associated factor 15 |
| chr11_+_6926417 | 0.01 |
ENST00000610573.4
ENST00000278319.10 |
ZNF215
|
zinc finger protein 215 |
| chr8_+_103372388 | 0.01 |
ENST00000520337.1
|
CTHRC1
|
collagen triple helix repeat containing 1 |
| chr17_+_56153458 | 0.01 |
ENST00000318698.6
ENST00000682825.1 ENST00000566473.6 |
ANKFN1
|
ankyrin repeat and fibronectin type III domain containing 1 |
| chr19_-_46746421 | 0.01 |
ENST00000263280.11
|
STRN4
|
striatin 4 |
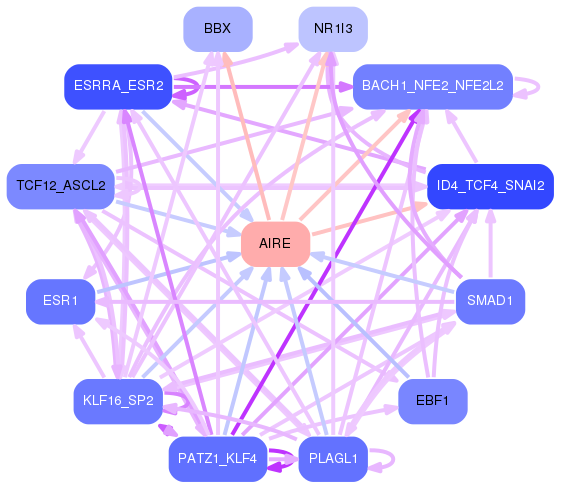
Network of associatons between targets according to the STRING database.

First level regulatory network of AIRE
Gene Ontology Analysis
Gene overrepresentation in biological process category:
| Log-likelihood per target | Total log-likelihood | Term | Description |
|---|---|---|---|
| 1.5 | 4.4 | GO:1903937 | response to acrylamide(GO:1903937) |
| 0.6 | 1.9 | GO:2000525 | regulation of T cell costimulation(GO:2000523) positive regulation of T cell costimulation(GO:2000525) regulation of dendritic cell dendrite assembly(GO:2000547) |
| 0.6 | 1.9 | GO:0030451 | regulation of complement activation, alternative pathway(GO:0030451) negative regulation of complement activation, alternative pathway(GO:0045957) |
| 0.3 | 1.9 | GO:1900369 | negative regulation of RNA interference(GO:1900369) |
| 0.3 | 1.3 | GO:0038060 | nitric oxide-cGMP-mediated signaling pathway(GO:0038060) |
| 0.3 | 0.9 | GO:1903124 | regulation of thioredoxin peroxidase activity(GO:1903123) negative regulation of thioredoxin peroxidase activity(GO:1903124) negative regulation of thioredoxin peroxidase activity by peptidyl-threonine phosphorylation(GO:1903125) Wnt signalosome assembly(GO:1904887) negative regulation of peroxidase activity(GO:2000469) |
| 0.3 | 1.0 | GO:0018125 | peptidyl-cysteine methylation(GO:0018125) |
| 0.2 | 1.0 | GO:0016256 | N-glycan processing to lysosome(GO:0016256) |
| 0.2 | 2.2 | GO:0051694 | pointed-end actin filament capping(GO:0051694) |
| 0.2 | 1.0 | GO:1904566 | response to 1-oleoyl-sn-glycerol 3-phosphate(GO:1904565) cellular response to 1-oleoyl-sn-glycerol 3-phosphate(GO:1904566) |
| 0.2 | 1.6 | GO:2000660 | negative regulation of interleukin-1-mediated signaling pathway(GO:2000660) |
| 0.2 | 1.9 | GO:0039663 | fusion of virus membrane with host plasma membrane(GO:0019064) membrane fusion involved in viral entry into host cell(GO:0039663) multi-organism membrane fusion(GO:0044800) |
| 0.2 | 0.9 | GO:0060474 | positive regulation of sperm motility involved in capacitation(GO:0060474) |
| 0.2 | 1.3 | GO:1903826 | arginine transmembrane transport(GO:1903826) |
| 0.2 | 0.5 | GO:2000560 | CD24 biosynthetic process(GO:0035724) activation of meiosis involved in egg activation(GO:0060466) negative regulation of monocyte extravasation(GO:2000438) regulation of CD24 biosynthetic process(GO:2000559) positive regulation of CD24 biosynthetic process(GO:2000560) |
| 0.2 | 2.5 | GO:0010764 | negative regulation of fibroblast migration(GO:0010764) |
| 0.1 | 5.8 | GO:0090383 | phagosome acidification(GO:0090383) |
| 0.1 | 2.8 | GO:0035493 | SNARE complex assembly(GO:0035493) |
| 0.1 | 1.2 | GO:0051549 | positive regulation of keratinocyte migration(GO:0051549) |
| 0.1 | 0.6 | GO:0044314 | protein K27-linked ubiquitination(GO:0044314) |
| 0.1 | 1.3 | GO:0070327 | thyroid hormone transport(GO:0070327) |
| 0.1 | 0.4 | GO:0009099 | branched-chain amino acid biosynthetic process(GO:0009082) leucine biosynthetic process(GO:0009098) valine biosynthetic process(GO:0009099) |
| 0.1 | 1.6 | GO:0002315 | marginal zone B cell differentiation(GO:0002315) |
| 0.1 | 0.4 | GO:0000117 | regulation of transcription involved in G2/M transition of mitotic cell cycle(GO:0000117) |
| 0.1 | 1.1 | GO:0008627 | intrinsic apoptotic signaling pathway in response to osmotic stress(GO:0008627) |
| 0.1 | 0.9 | GO:1903690 | negative regulation of wound healing, spreading of epidermal cells(GO:1903690) |
| 0.1 | 1.5 | GO:0032793 | positive regulation of CREB transcription factor activity(GO:0032793) |
| 0.0 | 2.8 | GO:0008089 | anterograde axonal transport(GO:0008089) |
| 0.0 | 0.8 | GO:0035457 | cellular response to interferon-alpha(GO:0035457) |
| 0.0 | 0.1 | GO:0036510 | trimming of terminal mannose on C branch(GO:0036510) |
| 0.0 | 0.7 | GO:0010908 | regulation of heparan sulfate proteoglycan biosynthetic process(GO:0010908) positive regulation of heparan sulfate proteoglycan biosynthetic process(GO:0010909) positive regulation of proteoglycan biosynthetic process(GO:1902730) |
| 0.0 | 0.4 | GO:0060012 | synaptic transmission, glycinergic(GO:0060012) |
| 0.0 | 0.9 | GO:0071803 | positive regulation of podosome assembly(GO:0071803) |
| 0.0 | 0.3 | GO:0048254 | snoRNA localization(GO:0048254) |
| 0.0 | 0.5 | GO:0006268 | DNA unwinding involved in DNA replication(GO:0006268) |
| 0.0 | 0.9 | GO:0061158 | 3'-UTR-mediated mRNA destabilization(GO:0061158) |
| 0.0 | 1.1 | GO:0038063 | collagen-activated tyrosine kinase receptor signaling pathway(GO:0038063) |
| 0.0 | 0.1 | GO:2000619 | negative regulation of histone H4-K16 acetylation(GO:2000619) |
| 0.0 | 0.5 | GO:0033227 | dsRNA transport(GO:0033227) |
| 0.0 | 0.6 | GO:1904424 | regulation of GTP binding(GO:1904424) |
| 0.0 | 0.9 | GO:0010867 | positive regulation of triglyceride biosynthetic process(GO:0010867) |
| 0.0 | 0.8 | GO:0007026 | negative regulation of microtubule depolymerization(GO:0007026) |
| 0.0 | 0.3 | GO:0021902 | commitment of neuronal cell to specific neuron type in forebrain(GO:0021902) |
| 0.0 | 0.4 | GO:0007253 | cytoplasmic sequestering of NF-kappaB(GO:0007253) |
| 0.0 | 0.4 | GO:0038007 | netrin-activated signaling pathway(GO:0038007) |
| 0.0 | 0.6 | GO:0006152 | purine nucleoside catabolic process(GO:0006152) purine ribonucleoside catabolic process(GO:0046130) |
| 0.0 | 2.2 | GO:0006958 | complement activation, classical pathway(GO:0006958) |
| 0.0 | 0.2 | GO:0034626 | fatty acid elongation, saturated fatty acid(GO:0019367) fatty acid elongation, unsaturated fatty acid(GO:0019368) fatty acid elongation, monounsaturated fatty acid(GO:0034625) fatty acid elongation, polyunsaturated fatty acid(GO:0034626) |
| 0.0 | 0.4 | GO:0071447 | cellular response to hydroperoxide(GO:0071447) |
| 0.0 | 0.5 | GO:0045948 | positive regulation of translational initiation(GO:0045948) |
Gene overrepresentation in cellular component category:
| Log-likelihood per target | Total log-likelihood | Term | Description |
|---|---|---|---|
| 0.9 | 4.4 | GO:0033596 | TSC1-TSC2 complex(GO:0033596) |
| 0.3 | 0.9 | GO:0099400 | cytoplasmic side of mitochondrial outer membrane(GO:0032473) caveola neck(GO:0099400) |
| 0.3 | 1.1 | GO:0033179 | proton-transporting V-type ATPase, V0 domain(GO:0033179) |
| 0.2 | 1.9 | GO:0044530 | supraspliceosomal complex(GO:0044530) |
| 0.2 | 0.9 | GO:0036338 | viral envelope(GO:0019031) viral membrane(GO:0036338) |
| 0.1 | 4.7 | GO:0016471 | vacuolar proton-transporting V-type ATPase complex(GO:0016471) |
| 0.1 | 0.9 | GO:0071595 | Nem1-Spo7 phosphatase complex(GO:0071595) |
| 0.1 | 10.4 | GO:0035577 | azurophil granule membrane(GO:0035577) |
| 0.1 | 1.1 | GO:0005587 | collagen type IV trimer(GO:0005587) |
| 0.1 | 0.9 | GO:0097524 | sperm plasma membrane(GO:0097524) |
| 0.1 | 0.9 | GO:0005828 | kinetochore microtubule(GO:0005828) |
| 0.1 | 0.5 | GO:0089701 | U2AF(GO:0089701) |
| 0.1 | 1.5 | GO:0001518 | voltage-gated sodium channel complex(GO:0001518) |
| 0.0 | 2.2 | GO:0005865 | striated muscle thin filament(GO:0005865) |
| 0.0 | 0.6 | GO:0000322 | storage vacuole(GO:0000322) |
| 0.0 | 2.8 | GO:1904115 | axon cytoplasm(GO:1904115) |
| 0.0 | 0.3 | GO:0070761 | pre-snoRNP complex(GO:0070761) |
| 0.0 | 0.1 | GO:0071821 | FANCM-MHF complex(GO:0071821) |
| 0.0 | 0.5 | GO:0042555 | MCM complex(GO:0042555) |
| 0.0 | 0.1 | GO:0034274 | Atg12-Atg5-Atg16 complex(GO:0034274) |
| 0.0 | 2.5 | GO:0101003 | ficolin-1-rich granule membrane(GO:0101003) |
| 0.0 | 1.3 | GO:0032809 | neuronal cell body membrane(GO:0032809) cell body membrane(GO:0044298) |
| 0.0 | 0.9 | GO:0001891 | phagocytic cup(GO:0001891) |
| 0.0 | 0.6 | GO:0031092 | platelet alpha granule membrane(GO:0031092) |
| 0.0 | 0.1 | GO:0042272 | nuclear RNA export factor complex(GO:0042272) |
| 0.0 | 0.3 | GO:0097433 | dense body(GO:0097433) |
| 0.0 | 0.7 | GO:0042571 | immunoglobulin complex, circulating(GO:0042571) |
| 0.0 | 4.7 | GO:0009897 | external side of plasma membrane(GO:0009897) |
| 0.0 | 1.0 | GO:0043198 | dendritic shaft(GO:0043198) |
| 0.0 | 1.9 | GO:0044291 | cell-cell contact zone(GO:0044291) |
| 0.0 | 0.1 | GO:1990578 | perinuclear endoplasmic reticulum membrane(GO:1990578) |
| 0.0 | 1.0 | GO:1904724 | tertiary granule lumen(GO:1904724) |
Gene overrepresentation in molecular function category:
| Log-likelihood per target | Total log-likelihood | Term | Description |
|---|---|---|---|
| 1.6 | 4.9 | GO:0050528 | acyloxyacyl hydrolase activity(GO:0050528) |
| 0.6 | 1.9 | GO:0004877 | complement component C4b receptor activity(GO:0001861) complement component C3b receptor activity(GO:0004877) |
| 0.3 | 0.9 | GO:0034211 | GTP-dependent protein kinase activity(GO:0034211) peroxidase inhibitor activity(GO:0036479) |
| 0.3 | 4.7 | GO:0019957 | C-C chemokine binding(GO:0019957) |
| 0.2 | 1.9 | GO:0003726 | double-stranded RNA adenosine deaminase activity(GO:0003726) |
| 0.2 | 1.0 | GO:0003976 | UDP-N-acetylglucosamine-lysosomal-enzyme N-acetylglucosaminephosphotransferase activity(GO:0003976) |
| 0.1 | 1.3 | GO:0015181 | arginine transmembrane transporter activity(GO:0015181) |
| 0.1 | 1.3 | GO:0015349 | thyroid hormone transmembrane transporter activity(GO:0015349) |
| 0.1 | 1.4 | GO:0070915 | lysophosphatidic acid receptor activity(GO:0070915) |
| 0.1 | 1.5 | GO:0005005 | transmembrane-ephrin receptor activity(GO:0005005) |
| 0.1 | 4.5 | GO:0043274 | phospholipase binding(GO:0043274) |
| 0.1 | 0.4 | GO:0052656 | branched-chain-amino-acid transaminase activity(GO:0004084) L-leucine transaminase activity(GO:0052654) L-valine transaminase activity(GO:0052655) L-isoleucine transaminase activity(GO:0052656) |
| 0.1 | 0.3 | GO:0004492 | methylmalonyl-CoA decarboxylase activity(GO:0004492) |
| 0.1 | 0.4 | GO:0016933 | extracellular-glycine-gated ion channel activity(GO:0016933) extracellular-glycine-gated chloride channel activity(GO:0016934) |
| 0.1 | 2.2 | GO:0005523 | tropomyosin binding(GO:0005523) |
| 0.1 | 0.5 | GO:0030628 | pre-mRNA 3'-splice site binding(GO:0030628) |
| 0.1 | 0.3 | GO:0004882 | androgen receptor activity(GO:0004882) |
| 0.0 | 2.8 | GO:0005484 | SNAP receptor activity(GO:0005484) |
| 0.0 | 1.5 | GO:1905030 | voltage-gated sodium channel activity(GO:0005248) voltage-gated ion channel activity involved in regulation of postsynaptic membrane potential(GO:1905030) |
| 0.0 | 1.8 | GO:0043027 | cysteine-type endopeptidase inhibitor activity involved in apoptotic process(GO:0043027) |
| 0.0 | 1.3 | GO:0005251 | delayed rectifier potassium channel activity(GO:0005251) |
| 0.0 | 1.1 | GO:0044769 | ATPase activity, coupled to transmembrane movement of ions, rotational mechanism(GO:0044769) proton-transporting ATPase activity, rotational mechanism(GO:0046961) |
| 0.0 | 1.0 | GO:0031489 | myosin V binding(GO:0031489) |
| 0.0 | 1.4 | GO:0008157 | protein phosphatase 1 binding(GO:0008157) |
| 0.0 | 4.1 | GO:0016820 | hydrolase activity, acting on acid anhydrides, catalyzing transmembrane movement of substances(GO:0016820) |
| 0.0 | 0.9 | GO:0002162 | dystroglycan binding(GO:0002162) |
| 0.0 | 0.7 | GO:0003993 | acid phosphatase activity(GO:0003993) |
| 0.0 | 0.1 | GO:0019776 | Atg8 ligase activity(GO:0019776) |
| 0.0 | 3.3 | GO:0005070 | SH3/SH2 adaptor activity(GO:0005070) |
| 0.0 | 0.4 | GO:0001206 | transcriptional repressor activity, RNA polymerase II distal enhancer sequence-specific binding(GO:0001206) |
| 0.0 | 2.8 | GO:0003777 | microtubule motor activity(GO:0003777) |
| 0.0 | 0.3 | GO:0001094 | TFIID-class transcription factor binding(GO:0001094) |
| 0.0 | 0.4 | GO:0008432 | JUN kinase binding(GO:0008432) |
| 0.0 | 0.8 | GO:0017075 | syntaxin-1 binding(GO:0017075) |
| 0.0 | 0.1 | GO:0005131 | growth hormone receptor binding(GO:0005131) |
| 0.0 | 0.1 | GO:0004571 | mannosyl-oligosaccharide 1,2-alpha-mannosidase activity(GO:0004571) |
| 0.0 | 0.5 | GO:0016805 | dipeptidase activity(GO:0016805) |
| 0.0 | 1.6 | GO:0050840 | extracellular matrix binding(GO:0050840) |
| 0.0 | 0.1 | GO:0034046 | poly(G) binding(GO:0034046) |
| 0.0 | 0.2 | GO:0009922 | fatty acid elongase activity(GO:0009922) 3-oxo-arachidoyl-CoA synthase activity(GO:0102336) 3-oxo-cerotoyl-CoA synthase activity(GO:0102337) 3-oxo-lignoceronyl-CoA synthase activity(GO:0102338) |
| 0.0 | 0.4 | GO:0001087 | transcription factor activity, sequence-specific DNA binding, RNA polymerase recruiting(GO:0001011) transcription factor activity, TFIIB-class binding(GO:0001087) |
| 0.0 | 0.5 | GO:0005521 | lamin binding(GO:0005521) |
Gene overrepresentation in curated gene sets: canonical pathways category:
| Log-likelihood per target | Total log-likelihood | Term | Description |
|---|---|---|---|
| 0.0 | 0.8 | PID TCR JNK PATHWAY | JNK signaling in the CD4+ TCR pathway |
| 0.0 | 1.5 | PID EPHA FWDPATHWAY | EPHA forward signaling |
| 0.0 | 2.2 | PID CDC42 REG PATHWAY | Regulation of CDC42 activity |
| 0.0 | 2.6 | SIG CHEMOTAXIS | Genes related to chemotaxis |
| 0.0 | 1.6 | PID SYNDECAN 4 PATHWAY | Syndecan-4-mediated signaling events |
| 0.0 | 1.2 | ST G ALPHA I PATHWAY | G alpha i Pathway |
| 0.0 | 2.0 | PID IL12 2PATHWAY | IL12-mediated signaling events |
| 0.0 | 1.1 | PID INTEGRIN3 PATHWAY | Beta3 integrin cell surface interactions |
Gene overrepresentation in curated gene sets: REACTOME pathways category:
| Log-likelihood per target | Total log-likelihood | Term | Description |
|---|---|---|---|
| 0.3 | 1.9 | REACTOME BINDING AND ENTRY OF HIV VIRION | Genes involved in Binding and entry of HIV virion |
| 0.1 | 4.7 | REACTOME INSULIN RECEPTOR RECYCLING | Genes involved in Insulin receptor recycling |
| 0.1 | 4.4 | REACTOME RAS ACTIVATION UOPN CA2 INFUX THROUGH NMDA RECEPTOR | Genes involved in Ras activation uopn Ca2+ infux through NMDA receptor |
| 0.1 | 2.8 | REACTOME PROTEOLYTIC CLEAVAGE OF SNARE COMPLEX PROTEINS | Genes involved in Proteolytic cleavage of SNARE complex proteins |
| 0.1 | 1.9 | REACTOME REGULATION OF COMPLEMENT CASCADE | Genes involved in Regulation of Complement cascade |
| 0.1 | 1.3 | REACTOME TRANSPORT OF ORGANIC ANIONS | Genes involved in Transport of organic anions |
| 0.0 | 2.8 | REACTOME CHEMOKINE RECEPTORS BIND CHEMOKINES | Genes involved in Chemokine receptors bind chemokines |
| 0.0 | 0.5 | REACTOME REGULATION OF INSULIN SECRETION BY ACETYLCHOLINE | Genes involved in Regulation of Insulin Secretion by Acetylcholine |
| 0.0 | 7.3 | REACTOME PPARA ACTIVATES GENE EXPRESSION | Genes involved in PPARA Activates Gene Expression |
| 0.0 | 0.5 | REACTOME UNWINDING OF DNA | Genes involved in Unwinding of DNA |
| 0.0 | 1.2 | REACTOME DEGRADATION OF THE EXTRACELLULAR MATRIX | Genes involved in Degradation of the extracellular matrix |
| 0.0 | 0.5 | REACTOME ROLE OF DCC IN REGULATING APOPTOSIS | Genes involved in Role of DCC in regulating apoptosis |
| 0.0 | 2.9 | REACTOME INTERFERON ALPHA BETA SIGNALING | Genes involved in Interferon alpha/beta signaling |
| 0.0 | 2.5 | REACTOME NRAGE SIGNALS DEATH THROUGH JNK | Genes involved in NRAGE signals death through JNK |
| 0.0 | 0.4 | REACTOME P2Y RECEPTORS | Genes involved in P2Y receptors |
| 0.0 | 1.1 | REACTOME INTERACTION BETWEEN L1 AND ANKYRINS | Genes involved in Interaction between L1 and Ankyrins |
| 0.0 | 1.3 | REACTOME VOLTAGE GATED POTASSIUM CHANNELS | Genes involved in Voltage gated Potassium channels |
| 0.0 | 1.3 | REACTOME AMINO ACID TRANSPORT ACROSS THE PLASMA MEMBRANE | Genes involved in Amino acid transport across the plasma membrane |
| 0.0 | 0.8 | REACTOME GENERATION OF SECOND MESSENGER MOLECULES | Genes involved in Generation of second messenger molecules |
| 0.0 | 0.4 | REACTOME BRANCHED CHAIN AMINO ACID CATABOLISM | Genes involved in Branched-chain amino acid catabolism |
| 0.0 | 0.4 | REACTOME DCC MEDIATED ATTRACTIVE SIGNALING | Genes involved in DCC mediated attractive signaling |
| 0.0 | 0.2 | REACTOME ALPHA LINOLENIC ACID ALA METABOLISM | Genes involved in alpha-linolenic acid (ALA) metabolism |