|
chr14_-_106269133
Show fit
|
3.21 |
ENST00000390609.3
|
IGHV3-23
|
immunoglobulin heavy variable 3-23
|
|
chr2_+_88885397
Show fit
|
1.88 |
ENST00000390243.2
|
IGKV4-1
|
immunoglobulin kappa variable 4-1
|
|
chr2_-_89117844
Show fit
|
1.87 |
ENST00000490686.1
|
IGKV1-17
|
immunoglobulin kappa variable 1-17
|
|
chr11_-_105035113
Show fit
|
1.85 |
ENST00000526568.5
ENST00000531166.5
ENST00000534497.5
ENST00000527979.5
ENST00000533400.6
ENST00000528974.1
ENST00000525825.5
ENST00000353247.9
ENST00000446369.5
ENST00000436863.7
|
CASP1
|
caspase 1
|
|
chr2_-_89040745
Show fit
|
1.76 |
ENST00000480492.1
|
IGKV1-12
|
immunoglobulin kappa variable 1-12
|
|
chr2_+_90154073
Show fit
|
1.60 |
ENST00000611391.1
|
IGKV1D-13
|
immunoglobulin kappa variable 1D-13
|
|
chr7_-_38265678
Show fit
|
1.60 |
ENST00000443402.6
|
TRGC1
|
T cell receptor gamma constant 1
|
|
chr5_+_122311740
Show fit
|
1.47 |
ENST00000506272.5
ENST00000508681.5
ENST00000509154.6
|
SNCAIP
|
synuclein alpha interacting protein
|
|
chr12_-_53207241
Show fit
|
1.47 |
ENST00000267082.10
ENST00000549086.2
|
ITGB7
|
integrin subunit beta 7
|
|
chr2_-_89100352
Show fit
|
1.46 |
ENST00000479981.1
|
IGKV1-16
|
immunoglobulin kappa variable 1-16
|
|
chr6_-_33009568
Show fit
|
1.44 |
ENST00000374813.1
ENST00000229829.7
|
HLA-DOA
|
major histocompatibility complex, class II, DO alpha
|
|
chr3_+_46354072
Show fit
|
1.44 |
ENST00000445132.3
ENST00000421659.1
|
CCR2
|
C-C motif chemokine receptor 2
|
|
chr2_-_88966767
Show fit
|
1.40 |
ENST00000464162.1
|
IGKV1-6
|
immunoglobulin kappa variable 1-6
|
|
chrX_+_100584928
Show fit
|
1.38 |
ENST00000373031.5
|
TNMD
|
tenomodulin
|
|
chr3_-_151384741
Show fit
|
1.38 |
ENST00000302632.4
|
P2RY12
|
purinergic receptor P2Y12
|
|
chr12_-_53207271
Show fit
|
1.38 |
ENST00000552972.5
ENST00000422257.7
|
ITGB7
|
integrin subunit beta 7
|
|
chr7_-_38249572
Show fit
|
1.33 |
ENST00000436911.6
|
TRGC2
|
T cell receptor gamma constant 2
|
|
chr16_+_22513058
Show fit
|
1.31 |
ENST00000536620.1
|
NPIPB5
|
nuclear pore complex interacting protein family member B5
|
|
chr4_+_77605807
Show fit
|
1.30 |
ENST00000682537.1
|
CXCL13
|
C-X-C motif chemokine ligand 13
|
|
chr12_-_10390023
Show fit
|
1.20 |
ENST00000240618.11
|
KLRK1
|
killer cell lectin like receptor K1
|
|
chr4_+_73740541
Show fit
|
1.20 |
ENST00000401931.1
ENST00000307407.8
|
CXCL8
|
C-X-C motif chemokine ligand 8
|
|
chr2_+_90100235
Show fit
|
1.20 |
ENST00000492446.1
|
IGKV1D-16
|
immunoglobulin kappa variable 1D-16
|
|
chr8_+_73991345
Show fit
|
1.18 |
ENST00000284818.7
ENST00000518893.1
|
LY96
|
lymphocyte antigen 96
|
|
chr16_+_14708944
Show fit
|
1.17 |
ENST00000526520.5
ENST00000531598.6
|
NPIPA3
|
nuclear pore complex interacting protein family member A3
|
|
chr12_+_9827472
Show fit
|
1.15 |
ENST00000617793.4
ENST00000617889.5
ENST00000354855.7
ENST00000279545.7
|
KLRF1
|
killer cell lectin like receptor F1
|
|
chr12_+_47216531
Show fit
|
1.15 |
ENST00000548348.1
ENST00000549500.1
|
PCED1B
|
PC-esterase domain containing 1B
|
|
chr2_+_90159840
Show fit
|
1.14 |
ENST00000377032.5
|
IGKV1D-12
|
immunoglobulin kappa variable 1D-12
|
|
chr12_+_75480745
Show fit
|
1.14 |
ENST00000266659.8
|
GLIPR1
|
GLI pathogenesis related 1
|
|
chr6_-_130890393
Show fit
|
1.12 |
ENST00000456097.6
|
EPB41L2
|
erythrocyte membrane protein band 4.1 like 2
|
|
chr16_+_81779279
Show fit
|
1.12 |
ENST00000564138.6
|
PLCG2
|
phospholipase C gamma 2
|
|
chr1_-_9751540
Show fit
|
1.11 |
ENST00000435891.5
|
CLSTN1
|
calsyntenin 1
|
|
chr5_+_69565122
Show fit
|
1.11 |
ENST00000507595.1
|
GTF2H2C
|
GTF2H2 family member C
|
|
chr16_-_21425278
Show fit
|
1.09 |
ENST00000504841.6
ENST00000419180.6
|
NPIPB3
|
nuclear pore complex interacting protein family member B3
|
|
chr12_+_75480800
Show fit
|
1.09 |
ENST00000456650.7
|
GLIPR1
|
GLI pathogenesis related 1
|
|
chrX_+_79144664
Show fit
|
1.07 |
ENST00000645147.2
|
GPR174
|
G protein-coupled receptor 174
|
|
chr17_+_46511511
Show fit
|
1.07 |
ENST00000576629.5
|
LRRC37A2
|
leucine rich repeat containing 37 member A2
|
|
chr16_-_21857657
Show fit
|
1.06 |
ENST00000341400.11
ENST00000518761.8
ENST00000682606.1
|
NPIPB4
|
nuclear pore complex interacting protein family member B4
|
|
chr7_+_120273129
Show fit
|
1.05 |
ENST00000331113.9
|
KCND2
|
potassium voltage-gated channel subfamily D member 2
|
|
chr19_+_14583076
Show fit
|
1.04 |
ENST00000547437.5
ENST00000417570.6
|
CLEC17A
|
C-type lectin domain containing 17A
|
|
chr1_+_211326615
Show fit
|
1.04 |
ENST00000336184.6
|
TRAF5
|
TNF receptor associated factor 5
|
|
chr15_-_21742799
Show fit
|
1.03 |
ENST00000622410.2
|
ENSG00000278263.2
|
novel protein, identical to IGHV4-4
|
|
chr1_+_76867469
Show fit
|
0.99 |
ENST00000477717.6
|
ST6GALNAC5
|
ST6 N-acetylgalactosaminide alpha-2,6-sialyltransferase 5
|
|
chr17_-_31314040
Show fit
|
0.99 |
ENST00000330927.5
|
EVI2B
|
ecotropic viral integration site 2B
|
|
chr16_+_22513523
Show fit
|
0.98 |
ENST00000538606.5
ENST00000451409.5
ENST00000424340.5
ENST00000517539.5
ENST00000528249.5
|
NPIPB5
|
nuclear pore complex interacting protein family member B5
|
|
chr2_+_90082635
Show fit
|
0.97 |
ENST00000483379.1
|
IGKV1D-17
|
immunoglobulin kappa variable 1D-17
|
|
chr17_-_69244846
Show fit
|
0.97 |
ENST00000269081.8
|
ABCA10
|
ATP binding cassette subfamily A member 10
|
|
chr4_+_99816797
Show fit
|
0.96 |
ENST00000512369.2
ENST00000296414.11
|
DAPP1
|
dual adaptor of phosphotyrosine and 3-phosphoinositides 1
|
|
chr16_-_29505820
Show fit
|
0.96 |
ENST00000550665.5
|
NPIPB12
|
nuclear pore complex interacting protein family member B12
|
|
chr11_+_35180279
Show fit
|
0.96 |
ENST00000531873.5
|
CD44
|
CD44 molecule (Indian blood group)
|
|
chr12_+_54498766
Show fit
|
0.93 |
ENST00000545638.2
|
NCKAP1L
|
NCK associated protein 1 like
|
|
chr6_-_169250825
Show fit
|
0.93 |
ENST00000676869.1
ENST00000676760.1
|
THBS2
|
thrombospondin 2
|
|
chr15_-_22185402
Show fit
|
0.92 |
ENST00000557788.2
|
IGHV4OR15-8
|
immunoglobulin heavy variable 4/OR15-8 (non-functional)
|
|
chr12_+_40742342
Show fit
|
0.92 |
ENST00000548005.5
ENST00000552248.5
|
CNTN1
|
contactin 1
|
|
chr15_-_74367637
Show fit
|
0.91 |
ENST00000268053.11
ENST00000416978.1
|
CYP11A1
|
cytochrome P450 family 11 subfamily A member 1
|
|
chr7_-_5528029
Show fit
|
0.91 |
ENST00000464611.1
|
ACTB
|
actin beta
|
|
chr19_-_39335999
Show fit
|
0.90 |
ENST00000602185.5
ENST00000598034.5
ENST00000601387.5
ENST00000595636.1
ENST00000253054.12
ENST00000594700.5
ENST00000597595.6
|
GMFG
|
glia maturation factor gamma
|
|
chr14_+_21887848
Show fit
|
0.90 |
ENST00000390437.2
|
TRAV12-2
|
T cell receptor alpha variable 12-2
|
|
chr16_-_29404029
Show fit
|
0.90 |
ENST00000524087.5
|
NPIPB11
|
nuclear pore complex interacting protein family member B11
|
|
chr17_-_31314066
Show fit
|
0.90 |
ENST00000577894.1
|
EVI2B
|
ecotropic viral integration site 2B
|
|
chr18_+_54591159
Show fit
|
0.89 |
ENST00000321600.1
ENST00000648945.2
|
DYNAP
|
dynactin associated protein
|
|
chr19_-_23687163
Show fit
|
0.89 |
ENST00000601010.5
ENST00000601935.5
ENST00000600313.5
ENST00000596211.5
ENST00000359788.9
ENST00000599168.1
|
ZNF675
|
zinc finger protein 675
|
|
chr1_-_229342966
Show fit
|
0.87 |
ENST00000284617.7
|
CCSAP
|
centriole, cilia and spindle associated protein
|
|
chr16_+_28637654
Show fit
|
0.87 |
ENST00000529716.5
|
NPIPB8
|
nuclear pore complex interacting protein family member B8
|
|
chr11_+_67583742
Show fit
|
0.87 |
ENST00000398603.6
|
GSTP1
|
glutathione S-transferase pi 1
|
|
chr15_+_75198866
Show fit
|
0.86 |
ENST00000562637.1
ENST00000360639.6
|
C15orf39
|
chromosome 15 open reading frame 39
|
|
chr20_+_3786772
Show fit
|
0.85 |
ENST00000344256.10
ENST00000379598.9
|
CDC25B
|
cell division cycle 25B
|
|
chr14_-_68884202
Show fit
|
0.85 |
ENST00000553290.1
|
ACTN1
|
actinin alpha 1
|
|
chr9_+_111525148
Show fit
|
0.85 |
ENST00000358151.8
ENST00000309235.6
ENST00000355824.7
ENST00000374374.3
|
ZNF483
|
zinc finger protein 483
|
|
chr18_+_32091849
Show fit
|
0.85 |
ENST00000261593.8
ENST00000578914.1
|
RNF138
|
ring finger protein 138
|
|
chr19_+_18097763
Show fit
|
0.85 |
ENST00000262811.10
|
MAST3
|
microtubule associated serine/threonine kinase 3
|
|
chr16_+_85027735
Show fit
|
0.84 |
ENST00000258180.7
ENST00000538274.5
|
KIAA0513
|
KIAA0513
|
|
chr7_+_76461676
Show fit
|
0.83 |
ENST00000425780.5
ENST00000456590.5
ENST00000451769.5
ENST00000324432.9
ENST00000457529.5
ENST00000446600.5
ENST00000430490.7
ENST00000413936.6
ENST00000423646.5
ENST00000438930.5
|
DTX2
|
deltex E3 ubiquitin ligase 2
|
|
chr6_-_130956371
Show fit
|
0.83 |
ENST00000639623.1
ENST00000525193.5
ENST00000527659.5
|
EPB41L2
|
erythrocyte membrane protein band 4.1 like 2
|
|
chr11_+_73950985
Show fit
|
0.82 |
ENST00000339764.6
|
DNAJB13
|
DnaJ heat shock protein family (Hsp40) member B13
|
|
chr3_+_119173564
Show fit
|
0.82 |
ENST00000264234.8
ENST00000479520.5
ENST00000494855.5
|
UPK1B
|
uroplakin 1B
|
|
chr16_+_22490337
Show fit
|
0.81 |
ENST00000415833.6
|
NPIPB5
|
nuclear pore complex interacting protein family member B5
|
|
chr12_+_75481204
Show fit
|
0.81 |
ENST00000550491.1
|
GLIPR1
|
GLI pathogenesis related 1
|
|
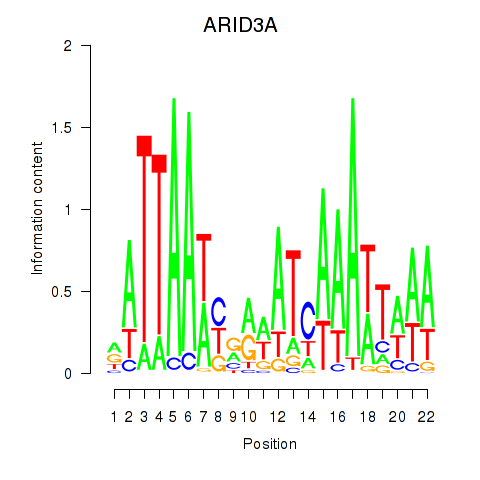
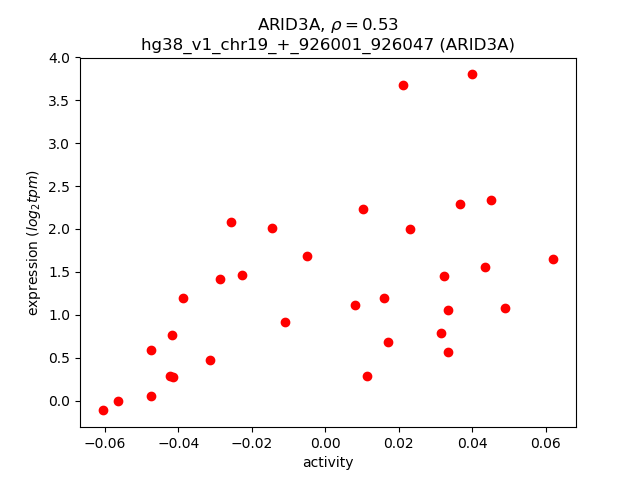
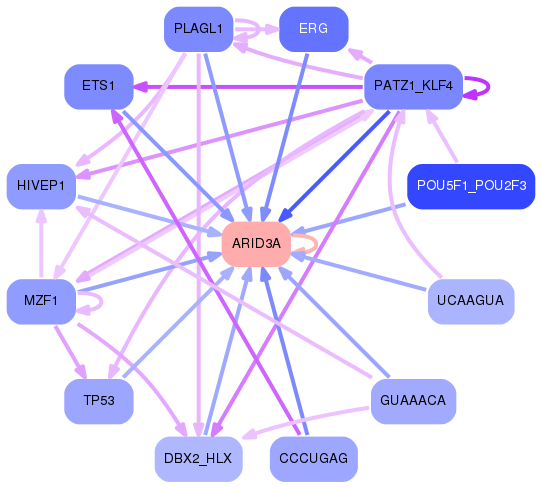
chr19_+_926001
Show fit
|
0.80 |
ENST00000263620.8
|
ARID3A
|
AT-rich interaction domain 3A
|
|
chr7_-_22500152
Show fit
|
0.80 |
ENST00000406890.6
ENST00000678116.1
ENST00000424363.5
|
STEAP1B
|
STEAP family member 1B
|
|
chr10_+_26438317
Show fit
|
0.80 |
ENST00000376236.9
|
APBB1IP
|
amyloid beta precursor protein binding family B member 1 interacting protein
|
|
chr16_-_21857418
Show fit
|
0.79 |
ENST00000415645.6
|
NPIPB4
|
nuclear pore complex interacting protein family member B4
|
|
chr10_+_110005804
Show fit
|
0.79 |
ENST00000360162.7
|
ADD3
|
adducin 3
|
|
chr16_+_70646536
Show fit
|
0.78 |
ENST00000288098.6
|
IL34
|
interleukin 34
|
|
chr7_-_6009019
Show fit
|
0.77 |
ENST00000382321.5
ENST00000265849.12
|
PMS2
|
PMS1 homolog 2, mismatch repair system component
|
|
chr19_-_20565769
Show fit
|
0.77 |
ENST00000427401.9
|
ZNF737
|
zinc finger protein 737
|
|
chr10_-_97270638
Show fit
|
0.76 |
ENST00000371027.5
|
ARHGAP19
|
Rho GTPase activating protein 19
|
|
chr16_-_28363508
Show fit
|
0.76 |
ENST00000532254.1
|
NPIPB6
|
nuclear pore complex interacting protein family member B6
|
|
chr12_+_9827517
Show fit
|
0.75 |
ENST00000537723.5
|
KLRF1
|
killer cell lectin like receptor F1
|
|
chr12_+_133181409
Show fit
|
0.75 |
ENST00000416488.5
ENST00000228289.9
ENST00000541211.6
ENST00000536435.7
ENST00000500625.7
ENST00000539248.6
ENST00000542711.6
ENST00000536899.6
ENST00000542986.6
ENST00000611984.4
ENST00000541975.2
|
ZNF268
|
zinc finger protein 268
|
|
chr1_-_183569186
Show fit
|
0.74 |
ENST00000420553.5
ENST00000419402.1
|
NCF2
|
neutrophil cytosolic factor 2
|
|
chr10_-_122845850
Show fit
|
0.74 |
ENST00000392790.6
|
CUZD1
|
CUB and zona pellucida like domains 1
|
|
chr1_-_154627906
Show fit
|
0.73 |
ENST00000679899.1
|
ADAR
|
adenosine deaminase RNA specific
|
|
chr17_-_3696033
Show fit
|
0.73 |
ENST00000551178.5
ENST00000552276.5
ENST00000547178.5
|
P2RX5
|
purinergic receptor P2X 5
|
|
chr11_+_67583803
Show fit
|
0.72 |
ENST00000398606.10
|
GSTP1
|
glutathione S-transferase pi 1
|
|
chr12_-_7695752
Show fit
|
0.72 |
ENST00000329913.4
|
GDF3
|
growth differentiation factor 3
|
|
chr6_-_49713564
Show fit
|
0.71 |
ENST00000616725.4
ENST00000618917.4
|
CRISP2
|
cysteine rich secretory protein 2
|
|
chr3_-_3109980
Show fit
|
0.70 |
ENST00000256452.7
ENST00000311981.12
ENST00000430514.6
ENST00000456302.5
|
IL5RA
|
interleukin 5 receptor subunit alpha
|
|
chr18_+_63887698
Show fit
|
0.70 |
ENST00000457692.5
ENST00000299502.9
ENST00000413956.5
|
SERPINB2
|
serpin family B member 2
|
|
chr17_+_42853232
Show fit
|
0.69 |
ENST00000617500.4
|
AOC3
|
amine oxidase copper containing 3
|
|
chr14_-_68794597
Show fit
|
0.69 |
ENST00000336440.3
|
ZFP36L1
|
ZFP36 ring finger protein like 1
|
|
chr12_-_10435940
Show fit
|
0.68 |
ENST00000381901.5
ENST00000381902.7
ENST00000539033.1
|
KLRC2
ENSG00000255641.1
|
killer cell lectin like receptor C2
novel protein
|
|
chr17_+_42853265
Show fit
|
0.68 |
ENST00000592999.5
|
AOC3
|
amine oxidase copper containing 3
|
|
chr21_+_33070133
Show fit
|
0.68 |
ENST00000382348.2
|
OLIG1
|
oligodendrocyte transcription factor 1
|
|
chr1_-_154627945
Show fit
|
0.67 |
ENST00000681683.1
ENST00000368471.8
ENST00000649042.1
ENST00000680270.1
ENST00000649022.2
ENST00000681056.1
ENST00000649724.1
|
ADAR
|
adenosine deaminase RNA specific
|
|
chr7_+_116222804
Show fit
|
0.67 |
ENST00000393481.6
|
TES
|
testin LIM domain protein
|
|
chr8_+_85187650
Show fit
|
0.66 |
ENST00000517476.5
ENST00000521429.5
|
E2F5
|
E2F transcription factor 5
|
|
chr14_+_96797304
Show fit
|
0.66 |
ENST00000553683.2
ENST00000680538.1
ENST00000681195.1
ENST00000679727.1
ENST00000680509.1
ENST00000557222.6
ENST00000680683.1
ENST00000680335.1
ENST00000216639.8
ENST00000679736.1
ENST00000681176.1
ENST00000557352.2
ENST00000679903.1
ENST00000681419.1
ENST00000680849.1
ENST00000681493.1
ENST00000679770.1
ENST00000681355.1
ENST00000681344.1
|
VRK1
|
VRK serine/threonine kinase 1
|
|
chr12_-_68302872
Show fit
|
0.65 |
ENST00000539972.5
|
MDM1
|
Mdm1 nuclear protein
|
|
chr7_-_6009072
Show fit
|
0.65 |
ENST00000642456.1
ENST00000642292.1
ENST00000441476.6
|
PMS2
|
PMS1 homolog 2, mismatch repair system component
|
|
chr9_+_6215786
Show fit
|
0.64 |
ENST00000417746.6
ENST00000682010.1
|
IL33
|
interleukin 33
|
|
chr5_-_39270623
Show fit
|
0.64 |
ENST00000512138.1
ENST00000646045.2
|
FYB1
|
FYN binding protein 1
|
|
chr17_+_42854078
Show fit
|
0.64 |
ENST00000591562.1
ENST00000588033.1
|
AOC3
|
amine oxidase copper containing 3
|
|
chr16_-_11281322
Show fit
|
0.63 |
ENST00000312511.4
|
PRM1
|
protamine 1
|
|
chr1_-_89126066
Show fit
|
0.63 |
ENST00000370466.4
|
GBP2
|
guanylate binding protein 2
|
|
chr2_+_172860038
Show fit
|
0.63 |
ENST00000538974.5
ENST00000540783.5
|
RAPGEF4
|
Rap guanine nucleotide exchange factor 4
|
|
chr5_+_141208697
Show fit
|
0.63 |
ENST00000624949.1
ENST00000622978.1
ENST00000239450.4
|
PCDHB12
|
protocadherin beta 12
|
|
chr4_+_70028452
Show fit
|
0.63 |
ENST00000530128.5
ENST00000381057.3
ENST00000673563.1
|
HTN3
|
histatin 3
|
|
chr16_-_75464655
Show fit
|
0.63 |
ENST00000569276.1
ENST00000357613.8
ENST00000561878.2
ENST00000566980.1
ENST00000567194.5
|
TMEM170A
ENSG00000261717.5
|
transmembrane protein 170A
novel TMEM170A-CFDP1 readthrough protein
|
|
chr12_-_120327762
Show fit
|
0.61 |
ENST00000308366.9
ENST00000423423.3
|
PLA2G1B
|
phospholipase A2 group IB
|
|
chr1_+_84181630
Show fit
|
0.60 |
ENST00000610457.1
|
PRKACB
|
protein kinase cAMP-activated catalytic subunit beta
|
|
chrX_+_1268828
Show fit
|
0.59 |
ENST00000432318.8
ENST00000381509.8
ENST00000494969.7
ENST00000355805.7
ENST00000355432.8
|
CSF2RA
|
colony stimulating factor 2 receptor subunit alpha
|
|
chr19_-_13506408
Show fit
|
0.59 |
ENST00000637736.1
ENST00000637432.1
ENST00000638029.1
ENST00000360228.11
ENST00000638009.2
ENST00000637769.1
ENST00000635895.1
|
CACNA1A
|
calcium voltage-gated channel subunit alpha1 A
|
|
chr17_-_3696133
Show fit
|
0.59 |
ENST00000225328.10
|
P2RX5
|
purinergic receptor P2X 5
|
|
chr12_+_51424802
Show fit
|
0.59 |
ENST00000453097.7
|
SLC4A8
|
solute carrier family 4 member 8
|
|
chr17_-_3696198
Show fit
|
0.58 |
ENST00000345901.7
|
P2RX5
|
purinergic receptor P2X 5
|
|
chr11_+_35180342
Show fit
|
0.58 |
ENST00000639002.1
|
CD44
|
CD44 molecule (Indian blood group)
|
|
chr6_+_151239951
Show fit
|
0.57 |
ENST00000402676.7
|
AKAP12
|
A-kinase anchoring protein 12
|
|
chr1_-_91906280
Show fit
|
0.57 |
ENST00000370399.6
|
TGFBR3
|
transforming growth factor beta receptor 3
|
|
chr20_-_43726989
Show fit
|
0.56 |
ENST00000373003.2
|
GTSF1L
|
gametocyte specific factor 1 like
|
|
chr2_-_70190900
Show fit
|
0.56 |
ENST00000425268.5
ENST00000428751.5
ENST00000417203.5
ENST00000417865.5
ENST00000428010.5
ENST00000447804.1
ENST00000264434.7
|
C2orf42
|
chromosome 2 open reading frame 42
|
|
chr4_+_73436198
Show fit
|
0.55 |
ENST00000395792.7
|
AFP
|
alpha fetoprotein
|
|
chrX_+_1268807
Show fit
|
0.55 |
ENST00000381524.8
ENST00000381529.9
ENST00000412290.6
|
CSF2RA
|
colony stimulating factor 2 receptor subunit alpha
|
|
chr21_+_14216145
Show fit
|
0.54 |
ENST00000400577.4
|
RBM11
|
RNA binding motif protein 11
|
|
chr1_-_247104278
Show fit
|
0.54 |
ENST00000366501.1
ENST00000366500.5
ENST00000448299.7
ENST00000476158.2
ENST00000343381.10
|
ZNF669
|
zinc finger protein 669
|
|
chr11_+_122838492
Show fit
|
0.53 |
ENST00000227348.9
|
CRTAM
|
cytotoxic and regulatory T cell molecule
|
|
chr12_+_54016879
Show fit
|
0.53 |
ENST00000303406.4
|
HOXC4
|
homeobox C4
|
|
chr9_-_122828539
Show fit
|
0.52 |
ENST00000259467.9
|
PDCL
|
phosducin like
|
|
chr19_-_53254841
Show fit
|
0.52 |
ENST00000601828.5
ENST00000599012.5
ENST00000598513.6
ENST00000598806.5
|
ZNF677
|
zinc finger protein 677
|
|
chr1_-_114780624
Show fit
|
0.52 |
ENST00000060969.6
ENST00000369528.9
|
SIKE1
|
suppressor of IKBKE 1
|
|
chr12_-_113335030
Show fit
|
0.51 |
ENST00000552014.5
ENST00000680972.1
ENST00000548186.5
ENST00000202831.7
ENST00000549181.5
|
SLC8B1
|
solute carrier family 8 member B1
|
|
chr3_+_142723999
Show fit
|
0.50 |
ENST00000476941.6
ENST00000273482.10
|
TRPC1
|
transient receptor potential cation channel subfamily C member 1
|
|
chr16_-_4767125
Show fit
|
0.50 |
ENST00000219478.11
ENST00000545009.1
|
ZNF500
|
zinc finger protein 500
|
|
chr3_-_139678011
Show fit
|
0.50 |
ENST00000646611.1
ENST00000645290.1
ENST00000647257.1
|
NMNAT3
|
nicotinamide nucleotide adenylyltransferase 3
|
|
chr15_-_74366178
Show fit
|
0.50 |
ENST00000450547.1
ENST00000358632.8
|
CYP11A1
|
cytochrome P450 family 11 subfamily A member 1
|
|
chr20_-_290717
Show fit
|
0.50 |
ENST00000360321.7
ENST00000400269.4
|
C20orf96
|
chromosome 20 open reading frame 96
|
|
chr7_-_105269007
Show fit
|
0.49 |
ENST00000357311.7
|
SRPK2
|
SRSF protein kinase 2
|
|
chr12_-_10409757
Show fit
|
0.49 |
ENST00000309384.2
|
KLRC4
|
killer cell lectin like receptor C4
|
|
chr1_+_112718880
Show fit
|
0.49 |
ENST00000361886.4
|
TAFA3
|
TAFA chemokine like family member 3
|
|
chr4_+_73436244
Show fit
|
0.49 |
ENST00000226359.2
|
AFP
|
alpha fetoprotein
|
|
chr12_+_71667783
Show fit
|
0.49 |
ENST00000551238.1
|
THAP2
|
THAP domain containing 2
|
|
chr6_-_46735693
Show fit
|
0.49 |
ENST00000537365.1
|
PLA2G7
|
phospholipase A2 group VII
|
|
chr1_-_181022842
Show fit
|
0.48 |
ENST00000258301.6
|
STX6
|
syntaxin 6
|
|
chr8_-_86230360
Show fit
|
0.48 |
ENST00000419776.2
ENST00000297524.8
|
SLC7A13
|
solute carrier family 7 member 13
|
|
chr20_-_57710539
Show fit
|
0.48 |
ENST00000395816.7
ENST00000347215.8
|
PMEPA1
|
prostate transmembrane protein, androgen induced 1
|
|
chr3_-_139677718
Show fit
|
0.47 |
ENST00000514703.5
ENST00000511444.5
ENST00000642987.1
ENST00000296202.11
ENST00000509291.5
ENST00000413939.6
ENST00000643695.2
ENST00000339837.9
ENST00000512391.5
ENST00000645507.1
|
NMNAT3
|
nicotinamide nucleotide adenylyltransferase 3
|
|
chr7_-_143647646
Show fit
|
0.47 |
ENST00000636941.1
|
TCAF2C
|
TRPM8 channel associated factor 2C
|
|
chr15_-_51243011
Show fit
|
0.47 |
ENST00000405913.7
ENST00000559878.5
|
CYP19A1
|
cytochrome P450 family 19 subfamily A member 1
|
|
chr12_+_64497968
Show fit
|
0.46 |
ENST00000676593.1
ENST00000677093.1
|
TBK1
ENSG00000288665.1
|
TANK binding kinase 1
novel transcript
|
|
chr9_-_146140
Show fit
|
0.46 |
ENST00000475990.5
|
CBWD1
|
COBW domain containing 1
|
|
chr12_+_10505602
Show fit
|
0.46 |
ENST00000322446.3
|
EIF2S3B
|
eukaryotic translation initiation factor 2 subunit gamma B
|
|
chr12_+_96912517
Show fit
|
0.45 |
ENST00000457368.2
|
NEDD1
|
NEDD1 gamma-tubulin ring complex targeting factor
|
|
chr6_-_49713521
Show fit
|
0.45 |
ENST00000339139.5
|
CRISP2
|
cysteine rich secretory protein 2
|
|
chr5_+_55160161
Show fit
|
0.45 |
ENST00000296734.6
ENST00000515370.1
ENST00000503787.6
|
GPX8
|
glutathione peroxidase 8 (putative)
|
|
chr1_-_72100930
Show fit
|
0.45 |
ENST00000306821.3
|
NEGR1
|
neuronal growth regulator 1
|
|
chr7_+_65373839
Show fit
|
0.45 |
ENST00000431504.1
ENST00000328747.12
|
ZNF92
|
zinc finger protein 92
|
|
chr7_+_141995872
Show fit
|
0.45 |
ENST00000497673.5
ENST00000620571.1
ENST00000475668.6
|
MGAM
|
maltase-glucoamylase
|
|
chr2_+_90209873
Show fit
|
0.44 |
ENST00000468879.1
|
IGKV1D-43
|
immunoglobulin kappa variable 1D-43
|
|
chr1_+_156126160
Show fit
|
0.44 |
ENST00000448611.6
ENST00000368297.5
|
LMNA
|
lamin A/C
|
|
chr12_+_40310431
Show fit
|
0.44 |
ENST00000681696.1
|
LRRK2
|
leucine rich repeat kinase 2
|
|
chr9_-_19786928
Show fit
|
0.44 |
ENST00000341998.6
ENST00000286344.3
|
SLC24A2
|
solute carrier family 24 member 2
|
|
chrX_+_1268786
Show fit
|
0.43 |
ENST00000501036.7
ENST00000417535.7
|
CSF2RA
|
colony stimulating factor 2 receptor subunit alpha
|
|
chr12_-_10420550
Show fit
|
0.41 |
ENST00000381903.2
ENST00000396439.7
|
KLRC3
|
killer cell lectin like receptor C3
|
|
chr6_+_42782020
Show fit
|
0.41 |
ENST00000314073.9
|
BICRAL
|
BRD4 interacting chromatin remodeling complex associated protein like
|
|
chr3_-_121660892
Show fit
|
0.41 |
ENST00000428394.6
ENST00000314583.8
|
HCLS1
|
hematopoietic cell-specific Lyn substrate 1
|
|
chr12_+_69239560
Show fit
|
0.41 |
ENST00000435070.7
|
CPSF6
|
cleavage and polyadenylation specific factor 6
|
|
chr12_+_10505890
Show fit
|
0.40 |
ENST00000538173.1
|
EIF2S3B
|
eukaryotic translation initiation factor 2 subunit gamma B
|
|
chrY_+_14522573
Show fit
|
0.40 |
ENST00000643089.1
ENST00000382872.5
|
NLGN4Y
|
neuroligin 4 Y-linked
|
|
chr10_+_89283685
Show fit
|
0.40 |
ENST00000638108.1
|
IFIT2
|
interferon induced protein with tetratricopeptide repeats 2
|
|
chr2_-_110577101
Show fit
|
0.40 |
ENST00000330331.9
ENST00000446930.1
ENST00000329516.8
|
RGPD6
|
RANBP2 like and GRIP domain containing 6
|
|
chr18_+_63476927
Show fit
|
0.40 |
ENST00000489441.5
ENST00000382771.9
ENST00000424602.1
|
SERPINB5
|
serpin family B member 5
|
|
chr19_+_20776292
Show fit
|
0.40 |
ENST00000360204.5
ENST00000344519.10
ENST00000594534.5
|
ZNF66
|
zinc finger protein 66
|
|
chr2_+_109794263
Show fit
|
0.39 |
ENST00000272454.10
|
RGPD5
|
RANBP2 like and GRIP domain containing 5
|
|
chr7_+_18496492
Show fit
|
0.39 |
ENST00000441986.5
|
HDAC9
|
histone deacetylase 9
|
|
chr17_-_15563428
Show fit
|
0.38 |
ENST00000584811.5
ENST00000419890.3
ENST00000518321.6
ENST00000438826.7
ENST00000225576.7
ENST00000428082.6
ENST00000522212.6
|
TVP23C
TVP23C-CDRT4
|
trans-golgi network vesicle protein 23 homolog C
TVP23C-CDRT4 readthrough
|
|
chr1_-_94925759
Show fit
|
0.38 |
ENST00000415017.1
ENST00000545882.5
|
CNN3
|
calponin 3
|
|
chr7_-_124929938
Show fit
|
0.38 |
ENST00000668382.1
ENST00000655761.1
ENST00000393329.5
|
POT1
|
protection of telomeres 1
|
|
chr1_-_20119527
Show fit
|
0.38 |
ENST00000375105.8
ENST00000617227.1
|
PLA2G2D
|
phospholipase A2 group IID
|
|
chr22_-_36365036
Show fit
|
0.37 |
ENST00000456729.1
ENST00000401701.1
|
MYH9
|
myosin heavy chain 9
|
|
chr4_+_158210479
Show fit
|
0.37 |
ENST00000504569.5
ENST00000509278.5
ENST00000514558.5
ENST00000503200.5
ENST00000296529.11
|
TMEM144
|
transmembrane protein 144
|
|
chr13_-_78659124
Show fit
|
0.37 |
ENST00000282003.7
|
OBI1
|
ORC ubiquitin ligase 1
|
|
chr5_-_41794211
Show fit
|
0.37 |
ENST00000512084.5
|
OXCT1
|
3-oxoacid CoA-transferase 1
|
|
chr6_+_72366730
Show fit
|
0.37 |
ENST00000414192.2
|
RIMS1
|
regulating synaptic membrane exocytosis 1
|
|
chr16_-_67980483
Show fit
|
0.36 |
ENST00000268793.6
ENST00000672962.1
|
DPEP3
|
dipeptidase 3
|
|
chr2_+_109794296
Show fit
|
0.36 |
ENST00000430736.5
ENST00000016946.8
ENST00000441344.1
|
RGPD5
|
RANBP2 like and GRIP domain containing 5
|
|
chr16_-_30610342
Show fit
|
0.36 |
ENST00000287461.8
|
ZNF689
|
zinc finger protein 689
|
|
chr21_+_32298945
Show fit
|
0.36 |
ENST00000339944.4
|
MRAP
|
melanocortin 2 receptor accessory protein
|
|
chr12_+_119334722
Show fit
|
0.36 |
ENST00000327554.3
|
CCDC60
|
coiled-coil domain containing 60
|
|
chr14_-_53958757
Show fit
|
0.36 |
ENST00000559642.1
|
BMP4
|
bone morphogenetic protein 4
|
|
chr2_+_105851748
Show fit
|
0.36 |
ENST00000425756.1
ENST00000393349.2
|
NCK2
|
NCK adaptor protein 2
|
|
chr1_+_171557845
Show fit
|
0.36 |
ENST00000644916.1
|
PRRC2C
|
proline rich coiled-coil 2C
|
