Project
Illumina Body Map 2 (GSE30611)
Navigation
Downloads
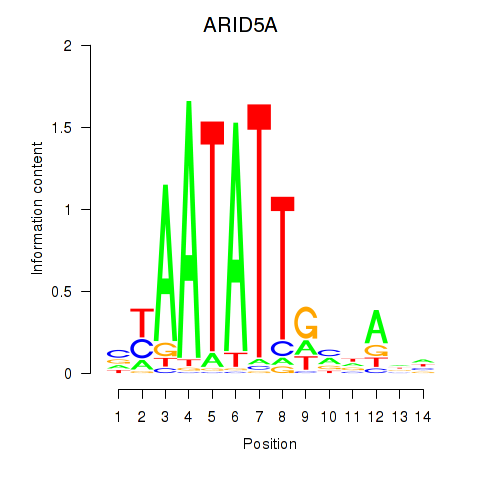
Results for ARID5A
Z-value: 1.09
Motif logo
Transcription factors associated with ARID5A
| Gene Symbol | Gene ID | Gene Info |
|---|---|---|
|
ARID5A
|
ENSG00000196843.17 | AT-rich interaction domain 5A |
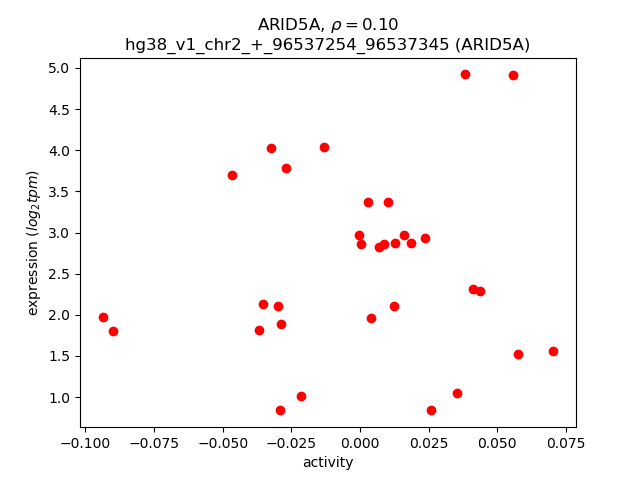
Activity-expression correlation:
| Gene | Promoter | Pearson corr. coef. | P-value | Plot |
|---|---|---|---|---|
| ARID5A | hg38_v1_chr2_+_96537254_96537345 | 0.10 | 5.7e-01 | Click! |
Activity profile of ARID5A motif
Sorted Z-values of ARID5A motif
| Promoter | Log-likelihood | Transcript | Gene | Gene Info |
|---|---|---|---|---|
| chr7_+_80624071 | 3.89 |
ENST00000438020.5
|
CD36
|
CD36 molecule |
| chr2_+_151357583 | 2.68 |
ENST00000243347.5
|
TNFAIP6
|
TNF alpha induced protein 6 |
| chr2_+_167135901 | 2.68 |
ENST00000628543.2
|
XIRP2
|
xin actin binding repeat containing 2 |
| chr7_+_80638510 | 2.60 |
ENST00000433696.6
ENST00000538969.5 ENST00000544133.5 |
CD36
|
CD36 molecule |
| chr16_-_31428325 | 2.53 |
ENST00000287490.5
|
COX6A2
|
cytochrome c oxidase subunit 6A2 |
| chr7_+_80638633 | 2.17 |
ENST00000447544.7
ENST00000482059.6 |
CD36
|
CD36 molecule |
| chr7_+_80638662 | 2.07 |
ENST00000394788.7
|
CD36
|
CD36 molecule |
| chr4_+_119135825 | 2.04 |
ENST00000307128.6
|
MYOZ2
|
myozenin 2 |
| chr4_-_99352730 | 1.93 |
ENST00000510055.5
ENST00000515683.6 ENST00000511397.3 |
ADH1C
|
alcohol dehydrogenase 1C (class I), gamma polypeptide |
| chrX_+_71301742 | 1.86 |
ENST00000373829.8
ENST00000538820.1 |
ITGB1BP2
|
integrin subunit beta 1 binding protein 2 |
| chr3_+_130560334 | 1.85 |
ENST00000358511.10
|
COL6A6
|
collagen type VI alpha 6 chain |
| chr7_+_80624961 | 1.72 |
ENST00000436384.5
|
CD36
|
CD36 molecule |
| chr1_-_197067234 | 1.68 |
ENST00000367412.2
|
F13B
|
coagulation factor XIII B chain |
| chr6_-_49866453 | 1.60 |
ENST00000507853.5
|
CRISP1
|
cysteine rich secretory protein 1 |
| chr7_+_16661182 | 1.59 |
ENST00000446596.5
ENST00000452975.6 ENST00000438834.5 |
BZW2
|
basic leucine zipper and W2 domains 2 |
| chr1_+_171185293 | 1.59 |
ENST00000209929.10
|
FMO2
|
flavin containing dimethylaniline monoxygenase 2 |
| chr1_+_173635332 | 1.59 |
ENST00000417563.3
|
TEX50
|
testis expressed 50 |
| chr7_+_16646131 | 1.58 |
ENST00000415365.5
ENST00000433922.6 ENST00000630952.2 ENST00000258761.8 ENST00000405202.5 |
BZW2
|
basic leucine zipper and W2 domains 2 |
| chr10_+_68109433 | 1.57 |
ENST00000613327.4
ENST00000358913.10 ENST00000373675.3 |
MYPN
|
myopalladin |
| chr18_-_63661884 | 1.56 |
ENST00000332821.8
ENST00000283752.10 |
SERPINB3
|
serpin family B member 3 |
| chr20_+_142573 | 1.55 |
ENST00000382398.4
|
DEFB126
|
defensin beta 126 |
| chr4_-_176195563 | 1.54 |
ENST00000280191.7
|
SPATA4
|
spermatogenesis associated 4 |
| chr9_-_92482350 | 1.54 |
ENST00000375543.2
|
ASPN
|
asporin |
| chr11_-_102724945 | 1.53 |
ENST00000236826.8
|
MMP8
|
matrix metallopeptidase 8 |
| chr1_+_40247926 | 1.52 |
ENST00000372766.4
|
TMCO2
|
transmembrane and coiled-coil domains 2 |
| chr6_-_49866527 | 1.52 |
ENST00000335847.9
|
CRISP1
|
cysteine rich secretory protein 1 |
| chr2_-_216860042 | 1.52 |
ENST00000236979.2
|
TNP1
|
transition protein 1 |
| chr3_-_150703943 | 1.49 |
ENST00000491361.5
|
ERICH6
|
glutamate rich 6 |
| chr4_-_154590735 | 1.48 |
ENST00000403106.8
ENST00000622532.1 ENST00000651975.1 |
FGA
|
fibrinogen alpha chain |
| chr3_-_69122588 | 1.43 |
ENST00000420581.7
ENST00000489031.5 |
LMOD3
|
leiomodin 3 |
| chr11_-_102724781 | 1.38 |
ENST00000438475.2
|
MMP8
|
matrix metallopeptidase 8 |
| chr3_+_148697784 | 1.36 |
ENST00000497524.5
ENST00000418473.7 ENST00000349243.8 ENST00000404754.2 |
AGTR1
|
angiotensin II receptor type 1 |
| chr8_+_24440930 | 1.33 |
ENST00000441335.6
ENST00000175238.10 ENST00000380789.5 |
ADAM7
|
ADAM metallopeptidase domain 7 |
| chrX_+_136169833 | 1.31 |
ENST00000628032.2
|
FHL1
|
four and a half LIM domains 1 |
| chrX_+_136169891 | 1.29 |
ENST00000449474.5
|
FHL1
|
four and a half LIM domains 1 |
| chr4_-_99352754 | 1.23 |
ENST00000639454.1
|
ADH1B
|
alcohol dehydrogenase 1B (class I), beta polypeptide |
| chr12_+_21131187 | 1.22 |
ENST00000256958.3
|
SLCO1B1
|
solute carrier organic anion transporter family member 1B1 |
| chr1_+_196943738 | 1.20 |
ENST00000367415.8
ENST00000367421.5 ENST00000649283.1 ENST00000476712.6 ENST00000496448.6 ENST00000473386.1 ENST00000649960.1 |
CFHR2
|
complement factor H related 2 |
| chr16_-_11281322 | 1.20 |
ENST00000312511.4
|
PRM1
|
protamine 1 |
| chr13_-_110242694 | 1.19 |
ENST00000648989.1
ENST00000647797.1 ENST00000648966.1 ENST00000649484.1 ENST00000648695.1 ENST00000650115.1 ENST00000650566.1 |
COL4A1
|
collagen type IV alpha 1 chain |
| chrX_+_83861126 | 1.19 |
ENST00000621735.4
ENST00000329312.5 |
CYLC1
|
cylicin 1 |
| chrX_-_139965510 | 1.15 |
ENST00000370540.2
|
CXorf66
|
chromosome X open reading frame 66 |
| chr20_+_33283205 | 1.14 |
ENST00000253354.2
|
BPIFB1
|
BPI fold containing family B member 1 |
| chr2_-_68952880 | 1.14 |
ENST00000481498.1
ENST00000328895.9 |
GKN2
|
gastrokine 2 |
| chr11_-_6440980 | 1.13 |
ENST00000265983.8
ENST00000615166.1 |
HPX
|
hemopexin |
| chrX_-_155026868 | 1.10 |
ENST00000453950.1
ENST00000423959.5 |
F8
|
coagulation factor VIII |
| chrX_+_80420466 | 1.10 |
ENST00000308293.5
|
TENT5D
|
terminal nucleotidyltransferase 5D |
| chr1_-_75932392 | 1.09 |
ENST00000284142.7
|
ASB17
|
ankyrin repeat and SOCS box containing 17 |
| chr16_+_55488580 | 1.09 |
ENST00000570283.1
|
MMP2
|
matrix metallopeptidase 2 |
| chr7_-_120858066 | 1.08 |
ENST00000222747.8
|
TSPAN12
|
tetraspanin 12 |
| chr8_-_51809414 | 1.06 |
ENST00000356297.5
|
PXDNL
|
peroxidasin like |
| chrM_+_8366 | 1.06 |
ENST00000361851.1
|
MT-ATP8
|
mitochondrially encoded ATP synthase membrane subunit 8 |
| chr19_-_42442938 | 1.03 |
ENST00000601181.6
|
CXCL17
|
C-X-C motif chemokine ligand 17 |
| chr12_+_9971402 | 0.99 |
ENST00000304361.9
ENST00000396507.7 ENST00000434319.6 |
CLEC12A
|
C-type lectin domain family 12 member A |
| chr7_-_120858303 | 0.98 |
ENST00000415871.5
ENST00000430985.1 |
TSPAN12
|
tetraspanin 12 |
| chr2_-_40512423 | 0.96 |
ENST00000402441.5
ENST00000448531.1 |
SLC8A1
|
solute carrier family 8 member A1 |
| chr4_-_185657520 | 0.94 |
ENST00000438278.5
|
SORBS2
|
sorbin and SH3 domain containing 2 |
| chr4_-_185649524 | 0.93 |
ENST00000451974.5
|
SORBS2
|
sorbin and SH3 domain containing 2 |
| chr5_-_157166262 | 0.93 |
ENST00000302938.4
|
FAM71B
|
family with sequence similarity 71 member B |
| chr2_+_118942188 | 0.92 |
ENST00000327097.5
|
MARCO
|
macrophage receptor with collagenous structure |
| chr10_+_46375619 | 0.91 |
ENST00000584982.7
ENST00000613703.4 |
ANXA8L1
|
annexin A8 like 1 |
| chr3_-_123980727 | 0.90 |
ENST00000620893.4
|
ROPN1
|
rhophilin associated tail protein 1 |
| chr12_+_130953898 | 0.90 |
ENST00000261654.10
|
ADGRD1
|
adhesion G protein-coupled receptor D1 |
| chr3_+_148730100 | 0.88 |
ENST00000474935.5
ENST00000475347.5 ENST00000461609.1 |
AGTR1
|
angiotensin II receptor type 1 |
| chr12_+_9827472 | 0.88 |
ENST00000617793.4
ENST00000617889.5 ENST00000354855.7 ENST00000279545.7 |
KLRF1
|
killer cell lectin like receptor F1 |
| chr14_-_24576240 | 0.87 |
ENST00000216336.3
|
CTSG
|
cathepsin G |
| chr7_+_121076570 | 0.85 |
ENST00000443817.1
|
CPED1
|
cadherin like and PC-esterase domain containing 1 |
| chr11_+_62208665 | 0.84 |
ENST00000244930.6
|
SCGB2A1
|
secretoglobin family 2A member 1 |
| chr1_+_247857178 | 0.84 |
ENST00000366481.4
|
TRIM58
|
tripartite motif containing 58 |
| chr1_-_89126066 | 0.83 |
ENST00000370466.4
|
GBP2
|
guanylate binding protein 2 |
| chr12_+_59689337 | 0.82 |
ENST00000261187.8
|
SLC16A7
|
solute carrier family 16 member 7 |
| chr2_-_229923163 | 0.81 |
ENST00000435716.5
|
TRIP12
|
thyroid hormone receptor interactor 12 |
| chrX_-_32155462 | 0.81 |
ENST00000359836.5
ENST00000378707.7 ENST00000541735.5 ENST00000684130.1 ENST00000682238.1 ENST00000620040.5 ENST00000474231.5 |
DMD
|
dystrophin |
| chr4_+_95840084 | 0.81 |
ENST00000295266.6
|
PDHA2
|
pyruvate dehydrogenase E1 subunit alpha 2 |
| chr11_-_119379095 | 0.81 |
ENST00000527843.1
|
USP2
|
ubiquitin specific peptidase 2 |
| chr17_-_45262084 | 0.80 |
ENST00000331780.5
|
SPATA32
|
spermatogenesis associated 32 |
| chr12_-_52903648 | 0.80 |
ENST00000546900.1
|
KRT8
|
keratin 8 |
| chrX_-_108439472 | 0.80 |
ENST00000372216.8
|
COL4A6
|
collagen type IV alpha 6 chain |
| chr2_-_40512361 | 0.80 |
ENST00000403092.5
|
SLC8A1
|
solute carrier family 8 member A1 |
| chr11_+_60429567 | 0.79 |
ENST00000300190.7
|
MS4A5
|
membrane spanning 4-domains A5 |
| chr11_-_125778788 | 0.77 |
ENST00000436890.2
|
PATE2
|
prostate and testis expressed 2 |
| chr7_-_92179127 | 0.77 |
ENST00000437357.1
ENST00000458448.6 |
LRRD1
|
leucine rich repeats and death domain containing 1 |
| chr2_+_73784189 | 0.76 |
ENST00000409561.1
|
C2orf78
|
chromosome 2 open reading frame 78 |
| chr2_+_118942290 | 0.76 |
ENST00000412481.1
|
MARCO
|
macrophage receptor with collagenous structure |
| chr2_-_187448244 | 0.75 |
ENST00000392370.8
ENST00000410068.5 ENST00000447403.5 ENST00000410102.5 |
CALCRL
|
calcitonin receptor like receptor |
| chr1_-_100178215 | 0.75 |
ENST00000370138.1
ENST00000370137.6 ENST00000342895.7 ENST00000620882.4 |
LRRC39
|
leucine rich repeat containing 39 |
| chr5_+_76609091 | 0.74 |
ENST00000514001.5
ENST00000396234.7 ENST00000509074.5 ENST00000502745.5 |
IQGAP2
|
IQ motif containing GTPase activating protein 2 |
| chr2_+_201116940 | 0.74 |
ENST00000433445.1
|
CFLAR
|
CASP8 and FADD like apoptosis regulator |
| chr18_-_27990256 | 0.74 |
ENST00000675173.1
|
CDH2
|
cadherin 2 |
| chr12_-_91178520 | 0.73 |
ENST00000425043.5
ENST00000420120.6 ENST00000441303.6 ENST00000456569.2 |
DCN
|
decorin |
| chr13_+_30422487 | 0.73 |
ENST00000638137.1
ENST00000635918.2 |
UBE2L5
|
ubiquitin conjugating enzyme E2 L5 |
| chr4_-_44651619 | 0.73 |
ENST00000415895.9
ENST00000332990.6 |
YIPF7
|
Yip1 domain family member 7 |
| chr3_-_108953870 | 0.72 |
ENST00000261047.8
|
GUCA1C
|
guanylate cyclase activator 1C |
| chr12_+_10307950 | 0.72 |
ENST00000543420.5
ENST00000543777.5 |
KLRD1
|
killer cell lectin like receptor D1 |
| chr10_+_50990864 | 0.72 |
ENST00000401604.8
|
PRKG1
|
protein kinase cGMP-dependent 1 |
| chr6_+_10555787 | 0.72 |
ENST00000316170.9
|
GCNT2
|
glucosaminyl (N-acetyl) transferase 2 (I blood group) |
| chr10_-_114632011 | 0.71 |
ENST00000651023.1
|
ABLIM1
|
actin binding LIM protein 1 |
| chrX_+_88749318 | 0.71 |
ENST00000614120.1
|
CPXCR1
|
CPX chromosome region candidate 1 |
| chr10_+_46375645 | 0.70 |
ENST00000622769.4
|
ANXA8L1
|
annexin A8 like 1 |
| chr7_+_16526824 | 0.69 |
ENST00000401542.3
|
LRRC72
|
leucine rich repeat containing 72 |
| chr6_-_26056460 | 0.69 |
ENST00000343677.4
|
H1-2
|
H1.2 linker histone, cluster member |
| chr1_+_196977550 | 0.69 |
ENST00000256785.5
|
CFHR5
|
complement factor H related 5 |
| chr2_+_188974364 | 0.68 |
ENST00000304636.9
ENST00000317840.9 |
COL3A1
|
collagen type III alpha 1 chain |
| chr6_+_10528326 | 0.68 |
ENST00000379597.7
|
GCNT2
|
glucosaminyl (N-acetyl) transferase 2 (I blood group) |
| chr3_-_48898813 | 0.68 |
ENST00000319017.5
ENST00000430379.5 |
SLC25A20
|
solute carrier family 25 member 20 |
| chr3_-_142029108 | 0.66 |
ENST00000497579.5
|
TFDP2
|
transcription factor Dp-2 |
| chrY_+_14522573 | 0.66 |
ENST00000643089.1
ENST00000382872.5 |
NLGN4Y
|
neuroligin 4 Y-linked |
| chr8_-_73259502 | 0.66 |
ENST00000624510.3
ENST00000613105.4 ENST00000625134.1 |
C8orf89
|
chromosome 8 open reading frame 89 |
| chr11_+_60378524 | 0.65 |
ENST00000530614.5
ENST00000530027.5 ENST00000300184.8 ENST00000530234.2 ENST00000528215.1 ENST00000531787.5 |
MS4A7
MS4A14
|
membrane spanning 4-domains A7 membrane spanning 4-domains A14 |
| chr6_-_132763424 | 0.65 |
ENST00000532012.1
ENST00000525270.5 ENST00000530536.5 ENST00000524919.5 |
VNN2
|
vanin 2 |
| chr1_-_158686700 | 0.65 |
ENST00000643759.2
|
SPTA1
|
spectrin alpha, erythrocytic 1 |
| chr7_+_116953306 | 0.64 |
ENST00000265437.9
ENST00000393451.7 |
ST7
|
suppression of tumorigenicity 7 |
| chrX_+_65588368 | 0.63 |
ENST00000609672.5
|
MSN
|
moesin |
| chr21_+_29300770 | 0.63 |
ENST00000447177.5
|
BACH1
|
BTB domain and CNC homolog 1 |
| chr4_+_93203949 | 0.63 |
ENST00000512631.1
|
GRID2
|
glutamate ionotropic receptor delta type subunit 2 |
| chr10_+_94683722 | 0.63 |
ENST00000285979.11
|
CYP2C18
|
cytochrome P450 family 2 subfamily C member 18 |
| chr3_-_100840109 | 0.63 |
ENST00000533795.5
|
ABI3BP
|
ABI family member 3 binding protein |
| chr14_-_34785864 | 0.62 |
ENST00000556314.2
|
BAZ1A
|
bromodomain adjacent to zinc finger domain 1A |
| chr1_-_23014024 | 0.61 |
ENST00000440767.2
ENST00000622840.1 |
TEX46
|
testis expressed 46 |
| chr9_-_101383558 | 0.60 |
ENST00000674556.1
|
BAAT
|
bile acid-CoA:amino acid N-acyltransferase |
| chr14_+_90256521 | 0.60 |
ENST00000553835.5
|
PSMC1
|
proteasome 26S subunit, ATPase 1 |
| chr3_+_37990725 | 0.58 |
ENST00000416303.5
|
VILL
|
villin like |
| chr20_+_6006039 | 0.58 |
ENST00000452938.5
ENST00000378863.9 |
CRLS1
|
cardiolipin synthase 1 |
| chr14_-_67412112 | 0.58 |
ENST00000216446.9
|
PLEK2
|
pleckstrin 2 |
| chr19_+_35641728 | 0.58 |
ENST00000619399.4
ENST00000379026.6 ENST00000379023.8 ENST00000402764.6 ENST00000479824.5 |
ETV2
|
ETS variant transcription factor 2 |
| chrX_+_88747225 | 0.58 |
ENST00000276127.9
ENST00000373111.5 |
CPXCR1
|
CPX chromosome region candidate 1 |
| chr20_+_17699960 | 0.57 |
ENST00000246090.6
|
BANF2
|
BANF family member 2 |
| chr12_+_110280602 | 0.57 |
ENST00000552636.2
|
ATP2A2
|
ATPase sarcoplasmic/endoplasmic reticulum Ca2+ transporting 2 |
| chrX_+_37990773 | 0.57 |
ENST00000341016.5
|
H2AP
|
H2A.P histone |
| chr11_+_112175526 | 0.57 |
ENST00000532612.5
ENST00000438022.5 |
BCO2
|
beta-carotene oxygenase 2 |
| chr17_+_57096603 | 0.57 |
ENST00000576591.1
|
AKAP1
|
A-kinase anchoring protein 1 |
| chr19_-_54313074 | 0.57 |
ENST00000486742.2
ENST00000432233.8 |
LILRA5
|
leukocyte immunoglobulin like receptor A5 |
| chr7_+_50095841 | 0.57 |
ENST00000297001.7
|
SPATA48
|
spermatogenesis associated 48 |
| chr6_-_32668368 | 0.56 |
ENST00000399084.5
|
HLA-DQB1
|
major histocompatibility complex, class II, DQ beta 1 |
| chr11_-_125778818 | 0.56 |
ENST00000358524.8
|
PATE2
|
prostate and testis expressed 2 |
| chrX_+_108044967 | 0.56 |
ENST00000415430.7
|
VSIG1
|
V-set and immunoglobulin domain containing 1 |
| chr1_+_116909869 | 0.56 |
ENST00000393203.3
|
PTGFRN
|
prostaglandin F2 receptor inhibitor |
| chr7_-_16881967 | 0.56 |
ENST00000402239.7
ENST00000310398.7 ENST00000414935.1 |
AGR3
|
anterior gradient 3, protein disulphide isomerase family member |
| chr15_-_41230697 | 0.56 |
ENST00000314992.9
ENST00000558396.1 ENST00000458580.7 |
EXD1
|
exonuclease 3'-5' domain containing 1 |
| chr1_+_212301806 | 0.56 |
ENST00000537030.3
|
PPP2R5A
|
protein phosphatase 2 regulatory subunit B'alpha |
| chr11_-_74697694 | 0.56 |
ENST00000529912.5
|
CHRDL2
|
chordin like 2 |
| chrX_+_108045050 | 0.55 |
ENST00000458383.1
ENST00000217957.10 |
VSIG1
|
V-set and immunoglobulin domain containing 1 |
| chr5_-_132543513 | 0.55 |
ENST00000231454.6
|
IL5
|
interleukin 5 |
| chr4_+_42892713 | 0.55 |
ENST00000399770.3
|
GRXCR1
|
glutaredoxin and cysteine rich domain containing 1 |
| chr21_-_34526815 | 0.55 |
ENST00000492600.1
|
RCAN1
|
regulator of calcineurin 1 |
| chr12_-_85036246 | 0.54 |
ENST00000547836.1
ENST00000532498.7 |
TSPAN19
|
tetraspanin 19 |
| chr20_+_17699942 | 0.54 |
ENST00000427254.1
ENST00000377805.7 |
BANF2
|
BANF family member 2 |
| chr2_-_231530427 | 0.54 |
ENST00000305141.5
|
NMUR1
|
neuromedin U receptor 1 |
| chr12_-_91179355 | 0.54 |
ENST00000550563.5
ENST00000546370.5 |
DCN
|
decorin |
| chr6_-_49744378 | 0.54 |
ENST00000371159.8
ENST00000263045.9 |
CRISP3
|
cysteine rich secretory protein 3 |
| chr12_+_9827517 | 0.54 |
ENST00000537723.5
|
KLRF1
|
killer cell lectin like receptor F1 |
| chr3_-_150703965 | 0.54 |
ENST00000498386.1
|
ERICH6
|
glutamate rich 6 |
| chr6_-_10415043 | 0.53 |
ENST00000379613.10
|
TFAP2A
|
transcription factor AP-2 alpha |
| chr18_+_63887698 | 0.53 |
ENST00000457692.5
ENST00000299502.9 ENST00000413956.5 |
SERPINB2
|
serpin family B member 2 |
| chr20_+_31475278 | 0.53 |
ENST00000201979.3
|
REM1
|
RRAD and GEM like GTPase 1 |
| chr12_+_20810698 | 0.53 |
ENST00000540853.5
ENST00000381545.8 |
SLCO1B3
|
solute carrier organic anion transporter family member 1B3 |
| chr17_-_73227700 | 0.53 |
ENST00000579872.1
ENST00000580032.1 |
FAM104A
|
family with sequence similarity 104 member A |
| chr3_-_151278535 | 0.53 |
ENST00000309170.8
|
P2RY14
|
purinergic receptor P2Y14 |
| chr11_+_60515389 | 0.52 |
ENST00000378186.7
ENST00000378185.6 ENST00000437058.6 ENST00000527948.1 |
MS4A13
|
membrane spanning 4-domains A13 |
| chr1_-_89175997 | 0.52 |
ENST00000294671.3
ENST00000650452.1 |
GBP7
|
guanylate binding protein 7 |
| chr8_+_7825137 | 0.52 |
ENST00000335186.3
|
DEFB106A
|
defensin beta 106A |
| chr5_-_132556809 | 0.52 |
ENST00000450655.1
|
IL5
|
interleukin 5 |
| chr4_+_69931066 | 0.52 |
ENST00000246891.9
|
CSN1S1
|
casein alpha s1 |
| chrX_-_135781729 | 0.52 |
ENST00000617203.1
|
CT45A5
|
cancer/testis antigen family 45 member A5 |
| chr3_+_14675128 | 0.52 |
ENST00000435614.5
ENST00000253697.8 ENST00000412910.1 |
C3orf20
|
chromosome 3 open reading frame 20 |
| chrX_+_102307022 | 0.50 |
ENST00000604790.2
|
NXF2
|
nuclear RNA export factor 2 |
| chr2_+_149118169 | 0.50 |
ENST00000450639.5
|
LYPD6B
|
LY6/PLAUR domain containing 6B |
| chr4_-_69760596 | 0.49 |
ENST00000510821.1
|
SULT1B1
|
sulfotransferase family 1B member 1 |
| chr19_-_43670153 | 0.49 |
ENST00000601723.5
ENST00000339082.7 ENST00000340093.8 |
PLAUR
|
plasminogen activator, urokinase receptor |
| chr15_-_59689283 | 0.49 |
ENST00000607373.6
ENST00000612191.4 ENST00000267859.8 |
BNIP2
|
BCL2 interacting protein 2 |
| chr1_+_207089283 | 0.49 |
ENST00000391923.1
|
C4BPB
|
complement component 4 binding protein beta |
| chr9_-_24545866 | 0.49 |
ENST00000543880.7
ENST00000418122.1 |
IZUMO3
|
IZUMO family member 3 |
| chr8_+_36784324 | 0.48 |
ENST00000523973.5
ENST00000399881.8 |
KCNU1
|
potassium calcium-activated channel subfamily U member 1 |
| chr6_-_49744434 | 0.48 |
ENST00000433368.6
ENST00000354620.4 |
CRISP3
|
cysteine rich secretory protein 3 |
| chr3_+_142623386 | 0.47 |
ENST00000337777.7
ENST00000497199.5 |
PLS1
|
plastin 1 |
| chr4_+_70383123 | 0.47 |
ENST00000304915.8
|
SMR3B
|
submaxillary gland androgen regulated protein 3B |
| chr15_-_89815332 | 0.47 |
ENST00000559874.2
|
ANPEP
|
alanyl aminopeptidase, membrane |
| chr18_-_55422262 | 0.46 |
ENST00000629343.2
|
TCF4
|
transcription factor 4 |
| chr4_-_68670648 | 0.46 |
ENST00000338206.6
|
UGT2B15
|
UDP glucuronosyltransferase family 2 member B15 |
| chr11_+_60429595 | 0.46 |
ENST00000528905.1
ENST00000528093.1 |
MS4A5
|
membrane spanning 4-domains A5 |
| chr11_+_71833200 | 0.46 |
ENST00000328698.2
|
DEFB108B
|
defensin beta 108B |
| chr8_-_7486400 | 0.46 |
ENST00000335479.2
|
DEFB106B
|
defensin beta 106B |
| chr17_-_10549694 | 0.45 |
ENST00000622564.4
|
MYH2
|
myosin heavy chain 2 |
| chr10_+_35167516 | 0.45 |
ENST00000361599.8
|
CREM
|
cAMP responsive element modulator |
| chr12_-_56613098 | 0.45 |
ENST00000551996.1
|
BAZ2A
|
bromodomain adjacent to zinc finger domain 2A |
| chr12_-_4649043 | 0.45 |
ENST00000545990.6
ENST00000228850.6 |
AKAP3
|
A-kinase anchoring protein 3 |
| chr18_-_55422492 | 0.45 |
ENST00000561992.5
ENST00000630712.2 |
TCF4
|
transcription factor 4 |
| chr7_-_32070809 | 0.45 |
ENST00000396182.6
|
PDE1C
|
phosphodiesterase 1C |
| chr4_-_102828048 | 0.45 |
ENST00000508249.1
|
UBE2D3
|
ubiquitin conjugating enzyme E2 D3 |
| chr15_+_21637909 | 0.45 |
ENST00000332663.3
|
OR4M2B
|
olfactory receptor family 4 subfamily M member 2B |
| chr11_+_60378494 | 0.44 |
ENST00000534016.5
|
MS4A7
|
membrane spanning 4-domains A7 |
| chr1_+_207089233 | 0.44 |
ENST00000243611.9
ENST00000367076.7 |
C4BPB
|
complement component 4 binding protein beta |
| chr7_+_76461676 | 0.44 |
ENST00000425780.5
ENST00000456590.5 ENST00000451769.5 ENST00000324432.9 ENST00000457529.5 ENST00000446600.5 ENST00000430490.7 ENST00000413936.6 ENST00000423646.5 ENST00000438930.5 |
DTX2
|
deltex E3 ubiquitin ligase 2 |
| chr10_-_22210021 | 0.44 |
ENST00000422359.2
|
EBLN1
|
endogenous Bornavirus like nucleoprotein 1 |
| chr9_-_34381531 | 0.43 |
ENST00000379124.5
ENST00000379126.7 ENST00000379127.1 |
C9orf24
|
chromosome 9 open reading frame 24 |
| chr8_-_81531378 | 0.43 |
ENST00000360464.4
|
FABP12
|
fatty acid binding protein 12 |
| chr1_-_112711355 | 0.43 |
ENST00000606505.5
ENST00000605933.5 |
ENSG00000271810.5
|
novel protein, PPM1J-RHOC readthrough |
| chr17_+_57096701 | 0.43 |
ENST00000314126.4
|
AKAP1
|
A-kinase anchoring protein 1 |
| chr6_+_30067530 | 0.43 |
ENST00000376765.6
ENST00000376763.5 |
PPP1R11
|
protein phosphatase 1 regulatory inhibitor subunit 11 |
| chr11_-_73876674 | 0.43 |
ENST00000545127.1
ENST00000537289.1 ENST00000355693.5 |
COA4
|
cytochrome c oxidase assembly factor 4 homolog |
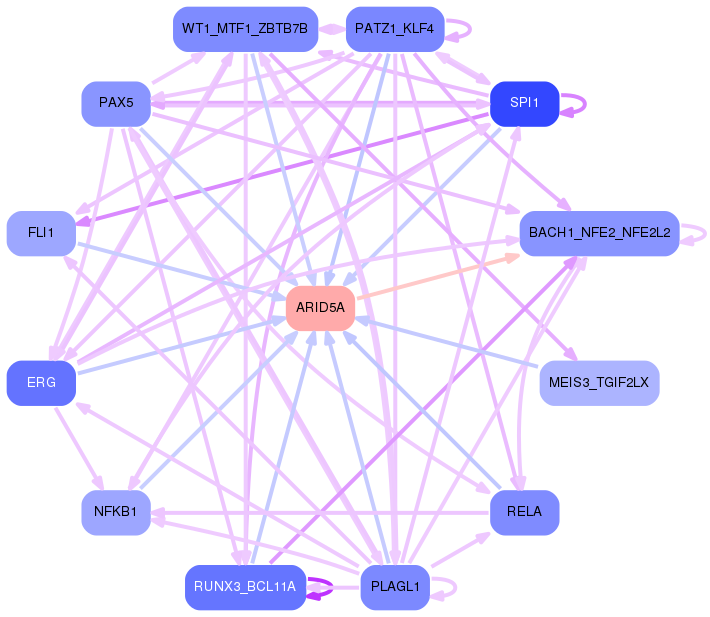
Network of associatons between targets according to the STRING database.

First level regulatory network of ARID5A
Gene Ontology Analysis
Gene overrepresentation in biological process category:
| Log-likelihood per target | Total log-likelihood | Term | Description |
|---|---|---|---|
| 1.0 | 12.4 | GO:0072564 | response to linoleic acid(GO:0070543) blood microparticle formation(GO:0072564) regulation of blood microparticle formation(GO:2000332) positive regulation of blood microparticle formation(GO:2000334) |
| 0.6 | 2.2 | GO:0086097 | phospholipase C-activating angiotensin-activated signaling pathway(GO:0086097) |
| 0.5 | 1.6 | GO:0035425 | autocrine signaling(GO:0035425) |
| 0.4 | 1.1 | GO:0045643 | regulation of eosinophil differentiation(GO:0045643) positive regulation of eosinophil differentiation(GO:0045645) |
| 0.3 | 0.8 | GO:0044278 | cell wall disruption in other organism(GO:0044278) |
| 0.3 | 1.5 | GO:0007290 | spermatid nucleus elongation(GO:0007290) |
| 0.2 | 1.2 | GO:0061304 | retinal blood vessel morphogenesis(GO:0061304) |
| 0.2 | 0.7 | GO:0006844 | acyl carnitine transport(GO:0006844) acyl carnitine transmembrane transport(GO:1902616) |
| 0.2 | 1.3 | GO:0042776 | mitochondrial ATP synthesis coupled proton transport(GO:0042776) |
| 0.2 | 0.6 | GO:0060796 | regulation of transcription involved in primary germ layer cell fate commitment(GO:0060796) |
| 0.2 | 1.5 | GO:0070171 | negative regulation of tooth mineralization(GO:0070171) |
| 0.2 | 0.6 | GO:1903515 | calcium ion transport from cytosol to endoplasmic reticulum(GO:1903515) |
| 0.2 | 0.6 | GO:0016116 | tetraterpenoid metabolic process(GO:0016108) carotenoid metabolic process(GO:0016116) carotene catabolic process(GO:0016121) xanthophyll metabolic process(GO:0016122) terpene catabolic process(GO:0046247) |
| 0.2 | 1.4 | GO:0036438 | maintenance of lens transparency(GO:0036438) |
| 0.2 | 3.3 | GO:0006069 | ethanol oxidation(GO:0006069) |
| 0.2 | 1.1 | GO:0002925 | positive regulation of humoral immune response mediated by circulating immunoglobulin(GO:0002925) positive regulation of response to interferon-gamma(GO:0060332) positive regulation of interferon-gamma-mediated signaling pathway(GO:0060335) |
| 0.2 | 1.6 | GO:0070995 | NADPH oxidation(GO:0070995) |
| 0.2 | 2.2 | GO:0045919 | positive regulation of cytolysis(GO:0045919) |
| 0.2 | 2.5 | GO:0044557 | relaxation of smooth muscle(GO:0044557) |
| 0.1 | 1.4 | GO:0051694 | pointed-end actin filament capping(GO:0051694) |
| 0.1 | 0.8 | GO:0003409 | optic cup structural organization(GO:0003409) |
| 0.1 | 0.5 | GO:1901842 | negative regulation of high voltage-gated calcium channel activity(GO:1901842) |
| 0.1 | 0.4 | GO:1904425 | negative regulation of GTP binding(GO:1904425) |
| 0.1 | 0.6 | GO:0022614 | membrane to membrane docking(GO:0022614) |
| 0.1 | 0.4 | GO:0060003 | copper ion export(GO:0060003) |
| 0.1 | 0.4 | GO:0019417 | sulfur oxidation(GO:0019417) |
| 0.1 | 0.4 | GO:0070145 | mitochondrial asparaginyl-tRNA aminoacylation(GO:0070145) |
| 0.1 | 3.4 | GO:0007342 | fusion of sperm to egg plasma membrane(GO:0007342) |
| 0.1 | 0.3 | GO:0071449 | cellular response to lipid hydroperoxide(GO:0071449) |
| 0.1 | 2.8 | GO:0006123 | mitochondrial electron transport, cytochrome c to oxygen(GO:0006123) |
| 0.1 | 0.6 | GO:0000117 | regulation of transcription involved in G2/M transition of mitotic cell cycle(GO:0000117) |
| 0.1 | 1.5 | GO:0043152 | induction of bacterial agglutination(GO:0043152) |
| 0.1 | 0.9 | GO:0045959 | regulation of complement activation, classical pathway(GO:0030450) negative regulation of complement activation, classical pathway(GO:0045959) |
| 0.1 | 1.1 | GO:0001957 | intramembranous ossification(GO:0001957) direct ossification(GO:0036072) |
| 0.1 | 0.9 | GO:0070944 | neutrophil mediated cytotoxicity(GO:0070942) neutrophil mediated killing of symbiont cell(GO:0070943) neutrophil mediated killing of bacterium(GO:0070944) |
| 0.1 | 1.1 | GO:0034144 | negative regulation of toll-like receptor 4 signaling pathway(GO:0034144) |
| 0.1 | 0.5 | GO:1902896 | terminal web assembly(GO:1902896) |
| 0.1 | 0.3 | GO:2000502 | negative regulation of natural killer cell chemotaxis(GO:2000502) |
| 0.1 | 0.8 | GO:1901315 | negative regulation of histone ubiquitination(GO:0033183) regulation of histone H2A K63-linked ubiquitination(GO:1901314) negative regulation of histone H2A K63-linked ubiquitination(GO:1901315) |
| 0.1 | 0.2 | GO:0003350 | pulmonary myocardium development(GO:0003350) |
| 0.1 | 0.5 | GO:0061760 | antifungal innate immune response(GO:0061760) |
| 0.1 | 0.3 | GO:0007499 | ectoderm and mesoderm interaction(GO:0007499) |
| 0.1 | 1.6 | GO:1900747 | negative regulation of vascular endothelial growth factor signaling pathway(GO:1900747) |
| 0.1 | 0.8 | GO:1901475 | pyruvate transport(GO:0006848) pyruvate transmembrane transport(GO:1901475) |
| 0.1 | 0.6 | GO:0090219 | negative regulation of lipid kinase activity(GO:0090219) |
| 0.1 | 0.2 | GO:0000255 | allantoin metabolic process(GO:0000255) |
| 0.1 | 0.4 | GO:1900041 | negative regulation of interleukin-2 secretion(GO:1900041) |
| 0.1 | 0.2 | GO:1903413 | cellular response to bile acid(GO:1903413) |
| 0.1 | 0.3 | GO:1903173 | phytol metabolic process(GO:0033306) fatty alcohol metabolic process(GO:1903173) |
| 0.1 | 1.0 | GO:0031284 | positive regulation of guanylate cyclase activity(GO:0031284) |
| 0.1 | 0.1 | GO:2001186 | negative regulation of CD8-positive, alpha-beta T cell activation(GO:2001186) |
| 0.1 | 1.8 | GO:0048739 | cardiac muscle fiber development(GO:0048739) |
| 0.1 | 0.5 | GO:0038195 | urokinase plasminogen activator signaling pathway(GO:0038195) |
| 0.1 | 2.7 | GO:0030728 | ovulation(GO:0030728) |
| 0.1 | 0.7 | GO:1902897 | regulation of postsynaptic density protein 95 clustering(GO:1902897) |
| 0.1 | 1.3 | GO:0001778 | plasma membrane repair(GO:0001778) |
| 0.1 | 0.6 | GO:1900454 | positive regulation of long term synaptic depression(GO:1900454) |
| 0.1 | 0.8 | GO:0045986 | response to sucrose(GO:0009744) response to disaccharide(GO:0034285) negative regulation of smooth muscle contraction(GO:0045986) |
| 0.1 | 0.2 | GO:0035752 | lysosomal lumen pH elevation(GO:0035752) |
| 0.1 | 0.6 | GO:0097068 | response to thyroxine(GO:0097068) response to L-phenylalanine derivative(GO:1904386) |
| 0.1 | 0.2 | GO:2000255 | negative regulation of male germ cell proliferation(GO:2000255) |
| 0.1 | 0.7 | GO:1903943 | regulation of hepatocyte apoptotic process(GO:1903943) negative regulation of hepatocyte apoptotic process(GO:1903944) |
| 0.1 | 0.3 | GO:0071395 | response to jasmonic acid(GO:0009753) cellular response to jasmonic acid stimulus(GO:0071395) |
| 0.1 | 0.8 | GO:0014809 | regulation of skeletal muscle contraction by regulation of release of sequestered calcium ion(GO:0014809) |
| 0.0 | 0.4 | GO:0060414 | aorta smooth muscle tissue morphogenesis(GO:0060414) |
| 0.0 | 0.6 | GO:0016554 | cytidine to uridine editing(GO:0016554) |
| 0.0 | 0.9 | GO:0010578 | regulation of adenylate cyclase activity involved in G-protein coupled receptor signaling pathway(GO:0010578) positive regulation of adenylate cyclase activity involved in G-protein coupled receptor signaling pathway(GO:0010579) |
| 0.0 | 0.8 | GO:0051599 | response to hydrostatic pressure(GO:0051599) |
| 0.0 | 0.2 | GO:0032690 | negative regulation of interleukin-1 alpha production(GO:0032690) negative regulation of interleukin-1 alpha secretion(GO:0050712) |
| 0.0 | 0.2 | GO:0002314 | germinal center B cell differentiation(GO:0002314) |
| 0.0 | 0.3 | GO:0019556 | histidine catabolic process to glutamate and formamide(GO:0019556) histidine catabolic process to glutamate and formate(GO:0019557) formamide metabolic process(GO:0043606) |
| 0.0 | 0.6 | GO:0019530 | taurine metabolic process(GO:0019530) |
| 0.0 | 0.3 | GO:0090166 | Golgi disassembly(GO:0090166) |
| 0.0 | 0.9 | GO:0010510 | acetyl-CoA biosynthetic process from pyruvate(GO:0006086) regulation of acetyl-CoA biosynthetic process from pyruvate(GO:0010510) |
| 0.0 | 0.1 | GO:1902173 | negative regulation of keratinocyte apoptotic process(GO:1902173) |
| 0.0 | 0.8 | GO:0045475 | locomotor rhythm(GO:0045475) |
| 0.0 | 4.4 | GO:0030574 | collagen catabolic process(GO:0030574) |
| 0.0 | 1.1 | GO:0030277 | maintenance of gastrointestinal epithelium(GO:0030277) |
| 0.0 | 0.7 | GO:0097105 | presynaptic membrane assembly(GO:0097105) |
| 0.0 | 0.7 | GO:0015939 | pantothenate metabolic process(GO:0015939) |
| 0.0 | 0.2 | GO:0033387 | putrescine biosynthetic process from ornithine(GO:0033387) |
| 0.0 | 2.1 | GO:0015721 | bile acid and bile salt transport(GO:0015721) |
| 0.0 | 0.2 | GO:2001106 | regulation of Rho guanyl-nucleotide exchange factor activity(GO:2001106) |
| 0.0 | 0.2 | GO:0033088 | negative regulation of immature T cell proliferation in thymus(GO:0033088) |
| 0.0 | 0.2 | GO:0070966 | nuclear-transcribed mRNA catabolic process, no-go decay(GO:0070966) |
| 0.0 | 0.8 | GO:0035090 | maintenance of apical/basal cell polarity(GO:0035090) maintenance of epithelial cell apical/basal polarity(GO:0045199) |
| 0.0 | 0.8 | GO:0045899 | positive regulation of RNA polymerase II transcriptional preinitiation complex assembly(GO:0045899) |
| 0.0 | 0.8 | GO:0010759 | positive regulation of macrophage chemotaxis(GO:0010759) |
| 0.0 | 1.5 | GO:0010842 | retina layer formation(GO:0010842) |
| 0.0 | 1.9 | GO:0061049 | physiological muscle hypertrophy(GO:0003298) physiological cardiac muscle hypertrophy(GO:0003301) cell growth involved in cardiac muscle cell development(GO:0061049) |
| 0.0 | 0.4 | GO:0050957 | equilibrioception(GO:0050957) |
| 0.0 | 1.1 | GO:0042744 | hydrogen peroxide catabolic process(GO:0042744) |
| 0.0 | 0.2 | GO:0071461 | cellular response to redox state(GO:0071461) |
| 0.0 | 0.8 | GO:0035589 | G-protein coupled purinergic nucleotide receptor signaling pathway(GO:0035589) |
| 0.0 | 0.3 | GO:0048007 | antigen processing and presentation of lipid antigen via MHC class Ib(GO:0048003) antigen processing and presentation, exogenous lipid antigen via MHC class Ib(GO:0048007) |
| 0.0 | 0.2 | GO:0070269 | pyroptosis(GO:0070269) |
| 0.0 | 0.5 | GO:0009812 | flavonoid metabolic process(GO:0009812) |
| 0.0 | 0.1 | GO:0035992 | tendon development(GO:0035989) tendon cell differentiation(GO:0035990) tendon formation(GO:0035992) |
| 0.0 | 0.7 | GO:0070493 | thrombin receptor signaling pathway(GO:0070493) |
| 0.0 | 0.1 | GO:0035038 | female pronucleus assembly(GO:0035038) |
| 0.0 | 1.8 | GO:0007194 | negative regulation of adenylate cyclase activity(GO:0007194) |
| 0.0 | 0.4 | GO:0035845 | photoreceptor cell outer segment organization(GO:0035845) positive regulation of nonmotile primary cilium assembly(GO:1902857) |
| 0.0 | 0.8 | GO:0070884 | regulation of calcineurin-NFAT signaling cascade(GO:0070884) |
| 0.0 | 0.2 | GO:0071033 | posttranscriptional tethering of RNA polymerase II gene DNA at nuclear periphery(GO:0000973) nuclear retention of pre-mRNA at the site of transcription(GO:0071033) |
| 0.0 | 0.1 | GO:1900227 | positive regulation of NLRP3 inflammasome complex assembly(GO:1900227) |
| 0.0 | 0.3 | GO:0086024 | adrenergic receptor signaling pathway involved in positive regulation of heart rate(GO:0086024) |
| 0.0 | 1.2 | GO:0030261 | chromosome condensation(GO:0030261) |
| 0.0 | 0.5 | GO:0000183 | chromatin silencing at rDNA(GO:0000183) |
| 0.0 | 0.6 | GO:0019373 | epoxygenase P450 pathway(GO:0019373) |
| 0.0 | 0.1 | GO:0033364 | mast cell secretory granule organization(GO:0033364) |
| 0.0 | 0.6 | GO:0034587 | piRNA metabolic process(GO:0034587) |
| 0.0 | 0.5 | GO:0042730 | fibrinolysis(GO:0042730) |
| 0.0 | 0.7 | GO:0007597 | blood coagulation, intrinsic pathway(GO:0007597) |
| 0.0 | 2.4 | GO:0003254 | regulation of membrane depolarization(GO:0003254) |
| 0.0 | 0.2 | GO:0001705 | ectoderm formation(GO:0001705) ectodermal cell fate commitment(GO:0001712) |
| 0.0 | 0.4 | GO:0043568 | positive regulation of insulin-like growth factor receptor signaling pathway(GO:0043568) |
| 0.0 | 0.1 | GO:0044240 | multicellular organism lipid catabolic process(GO:0044240) |
| 0.0 | 2.7 | GO:0055008 | cardiac muscle tissue morphogenesis(GO:0055008) |
| 0.0 | 0.0 | GO:0007181 | transforming growth factor beta receptor complex assembly(GO:0007181) |
| 0.0 | 0.5 | GO:0052695 | cellular glucuronidation(GO:0052695) |
| 0.0 | 0.1 | GO:0002729 | positive regulation of natural killer cell cytokine production(GO:0002729) positive regulation of Fc receptor mediated stimulatory signaling pathway(GO:0060369) |
| 0.0 | 0.5 | GO:0016973 | poly(A)+ mRNA export from nucleus(GO:0016973) |
| 0.0 | 1.4 | GO:0070979 | protein K11-linked ubiquitination(GO:0070979) |
| 0.0 | 0.4 | GO:0033617 | mitochondrial respiratory chain complex IV assembly(GO:0033617) |
| 0.0 | 0.4 | GO:0043374 | CD8-positive, alpha-beta T cell differentiation(GO:0043374) |
| 0.0 | 0.2 | GO:0060005 | vestibular reflex(GO:0060005) |
| 0.0 | 0.1 | GO:0014056 | acetylcholine secretion, neurotransmission(GO:0014055) regulation of acetylcholine secretion, neurotransmission(GO:0014056) |
| 0.0 | 0.2 | GO:0032020 | ISG15-protein conjugation(GO:0032020) |
| 0.0 | 0.3 | GO:0098535 | de novo centriole assembly(GO:0098535) |
| 0.0 | 0.9 | GO:0010738 | regulation of protein kinase A signaling(GO:0010738) |
| 0.0 | 0.1 | GO:2000843 | testosterone secretion(GO:0035936) regulation of testosterone secretion(GO:2000843) positive regulation of testosterone secretion(GO:2000845) |
| 0.0 | 0.6 | GO:0060122 | inner ear receptor stereocilium organization(GO:0060122) |
| 0.0 | 0.4 | GO:0006228 | UTP biosynthetic process(GO:0006228) |
| 0.0 | 0.1 | GO:0045726 | positive regulation of integrin biosynthetic process(GO:0045726) cellular stress response to acidic pH(GO:1990451) |
| 0.0 | 0.3 | GO:0090160 | Golgi to lysosome transport(GO:0090160) |
| 0.0 | 0.3 | GO:0046069 | cGMP catabolic process(GO:0046069) |
| 0.0 | 0.6 | GO:0048016 | inositol phosphate-mediated signaling(GO:0048016) |
| 0.0 | 0.2 | GO:0008635 | activation of cysteine-type endopeptidase activity involved in apoptotic process by cytochrome c(GO:0008635) |
| 0.0 | 0.7 | GO:0000083 | regulation of transcription involved in G1/S transition of mitotic cell cycle(GO:0000083) |
| 0.0 | 0.1 | GO:0019720 | Mo-molybdopterin cofactor biosynthetic process(GO:0006777) Mo-molybdopterin cofactor metabolic process(GO:0019720) |
| 0.0 | 0.0 | GO:0045819 | positive regulation of glycogen catabolic process(GO:0045819) |
| 0.0 | 1.1 | GO:0050829 | defense response to Gram-negative bacterium(GO:0050829) |
| 0.0 | 0.6 | GO:0008334 | histone mRNA metabolic process(GO:0008334) |
| 0.0 | 0.3 | GO:0015865 | purine nucleotide transport(GO:0015865) |
| 0.0 | 0.4 | GO:0032515 | negative regulation of phosphoprotein phosphatase activity(GO:0032515) |
| 0.0 | 0.2 | GO:0010886 | positive regulation of cholesterol storage(GO:0010886) |
| 0.0 | 0.2 | GO:0035372 | protein localization to microtubule(GO:0035372) |
| 0.0 | 0.1 | GO:0060318 | regulation of definitive erythrocyte differentiation(GO:0010724) definitive erythrocyte differentiation(GO:0060318) |
| 0.0 | 0.9 | GO:0051693 | actin filament capping(GO:0051693) |
| 0.0 | 0.2 | GO:0000338 | protein deneddylation(GO:0000338) |
| 0.0 | 0.1 | GO:0000395 | mRNA 5'-splice site recognition(GO:0000395) |
| 0.0 | 0.1 | GO:0060988 | lipid tube assembly(GO:0060988) |
| 0.0 | 0.4 | GO:0031640 | killing of cells of other organism(GO:0031640) disruption of cells of other organism(GO:0044364) |
| 0.0 | 0.1 | GO:0033623 | regulation of integrin activation(GO:0033623) |
| 0.0 | 0.2 | GO:0043248 | proteasome assembly(GO:0043248) |
| 0.0 | 0.1 | GO:0043328 | protein targeting to vacuole involved in ubiquitin-dependent protein catabolic process via the multivesicular body sorting pathway(GO:0043328) |
| 0.0 | 0.3 | GO:0033189 | response to vitamin A(GO:0033189) |
| 0.0 | 0.5 | GO:0051894 | positive regulation of focal adhesion assembly(GO:0051894) |
| 0.0 | 0.1 | GO:0070857 | regulation of bile acid biosynthetic process(GO:0070857) |
| 0.0 | 0.1 | GO:0048386 | positive regulation of retinoic acid receptor signaling pathway(GO:0048386) |
| 0.0 | 0.1 | GO:0031665 | negative regulation of lipopolysaccharide-mediated signaling pathway(GO:0031665) |
| 0.0 | 0.1 | GO:0032071 | regulation of endodeoxyribonuclease activity(GO:0032071) |
| 0.0 | 0.2 | GO:0000733 | DNA strand renaturation(GO:0000733) |
| 0.0 | 0.1 | GO:0008063 | Toll signaling pathway(GO:0008063) |
| 0.0 | 0.3 | GO:0030889 | negative regulation of B cell proliferation(GO:0030889) |
| 0.0 | 3.5 | GO:0050911 | detection of chemical stimulus involved in sensory perception of smell(GO:0050911) |
Gene overrepresentation in cellular component category:
| Log-likelihood per target | Total log-likelihood | Term | Description |
|---|---|---|---|
| 0.4 | 1.2 | GO:0033150 | cytoskeletal calyx(GO:0033150) acrosomal matrix(GO:0043159) |
| 0.3 | 1.3 | GO:0005753 | mitochondrial proton-transporting ATP synthase complex(GO:0005753) proton-transporting ATP synthase complex(GO:0045259) |
| 0.2 | 12.4 | GO:0031092 | platelet alpha granule membrane(GO:0031092) |
| 0.2 | 1.5 | GO:0000788 | nuclear nucleosome(GO:0000788) |
| 0.2 | 0.6 | GO:0016590 | ACF complex(GO:0016590) |
| 0.2 | 0.6 | GO:1990923 | PET complex(GO:1990923) |
| 0.1 | 0.6 | GO:0030895 | apolipoprotein B mRNA editing enzyme complex(GO:0030895) |
| 0.1 | 2.5 | GO:0005751 | mitochondrial respiratory chain complex IV(GO:0005751) |
| 0.1 | 0.4 | GO:0097679 | other organism cytoplasm(GO:0097679) |
| 0.1 | 1.6 | GO:0098647 | collagen type VI trimer(GO:0005589) collagen beaded filament(GO:0098647) |
| 0.1 | 1.5 | GO:0005577 | fibrinogen complex(GO:0005577) |
| 0.1 | 0.5 | GO:1990742 | microvesicle(GO:1990742) |
| 0.1 | 0.6 | GO:1990357 | terminal web(GO:1990357) |
| 0.1 | 0.3 | GO:0097125 | cyclin B1-CDK1 complex(GO:0097125) |
| 0.1 | 0.9 | GO:0045254 | pyruvate dehydrogenase complex(GO:0045254) |
| 0.1 | 0.5 | GO:0042272 | nuclear RNA export factor complex(GO:0042272) |
| 0.1 | 0.6 | GO:0032437 | cuticular plate(GO:0032437) |
| 0.1 | 0.6 | GO:0005683 | U7 snRNP(GO:0005683) |
| 0.1 | 6.7 | GO:1904724 | tertiary granule lumen(GO:1904724) |
| 0.1 | 1.2 | GO:0032982 | myosin filament(GO:0032982) |
| 0.1 | 0.5 | GO:0033553 | rDNA heterochromatin(GO:0033553) |
| 0.1 | 0.8 | GO:0031595 | nuclear proteasome complex(GO:0031595) |
| 0.1 | 1.2 | GO:0000786 | nucleosome(GO:0000786) |
| 0.1 | 0.2 | GO:0045277 | respiratory chain complex IV(GO:0045277) |
| 0.1 | 0.8 | GO:0005587 | collagen type IV trimer(GO:0005587) |
| 0.1 | 0.7 | GO:0005916 | fascia adherens(GO:0005916) |
| 0.1 | 0.2 | GO:0043293 | apoptosome(GO:0043293) |
| 0.0 | 0.1 | GO:0060342 | photoreceptor inner segment membrane(GO:0060342) |
| 0.0 | 0.4 | GO:0005594 | collagen type IX trimer(GO:0005594) |
| 0.0 | 0.8 | GO:0016013 | syntrophin complex(GO:0016013) |
| 0.0 | 1.1 | GO:0071682 | endocytic vesicle lumen(GO:0071682) |
| 0.0 | 0.1 | GO:0034515 | proteasome storage granule(GO:0034515) |
| 0.0 | 0.6 | GO:0060091 | kinocilium(GO:0060091) |
| 0.0 | 0.7 | GO:0097470 | ribbon synapse(GO:0097470) |
| 0.0 | 3.4 | GO:0031941 | filamentous actin(GO:0031941) |
| 0.0 | 0.2 | GO:0072557 | IPAF inflammasome complex(GO:0072557) |
| 0.0 | 0.4 | GO:0042567 | insulin-like growth factor ternary complex(GO:0042567) |
| 0.0 | 0.5 | GO:0035686 | sperm fibrous sheath(GO:0035686) |
| 0.0 | 1.4 | GO:0005865 | striated muscle thin filament(GO:0005865) |
| 0.0 | 0.4 | GO:0005672 | transcription factor TFIIA complex(GO:0005672) |
| 0.0 | 0.9 | GO:0031254 | uropod(GO:0001931) cell trailing edge(GO:0031254) |
| 0.0 | 4.2 | GO:0005581 | collagen trimer(GO:0005581) |
| 0.0 | 0.7 | GO:0031265 | CD95 death-inducing signaling complex(GO:0031265) |
| 0.0 | 9.2 | GO:0030018 | Z disc(GO:0030018) |
| 0.0 | 0.5 | GO:0071438 | invadopodium membrane(GO:0071438) |
| 0.0 | 0.9 | GO:0097381 | photoreceptor disc membrane(GO:0097381) |
| 0.0 | 0.2 | GO:0005947 | mitochondrial alpha-ketoglutarate dehydrogenase complex(GO:0005947) |
| 0.0 | 0.4 | GO:0042613 | MHC class II protein complex(GO:0042613) |
| 0.0 | 0.2 | GO:1990316 | ATG1/ULK1 kinase complex(GO:1990316) |
| 0.0 | 0.1 | GO:0000814 | ESCRT II complex(GO:0000814) |
| 0.0 | 0.1 | GO:0072559 | NLRP3 inflammasome complex(GO:0072559) |
| 0.0 | 0.6 | GO:0005614 | interstitial matrix(GO:0005614) |
| 0.0 | 1.4 | GO:0045178 | basal part of cell(GO:0045178) |
| 0.0 | 0.2 | GO:0030478 | actin cap(GO:0030478) |
| 0.0 | 0.2 | GO:0032426 | stereocilium tip(GO:0032426) |
| 0.0 | 0.2 | GO:0097486 | multivesicular body lumen(GO:0097486) |
| 0.0 | 0.6 | GO:0031258 | lamellipodium membrane(GO:0031258) |
| 0.0 | 3.1 | GO:0032993 | protein-DNA complex(GO:0032993) |
| 0.0 | 0.2 | GO:0008290 | F-actin capping protein complex(GO:0008290) |
| 0.0 | 0.3 | GO:0000164 | protein phosphatase type 1 complex(GO:0000164) |
| 0.0 | 0.2 | GO:0070937 | CRD-mediated mRNA stability complex(GO:0070937) |
| 0.0 | 1.2 | GO:0030134 | ER to Golgi transport vesicle(GO:0030134) |
| 0.0 | 0.3 | GO:0042588 | zymogen granule(GO:0042588) |
| 0.0 | 0.1 | GO:0000243 | commitment complex(GO:0000243) |
| 0.0 | 0.1 | GO:0033588 | Elongator holoenzyme complex(GO:0033588) |
Gene overrepresentation in molecular function category:
| Log-likelihood per target | Total log-likelihood | Term | Description |
|---|---|---|---|
| 1.0 | 12.4 | GO:0070892 | lipoteichoic acid receptor activity(GO:0070892) |
| 0.7 | 2.2 | GO:0001596 | angiotensin type I receptor activity(GO:0001596) |
| 0.4 | 3.5 | GO:0004024 | alcohol dehydrogenase activity, zinc-dependent(GO:0004024) |
| 0.4 | 1.1 | GO:0005137 | interleukin-5 receptor binding(GO:0005137) |
| 0.3 | 2.0 | GO:0051373 | FATZ binding(GO:0051373) |
| 0.2 | 1.6 | GO:0004499 | N,N-dimethylaniline monooxygenase activity(GO:0004499) |
| 0.2 | 0.7 | GO:0015227 | acyl carnitine transmembrane transporter activity(GO:0015227) |
| 0.2 | 0.8 | GO:0005477 | pyruvate secondary active transmembrane transporter activity(GO:0005477) |
| 0.2 | 0.8 | GO:0004739 | pyruvate dehydrogenase (acetyl-transferring) activity(GO:0004739) |
| 0.2 | 0.6 | GO:0052816 | medium-chain acyl-CoA hydrolase activity(GO:0052815) long-chain acyl-CoA hydrolase activity(GO:0052816) |
| 0.2 | 1.8 | GO:0099580 | ion antiporter activity involved in regulation of postsynaptic membrane potential(GO:0099580) |
| 0.2 | 0.6 | GO:0031775 | lutropin-choriogonadotropic hormone receptor binding(GO:0031775) calcium-transporting ATPase activity involved in regulation of cardiac muscle cell membrane potential(GO:0086039) |
| 0.2 | 0.8 | GO:0004948 | calcitonin receptor activity(GO:0004948) |
| 0.2 | 0.7 | GO:0017159 | pantetheine hydrolase activity(GO:0017159) |
| 0.2 | 1.4 | GO:0008109 | N-acetyllactosaminide beta-1,6-N-acetylglucosaminyltransferase activity(GO:0008109) |
| 0.1 | 1.2 | GO:0030023 | extracellular matrix constituent conferring elasticity(GO:0030023) |
| 0.1 | 0.5 | GO:0031727 | CCR2 chemokine receptor binding(GO:0031727) |
| 0.1 | 0.6 | GO:0023024 | MHC class I protein complex binding(GO:0023024) |
| 0.1 | 1.0 | GO:0008048 | calcium sensitive guanylate cyclase activator activity(GO:0008048) |
| 0.1 | 0.4 | GO:0043682 | copper-exporting ATPase activity(GO:0004008) copper-transporting ATPase activity(GO:0043682) |
| 0.1 | 1.2 | GO:0015349 | thyroid hormone transmembrane transporter activity(GO:0015349) |
| 0.1 | 0.7 | GO:0004692 | cGMP-dependent protein kinase activity(GO:0004692) |
| 0.1 | 0.4 | GO:0050560 | aspartate-tRNA ligase activity(GO:0004815) aspartate-tRNA(Asn) ligase activity(GO:0050560) |
| 0.1 | 0.8 | GO:0045029 | UDP-activated nucleotide receptor activity(GO:0045029) |
| 0.1 | 0.3 | GO:0046577 | long-chain-alcohol oxidase activity(GO:0046577) |
| 0.1 | 2.9 | GO:0001011 | transcription factor activity, sequence-specific DNA binding, RNA polymerase recruiting(GO:0001011) transcription factor activity, TFIIB-class binding(GO:0001087) |
| 0.1 | 0.8 | GO:0008597 | calcium-dependent protein serine/threonine phosphatase regulator activity(GO:0008597) |
| 0.1 | 0.4 | GO:0016524 | latrotoxin receptor activity(GO:0016524) |
| 0.1 | 0.3 | GO:0047023 | androsterone dehydrogenase activity(GO:0047023) indanol dehydrogenase activity(GO:0047718) |
| 0.1 | 0.5 | GO:0030377 | urokinase plasminogen activator receptor activity(GO:0030377) |
| 0.1 | 2.8 | GO:0015002 | cytochrome-c oxidase activity(GO:0004129) heme-copper terminal oxidase activity(GO:0015002) oxidoreductase activity, acting on a heme group of donors, oxygen as acceptor(GO:0016676) |
| 0.1 | 0.8 | GO:0036402 | proteasome-activating ATPase activity(GO:0036402) |
| 0.1 | 0.3 | GO:0052810 | 1-phosphatidylinositol-5-kinase activity(GO:0052810) |
| 0.1 | 1.0 | GO:0032393 | MHC class I receptor activity(GO:0032393) |
| 0.1 | 1.7 | GO:0042813 | Wnt-activated receptor activity(GO:0042813) |
| 0.1 | 0.2 | GO:0005427 | proton-dependent oligopeptide secondary active transmembrane transporter activity(GO:0005427) secondary active oligopeptide transmembrane transporter activity(GO:0015322) |
| 0.1 | 1.7 | GO:0038187 | signaling pattern recognition receptor activity(GO:0008329) pattern recognition receptor activity(GO:0038187) |
| 0.1 | 2.7 | GO:0005540 | hyaluronic acid binding(GO:0005540) |
| 0.1 | 0.9 | GO:0015232 | heme transporter activity(GO:0015232) |
| 0.1 | 0.9 | GO:0032395 | MHC class II receptor activity(GO:0032395) |
| 0.1 | 1.7 | GO:0005523 | tropomyosin binding(GO:0005523) |
| 0.0 | 4.3 | GO:0051393 | alpha-actinin binding(GO:0051393) |
| 0.0 | 0.8 | GO:0071933 | Arp2/3 complex binding(GO:0071933) |
| 0.0 | 0.5 | GO:0060072 | large conductance calcium-activated potassium channel activity(GO:0060072) |
| 0.0 | 0.2 | GO:0004667 | prostaglandin-D synthase activity(GO:0004667) |
| 0.0 | 1.9 | GO:0008093 | cytoskeletal adaptor activity(GO:0008093) |
| 0.0 | 0.3 | GO:0016841 | ammonia-lyase activity(GO:0016841) |
| 0.0 | 3.1 | GO:0005246 | calcium channel regulator activity(GO:0005246) |
| 0.0 | 0.3 | GO:0030882 | lipid antigen binding(GO:0030882) endogenous lipid antigen binding(GO:0030883) exogenous lipid antigen binding(GO:0030884) |
| 0.0 | 0.2 | GO:0004910 | interleukin-1, Type II, blocking receptor activity(GO:0004910) |
| 0.0 | 0.2 | GO:0015189 | L-lysine transmembrane transporter activity(GO:0015189) |
| 0.0 | 1.3 | GO:0034237 | protein kinase A regulatory subunit binding(GO:0034237) |
| 0.0 | 0.4 | GO:0008160 | protein tyrosine phosphatase activator activity(GO:0008160) |
| 0.0 | 0.3 | GO:0004117 | calmodulin-dependent cyclic-nucleotide phosphodiesterase activity(GO:0004117) |
| 0.0 | 0.2 | GO:0034597 | phosphatidylinositol-3,4-bisphosphate 4-phosphatase activity(GO:0016316) inositol-1,3,4-trisphosphate 4-phosphatase activity(GO:0017161) phosphatidylinositol-4,5-bisphosphate 4-phosphatase activity(GO:0034597) inositol-3,4-bisphosphate 4-phosphatase activity(GO:0052828) |
| 0.0 | 0.6 | GO:0001206 | transcriptional repressor activity, RNA polymerase II distal enhancer sequence-specific binding(GO:0001206) |
| 0.0 | 0.6 | GO:0008392 | arachidonic acid monooxygenase activity(GO:0008391) arachidonic acid epoxygenase activity(GO:0008392) |
| 0.0 | 0.5 | GO:0015125 | bile acid transmembrane transporter activity(GO:0015125) |
| 0.0 | 0.1 | GO:0032089 | NACHT domain binding(GO:0032089) |
| 0.0 | 0.1 | GO:0008386 | cholesterol monooxygenase (side-chain-cleaving) activity(GO:0008386) |
| 0.0 | 0.4 | GO:0004865 | protein serine/threonine phosphatase inhibitor activity(GO:0004865) |
| 0.0 | 0.2 | GO:0032296 | ribonuclease III activity(GO:0004525) double-stranded RNA-specific ribonuclease activity(GO:0032296) |
| 0.0 | 4.7 | GO:0004222 | metalloendopeptidase activity(GO:0004222) |
| 0.0 | 1.3 | GO:0000146 | microfilament motor activity(GO:0000146) |
| 0.0 | 0.4 | GO:0030020 | extracellular matrix structural constituent conferring tensile strength(GO:0030020) |
| 0.0 | 0.5 | GO:0070492 | oligosaccharide binding(GO:0070492) |
| 0.0 | 0.8 | GO:0050998 | nitric-oxide synthase binding(GO:0050998) |
| 0.0 | 0.7 | GO:0045295 | gamma-catenin binding(GO:0045295) |
| 0.0 | 0.4 | GO:1901612 | cardiolipin binding(GO:1901612) |
| 0.0 | 2.4 | GO:0097110 | scaffold protein binding(GO:0097110) |
| 0.0 | 0.4 | GO:0048407 | platelet-derived growth factor binding(GO:0048407) |
| 0.0 | 0.8 | GO:0097200 | cysteine-type endopeptidase activity involved in execution phase of apoptosis(GO:0097200) |
| 0.0 | 0.3 | GO:0004118 | cGMP-stimulated cyclic-nucleotide phosphodiesterase activity(GO:0004118) |
| 0.0 | 1.4 | GO:0061631 | ubiquitin conjugating enzyme activity(GO:0061631) |
| 0.0 | 0.4 | GO:0008140 | cAMP response element binding protein binding(GO:0008140) |
| 0.0 | 0.1 | GO:0004531 | deoxyribonuclease II activity(GO:0004531) |
| 0.0 | 0.6 | GO:0016780 | phosphotransferase activity, for other substituted phosphate groups(GO:0016780) |
| 0.0 | 0.3 | GO:0015252 | hydrogen ion channel activity(GO:0015252) |
| 0.0 | 0.2 | GO:0001042 | RNA polymerase I core binding(GO:0001042) |
| 0.0 | 3.2 | GO:0005518 | collagen binding(GO:0005518) |
| 0.0 | 0.2 | GO:0019784 | NEDD8-specific protease activity(GO:0019784) |
| 0.0 | 0.2 | GO:0005094 | Rho GDP-dissociation inhibitor activity(GO:0005094) |
| 0.0 | 1.2 | GO:0030332 | cyclin binding(GO:0030332) |
| 0.0 | 0.5 | GO:0004062 | aryl sulfotransferase activity(GO:0004062) |
| 0.0 | 0.2 | GO:0097371 | MDM2/MDM4 family protein binding(GO:0097371) |
| 0.0 | 0.5 | GO:0001164 | RNA polymerase I regulatory region DNA binding(GO:0001013) RNA polymerase I regulatory region sequence-specific DNA binding(GO:0001163) RNA polymerase I CORE element sequence-specific DNA binding(GO:0001164) |
| 0.0 | 1.4 | GO:0004601 | peroxidase activity(GO:0004601) |
| 0.0 | 0.3 | GO:0043225 | anion transmembrane-transporting ATPase activity(GO:0043225) |
| 0.0 | 0.5 | GO:0070006 | metalloaminopeptidase activity(GO:0070006) |
| 0.0 | 0.4 | GO:0039706 | co-receptor binding(GO:0039706) |
| 0.0 | 0.5 | GO:0051537 | 2 iron, 2 sulfur cluster binding(GO:0051537) |
| 0.0 | 2.5 | GO:0004867 | serine-type endopeptidase inhibitor activity(GO:0004867) |
| 0.0 | 0.1 | GO:0004738 | pyruvate dehydrogenase activity(GO:0004738) pyruvate dehydrogenase [NAD(P)+] activity(GO:0034603) pyruvate dehydrogenase (NAD+) activity(GO:0034604) |
| 0.0 | 0.6 | GO:0015035 | protein disulfide oxidoreductase activity(GO:0015035) |
| 0.0 | 0.3 | GO:0005149 | interleukin-1 receptor binding(GO:0005149) |
| 0.0 | 0.2 | GO:0008381 | mechanically-gated ion channel activity(GO:0008381) mechanically gated channel activity(GO:0022833) |
| 0.0 | 0.4 | GO:0017025 | TBP-class protein binding(GO:0017025) |
| 0.0 | 0.1 | GO:0017040 | ceramidase activity(GO:0017040) |
| 0.0 | 0.2 | GO:0052650 | NADP-retinol dehydrogenase activity(GO:0052650) |
| 0.0 | 0.1 | GO:0030267 | hydroxypyruvate reductase activity(GO:0016618) glyoxylate reductase (NADP) activity(GO:0030267) |
| 0.0 | 0.1 | GO:0030345 | extracellular matrix structural constituent conferring compression resistance(GO:0030021) structural constituent of tooth enamel(GO:0030345) |
| 0.0 | 0.6 | GO:0016702 | oxidoreductase activity, acting on single donors with incorporation of molecular oxygen, incorporation of two atoms of oxygen(GO:0016702) |
| 0.0 | 0.2 | GO:0031386 | protein tag(GO:0031386) |
| 0.0 | 1.4 | GO:0005544 | calcium-dependent phospholipid binding(GO:0005544) |
| 0.0 | 0.2 | GO:0036310 | annealing helicase activity(GO:0036310) |
| 0.0 | 0.1 | GO:1990446 | U1 snRNP binding(GO:1990446) |
| 0.0 | 0.1 | GO:0004771 | sterol esterase activity(GO:0004771) |
| 0.0 | 1.1 | GO:0005507 | copper ion binding(GO:0005507) |
| 0.0 | 0.7 | GO:0005549 | odorant binding(GO:0005549) |
| 0.0 | 0.2 | GO:0030169 | low-density lipoprotein particle binding(GO:0030169) |
| 0.0 | 2.0 | GO:0005178 | integrin binding(GO:0005178) |
| 0.0 | 0.3 | GO:0070410 | co-SMAD binding(GO:0070410) |
| 0.0 | 0.5 | GO:0015020 | glucuronosyltransferase activity(GO:0015020) |
Gene overrepresentation in curated gene sets: canonical pathways category:
| Log-likelihood per target | Total log-likelihood | Term | Description |
|---|---|---|---|
| 0.1 | 3.8 | NABA PROTEOGLYCANS | Genes encoding proteoglycans |
| 0.0 | 3.5 | NABA COLLAGENS | Genes encoding collagen proteins |
| 0.0 | 2.3 | PID INTEGRIN2 PATHWAY | Beta2 integrin cell surface interactions |
| 0.0 | 2.4 | PID AMB2 NEUTROPHILS PATHWAY | amb2 Integrin signaling |
| 0.0 | 1.1 | PID IL5 PATHWAY | IL5-mediated signaling events |
| 0.0 | 0.3 | SA G2 AND M PHASES | Cdc25 activates the cdc2/cyclin B complex to induce the G2/M transition. |
| 0.0 | 1.3 | PID NFKAPPAB CANONICAL PATHWAY | Canonical NF-kappaB pathway |
| 0.0 | 2.2 | PID ANGIOPOIETIN RECEPTOR PATHWAY | Angiopoietin receptor Tie2-mediated signaling |
| 0.0 | 7.8 | NABA ECM REGULATORS | Genes encoding enzymes and their regulators involved in the remodeling of the extracellular matrix |
| 0.0 | 1.3 | PID TCR CALCIUM PATHWAY | Calcium signaling in the CD4+ TCR pathway |
| 0.0 | 0.7 | SA FAS SIGNALING | The TNF-type receptor Fas induces apoptosis on ligand binding. |
| 0.0 | 5.7 | NABA ECM AFFILIATED | Genes encoding proteins affiliated structurally or functionally to extracellular matrix proteins |
| 0.0 | 0.7 | PID P38 ALPHA BETA PATHWAY | Regulation of p38-alpha and p38-beta |
| 0.0 | 1.6 | PID HNF3A PATHWAY | FOXA1 transcription factor network |
| 0.0 | 2.0 | PID CASPASE PATHWAY | Caspase cascade in apoptosis |
| 0.0 | 2.8 | PID AR PATHWAY | Coregulation of Androgen receptor activity |
| 0.0 | 0.8 | PID WNT CANONICAL PATHWAY | Canonical Wnt signaling pathway |
| 0.0 | 0.7 | PID NCADHERIN PATHWAY | N-cadherin signaling events |
| 0.0 | 1.3 | PID VEGFR1 2 PATHWAY | Signaling events mediated by VEGFR1 and VEGFR2 |
| 0.0 | 0.6 | PID RHOA PATHWAY | RhoA signaling pathway |
| 0.0 | 0.1 | ST PAC1 RECEPTOR PATHWAY | PAC1 Receptor Pathway |
Gene overrepresentation in curated gene sets: REACTOME pathways category:
| Log-likelihood per target | Total log-likelihood | Term | Description |
|---|---|---|---|
| 0.2 | 3.3 | REACTOME ETHANOL OXIDATION | Genes involved in Ethanol oxidation |
| 0.2 | 3.2 | REACTOME COMMON PATHWAY | Genes involved in Common Pathway |
| 0.1 | 0.6 | REACTOME MRNA PROCESSING | Genes involved in mRNA Processing |
| 0.1 | 2.3 | REACTOME RECYCLING OF BILE ACIDS AND SALTS | Genes involved in Recycling of bile acids and salts |
| 0.1 | 13.1 | REACTOME ANTIGEN PROCESSING CROSS PRESENTATION | Genes involved in Antigen processing-Cross presentation |
| 0.1 | 4.4 | REACTOME DEGRADATION OF THE EXTRACELLULAR MATRIX | Genes involved in Degradation of the extracellular matrix |
| 0.1 | 3.0 | REACTOME BETA DEFENSINS | Genes involved in Beta defensins |
| 0.1 | 2.3 | REACTOME PLATELET CALCIUM HOMEOSTASIS | Genes involved in Platelet calcium homeostasis |
| 0.1 | 1.6 | REACTOME CS DS DEGRADATION | Genes involved in CS/DS degradation |
| 0.0 | 1.1 | REACTOME INTRINSIC PATHWAY | Genes involved in Intrinsic Pathway |
| 0.0 | 0.8 | REACTOME BILE SALT AND ORGANIC ANION SLC TRANSPORTERS | Genes involved in Bile salt and organic anion SLC transporters |
| 0.0 | 0.8 | REACTOME P2Y RECEPTORS | Genes involved in P2Y receptors |
| 0.0 | 0.6 | REACTOME XENOBIOTICS | Genes involved in Xenobiotics |
| 0.0 | 1.3 | REACTOME OXYGEN DEPENDENT PROLINE HYDROXYLATION OF HYPOXIA INDUCIBLE FACTOR ALPHA | Genes involved in Oxygen-dependent Proline Hydroxylation of Hypoxia-inducible Factor Alpha |
| 0.0 | 0.6 | REACTOME SLBP DEPENDENT PROCESSING OF REPLICATION DEPENDENT HISTONE PRE MRNAS | Genes involved in SLBP Dependent Processing of Replication-Dependent Histone Pre-mRNAs |
| 0.0 | 0.7 | REACTOME REGULATION OF COMPLEMENT CASCADE | Genes involved in Regulation of Complement cascade |
| 0.0 | 0.1 | REACTOME VIF MEDIATED DEGRADATION OF APOBEC3G | Genes involved in Vif-mediated degradation of APOBEC3G |
| 0.0 | 0.6 | REACTOME ACYL CHAIN REMODELLING OF PG | Genes involved in Acyl chain remodelling of PG |
| 0.0 | 1.8 | REACTOME PHASE1 FUNCTIONALIZATION OF COMPOUNDS | Genes involved in Phase 1 - Functionalization of compounds |
| 0.0 | 0.3 | REACTOME GLYCOPROTEIN HORMONES | Genes involved in Glycoprotein hormones |
| 0.0 | 1.3 | REACTOME CGMP EFFECTS | Genes involved in cGMP effects |
| 0.0 | 0.3 | REACTOME RAF MAP KINASE CASCADE | Genes involved in RAF/MAP kinase cascade |
| 0.0 | 0.2 | REACTOME REGULATION OF ORNITHINE DECARBOXYLASE ODC | Genes involved in Regulation of ornithine decarboxylase (ODC) |
| 0.0 | 2.2 | REACTOME MYOGENESIS | Genes involved in Myogenesis |
| 0.0 | 0.7 | REACTOME EXTRINSIC PATHWAY FOR APOPTOSIS | Genes involved in Extrinsic Pathway for Apoptosis |
| 0.0 | 0.6 | REACTOME CTNNB1 PHOSPHORYLATION CASCADE | Genes involved in Beta-catenin phosphorylation cascade |
| 0.0 | 0.4 | REACTOME REGULATION OF INSULIN LIKE GROWTH FACTOR IGF ACTIVITY BY INSULIN LIKE GROWTH FACTOR BINDING PROTEINS IGFBPS | Genes involved in Regulation of Insulin-like Growth Factor (IGF) Activity by Insulin-like Growth Factor Binding Proteins (IGFBPs) |
| 0.0 | 0.5 | REACTOME CYTOSOLIC SULFONATION OF SMALL MOLECULES | Genes involved in Cytosolic sulfonation of small molecules |
| 0.0 | 0.7 | REACTOME DCC MEDIATED ATTRACTIVE SIGNALING | Genes involved in DCC mediated attractive signaling |
| 0.0 | 1.1 | REACTOME IL RECEPTOR SHC SIGNALING | Genes involved in Interleukin receptor SHC signaling |
| 0.0 | 0.7 | REACTOME ACTIVATED AMPK STIMULATES FATTY ACID OXIDATION IN MUSCLE | Genes involved in Activated AMPK stimulates fatty-acid oxidation in muscle |
| 0.0 | 1.6 | REACTOME COLLAGEN FORMATION | Genes involved in Collagen formation |
| 0.0 | 1.7 | REACTOME INTERFERON GAMMA SIGNALING | Genes involved in Interferon gamma signaling |
| 0.0 | 0.3 | REACTOME MITOCHONDRIAL TRNA AMINOACYLATION | Genes involved in Mitochondrial tRNA aminoacylation |
| 0.0 | 0.2 | REACTOME ROLE OF DCC IN REGULATING APOPTOSIS | Genes involved in Role of DCC in regulating apoptosis |
| 0.0 | 0.6 | REACTOME SYNTHESIS OF PIPS AT THE PLASMA MEMBRANE | Genes involved in Synthesis of PIPs at the plasma membrane |
| 0.0 | 0.5 | REACTOME CELL EXTRACELLULAR MATRIX INTERACTIONS | Genes involved in Cell-extracellular matrix interactions |
| 0.0 | 0.4 | REACTOME ACTIVATED NOTCH1 TRANSMITS SIGNAL TO THE NUCLEUS | Genes involved in Activated NOTCH1 Transmits Signal to the Nucleus |
| 0.0 | 0.2 | REACTOME ADVANCED GLYCOSYLATION ENDPRODUCT RECEPTOR SIGNALING | Genes involved in Advanced glycosylation endproduct receptor signaling |
| 0.0 | 3.0 | REACTOME OLFACTORY SIGNALING PATHWAY | Genes involved in Olfactory Signaling Pathway |