Project
Illumina Body Map 2 (GSE30611)
Navigation
Downloads
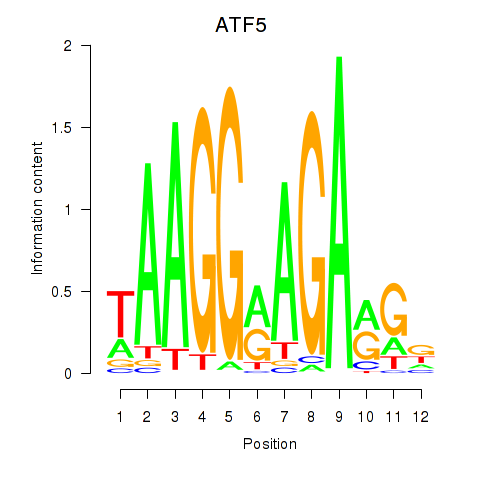
Results for ATF5
Z-value: 1.16
Motif logo
Transcription factors associated with ATF5
| Gene Symbol | Gene ID | Gene Info |
|---|---|---|
|
ATF5
|
ENSG00000169136.12 | activating transcription factor 5 |
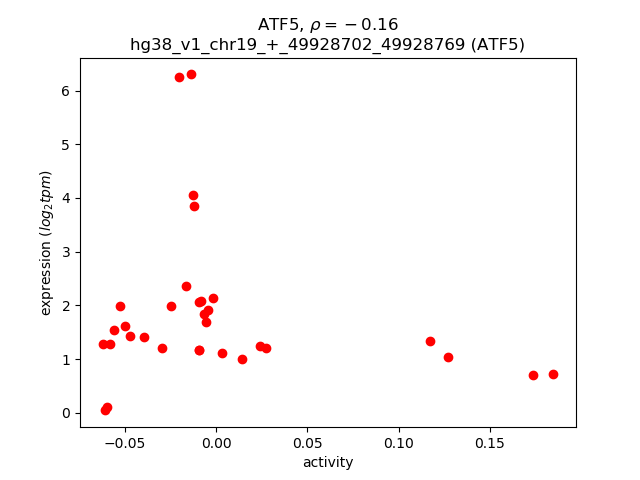
Activity-expression correlation:
| Gene | Promoter | Pearson corr. coef. | P-value | Plot |
|---|---|---|---|---|
| ATF5 | hg38_v1_chr19_+_49928702_49928769 | -0.16 | 3.7e-01 | Click! |
Activity profile of ATF5 motif
Sorted Z-values of ATF5 motif
| Promoter | Log-likelihood | Transcript | Gene | Gene Info |
|---|---|---|---|---|
| chr20_-_53995929 | 8.20 |
ENST00000422805.1
|
BCAS1
|
brain enriched myelin associated protein 1 |
| chr14_+_23377001 | 4.91 |
ENST00000342473.8
ENST00000397227.7 ENST00000339180.9 ENST00000555731.5 |
CMTM5
|
CKLF like MARVEL transmembrane domain containing 5 |
| chr14_+_23376765 | 3.84 |
ENST00000649278.1
|
CMTM5
|
CKLF like MARVEL transmembrane domain containing 5 |
| chr14_+_23376786 | 3.60 |
ENST00000359320.7
|
CMTM5
|
CKLF like MARVEL transmembrane domain containing 5 |
| chr5_-_39219555 | 3.56 |
ENST00000512982.4
ENST00000351578.12 ENST00000509072.5 ENST00000504542.1 ENST00000506557.5 |
FYB1
|
FYN binding protein 1 |
| chr22_-_36819479 | 3.38 |
ENST00000216200.9
|
PVALB
|
parvalbumin |
| chrX_-_13817346 | 3.36 |
ENST00000356942.9
|
GPM6B
|
glycoprotein M6B |
| chr8_-_130016622 | 3.31 |
ENST00000518283.5
ENST00000519110.5 |
CYRIB
|
CYFIP related Rac1 interactor B |
| chr4_-_175812236 | 3.30 |
ENST00000505375.5
|
GPM6A
|
glycoprotein M6A |
| chr8_-_130016414 | 3.28 |
ENST00000401979.6
ENST00000517654.5 ENST00000522361.1 ENST00000518167.5 |
CYRIB
|
CYFIP related Rac1 interactor B |
| chr10_-_102419693 | 3.07 |
ENST00000611678.4
|
PSD
|
pleckstrin and Sec7 domain containing |
| chr8_-_130016395 | 2.99 |
ENST00000523509.5
|
CYRIB
|
CYFIP related Rac1 interactor B |
| chr14_+_23377136 | 2.98 |
ENST00000382809.2
|
CMTM5
|
CKLF like MARVEL transmembrane domain containing 5 |
| chr2_-_86790900 | 2.97 |
ENST00000283635.8
|
CD8A
|
CD8a molecule |
| chr1_+_177170916 | 2.93 |
ENST00000361539.5
|
BRINP2
|
BMP/retinoic acid inducible neural specific 2 |
| chr10_-_102419934 | 2.93 |
ENST00000406432.5
|
PSD
|
pleckstrin and Sec7 domain containing |
| chrX_-_13817027 | 2.76 |
ENST00000493677.5
ENST00000355135.6 ENST00000316715.9 |
GPM6B
|
glycoprotein M6B |
| chr14_+_92323154 | 2.65 |
ENST00000532405.6
ENST00000676001.1 ENST00000531433.5 |
SLC24A4
|
solute carrier family 24 member 4 |
| chrX_-_13817279 | 2.63 |
ENST00000475307.1
|
GPM6B
|
glycoprotein M6B |
| chr12_+_9971402 | 2.62 |
ENST00000304361.9
ENST00000396507.7 ENST00000434319.6 |
CLEC12A
|
C-type lectin domain family 12 member A |
| chr6_-_31546552 | 2.62 |
ENST00000303892.10
ENST00000376151.4 |
ATP6V1G2
|
ATPase H+ transporting V1 subunit G2 |
| chr18_-_3845321 | 2.58 |
ENST00000539435.5
ENST00000400147.6 |
DLGAP1
|
DLG associated protein 1 |
| chr6_+_71886900 | 2.56 |
ENST00000517960.5
ENST00000518273.5 ENST00000522291.5 ENST00000521978.5 ENST00000520567.5 ENST00000264839.11 |
RIMS1
|
regulating synaptic membrane exocytosis 1 |
| chr2_+_190469486 | 2.54 |
ENST00000444317.1
|
MFSD6
|
major facilitator superfamily domain containing 6 |
| chr4_+_158521714 | 2.35 |
ENST00000613319.4
ENST00000423548.5 ENST00000448688.6 |
RXFP1
|
relaxin family peptide receptor 1 |
| chr12_+_9971512 | 2.35 |
ENST00000350667.4
|
CLEC12A
|
C-type lectin domain family 12 member A |
| chr11_-_125481585 | 2.30 |
ENST00000577924.1
|
FEZ1
|
fasciculation and elongation protein zeta 1 |
| chr5_-_149063089 | 2.28 |
ENST00000512049.5
|
SH3TC2
|
SH3 domain and tetratricopeptide repeats 2 |
| chrX_+_123184260 | 2.27 |
ENST00000620443.2
ENST00000622768.5 ENST00000611689.4 |
GRIA3
|
glutamate ionotropic receptor AMPA type subunit 3 |
| chr5_-_149063021 | 2.27 |
ENST00000515425.6
|
SH3TC2
|
SH3 domain and tetratricopeptide repeats 2 |
| chr1_+_202122910 | 2.26 |
ENST00000682545.1
ENST00000367282.6 ENST00000682887.1 |
GPR37L1
|
G protein-coupled receptor 37 like 1 |
| chr2_-_25982681 | 2.20 |
ENST00000405914.1
|
KIF3C
|
kinesin family member 3C |
| chr1_+_202122881 | 2.20 |
ENST00000683302.1
ENST00000683557.1 |
GPR37L1
|
G protein-coupled receptor 37 like 1 |
| chr17_+_46713149 | 2.20 |
ENST00000576346.5
|
NSF
|
N-ethylmaleimide sensitive factor, vesicle fusing ATPase |
| chr5_+_111223905 | 2.16 |
ENST00000512453.5
|
CAMK4
|
calcium/calmodulin dependent protein kinase IV |
| chr2_-_25982471 | 2.14 |
ENST00000264712.8
|
KIF3C
|
kinesin family member 3C |
| chr7_-_3043838 | 2.13 |
ENST00000356408.3
ENST00000396946.9 |
CARD11
|
caspase recruitment domain family member 11 |
| chr10_+_110005804 | 2.12 |
ENST00000360162.7
|
ADD3
|
adducin 3 |
| chr8_-_130016536 | 2.11 |
ENST00000519020.5
|
CYRIB
|
CYFIP related Rac1 interactor B |
| chr8_+_20197369 | 2.05 |
ENST00000276390.7
ENST00000519667.1 |
ATP6V1B2
|
ATPase H+ transporting V1 subunit B2 |
| chr4_-_82798735 | 2.00 |
ENST00000273908.4
ENST00000319540.9 |
SCD5
|
stearoyl-CoA desaturase 5 |
| chr14_+_79280263 | 1.88 |
ENST00000555387.1
|
NRXN3
|
neurexin 3 |
| chr17_-_7205116 | 1.81 |
ENST00000649520.1
ENST00000649186.1 |
DLG4
|
discs large MAGUK scaffold protein 4 |
| chr2_+_172860038 | 1.81 |
ENST00000538974.5
ENST00000540783.5 |
RAPGEF4
|
Rap guanine nucleotide exchange factor 4 |
| chr1_+_35557435 | 1.81 |
ENST00000373253.7
|
NCDN
|
neurochondrin |
| chr11_-_84720876 | 1.76 |
ENST00000648622.1
|
DLG2
|
discs large MAGUK scaffold protein 2 |
| chr14_+_41606865 | 1.74 |
ENST00000298119.9
|
LRFN5
|
leucine rich repeat and fibronectin type III domain containing 5 |
| chr18_-_3845292 | 1.73 |
ENST00000400145.6
|
DLGAP1
|
DLG associated protein 1 |
| chr1_+_35557768 | 1.72 |
ENST00000356090.8
ENST00000373243.7 |
NCDN
|
neurochondrin |
| chr14_+_79279906 | 1.71 |
ENST00000428277.6
|
NRXN3
|
neurexin 3 |
| chr15_+_80441229 | 1.70 |
ENST00000533983.5
ENST00000527771.5 ENST00000525103.1 |
ARNT2
|
aryl hydrocarbon receptor nuclear translocator 2 |
| chr3_-_183427977 | 1.70 |
ENST00000473233.5
|
MCF2L2
|
MCF.2 cell line derived transforming sequence-like 2 |
| chr5_+_83471764 | 1.69 |
ENST00000512590.6
ENST00000513960.5 ENST00000513984.5 |
VCAN
|
versican |
| chr1_-_183418364 | 1.65 |
ENST00000287713.7
|
NMNAT2
|
nicotinamide nucleotide adenylyltransferase 2 |
| chr11_+_63681483 | 1.59 |
ENST00000339997.8
ENST00000540798.5 ENST00000545432.5 ENST00000543552.5 ENST00000377819.10 ENST00000537981.5 |
RTN3
|
reticulon 3 |
| chr11_+_63681444 | 1.56 |
ENST00000341307.6
ENST00000356000.7 ENST00000542238.5 |
RTN3
|
reticulon 3 |
| chr11_+_92224801 | 1.54 |
ENST00000525166.6
|
FAT3
|
FAT atypical cadherin 3 |
| chr16_-_30029429 | 1.54 |
ENST00000564806.1
|
TLCD3B
|
TLC domain containing 3B |
| chr11_+_63681573 | 1.54 |
ENST00000354497.4
|
RTN3
|
reticulon 3 |
| chr18_-_34224871 | 1.50 |
ENST00000261592.10
|
NOL4
|
nucleolar protein 4 |
| chr12_-_54384460 | 1.48 |
ENST00000549937.5
|
ZNF385A
|
zinc finger protein 385A |
| chr4_+_133149278 | 1.48 |
ENST00000264360.7
|
PCDH10
|
protocadherin 10 |
| chr14_-_39432414 | 1.48 |
ENST00000554932.1
ENST00000298097.7 |
FBXO33
|
F-box protein 33 |
| chr12_-_54384687 | 1.45 |
ENST00000550120.1
ENST00000547210.5 ENST00000394313.7 |
ZNF385A
|
zinc finger protein 385A |
| chr11_-_129192291 | 1.44 |
ENST00000682385.1
|
ARHGAP32
|
Rho GTPase activating protein 32 |
| chr4_+_133149307 | 1.44 |
ENST00000618019.1
|
PCDH10
|
protocadherin 10 |
| chr4_+_158521872 | 1.44 |
ENST00000307765.10
|
RXFP1
|
relaxin family peptide receptor 1 |
| chr20_+_59604527 | 1.43 |
ENST00000371015.6
|
PHACTR3
|
phosphatase and actin regulator 3 |
| chr5_+_83471668 | 1.43 |
ENST00000342785.8
ENST00000343200.9 |
VCAN
|
versican |
| chr12_-_54384659 | 1.42 |
ENST00000551771.5
|
ZNF385A
|
zinc finger protein 385A |
| chr5_+_83471925 | 1.42 |
ENST00000502527.2
|
VCAN
|
versican |
| chr5_-_20575850 | 1.42 |
ENST00000507958.5
|
CDH18
|
cadherin 18 |
| chr11_-_129192198 | 1.40 |
ENST00000310343.13
|
ARHGAP32
|
Rho GTPase activating protein 32 |
| chr2_-_144521042 | 1.40 |
ENST00000637267.2
|
ZEB2
|
zinc finger E-box binding homeobox 2 |
| chr1_+_66534107 | 1.39 |
ENST00000371037.9
ENST00000684651.1 |
SGIP1
|
SH3GL interacting endocytic adaptor 1 |
| chr5_+_83471736 | 1.36 |
ENST00000265077.8
|
VCAN
|
versican |
| chrX_+_12137409 | 1.35 |
ENST00000672010.1
|
FRMPD4
|
FERM and PDZ domain containing 4 |
| chr12_-_16608073 | 1.35 |
ENST00000441439.6
|
LMO3
|
LIM domain only 3 |
| chr4_+_158521937 | 1.34 |
ENST00000343542.9
ENST00000470033.2 |
RXFP1
|
relaxin family peptide receptor 1 |
| chr16_-_30012294 | 1.33 |
ENST00000564979.5
ENST00000563378.5 |
DOC2A
|
double C2 domain alpha |
| chr19_-_38426195 | 1.33 |
ENST00000615439.5
ENST00000614135.4 ENST00000622174.4 ENST00000587753.5 ENST00000454404.6 ENST00000617966.4 ENST00000618320.4 ENST00000293062.13 ENST00000433821.6 ENST00000426920.6 |
RASGRP4
|
RAS guanyl releasing protein 4 |
| chr14_-_23578756 | 1.33 |
ENST00000397118.7
ENST00000356300.9 |
JPH4
|
junctophilin 4 |
| chr6_-_62286161 | 1.31 |
ENST00000281156.5
|
KHDRBS2
|
KH RNA binding domain containing, signal transduction associated 2 |
| chr8_+_35235467 | 1.30 |
ENST00000404895.7
|
UNC5D
|
unc-5 netrin receptor D |
| chr9_-_23826231 | 1.29 |
ENST00000397312.7
|
ELAVL2
|
ELAV like RNA binding protein 2 |
| chr1_+_66534014 | 1.29 |
ENST00000684664.1
ENST00000682416.1 ENST00000683499.1 |
SGIP1
|
SH3GL interacting endocytic adaptor 1 |
| chr1_+_66534082 | 1.27 |
ENST00000683257.1
ENST00000684083.1 ENST00000682938.1 ENST00000683581.1 ENST00000682293.1 |
SGIP1
|
SH3GL interacting endocytic adaptor 1 |
| chr9_+_79573162 | 1.27 |
ENST00000425506.5
|
TLE4
|
TLE family member 4, transcriptional corepressor |
| chr9_+_101185029 | 1.27 |
ENST00000395056.2
|
PLPPR1
|
phospholipid phosphatase related 1 |
| chr19_-_14979676 | 1.25 |
ENST00000598504.5
ENST00000597262.1 |
SLC1A6
|
solute carrier family 1 member 6 |
| chr17_+_49210699 | 1.19 |
ENST00000225941.6
|
ABI3
|
ABI family member 3 |
| chr14_+_79280056 | 1.18 |
ENST00000676811.1
|
NRXN3
|
neurexin 3 |
| chr2_-_213151590 | 1.16 |
ENST00000374319.8
ENST00000457361.5 ENST00000451136.6 ENST00000434687.6 |
IKZF2
|
IKAROS family zinc finger 2 |
| chr16_+_31259922 | 1.15 |
ENST00000648685.1
ENST00000544665.9 |
ITGAM
|
integrin subunit alpha M |
| chr22_+_37282464 | 1.13 |
ENST00000402997.5
ENST00000405206.3 ENST00000248901.11 |
CYTH4
|
cytohesin 4 |
| chr16_+_28931942 | 1.13 |
ENST00000324662.8
ENST00000538922.8 |
CD19
|
CD19 molecule |
| chr3_-_183428085 | 1.12 |
ENST00000447025.6
ENST00000414362.6 |
MCF2L2
|
MCF.2 cell line derived transforming sequence-like 2 |
| chr22_-_30266839 | 1.08 |
ENST00000403463.1
ENST00000215781.3 |
OSM
|
oncostatin M |
| chr11_-_40294089 | 1.07 |
ENST00000278198.2
|
LRRC4C
|
leucine rich repeat containing 4C |
| chr1_+_206406377 | 1.03 |
ENST00000605476.5
|
SRGAP2
|
SLIT-ROBO Rho GTPase activating protein 2 |
| chr19_-_14979848 | 1.00 |
ENST00000594383.2
|
SLC1A6
|
solute carrier family 1 member 6 |
| chrX_+_56563569 | 0.98 |
ENST00000338222.7
|
UBQLN2
|
ubiquilin 2 |
| chr2_-_100142575 | 0.96 |
ENST00000317233.8
ENST00000672204.1 ENST00000416492.5 ENST00000672857.1 ENST00000672756.2 |
AFF3
|
AF4/FMR2 family member 3 |
| chr14_+_79279403 | 0.95 |
ENST00000281127.11
|
NRXN3
|
neurexin 3 |
| chrX_+_132023580 | 0.93 |
ENST00000496850.1
|
STK26
|
serine/threonine kinase 26 |
| chrX_-_44542833 | 0.90 |
ENST00000378045.5
|
FUNDC1
|
FUN14 domain containing 1 |
| chr15_+_74826603 | 0.89 |
ENST00000395018.6
|
CPLX3
|
complexin 3 |
| chr1_-_54406385 | 0.89 |
ENST00000610401.5
|
SSBP3
|
single stranded DNA binding protein 3 |
| chr10_-_7411451 | 0.86 |
ENST00000683762.1
ENST00000379713.8 ENST00000682180.1 |
SFMBT2
|
Scm like with four mbt domains 2 |
| chr7_-_78771058 | 0.86 |
ENST00000628781.1
|
MAGI2
|
membrane associated guanylate kinase, WW and PDZ domain containing 2 |
| chr8_+_106726012 | 0.84 |
ENST00000449762.6
ENST00000297447.10 |
OXR1
|
oxidation resistance 1 |
| chr8_-_21788159 | 0.84 |
ENST00000517892.5
ENST00000518077.5 |
GFRA2
|
GDNF family receptor alpha 2 |
| chr10_-_7410973 | 0.84 |
ENST00000684547.1
ENST00000673876.1 ENST00000397167.6 |
SFMBT2
|
Scm like with four mbt domains 2 |
| chr12_-_16608183 | 0.83 |
ENST00000354662.5
ENST00000538051.5 |
LMO3
|
LIM domain only 3 |
| chr14_+_79279681 | 0.83 |
ENST00000679122.1
|
NRXN3
|
neurexin 3 |
| chr6_+_101181254 | 0.82 |
ENST00000682090.1
ENST00000421544.6 |
GRIK2
|
glutamate ionotropic receptor kainate type subunit 2 |
| chr17_+_18858068 | 0.82 |
ENST00000536323.5
ENST00000419284.6 ENST00000412418.5 ENST00000575228.5 ENST00000268835.7 ENST00000575102.5 |
PRPSAP2
|
phosphoribosyl pyrophosphate synthetase associated protein 2 |
| chr1_+_121184964 | 0.81 |
ENST00000367123.8
|
SRGAP2C
|
SLIT-ROBO Rho GTPase activating protein 2C |
| chr17_+_49210387 | 0.80 |
ENST00000419580.6
|
ABI3
|
ABI family member 3 |
| chr7_+_142580911 | 0.80 |
ENST00000621184.1
|
TRBV12-5
|
T cell receptor beta variable 12-5 |
| chr9_+_124261427 | 0.80 |
ENST00000373596.5
ENST00000425237.5 |
NEK6
|
NIMA related kinase 6 |
| chr7_-_116030750 | 0.79 |
ENST00000265440.12
ENST00000320239.11 |
TFEC
|
transcription factor EC |
| chr14_+_32078228 | 0.78 |
ENST00000556191.5
ENST00000554090.1 |
ARHGAP5
|
Rho GTPase activating protein 5 |
| chr17_+_35587239 | 0.77 |
ENST00000621914.4
ENST00000621668.4 ENST00000616681.4 ENST00000612035.4 ENST00000610402.5 ENST00000614600.4 ENST00000590432.5 ENST00000612116.5 |
AP2B1
|
adaptor related protein complex 2 subunit beta 1 |
| chr1_+_66533948 | 0.76 |
ENST00000684178.1
|
SGIP1
|
SH3GL interacting endocytic adaptor 1 |
| chr7_-_78771108 | 0.76 |
ENST00000626691.2
|
MAGI2
|
membrane associated guanylate kinase, WW and PDZ domain containing 2 |
| chr11_+_123525822 | 0.75 |
ENST00000322282.11
ENST00000529750.5 |
GRAMD1B
|
GRAM domain containing 1B |
| chr7_-_78770859 | 0.75 |
ENST00000636717.1
|
MAGI2
|
membrane associated guanylate kinase, WW and PDZ domain containing 2 |
| chr8_+_106726115 | 0.75 |
ENST00000521592.5
|
OXR1
|
oxidation resistance 1 |
| chr20_+_59163810 | 0.72 |
ENST00000371030.4
|
ZNF831
|
zinc finger protein 831 |
| chr11_+_67375985 | 0.71 |
ENST00000621995.1
|
RAD9A
|
RAD9 checkpoint clamp component A |
| chr8_-_21788853 | 0.70 |
ENST00000524240.6
|
GFRA2
|
GDNF family receptor alpha 2 |
| chr11_+_27055215 | 0.70 |
ENST00000525090.1
|
BBOX1
|
gamma-butyrobetaine hydroxylase 1 |
| chr6_+_113857333 | 0.69 |
ENST00000612661.2
|
MARCKS
|
myristoylated alanine rich protein kinase C substrate |
| chr17_-_49210567 | 0.69 |
ENST00000507680.6
|
GNGT2
|
G protein subunit gamma transducin 2 |
| chr10_+_102419189 | 0.69 |
ENST00000432590.5
|
FBXL15
|
F-box and leucine rich repeat protein 15 |
| chr7_-_78771265 | 0.68 |
ENST00000630991.2
ENST00000629359.2 |
MAGI2
|
membrane associated guanylate kinase, WW and PDZ domain containing 2 |
| chr5_+_139293660 | 0.67 |
ENST00000512876.5
ENST00000513678.5 |
MATR3
|
matrin 3 |
| chrX_-_47629845 | 0.67 |
ENST00000469388.1
ENST00000396992.8 ENST00000377005.6 |
CFP
|
complement factor properdin |
| chr2_+_72916183 | 0.66 |
ENST00000394111.6
|
EMX1
|
empty spiracles homeobox 1 |
| chr16_+_50279515 | 0.65 |
ENST00000569265.1
|
ADCY7
|
adenylate cyclase 7 |
| chr15_-_75579248 | 0.64 |
ENST00000306726.6
ENST00000618819.5 |
PTPN9
|
protein tyrosine phosphatase non-receptor type 9 |
| chrX_+_132023294 | 0.62 |
ENST00000481105.5
ENST00000354719.10 ENST00000394334.7 ENST00000394335.6 |
STK26
|
serine/threonine kinase 26 |
| chrX_+_123962010 | 0.61 |
ENST00000428941.5
|
STAG2
|
stromal antigen 2 |
| chr1_+_66534171 | 0.60 |
ENST00000682762.1
ENST00000424320.6 |
SGIP1
|
SH3GL interacting endocytic adaptor 1 |
| chr1_+_206203541 | 0.60 |
ENST00000573034.8
|
SRGAP2
|
SLIT-ROBO Rho GTPase activating protein 2 |
| chr16_-_72094371 | 0.60 |
ENST00000426362.6
|
TXNL4B
|
thioredoxin like 4B |
| chr11_+_63888515 | 0.59 |
ENST00000509502.6
ENST00000512060.1 |
MARK2
|
microtubule affinity regulating kinase 2 |
| chr15_+_63189554 | 0.58 |
ENST00000559006.1
ENST00000321437.9 |
RAB8B
|
RAB8B, member RAS oncogene family |
| chr5_+_111223614 | 0.57 |
ENST00000508074.5
|
CAMK4
|
calcium/calmodulin dependent protein kinase IV |
| chrX_+_123184153 | 0.57 |
ENST00000616590.4
|
GRIA3
|
glutamate ionotropic receptor AMPA type subunit 3 |
| chr1_-_151346846 | 0.56 |
ENST00000436271.5
ENST00000450506.5 ENST00000422595.5 |
RFX5
|
regulatory factor X5 |
| chr8_-_109680812 | 0.56 |
ENST00000528716.5
ENST00000527600.5 ENST00000531230.5 ENST00000532189.5 ENST00000534184.5 ENST00000408889.7 ENST00000533171.5 |
SYBU
|
syntabulin |
| chr5_+_139293939 | 0.55 |
ENST00000508689.1
ENST00000514528.5 |
MATR3
|
matrin 3 |
| chr5_+_139293700 | 0.55 |
ENST00000504045.5
ENST00000504311.5 ENST00000502499.5 |
MATR3
|
matrin 3 |
| chrX_+_147943245 | 0.54 |
ENST00000463120.2
|
FMR1
|
FMRP translational regulator 1 |
| chr19_+_32405758 | 0.54 |
ENST00000392250.7
|
DPY19L3
|
dpy-19 like C-mannosyltransferase 3 |
| chrX_+_123961304 | 0.53 |
ENST00000371160.5
ENST00000435103.5 |
STAG2
|
stromal antigen 2 |
| chr8_+_38820332 | 0.53 |
ENST00000518809.5
ENST00000520611.1 |
TACC1
|
transforming acidic coiled-coil containing protein 1 |
| chr7_-_102592444 | 0.53 |
ENST00000514917.3
|
ENSG00000270249.2
|
novel protein |
| chr20_+_56412249 | 0.51 |
ENST00000679887.1
ENST00000434344.2 |
CASS4
|
Cas scaffold protein family member 4 |
| chr12_-_12338674 | 0.51 |
ENST00000545735.1
|
MANSC1
|
MANSC domain containing 1 |
| chr6_-_87702221 | 0.50 |
ENST00000257787.6
|
AKIRIN2
|
akirin 2 |
| chr1_-_156490599 | 0.49 |
ENST00000360595.7
|
MEF2D
|
myocyte enhancer factor 2D |
| chr22_+_19131271 | 0.48 |
ENST00000399635.4
|
TSSK2
|
testis specific serine kinase 2 |
| chr16_-_72093598 | 0.47 |
ENST00000268483.8
|
TXNL4B
|
thioredoxin like 4B |
| chr17_+_34579576 | 0.46 |
ENST00000631683.2
|
TMEM132E
|
transmembrane protein 132E |
| chr5_+_139293728 | 0.46 |
ENST00000510056.5
ENST00000511249.5 ENST00000394805.8 ENST00000503811.5 ENST00000618441.5 |
MATR3
|
matrin 3 |
| chr19_-_38426162 | 0.46 |
ENST00000587738.2
ENST00000586305.5 |
RASGRP4
|
RAS guanyl releasing protein 4 |
| chr19_-_43781249 | 0.44 |
ENST00000615047.4
|
KCNN4
|
potassium calcium-activated channel subfamily N member 4 |
| chr1_-_145095528 | 0.44 |
ENST00000612199.4
ENST00000641863.1 |
SRGAP2B
|
SLIT-ROBO Rho GTPase activating protein 2B |
| chr1_+_215005847 | 0.43 |
ENST00000391895.6
|
KCNK2
|
potassium two pore domain channel subfamily K member 2 |
| chr17_+_35587478 | 0.42 |
ENST00000618940.4
|
AP2B1
|
adaptor related protein complex 2 subunit beta 1 |
| chr19_-_43780957 | 0.41 |
ENST00000648319.1
|
KCNN4
|
potassium calcium-activated channel subfamily N member 4 |
| chr2_-_40512361 | 0.41 |
ENST00000403092.5
|
SLC8A1
|
solute carrier family 8 member A1 |
| chr6_-_31897675 | 0.41 |
ENST00000375530.8
ENST00000375537.8 |
EHMT2
|
euchromatic histone lysine methyltransferase 2 |
| chr8_+_78516329 | 0.40 |
ENST00000396418.7
ENST00000352966.9 |
PKIA
|
cAMP-dependent protein kinase inhibitor alpha |
| chr17_-_75153826 | 0.40 |
ENST00000481647.5
ENST00000470924.5 |
JPT1
|
Jupiter microtubule associated homolog 1 |
| chr14_-_65102383 | 0.39 |
ENST00000341653.6
|
MAX
|
MYC associated factor X |
| chrX_+_123961696 | 0.38 |
ENST00000371145.8
ENST00000371157.7 ENST00000371144.7 |
STAG2
|
stromal antigen 2 |
| chr7_-_100464248 | 0.38 |
ENST00000332375.4
|
C7orf61
|
chromosome 7 open reading frame 61 |
| chr11_+_62728642 | 0.38 |
ENST00000532583.1
|
TTC9C
|
tetratricopeptide repeat domain 9C |
| chr7_+_133253064 | 0.38 |
ENST00000393161.6
ENST00000253861.5 |
EXOC4
|
exocyst complex component 4 |
| chr5_-_135452318 | 0.37 |
ENST00000537858.2
|
TIFAB
|
TIFA inhibitor |
| chr2_-_55050518 | 0.37 |
ENST00000317610.11
ENST00000357732.8 |
RTN4
|
reticulon 4 |
| chrX_-_136780925 | 0.37 |
ENST00000250617.7
|
ARHGEF6
|
Rac/Cdc42 guanine nucleotide exchange factor 6 |
| chr1_-_153946652 | 0.36 |
ENST00000361217.9
|
DENND4B
|
DENN domain containing 4B |
| chr3_+_19947316 | 0.36 |
ENST00000422242.1
|
RAB5A
|
RAB5A, member RAS oncogene family |
| chr19_-_54360949 | 0.36 |
ENST00000622064.1
|
LAIR1
|
leukocyte associated immunoglobulin like receptor 1 |
| chr16_-_72093557 | 0.36 |
ENST00000562153.5
|
TXNL4B
|
thioredoxin like 4B |
| chr8_+_99013247 | 0.35 |
ENST00000441350.2
ENST00000357162.7 ENST00000358544.7 |
VPS13B
|
vacuolar protein sorting 13 homolog B |
| chr6_+_87155537 | 0.34 |
ENST00000369577.8
ENST00000518845.1 ENST00000339907.8 ENST00000496806.2 |
ZNF292
|
zinc finger protein 292 |
| chr1_-_205084460 | 0.34 |
ENST00000367167.4
|
TMEM81
|
transmembrane protein 81 |
| chr22_-_26479664 | 0.34 |
ENST00000402105.7
|
HPS4
|
HPS4 biogenesis of lysosomal organelles complex 3 subunit 2 |
| chr1_-_151346806 | 0.34 |
ENST00000392746.7
|
RFX5
|
regulatory factor X5 |
| chr2_-_196171565 | 0.33 |
ENST00000263955.9
|
STK17B
|
serine/threonine kinase 17b |
| chr6_-_30686624 | 0.33 |
ENST00000274853.8
|
PPP1R18
|
protein phosphatase 1 regulatory subunit 18 |
| chr10_+_101354028 | 0.33 |
ENST00000393441.8
|
BTRC
|
beta-transducin repeat containing E3 ubiquitin protein ligase |
| chrX_-_119852948 | 0.33 |
ENST00000276201.7
ENST00000345865.6 |
UPF3B
|
UPF3B regulator of nonsense mediated mRNA decay |
| chr20_+_56412112 | 0.33 |
ENST00000360314.7
|
CASS4
|
Cas scaffold protein family member 4 |
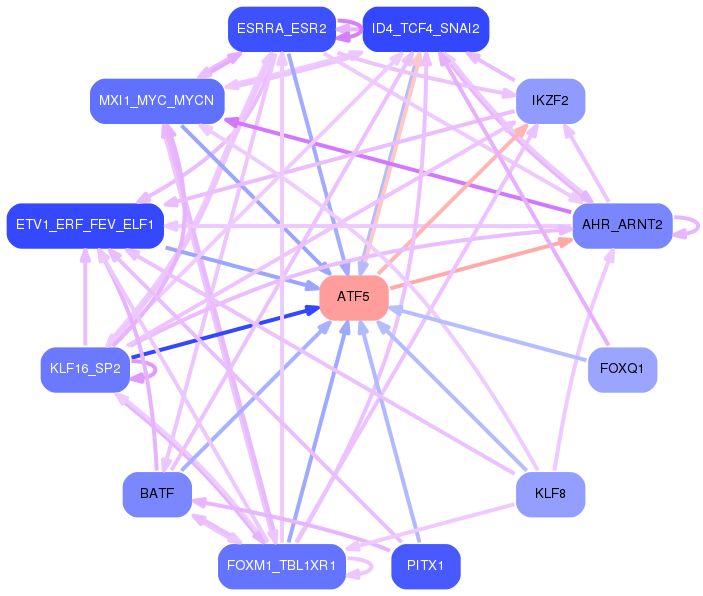
Network of associatons between targets according to the STRING database.

First level regulatory network of ATF5
Gene Ontology Analysis
Gene overrepresentation in biological process category:
| Log-likelihood per target | Total log-likelihood | Term | Description |
|---|---|---|---|
| 0.9 | 2.7 | GO:0002372 | myeloid dendritic cell cytokine production(GO:0002372) |
| 0.7 | 3.0 | GO:0045065 | cytotoxic T cell differentiation(GO:0045065) |
| 0.7 | 4.4 | GO:0070889 | mRNA localization resulting in posttranscriptional regulation of gene expression(GO:0010609) platelet alpha granule organization(GO:0070889) regulation of DNA damage response, signal transduction by p53 class mediator resulting in transcription of p21 class mediator(GO:1902162) positive regulation of DNA damage response, signal transduction by p53 class mediator resulting in transcription of p21 class mediator(GO:1902164) |
| 0.7 | 8.7 | GO:0051612 | negative regulation of neurotransmitter uptake(GO:0051581) regulation of serotonin uptake(GO:0051611) negative regulation of serotonin uptake(GO:0051612) |
| 0.4 | 0.9 | GO:2000742 | anterior head development(GO:0097065) regulation of anterior head development(GO:2000742) positive regulation of anterior head development(GO:2000744) |
| 0.4 | 5.1 | GO:0071787 | endoplasmic reticulum tubular network assembly(GO:0071787) |
| 0.4 | 1.7 | GO:0034628 | nicotinamide nucleotide biosynthetic process from aspartate(GO:0019355) 'de novo' NAD biosynthetic process from aspartate(GO:0034628) |
| 0.4 | 4.5 | GO:0021940 | positive regulation of cerebellar granule cell precursor proliferation(GO:0021940) |
| 0.4 | 2.2 | GO:0070778 | L-aspartate transport(GO:0070778) L-aspartate transmembrane transport(GO:0089712) |
| 0.3 | 5.3 | GO:2000253 | positive regulation of feeding behavior(GO:2000253) |
| 0.3 | 2.4 | GO:0021816 | extension of a leading process involved in cell motility in cerebral cortex radial glia guided migration(GO:0021816) |
| 0.2 | 1.0 | GO:1900186 | negative regulation of clathrin-mediated endocytosis(GO:1900186) |
| 0.2 | 4.5 | GO:0032287 | peripheral nervous system myelin maintenance(GO:0032287) |
| 0.2 | 5.9 | GO:0030208 | dermatan sulfate biosynthetic process(GO:0030208) |
| 0.2 | 2.2 | GO:2000324 | positive regulation of glucocorticoid receptor signaling pathway(GO:2000324) |
| 0.2 | 3.0 | GO:0097118 | neuroligin clustering involved in postsynaptic membrane assembly(GO:0097118) |
| 0.2 | 1.6 | GO:0035494 | SNARE complex disassembly(GO:0035494) |
| 0.2 | 7.5 | GO:0045662 | negative regulation of myoblast differentiation(GO:0045662) |
| 0.2 | 6.5 | GO:0090129 | positive regulation of synapse maturation(GO:0090129) |
| 0.2 | 7.1 | GO:0032012 | regulation of ARF protein signal transduction(GO:0032012) |
| 0.1 | 1.2 | GO:0099590 | neurotransmitter receptor internalization(GO:0099590) |
| 0.1 | 0.6 | GO:0051461 | positive regulation of corticotropin secretion(GO:0051461) |
| 0.1 | 1.4 | GO:0051835 | positive regulation of synapse structural plasticity(GO:0051835) |
| 0.1 | 2.3 | GO:1902902 | negative regulation of autophagosome assembly(GO:1902902) |
| 0.1 | 1.1 | GO:0038165 | oncostatin-M-mediated signaling pathway(GO:0038165) |
| 0.1 | 2.1 | GO:0070970 | interleukin-2 secretion(GO:0070970) |
| 0.1 | 0.4 | GO:0098583 | mastication(GO:0071626) learned vocalization behavior(GO:0098583) |
| 0.1 | 0.3 | GO:0015847 | putrescine transport(GO:0015847) |
| 0.1 | 0.5 | GO:0044830 | modulation by host of viral RNA genome replication(GO:0044830) positive regulation of intracellular transport of viral material(GO:1901254) |
| 0.1 | 1.4 | GO:1902748 | positive regulation of lens fiber cell differentiation(GO:1902748) |
| 0.1 | 1.7 | GO:0032876 | negative regulation of DNA endoreduplication(GO:0032876) |
| 0.1 | 1.8 | GO:2000821 | regulation of grooming behavior(GO:2000821) |
| 0.1 | 4.7 | GO:0090383 | phagosome acidification(GO:0090383) |
| 0.1 | 0.3 | GO:0071677 | positive regulation of mononuclear cell migration(GO:0071677) |
| 0.1 | 0.5 | GO:1900039 | positive regulation of cellular response to hypoxia(GO:1900039) |
| 0.1 | 2.8 | GO:0097151 | positive regulation of inhibitory postsynaptic potential(GO:0097151) modulation of inhibitory postsynaptic potential(GO:0098828) |
| 0.1 | 0.7 | GO:1902231 | positive regulation of intrinsic apoptotic signaling pathway in response to DNA damage(GO:1902231) |
| 0.1 | 1.1 | GO:0010668 | ectodermal cell differentiation(GO:0010668) |
| 0.1 | 0.3 | GO:0048073 | regulation of eye pigmentation(GO:0048073) |
| 0.1 | 1.6 | GO:0035860 | glial cell-derived neurotrophic factor receptor signaling pathway(GO:0035860) |
| 0.1 | 2.6 | GO:0097186 | amelogenesis(GO:0097186) |
| 0.1 | 1.3 | GO:0021859 | pyramidal neuron differentiation(GO:0021859) |
| 0.1 | 1.3 | GO:2001256 | regulation of store-operated calcium entry(GO:2001256) |
| 0.1 | 4.3 | GO:0035735 | intraciliary transport involved in cilium morphogenesis(GO:0035735) |
| 0.1 | 1.6 | GO:1902083 | negative regulation of peptidyl-cysteine S-nitrosylation(GO:1902083) |
| 0.1 | 0.6 | GO:2000286 | receptor internalization involved in canonical Wnt signaling pathway(GO:2000286) |
| 0.1 | 0.5 | GO:0018406 | protein C-linked glycosylation(GO:0018103) peptidyl-tryptophan modification(GO:0018211) protein C-linked glycosylation via tryptophan(GO:0018317) protein C-linked glycosylation via 2'-alpha-mannosyl-L-tryptophan(GO:0018406) |
| 0.1 | 0.7 | GO:0070444 | oligodendrocyte progenitor proliferation(GO:0070444) regulation of oligodendrocyte progenitor proliferation(GO:0070445) |
| 0.1 | 0.2 | GO:1900365 | positive regulation of mRNA polyadenylation(GO:1900365) |
| 0.1 | 3.7 | GO:0035235 | ionotropic glutamate receptor signaling pathway(GO:0035235) |
| 0.1 | 0.7 | GO:0045329 | carnitine biosynthetic process(GO:0045329) |
| 0.1 | 0.3 | GO:0035989 | tendon development(GO:0035989) |
| 0.0 | 0.2 | GO:0002188 | translation reinitiation(GO:0002188) |
| 0.0 | 1.6 | GO:0000185 | activation of MAPKKK activity(GO:0000185) |
| 0.0 | 0.2 | GO:0070681 | glutaminyl-tRNAGln biosynthesis via transamidation(GO:0070681) |
| 0.0 | 3.3 | GO:0051491 | positive regulation of filopodium assembly(GO:0051491) |
| 0.0 | 0.4 | GO:0032483 | regulation of Rab protein signal transduction(GO:0032483) |
| 0.0 | 0.1 | GO:0002380 | immunoglobulin secretion involved in immune response(GO:0002380) |
| 0.0 | 0.2 | GO:0009098 | branched-chain amino acid biosynthetic process(GO:0009082) leucine biosynthetic process(GO:0009098) valine biosynthetic process(GO:0009099) |
| 0.0 | 0.9 | GO:0050862 | positive regulation of T cell receptor signaling pathway(GO:0050862) |
| 0.0 | 3.5 | GO:0048168 | regulation of neuronal synaptic plasticity(GO:0048168) |
| 0.0 | 0.2 | GO:0002314 | germinal center B cell differentiation(GO:0002314) |
| 0.0 | 0.2 | GO:0060012 | synaptic transmission, glycinergic(GO:0060012) |
| 0.0 | 0.7 | GO:0036066 | protein O-linked fucosylation(GO:0036066) |
| 0.0 | 1.8 | GO:0007202 | activation of phospholipase C activity(GO:0007202) |
| 0.0 | 0.4 | GO:0098735 | positive regulation of the force of heart contraction(GO:0098735) |
| 0.0 | 1.8 | GO:0097120 | receptor localization to synapse(GO:0097120) |
| 0.0 | 0.5 | GO:0007512 | adult heart development(GO:0007512) |
| 0.0 | 0.7 | GO:0071361 | cellular response to ethanol(GO:0071361) |
| 0.0 | 2.0 | GO:0046949 | fatty-acyl-CoA biosynthetic process(GO:0046949) |
| 0.0 | 5.9 | GO:0007156 | homophilic cell adhesion via plasma membrane adhesion molecules(GO:0007156) |
| 0.0 | 0.2 | GO:0070537 | histone H2A K63-linked deubiquitination(GO:0070537) |
| 0.0 | 0.4 | GO:0048341 | paraxial mesoderm formation(GO:0048341) |
| 0.0 | 0.2 | GO:0007213 | G-protein coupled acetylcholine receptor signaling pathway(GO:0007213) |
| 0.0 | 1.0 | GO:0035116 | embryonic hindlimb morphogenesis(GO:0035116) |
| 0.0 | 0.3 | GO:2000271 | positive regulation of fibroblast apoptotic process(GO:2000271) |
| 0.0 | 0.1 | GO:0006565 | L-serine catabolic process(GO:0006565) |
| 0.0 | 0.2 | GO:0035234 | ectopic germ cell programmed cell death(GO:0035234) |
| 0.0 | 4.9 | GO:0007188 | adenylate cyclase-modulating G-protein coupled receptor signaling pathway(GO:0007188) |
| 0.0 | 1.1 | GO:0051281 | positive regulation of release of sequestered calcium ion into cytosol(GO:0051281) |
| 0.0 | 1.3 | GO:0048791 | calcium ion-regulated exocytosis of neurotransmitter(GO:0048791) |
| 0.0 | 1.3 | GO:0046839 | phospholipid dephosphorylation(GO:0046839) |
| 0.0 | 0.7 | GO:0051764 | actin crosslink formation(GO:0051764) |
| 0.0 | 1.8 | GO:0019933 | cAMP-mediated signaling(GO:0019933) |
| 0.0 | 1.3 | GO:1904837 | beta-catenin-TCF complex assembly(GO:1904837) |
| 0.0 | 0.4 | GO:0070734 | histone H3-K27 methylation(GO:0070734) |
| 0.0 | 0.0 | GO:1904784 | NLRP1 inflammasome complex assembly(GO:1904784) |
| 0.0 | 1.4 | GO:0000245 | spliceosomal complex assembly(GO:0000245) |
| 0.0 | 0.9 | GO:0046928 | regulation of neurotransmitter secretion(GO:0046928) |
| 0.0 | 1.1 | GO:1904893 | negative regulation of JAK-STAT cascade(GO:0046426) negative regulation of STAT cascade(GO:1904893) |
| 0.0 | 0.5 | GO:2000772 | regulation of cellular senescence(GO:2000772) |
| 0.0 | 0.7 | GO:0030513 | positive regulation of BMP signaling pathway(GO:0030513) |
Gene overrepresentation in cellular component category:
| Log-likelihood per target | Total log-likelihood | Term | Description |
|---|---|---|---|
| 0.2 | 0.7 | GO:0001674 | female germ cell nucleus(GO:0001674) |
| 0.2 | 0.8 | GO:0002189 | ribose phosphate diphosphokinase complex(GO:0002189) |
| 0.2 | 6.5 | GO:0030122 | AP-2 adaptor complex(GO:0030122) |
| 0.2 | 3.0 | GO:0036056 | filtration diaphragm(GO:0036056) slit diaphragm(GO:0036057) |
| 0.1 | 2.0 | GO:0033180 | proton-transporting V-type ATPase, V1 domain(GO:0033180) |
| 0.1 | 1.1 | GO:0034688 | integrin alphaM-beta2 complex(GO:0034688) |
| 0.1 | 5.1 | GO:0042101 | T cell receptor complex(GO:0042101) |
| 0.1 | 0.3 | GO:0031085 | BLOC-3 complex(GO:0031085) |
| 0.1 | 2.6 | GO:0016471 | vacuolar proton-transporting V-type ATPase complex(GO:0016471) |
| 0.1 | 0.5 | GO:1902737 | dendritic filopodium(GO:1902737) |
| 0.1 | 0.3 | GO:0005592 | collagen type XI trimer(GO:0005592) |
| 0.1 | 1.6 | GO:0044327 | dendritic spine head(GO:0044327) |
| 0.1 | 1.8 | GO:0098839 | postsynaptic density membrane(GO:0098839) |
| 0.1 | 1.3 | GO:0030314 | junctional membrane complex(GO:0030314) |
| 0.1 | 3.3 | GO:0044295 | axonal growth cone(GO:0044295) |
| 0.1 | 0.6 | GO:0098559 | cytoplasmic side of early endosome membrane(GO:0098559) |
| 0.1 | 2.8 | GO:0032281 | AMPA glutamate receptor complex(GO:0032281) |
| 0.1 | 0.6 | GO:0051286 | cell tip(GO:0051286) |
| 0.1 | 6.0 | GO:0032154 | cleavage furrow(GO:0032154) cell surface furrow(GO:0097610) |
| 0.1 | 0.5 | GO:0030896 | checkpoint clamp complex(GO:0030896) |
| 0.1 | 0.5 | GO:0044305 | calyx of Held(GO:0044305) |
| 0.0 | 0.2 | GO:0030956 | glutamyl-tRNA(Gln) amidotransferase complex(GO:0030956) |
| 0.0 | 0.4 | GO:0032584 | growth cone membrane(GO:0032584) |
| 0.0 | 0.2 | GO:0005944 | phosphatidylinositol 3-kinase complex, class IB(GO:0005944) |
| 0.0 | 2.8 | GO:0048786 | presynaptic active zone(GO:0048786) |
| 0.0 | 1.4 | GO:0005682 | U5 snRNP(GO:0005682) |
| 0.0 | 2.6 | GO:0098878 | ionotropic glutamate receptor complex(GO:0008328) neurotransmitter receptor complex(GO:0098878) |
| 0.0 | 2.7 | GO:0097542 | ciliary tip(GO:0097542) |
| 0.0 | 5.9 | GO:0005796 | Golgi lumen(GO:0005796) |
| 0.0 | 5.3 | GO:0070821 | tertiary granule membrane(GO:0070821) |
| 0.0 | 3.4 | GO:0043195 | terminal bouton(GO:0043195) |
| 0.0 | 0.7 | GO:0008074 | guanylate cyclase complex, soluble(GO:0008074) |
| 0.0 | 0.6 | GO:0097427 | microtubule bundle(GO:0097427) |
| 0.0 | 0.6 | GO:0097433 | dense body(GO:0097433) |
| 0.0 | 0.9 | GO:0031307 | integral component of mitochondrial outer membrane(GO:0031307) |
| 0.0 | 11.4 | GO:0099572 | postsynaptic density(GO:0014069) postsynaptic specialization(GO:0099572) |
| 0.0 | 1.7 | GO:0016235 | aggresome(GO:0016235) |
| 0.0 | 2.8 | GO:0005637 | nuclear inner membrane(GO:0005637) |
| 0.0 | 15.5 | GO:0030425 | dendrite(GO:0030425) |
| 0.0 | 8.2 | GO:0098793 | presynapse(GO:0098793) |
| 0.0 | 4.2 | GO:0055037 | recycling endosome(GO:0055037) |
| 0.0 | 0.2 | GO:0070552 | BRISC complex(GO:0070552) |
| 0.0 | 1.6 | GO:0005798 | Golgi-associated vesicle(GO:0005798) |
| 0.0 | 1.2 | GO:0019005 | SCF ubiquitin ligase complex(GO:0019005) |
| 0.0 | 0.7 | GO:0005834 | heterotrimeric G-protein complex(GO:0005834) |
| 0.0 | 5.9 | GO:0045121 | membrane raft(GO:0045121) |
| 0.0 | 1.0 | GO:0005776 | autophagosome(GO:0005776) |
Gene overrepresentation in molecular function category:
| Log-likelihood per target | Total log-likelihood | Term | Description |
|---|---|---|---|
| 1.5 | 4.5 | GO:0036505 | prosaposin receptor activity(GO:0036505) |
| 0.4 | 1.7 | GO:0000309 | nicotinamide-nucleotide adenylyltransferase activity(GO:0000309) |
| 0.4 | 2.6 | GO:0008273 | calcium, potassium:sodium antiporter activity(GO:0008273) |
| 0.4 | 2.2 | GO:0015183 | L-aspartate transmembrane transporter activity(GO:0015183) |
| 0.3 | 2.0 | GO:0016215 | stearoyl-CoA 9-desaturase activity(GO:0004768) acyl-CoA desaturase activity(GO:0016215) |
| 0.3 | 8.4 | GO:0097109 | neuroligin family protein binding(GO:0097109) |
| 0.3 | 3.0 | GO:0070699 | type II activin receptor binding(GO:0070699) |
| 0.2 | 2.8 | GO:0004971 | AMPA glutamate receptor activity(GO:0004971) |
| 0.2 | 0.7 | GO:0008336 | gamma-butyrobetaine dioxygenase activity(GO:0008336) |
| 0.2 | 1.6 | GO:0016167 | glial cell-derived neurotrophic factor receptor activity(GO:0016167) |
| 0.1 | 7.1 | GO:0005086 | ARF guanyl-nucleotide exchange factor activity(GO:0005086) |
| 0.1 | 0.8 | GO:0004749 | ribose phosphate diphosphokinase activity(GO:0004749) |
| 0.1 | 2.7 | GO:0009931 | calcium-dependent protein serine/threonine kinase activity(GO:0009931) |
| 0.1 | 5.9 | GO:0005540 | hyaluronic acid binding(GO:0005540) |
| 0.1 | 2.1 | GO:0050700 | CARD domain binding(GO:0050700) |
| 0.1 | 0.3 | GO:0015203 | polyamine transmembrane transporter activity(GO:0015203) putrescine transmembrane transporter activity(GO:0015489) |
| 0.1 | 0.7 | GO:0008853 | exodeoxyribonuclease III activity(GO:0008853) |
| 0.1 | 1.1 | GO:0001851 | complement component C3b binding(GO:0001851) |
| 0.1 | 1.7 | GO:0017162 | aryl hydrocarbon receptor binding(GO:0017162) |
| 0.1 | 0.8 | GO:0015277 | kainate selective glutamate receptor activity(GO:0015277) |
| 0.1 | 3.0 | GO:0042288 | MHC class I protein binding(GO:0042288) |
| 0.1 | 0.9 | GO:0016286 | small conductance calcium-activated potassium channel activity(GO:0016286) |
| 0.1 | 0.3 | GO:0005136 | interleukin-4 receptor binding(GO:0005136) |
| 0.1 | 1.3 | GO:0042577 | lipid phosphatase activity(GO:0042577) |
| 0.1 | 2.0 | GO:0046961 | ATPase activity, coupled to transmembrane movement of ions, rotational mechanism(GO:0044769) proton-transporting ATPase activity, rotational mechanism(GO:0046961) |
| 0.1 | 1.6 | GO:0008349 | MAP kinase kinase kinase kinase activity(GO:0008349) |
| 0.1 | 1.8 | GO:0019992 | diacylglycerol binding(GO:0019992) |
| 0.1 | 0.5 | GO:0034046 | poly(G) binding(GO:0034046) |
| 0.1 | 0.2 | GO:0015322 | proton-dependent oligopeptide secondary active transmembrane transporter activity(GO:0005427) secondary active oligopeptide transmembrane transporter activity(GO:0015322) |
| 0.0 | 0.2 | GO:0050567 | glutaminyl-tRNA synthase (glutamine-hydrolyzing) activity(GO:0050567) |
| 0.0 | 0.2 | GO:0016933 | extracellular-glycine-gated ion channel activity(GO:0016933) extracellular-glycine-gated chloride channel activity(GO:0016934) |
| 0.0 | 0.4 | GO:0099580 | ion antiporter activity involved in regulation of postsynaptic membrane potential(GO:0099580) |
| 0.0 | 0.6 | GO:0030911 | TPR domain binding(GO:0030911) |
| 0.0 | 0.6 | GO:0004726 | non-membrane spanning protein tyrosine phosphatase activity(GO:0004726) |
| 0.0 | 0.2 | GO:0052654 | branched-chain-amino-acid transaminase activity(GO:0004084) L-leucine transaminase activity(GO:0052654) L-valine transaminase activity(GO:0052655) L-isoleucine transaminase activity(GO:0052656) |
| 0.0 | 0.4 | GO:0046974 | histone methyltransferase activity (H3-K9 specific)(GO:0046974) |
| 0.0 | 2.3 | GO:0043015 | gamma-tubulin binding(GO:0043015) |
| 0.0 | 1.2 | GO:0035615 | clathrin adaptor activity(GO:0035615) endocytic adaptor activity(GO:0098748) |
| 0.0 | 2.1 | GO:0017075 | syntaxin-1 binding(GO:0017075) |
| 0.0 | 5.8 | GO:0003730 | mRNA 3'-UTR binding(GO:0003730) |
| 0.0 | 1.2 | GO:0008266 | poly(U) RNA binding(GO:0008266) |
| 0.0 | 0.1 | GO:0060001 | minus-end directed microfilament motor activity(GO:0060001) |
| 0.0 | 0.7 | GO:0001206 | transcriptional repressor activity, RNA polymerase II distal enhancer sequence-specific binding(GO:0001206) |
| 0.0 | 1.4 | GO:0008157 | protein phosphatase 1 binding(GO:0008157) |
| 0.0 | 1.8 | GO:0004385 | guanylate kinase activity(GO:0004385) |
| 0.0 | 0.7 | GO:0004383 | guanylate cyclase activity(GO:0004383) |
| 0.0 | 0.8 | GO:0001222 | transcription corepressor binding(GO:0001222) |
| 0.0 | 1.8 | GO:0030552 | cAMP binding(GO:0030552) |
| 0.0 | 4.1 | GO:0003777 | microtubule motor activity(GO:0003777) |
| 0.0 | 0.1 | GO:0050421 | oxidoreductase activity, acting on other nitrogenous compounds as donors, cytochrome as acceptor(GO:0016662) nitrite reductase (NO-forming) activity(GO:0050421) carbon monoxide binding(GO:0070025) nitrite reductase activity(GO:0098809) |
| 0.0 | 0.6 | GO:0050321 | tau-protein kinase activity(GO:0050321) |
| 0.0 | 2.9 | GO:0048365 | Rac GTPase binding(GO:0048365) |
| 0.0 | 0.4 | GO:0034236 | protein kinase A catalytic subunit binding(GO:0034236) |
| 0.0 | 7.0 | GO:0005125 | cytokine activity(GO:0005125) |
| 0.0 | 0.9 | GO:0005326 | neurotransmitter transporter activity(GO:0005326) |
| 0.0 | 0.5 | GO:0015271 | outward rectifier potassium channel activity(GO:0015271) |
| 0.0 | 5.2 | GO:0017124 | SH3 domain binding(GO:0017124) |
| 0.0 | 1.4 | GO:0001205 | transcriptional activator activity, RNA polymerase II distal enhancer sequence-specific binding(GO:0001205) |
| 0.0 | 2.6 | GO:0016820 | hydrolase activity, acting on acid anhydrides, catalyzing transmembrane movement of substances(GO:0016820) |
| 0.0 | 1.3 | GO:0005544 | calcium-dependent phospholipid binding(GO:0005544) |
| 0.0 | 3.3 | GO:0005262 | calcium channel activity(GO:0005262) |
| 0.0 | 0.5 | GO:0000030 | mannosyltransferase activity(GO:0000030) |
| 0.0 | 3.4 | GO:0005089 | Rho guanyl-nucleotide exchange factor activity(GO:0005089) |
| 0.0 | 0.4 | GO:0017160 | Ral GTPase binding(GO:0017160) |
| 0.0 | 1.4 | GO:0005546 | phosphatidylinositol-4,5-bisphosphate binding(GO:0005546) |
| 0.0 | 2.7 | GO:0017137 | Rab GTPase binding(GO:0017137) |
| 0.0 | 4.9 | GO:0030246 | carbohydrate binding(GO:0030246) |
| 0.0 | 1.3 | GO:0003705 | transcription factor activity, RNA polymerase II distal enhancer sequence-specific binding(GO:0003705) |
| 0.0 | 0.2 | GO:0061578 | Lys63-specific deubiquitinase activity(GO:0061578) |
| 0.0 | 2.8 | GO:0035091 | phosphatidylinositol binding(GO:0035091) |
Gene overrepresentation in curated gene sets: canonical pathways category:
| Log-likelihood per target | Total log-likelihood | Term | Description |
|---|---|---|---|
| 0.1 | 5.9 | PID TOLL ENDOGENOUS PATHWAY | Endogenous TLR signaling |
| 0.0 | 5.1 | PID CD8 TCR PATHWAY | TCR signaling in naïve CD8+ T cells |
| 0.0 | 2.7 | PID PI3K PLC TRK PATHWAY | Trk receptor signaling mediated by PI3K and PLC-gamma |
| 0.0 | 1.8 | PID RAS PATHWAY | Regulation of Ras family activation |
| 0.0 | 1.8 | ST GA12 PATHWAY | G alpha 12 Pathway |
| 0.0 | 0.7 | PID LPA4 PATHWAY | LPA4-mediated signaling events |
| 0.0 | 1.1 | PID IL3 PATHWAY | IL3-mediated signaling events |
| 0.0 | 2.8 | PID TRKR PATHWAY | Neurotrophic factor-mediated Trk receptor signaling |
| 0.0 | 0.8 | PID IL8 CXCR1 PATHWAY | IL8- and CXCR1-mediated signaling events |
| 0.0 | 1.1 | ST B CELL ANTIGEN RECEPTOR | B Cell Antigen Receptor |
| 0.0 | 1.1 | PID INTEGRIN CS PATHWAY | Integrin family cell surface interactions |
| 0.0 | 1.7 | PID PLK1 PATHWAY | PLK1 signaling events |
| 0.0 | 0.7 | PID CONE PATHWAY | Visual signal transduction: Cones |
| 0.0 | 1.6 | PID NFAT TFPATHWAY | Calcineurin-regulated NFAT-dependent transcription in lymphocytes |
| 0.0 | 3.9 | NABA ECM AFFILIATED | Genes encoding proteins affiliated structurally or functionally to extracellular matrix proteins |
| 0.0 | 0.7 | PID ATM PATHWAY | ATM pathway |
| 0.0 | 0.5 | PID HDAC CLASSIII PATHWAY | Signaling events mediated by HDAC Class III |
Gene overrepresentation in curated gene sets: REACTOME pathways category:
| Log-likelihood per target | Total log-likelihood | Term | Description |
|---|---|---|---|
| 0.2 | 5.9 | REACTOME CS DS DEGRADATION | Genes involved in CS/DS degradation |
| 0.1 | 5.6 | REACTOME TRAFFICKING OF GLUR2 CONTAINING AMPA RECEPTORS | Genes involved in Trafficking of GluR2-containing AMPA receptors |
| 0.1 | 4.7 | REACTOME INSULIN RECEPTOR RECYCLING | Genes involved in Insulin receptor recycling |
| 0.1 | 5.0 | REACTOME GLUTAMATE NEUROTRANSMITTER RELEASE CYCLE | Genes involved in Glutamate Neurotransmitter Release Cycle |
| 0.1 | 4.1 | REACTOME KINESINS | Genes involved in Kinesins |
| 0.1 | 3.0 | REACTOME NEPHRIN INTERACTIONS | Genes involved in Nephrin interactions |
| 0.0 | 0.7 | REACTOME REGULATION OF INSULIN SECRETION BY ACETYLCHOLINE | Genes involved in Regulation of Insulin Secretion by Acetylcholine |
| 0.0 | 3.4 | REACTOME CA DEPENDENT EVENTS | Genes involved in Ca-dependent events |
| 0.0 | 1.8 | REACTOME RAP1 SIGNALLING | Genes involved in Rap1 signalling |
| 0.0 | 2.1 | REACTOME DOWNSTREAM TCR SIGNALING | Genes involved in Downstream TCR signaling |
| 0.0 | 4.1 | REACTOME IMMUNOREGULATORY INTERACTIONS BETWEEN A LYMPHOID AND A NON LYMPHOID CELL | Genes involved in Immunoregulatory interactions between a Lymphoid and a non-Lymphoid cell |
| 0.0 | 0.8 | REACTOME IONOTROPIC ACTIVITY OF KAINATE RECEPTORS | Genes involved in Ionotropic activity of Kainate Receptors |
| 0.0 | 5.8 | REACTOME G ALPHA S SIGNALLING EVENTS | Genes involved in G alpha (s) signalling events |
| 0.0 | 1.4 | REACTOME ADHERENS JUNCTIONS INTERACTIONS | Genes involved in Adherens junctions interactions |
| 0.0 | 0.5 | REACTOME TANDEM PORE DOMAIN POTASSIUM CHANNELS | Genes involved in Tandem pore domain potassium channels |
| 0.0 | 1.7 | REACTOME MEIOTIC SYNAPSIS | Genes involved in Meiotic Synapsis |
| 0.0 | 1.4 | REACTOME SIGNALING BY ROBO RECEPTOR | Genes involved in Signaling by Robo receptor |
| 0.0 | 1.3 | REACTOME NETRIN1 SIGNALING | Genes involved in Netrin-1 signaling |
| 0.0 | 3.1 | REACTOME TRANSPORT OF INORGANIC CATIONS ANIONS AND AMINO ACIDS OLIGOPEPTIDES | Genes involved in Transport of inorganic cations/anions and amino acids/oligopeptides |
| 0.0 | 0.5 | REACTOME PROLACTIN RECEPTOR SIGNALING | Genes involved in Prolactin receptor signaling |
| 0.0 | 0.7 | REACTOME ACTIVATION OF ATR IN RESPONSE TO REPLICATION STRESS | Genes involved in Activation of ATR in response to replication stress |
| 0.0 | 1.1 | REACTOME METABOLISM OF VITAMINS AND COFACTORS | Genes involved in Metabolism of vitamins and cofactors |
| 0.0 | 1.1 | REACTOME INTEGRIN CELL SURFACE INTERACTIONS | Genes involved in Integrin cell surface interactions |