Project
Illumina Body Map 2 (GSE30611)
Navigation
Downloads
Results for AUAAAGU
Z-value: 0.57
Motif logo

miRNA associated with seed AUAAAGU
| Name | miRBASE accession |
|---|---|
|
hsa-miR-142-5p
|
MIMAT0000433 |
|
hsa-miR-5590-3p
|
MIMAT0022300 |
Activity profile of AUAAAGU motif
Sorted Z-values of AUAAAGU motif
Network of associatons between targets according to the STRING database.

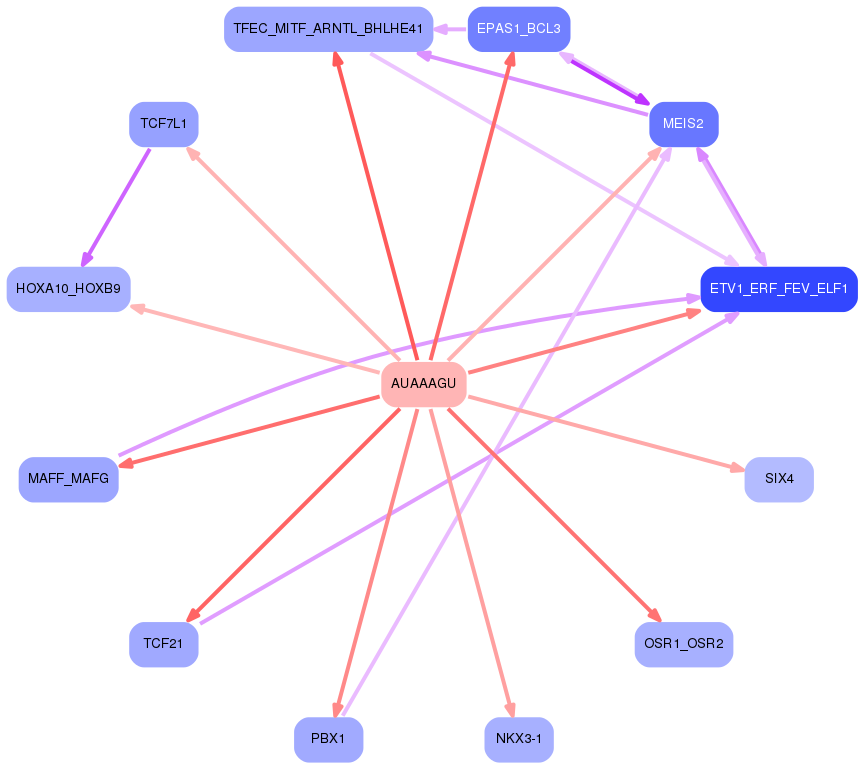
First level regulatory network of AUAAAGU
Gene Ontology Analysis
Gene overrepresentation in biological process category:
| Log-likelihood per target | Total log-likelihood | Term | Description |
|---|---|---|---|
| 0.5 | 3.3 | GO:0090131 | mesenchyme migration(GO:0090131) |
| 0.4 | 1.3 | GO:0014707 | branchiomeric skeletal muscle development(GO:0014707) |
| 0.4 | 1.5 | GO:1905150 | regulation of voltage-gated sodium channel activity(GO:1905150) |
| 0.4 | 1.1 | GO:0060128 | corticotropin hormone secreting cell differentiation(GO:0060128) |
| 0.3 | 0.9 | GO:0060931 | sinoatrial node cell development(GO:0060931) |
| 0.3 | 1.1 | GO:0072183 | osmosensory signaling pathway(GO:0007231) negative regulation of nephron tubule epithelial cell differentiation(GO:0072183) kidney smooth muscle tissue development(GO:0072194) negative regulation of epithelial cell differentiation involved in kidney development(GO:2000697) |
| 0.3 | 0.8 | GO:2001035 | tongue muscle cell differentiation(GO:0035981) positive regulation of skeletal muscle fiber differentiation(GO:1902811) regulation of tongue muscle cell differentiation(GO:2001035) positive regulation of tongue muscle cell differentiation(GO:2001037) |
| 0.2 | 0.2 | GO:0071596 | ubiquitin-dependent protein catabolic process via the N-end rule pathway(GO:0071596) |
| 0.2 | 0.6 | GO:0061033 | secretion by lung epithelial cell involved in lung growth(GO:0061033) |
| 0.2 | 0.6 | GO:0038162 | erythropoietin-mediated signaling pathway(GO:0038162) mast cell proliferation(GO:0070662) |
| 0.2 | 0.6 | GO:0044691 | tooth eruption(GO:0044691) |
| 0.1 | 0.4 | GO:0098528 | skeletal muscle fiber differentiation(GO:0098528) |
| 0.1 | 1.0 | GO:0003221 | right ventricular cardiac muscle tissue morphogenesis(GO:0003221) |
| 0.1 | 1.0 | GO:2000601 | positive regulation of Arp2/3 complex-mediated actin nucleation(GO:2000601) |
| 0.1 | 1.7 | GO:0051388 | positive regulation of neurotrophin TRK receptor signaling pathway(GO:0051388) |
| 0.1 | 0.2 | GO:0045715 | negative regulation of low-density lipoprotein particle receptor biosynthetic process(GO:0045715) |
| 0.1 | 0.7 | GO:0021827 | cerebral cortex tangential migration using cell-cell interactions(GO:0021823) postnatal olfactory bulb interneuron migration(GO:0021827) chemorepulsion involved in postnatal olfactory bulb interneuron migration(GO:0021836) negative regulation of negative chemotaxis(GO:0050925) |
| 0.1 | 1.2 | GO:0048625 | myoblast fate commitment(GO:0048625) |
| 0.1 | 0.3 | GO:0090272 | negative regulation of fibroblast growth factor production(GO:0090272) |
| 0.1 | 0.5 | GO:2000836 | androgen secretion(GO:0035935) regulation of androgen secretion(GO:2000834) positive regulation of androgen secretion(GO:2000836) |
| 0.1 | 0.5 | GO:0098904 | regulation of AV node cell action potential(GO:0098904) |
| 0.1 | 0.5 | GO:1990523 | bone regeneration(GO:1990523) |
| 0.1 | 0.3 | GO:0042137 | sequestering of neurotransmitter(GO:0042137) |
| 0.1 | 0.4 | GO:0048371 | lateral mesodermal cell differentiation(GO:0048371) lateral mesodermal cell fate commitment(GO:0048372) lateral mesodermal cell fate specification(GO:0048377) regulation of lateral mesodermal cell fate specification(GO:0048378) |
| 0.1 | 0.3 | GO:0097051 | establishment of protein localization to endoplasmic reticulum membrane(GO:0097051) |
| 0.1 | 0.4 | GO:0035790 | platelet-derived growth factor receptor-alpha signaling pathway(GO:0035790) |
| 0.1 | 1.3 | GO:0014809 | regulation of skeletal muscle contraction by regulation of release of sequestered calcium ion(GO:0014809) |
| 0.1 | 0.5 | GO:0009996 | negative regulation of cell fate specification(GO:0009996) |
| 0.1 | 1.0 | GO:0060075 | regulation of resting membrane potential(GO:0060075) |
| 0.1 | 0.4 | GO:0009106 | lipoate metabolic process(GO:0009106) |
| 0.1 | 0.1 | GO:0034059 | response to anoxia(GO:0034059) |
| 0.1 | 0.9 | GO:0018401 | peptidyl-proline hydroxylation to 4-hydroxy-L-proline(GO:0018401) |
| 0.1 | 0.1 | GO:0090526 | regulation of gluconeogenesis involved in cellular glucose homeostasis(GO:0090526) |
| 0.1 | 0.5 | GO:0099558 | motor learning(GO:0061743) maintenance of synapse structure(GO:0099558) |
| 0.1 | 0.2 | GO:1904393 | regulation of skeletal muscle acetylcholine-gated channel clustering(GO:1904393) positive regulation of skeletal muscle acetylcholine-gated channel clustering(GO:1904395) |
| 0.1 | 0.3 | GO:0072023 | thick ascending limb development(GO:0072023) metanephric thick ascending limb development(GO:0072233) |
| 0.1 | 0.3 | GO:0051795 | apoptotic process involved in outflow tract morphogenesis(GO:0003275) uterine wall breakdown(GO:0042704) positive regulation of catagen(GO:0051795) regulation of apoptotic process involved in outflow tract morphogenesis(GO:1902256) |
| 0.1 | 0.2 | GO:2000642 | intralumenal vesicle formation(GO:0070676) negative regulation of early endosome to late endosome transport(GO:2000642) |
| 0.1 | 0.6 | GO:0051694 | pointed-end actin filament capping(GO:0051694) |
| 0.1 | 0.7 | GO:0001886 | endothelial cell morphogenesis(GO:0001886) |
| 0.1 | 0.7 | GO:0030091 | protein repair(GO:0030091) |
| 0.1 | 0.2 | GO:0021784 | postganglionic parasympathetic fiber development(GO:0021784) |
| 0.1 | 0.4 | GO:1903862 | positive regulation of oxidative phosphorylation(GO:1903862) |
| 0.1 | 1.4 | GO:0010944 | negative regulation of transcription by competitive promoter binding(GO:0010944) |
| 0.1 | 1.0 | GO:0006002 | fructose 6-phosphate metabolic process(GO:0006002) |
| 0.0 | 0.2 | GO:0010701 | positive regulation of norepinephrine secretion(GO:0010701) |
| 0.0 | 0.5 | GO:1990253 | cellular response to leucine(GO:0071233) cellular response to leucine starvation(GO:1990253) |
| 0.0 | 0.4 | GO:0060029 | convergent extension involved in organogenesis(GO:0060029) |
| 0.0 | 0.1 | GO:0048213 | Golgi vesicle prefusion complex stabilization(GO:0048213) |
| 0.0 | 0.1 | GO:0003420 | regulation of growth plate cartilage chondrocyte proliferation(GO:0003420) histone H3-R2 methylation(GO:0034970) |
| 0.0 | 0.3 | GO:0097327 | response to antineoplastic agent(GO:0097327) |
| 0.0 | 0.8 | GO:0018026 | peptidyl-lysine monomethylation(GO:0018026) |
| 0.0 | 0.9 | GO:0001542 | ovulation from ovarian follicle(GO:0001542) |
| 0.0 | 0.1 | GO:2000118 | regulation of sodium-dependent phosphate transport(GO:2000118) |
| 0.0 | 0.2 | GO:1990535 | neuron projection maintenance(GO:1990535) |
| 0.0 | 1.2 | GO:0007567 | parturition(GO:0007567) |
| 0.0 | 1.0 | GO:0097062 | dendritic spine maintenance(GO:0097062) |
| 0.0 | 1.0 | GO:0051044 | positive regulation of membrane protein ectodomain proteolysis(GO:0051044) |
| 0.0 | 0.1 | GO:0061182 | negative regulation of chondrocyte development(GO:0061182) |
| 0.0 | 0.3 | GO:0070164 | negative regulation of adiponectin secretion(GO:0070164) |
| 0.0 | 0.2 | GO:0044034 | negative stranded viral RNA replication(GO:0039689) multi-organism biosynthetic process(GO:0044034) |
| 0.0 | 0.2 | GO:1904073 | regulation of trophectodermal cell proliferation(GO:1904073) positive regulation of trophectodermal cell proliferation(GO:1904075) |
| 0.0 | 0.7 | GO:0035413 | positive regulation of catenin import into nucleus(GO:0035413) |
| 0.0 | 0.1 | GO:0010735 | positive regulation of transcription via serum response element binding(GO:0010735) |
| 0.0 | 0.1 | GO:0044313 | protein K6-linked deubiquitination(GO:0044313) protein K27-linked deubiquitination(GO:1990167) |
| 0.0 | 0.8 | GO:0090005 | negative regulation of establishment of protein localization to plasma membrane(GO:0090005) |
| 0.0 | 0.5 | GO:0033601 | positive regulation of mammary gland epithelial cell proliferation(GO:0033601) |
| 0.0 | 0.1 | GO:0060448 | dichotomous subdivision of terminal units involved in lung branching(GO:0060448) |
| 0.0 | 0.2 | GO:1900025 | negative regulation of substrate adhesion-dependent cell spreading(GO:1900025) |
| 0.0 | 0.2 | GO:0042271 | susceptibility to natural killer cell mediated cytotoxicity(GO:0042271) |
| 0.0 | 0.1 | GO:0019046 | release from viral latency(GO:0019046) regulation of DNA strand elongation(GO:0060382) |
| 0.0 | 0.5 | GO:2000675 | negative regulation of type B pancreatic cell apoptotic process(GO:2000675) |
| 0.0 | 0.3 | GO:0021785 | branchiomotor neuron axon guidance(GO:0021785) |
| 0.0 | 0.1 | GO:0071639 | positive regulation of monocyte chemotactic protein-1 production(GO:0071639) |
| 0.0 | 0.5 | GO:0038166 | angiotensin-activated signaling pathway(GO:0038166) |
| 0.0 | 0.3 | GO:2001181 | positive regulation of interleukin-10 secretion(GO:2001181) |
| 0.0 | 0.5 | GO:0036158 | outer dynein arm assembly(GO:0036158) |
| 0.0 | 0.2 | GO:0090074 | negative regulation of protein homodimerization activity(GO:0090074) |
| 0.0 | 0.1 | GO:0003192 | mitral valve formation(GO:0003192) |
| 0.0 | 0.1 | GO:0042668 | auditory receptor cell fate determination(GO:0042668) |
| 0.0 | 1.8 | GO:0007157 | heterophilic cell-cell adhesion via plasma membrane cell adhesion molecules(GO:0007157) |
| 0.0 | 0.5 | GO:0033147 | negative regulation of intracellular estrogen receptor signaling pathway(GO:0033147) |
| 0.0 | 1.1 | GO:0009954 | proximal/distal pattern formation(GO:0009954) |
| 0.0 | 0.1 | GO:0010796 | regulation of multivesicular body size(GO:0010796) |
| 0.0 | 0.3 | GO:0008343 | adult feeding behavior(GO:0008343) |
| 0.0 | 0.1 | GO:0007386 | compartment pattern specification(GO:0007386) |
| 0.0 | 0.2 | GO:0030579 | ubiquitin-dependent SMAD protein catabolic process(GO:0030579) |
| 0.0 | 0.6 | GO:0045725 | positive regulation of glycogen biosynthetic process(GO:0045725) |
| 0.0 | 0.2 | GO:0097577 | intracellular sequestering of iron ion(GO:0006880) sequestering of iron ion(GO:0097577) |
| 0.0 | 0.3 | GO:1904352 | positive regulation of protein catabolic process in the vacuole(GO:1904352) |
| 0.0 | 0.1 | GO:0061502 | early endosome to recycling endosome transport(GO:0061502) |
| 0.0 | 0.1 | GO:0051415 | interphase microtubule nucleation by interphase microtubule organizing center(GO:0051415) microtubule nucleation by microtubule organizing center(GO:0051418) |
| 0.0 | 1.8 | GO:0010761 | fibroblast migration(GO:0010761) |
| 0.0 | 0.1 | GO:0032258 | CVT pathway(GO:0032258) |
| 0.0 | 0.3 | GO:0061635 | regulation of protein complex stability(GO:0061635) |
| 0.0 | 0.2 | GO:0051005 | negative regulation of lipoprotein lipase activity(GO:0051005) |
| 0.0 | 0.7 | GO:0006607 | NLS-bearing protein import into nucleus(GO:0006607) |
| 0.0 | 0.5 | GO:0010669 | epithelial structure maintenance(GO:0010669) |
| 0.0 | 0.1 | GO:1902412 | regulation of mitotic cytokinesis(GO:1902412) |
| 0.0 | 0.1 | GO:0030047 | actin modification(GO:0030047) |
| 0.0 | 0.1 | GO:0071394 | positive regulation of centrosome duplication(GO:0010825) cellular response to testosterone stimulus(GO:0071394) |
| 0.0 | 0.4 | GO:0048681 | negative regulation of axon regeneration(GO:0048681) |
| 0.0 | 0.1 | GO:0030242 | pexophagy(GO:0030242) reticulophagy(GO:0061709) |
| 0.0 | 0.1 | GO:0045054 | constitutive secretory pathway(GO:0045054) |
| 0.0 | 0.1 | GO:0016584 | nucleosome positioning(GO:0016584) |
Gene overrepresentation in cellular component category:
| Log-likelihood per target | Total log-likelihood | Term | Description |
|---|---|---|---|
| 0.7 | 3.3 | GO:0042643 | actomyosin, actin portion(GO:0042643) |
| 0.2 | 1.0 | GO:1902937 | inward rectifier potassium channel complex(GO:1902937) |
| 0.2 | 0.6 | GO:0034686 | integrin alphav-beta8 complex(GO:0034686) |
| 0.1 | 0.4 | GO:0043159 | acrosomal matrix(GO:0043159) |
| 0.1 | 0.6 | GO:0005899 | insulin receptor complex(GO:0005899) |
| 0.1 | 0.5 | GO:1990131 | Gtr1-Gtr2 GTPase complex(GO:1990131) |
| 0.1 | 1.3 | GO:0016013 | syntrophin complex(GO:0016013) |
| 0.1 | 1.0 | GO:0031209 | SCAR complex(GO:0031209) |
| 0.1 | 0.5 | GO:0016012 | sarcoglycan complex(GO:0016012) |
| 0.0 | 1.0 | GO:0097427 | microtubule bundle(GO:0097427) |
| 0.0 | 0.5 | GO:0036157 | outer dynein arm(GO:0036157) |
| 0.0 | 0.3 | GO:0070847 | core mediator complex(GO:0070847) |
| 0.0 | 0.1 | GO:1990723 | cytoplasmic periphery of the nuclear pore complex(GO:1990723) |
| 0.0 | 0.1 | GO:0097629 | extrinsic component of omegasome membrane(GO:0097629) |
| 0.0 | 0.1 | GO:0008275 | gamma-tubulin small complex(GO:0008275) |
| 0.0 | 0.5 | GO:0014701 | junctional sarcoplasmic reticulum membrane(GO:0014701) |
| 0.0 | 0.4 | GO:1990712 | HFE-transferrin receptor complex(GO:1990712) |
| 0.0 | 0.5 | GO:0043083 | synaptic cleft(GO:0043083) |
| 0.0 | 0.3 | GO:0002116 | semaphorin receptor complex(GO:0002116) |
| 0.0 | 0.3 | GO:0060203 | clathrin-sculpted glutamate transport vesicle(GO:0060199) clathrin-sculpted glutamate transport vesicle membrane(GO:0060203) |
| 0.0 | 0.1 | GO:0030906 | retromer, cargo-selective complex(GO:0030906) |
| 0.0 | 0.1 | GO:1990316 | ATG1/ULK1 kinase complex(GO:1990316) |
| 0.0 | 0.2 | GO:0042584 | chromaffin granule membrane(GO:0042584) dendritic spine neck(GO:0044326) |
| 0.0 | 1.7 | GO:1904115 | axon cytoplasm(GO:1904115) |
| 0.0 | 0.2 | GO:0031313 | extrinsic component of endosome membrane(GO:0031313) |
| 0.0 | 0.2 | GO:0035867 | alphav-beta3 integrin-IGF-1-IGF1R complex(GO:0035867) |
| 0.0 | 0.7 | GO:0030057 | desmosome(GO:0030057) |
| 0.0 | 0.1 | GO:0005863 | striated muscle myosin thick filament(GO:0005863) |
| 0.0 | 0.1 | GO:0005818 | astral microtubule(GO:0000235) aster(GO:0005818) |
| 0.0 | 0.1 | GO:0036398 | TCR signalosome(GO:0036398) |
| 0.0 | 0.2 | GO:0032009 | early phagosome(GO:0032009) |
| 0.0 | 0.2 | GO:0070449 | elongin complex(GO:0070449) |
| 0.0 | 0.6 | GO:0042629 | mast cell granule(GO:0042629) |
| 0.0 | 0.1 | GO:0034271 | phosphatidylinositol 3-kinase complex, class III, type I(GO:0034271) phosphatidylinositol 3-kinase complex, class III, type II(GO:0034272) |
| 0.0 | 0.1 | GO:0071458 | integral component of cytoplasmic side of endoplasmic reticulum membrane(GO:0071458) |
| 0.0 | 0.3 | GO:0032045 | guanyl-nucleotide exchange factor complex(GO:0032045) |
| 0.0 | 0.7 | GO:0046658 | anchored component of plasma membrane(GO:0046658) |
| 0.0 | 0.6 | GO:0036379 | striated muscle thin filament(GO:0005865) myofilament(GO:0036379) |
| 0.0 | 0.8 | GO:0030660 | Golgi-associated vesicle membrane(GO:0030660) |
| 0.0 | 0.2 | GO:0016600 | flotillin complex(GO:0016600) |
| 0.0 | 0.3 | GO:0097038 | perinuclear endoplasmic reticulum(GO:0097038) |
Gene overrepresentation in molecular function category:
| Log-likelihood per target | Total log-likelihood | Term | Description |
|---|---|---|---|
| 0.2 | 0.8 | GO:0032427 | GBD domain binding(GO:0032427) |
| 0.2 | 1.4 | GO:0043426 | MRF binding(GO:0043426) |
| 0.2 | 0.8 | GO:0008401 | retinoic acid 4-hydroxylase activity(GO:0008401) |
| 0.1 | 0.6 | GO:1990430 | extracellular matrix protein binding(GO:1990430) |
| 0.1 | 1.0 | GO:0003872 | 6-phosphofructokinase activity(GO:0003872) |
| 0.1 | 0.5 | GO:0048763 | calcium-induced calcium release activity(GO:0048763) |
| 0.1 | 0.6 | GO:0004882 | androgen receptor activity(GO:0004882) |
| 0.1 | 0.7 | GO:0033743 | peptide-methionine (R)-S-oxide reductase activity(GO:0033743) |
| 0.1 | 1.0 | GO:0005114 | type II transforming growth factor beta receptor binding(GO:0005114) |
| 0.1 | 1.1 | GO:0070700 | BMP receptor binding(GO:0070700) |
| 0.1 | 0.4 | GO:0005017 | platelet-derived growth factor-activated receptor activity(GO:0005017) |
| 0.1 | 0.7 | GO:0008046 | axon guidance receptor activity(GO:0008046) |
| 0.1 | 0.2 | GO:0004419 | hydroxymethylglutaryl-CoA lyase activity(GO:0004419) |
| 0.1 | 0.3 | GO:0070004 | cysteine-type carboxypeptidase activity(GO:0016807) cysteine-type exopeptidase activity(GO:0070004) |
| 0.1 | 1.0 | GO:1990459 | transferrin receptor binding(GO:1990459) |
| 0.0 | 0.2 | GO:0030379 | neurotensin receptor activity, non-G-protein coupled(GO:0030379) |
| 0.0 | 0.9 | GO:0031545 | peptidyl-proline 4-dioxygenase activity(GO:0031545) |
| 0.0 | 0.4 | GO:0034604 | pyruvate dehydrogenase activity(GO:0004738) pyruvate dehydrogenase [NAD(P)+] activity(GO:0034603) pyruvate dehydrogenase (NAD+) activity(GO:0034604) |
| 0.0 | 5.2 | GO:0017022 | myosin binding(GO:0017022) |
| 0.0 | 0.4 | GO:0098821 | BMP receptor activity(GO:0098821) |
| 0.0 | 1.1 | GO:0042813 | Wnt-activated receptor activity(GO:0042813) |
| 0.0 | 0.5 | GO:0010859 | calcium-dependent cysteine-type endopeptidase inhibitor activity(GO:0010859) |
| 0.0 | 1.0 | GO:0022841 | potassium ion leak channel activity(GO:0022841) |
| 0.0 | 0.1 | GO:0005169 | neurotrophin TRKB receptor binding(GO:0005169) |
| 0.0 | 0.2 | GO:0042799 | histone methyltransferase activity (H4-K20 specific)(GO:0042799) |
| 0.0 | 0.5 | GO:0030274 | LIM domain binding(GO:0030274) |
| 0.0 | 0.5 | GO:0045504 | dynein heavy chain binding(GO:0045504) |
| 0.0 | 0.3 | GO:0015319 | sodium:inorganic phosphate symporter activity(GO:0015319) |
| 0.0 | 0.2 | GO:1903135 | cupric ion binding(GO:1903135) |
| 0.0 | 0.1 | GO:0072590 | N-acetyl-L-aspartate-L-glutamate ligase activity(GO:0072590) |
| 0.0 | 0.4 | GO:0046975 | histone methyltransferase activity (H3-K36 specific)(GO:0046975) |
| 0.0 | 0.6 | GO:0004716 | receptor signaling protein tyrosine kinase activity(GO:0004716) |
| 0.0 | 0.3 | GO:0001665 | alpha-N-acetylgalactosaminide alpha-2,6-sialyltransferase activity(GO:0001665) |
| 0.0 | 0.2 | GO:1904929 | coreceptor activity involved in Wnt signaling pathway(GO:0071936) coreceptor activity involved in Wnt signaling pathway, planar cell polarity pathway(GO:1904929) |
| 0.0 | 0.6 | GO:0005523 | tropomyosin binding(GO:0005523) |
| 0.0 | 0.1 | GO:0010736 | serum response element binding(GO:0010736) |
| 0.0 | 0.1 | GO:0097108 | hedgehog family protein binding(GO:0097108) |
| 0.0 | 0.4 | GO:0009931 | calcium-dependent protein serine/threonine kinase activity(GO:0009931) |
| 0.0 | 1.2 | GO:0043425 | bHLH transcription factor binding(GO:0043425) |
| 0.0 | 0.3 | GO:0017034 | Rap guanyl-nucleotide exchange factor activity(GO:0017034) |
| 0.0 | 0.5 | GO:0070016 | armadillo repeat domain binding(GO:0070016) |
| 0.0 | 0.3 | GO:0017154 | semaphorin receptor activity(GO:0017154) |
| 0.0 | 0.1 | GO:0000285 | 1-phosphatidylinositol-3-phosphate 5-kinase activity(GO:0000285) |
| 0.0 | 1.2 | GO:0019003 | GDP binding(GO:0019003) |
| 0.0 | 0.4 | GO:0004653 | polypeptide N-acetylgalactosaminyltransferase activity(GO:0004653) |
| 0.0 | 0.1 | GO:0019784 | NEDD8-specific protease activity(GO:0019784) |
| 0.0 | 0.1 | GO:0070137 | ubiquitin-like protein-specific endopeptidase activity(GO:0070137) SUMO-specific endopeptidase activity(GO:0070139) |
| 0.0 | 0.6 | GO:0015026 | coreceptor activity(GO:0015026) |
| 0.0 | 0.7 | GO:0008139 | nuclear localization sequence binding(GO:0008139) |
| 0.0 | 1.3 | GO:0017080 | sodium channel regulator activity(GO:0017080) |
| 0.0 | 0.9 | GO:0030552 | cAMP binding(GO:0030552) |
| 0.0 | 0.5 | GO:0005104 | fibroblast growth factor receptor binding(GO:0005104) |
| 0.0 | 0.2 | GO:0048273 | mitogen-activated protein kinase p38 binding(GO:0048273) |
| 0.0 | 0.1 | GO:0050733 | RS domain binding(GO:0050733) |
| 0.0 | 0.8 | GO:0035035 | histone acetyltransferase binding(GO:0035035) |
| 0.0 | 0.2 | GO:0048185 | activin binding(GO:0048185) |
| 0.0 | 0.1 | GO:0035242 | protein-arginine omega-N asymmetric methyltransferase activity(GO:0035242) |
| 0.0 | 0.7 | GO:0005158 | insulin receptor binding(GO:0005158) |
| 0.0 | 0.1 | GO:0042500 | aspartic endopeptidase activity, intramembrane cleaving(GO:0042500) |
Gene overrepresentation in curated gene sets: canonical pathways category:
| Log-likelihood per target | Total log-likelihood | Term | Description |
|---|---|---|---|
| 0.0 | 3.3 | PID BMP PATHWAY | BMP receptor signaling |
| 0.0 | 2.1 | PID HIF2PATHWAY | HIF-2-alpha transcription factor network |
| 0.0 | 0.4 | ST JNK MAPK PATHWAY | JNK MAPK Pathway |
| 0.0 | 1.0 | PID P38 MK2 PATHWAY | p38 signaling mediated by MAPKAP kinases |
| 0.0 | 2.3 | PID ILK PATHWAY | Integrin-linked kinase signaling |
| 0.0 | 0.6 | PID INTEGRIN5 PATHWAY | Beta5 beta6 beta7 and beta8 integrin cell surface interactions |
| 0.0 | 1.5 | PID INSULIN PATHWAY | Insulin Pathway |
| 0.0 | 1.3 | PID ECADHERIN NASCENT AJ PATHWAY | E-cadherin signaling in the nascent adherens junction |
| 0.0 | 0.7 | ST WNT CA2 CYCLIC GMP PATHWAY | Wnt/Ca2+/cyclic GMP signaling. |
| 0.0 | 0.5 | PID WNT SIGNALING PATHWAY | Wnt signaling network |
| 0.0 | 0.2 | PID PDGFRA PATHWAY | PDGFR-alpha signaling pathway |
| 0.0 | 0.4 | PID HEDGEHOG 2PATHWAY | Signaling events mediated by the Hedgehog family |
| 0.0 | 1.3 | PID HIF1 TFPATHWAY | HIF-1-alpha transcription factor network |
Gene overrepresentation in curated gene sets: REACTOME pathways category:
| Log-likelihood per target | Total log-likelihood | Term | Description |
|---|---|---|---|
| 0.1 | 2.1 | REACTOME OXYGEN DEPENDENT PROLINE HYDROXYLATION OF HYPOXIA INDUCIBLE FACTOR ALPHA | Genes involved in Oxygen-dependent Proline Hydroxylation of Hypoxia-inducible Factor Alpha |
| 0.0 | 1.0 | REACTOME TANDEM PORE DOMAIN POTASSIUM CHANNELS | Genes involved in Tandem pore domain potassium channels |
| 0.0 | 1.2 | REACTOME SIGNALING BY BMP | Genes involved in Signaling by BMP |
| 0.0 | 1.9 | REACTOME STRIATED MUSCLE CONTRACTION | Genes involved in Striated Muscle Contraction |
| 0.0 | 0.7 | REACTOME ACTIVATION OF RAC | Genes involved in Activation of Rac |
| 0.0 | 1.5 | REACTOME BMAL1 CLOCK NPAS2 ACTIVATES CIRCADIAN EXPRESSION | Genes involved in BMAL1:CLOCK/NPAS2 Activates Circadian Expression |
| 0.0 | 0.6 | REACTOME ACTIVATED POINT MUTANTS OF FGFR2 | Genes involved in Activated point mutants of FGFR2 |
| 0.0 | 0.4 | REACTOME REGULATION OF PYRUVATE DEHYDROGENASE PDH COMPLEX | Genes involved in Regulation of pyruvate dehydrogenase (PDH) complex |
| 0.0 | 0.2 | REACTOME REGULATION OF KIT SIGNALING | Genes involved in Regulation of KIT signaling |
| 0.0 | 0.7 | REACTOME SMOOTH MUSCLE CONTRACTION | Genes involved in Smooth Muscle Contraction |
| 0.0 | 0.3 | REACTOME GRB2 SOS PROVIDES LINKAGE TO MAPK SIGNALING FOR INTERGRINS | Genes involved in GRB2:SOS provides linkage to MAPK signaling for Intergrins |
| 0.0 | 0.2 | REACTOME PECAM1 INTERACTIONS | Genes involved in PECAM1 interactions |
| 0.0 | 0.3 | REACTOME SEMA3A PLEXIN REPULSION SIGNALING BY INHIBITING INTEGRIN ADHESION | Genes involved in SEMA3A-Plexin repulsion signaling by inhibiting Integrin adhesion |
| 0.0 | 0.9 | REACTOME NETRIN1 SIGNALING | Genes involved in Netrin-1 signaling |
| 0.0 | 0.9 | REACTOME GLYCOLYSIS | Genes involved in Glycolysis |
| 0.0 | 0.3 | REACTOME PD1 SIGNALING | Genes involved in PD-1 signaling |
| 0.0 | 0.4 | REACTOME DOWNSTREAM SIGNAL TRANSDUCTION | Genes involved in Downstream signal transduction |
| 0.0 | 0.8 | REACTOME CYTOCHROME P450 ARRANGED BY SUBSTRATE TYPE | Genes involved in Cytochrome P450 - arranged by substrate type |