Project
Illumina Body Map 2 (GSE30611)
Navigation
Downloads
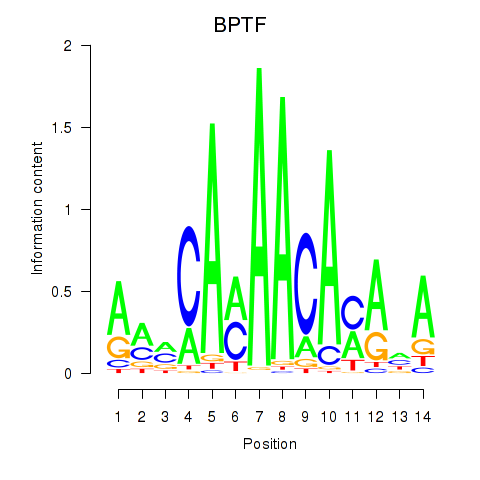
Results for BPTF
Z-value: 1.39
Motif logo
Transcription factors associated with BPTF
| Gene Symbol | Gene ID | Gene Info |
|---|---|---|
|
BPTF
|
ENSG00000171634.18 | bromodomain PHD finger transcription factor |
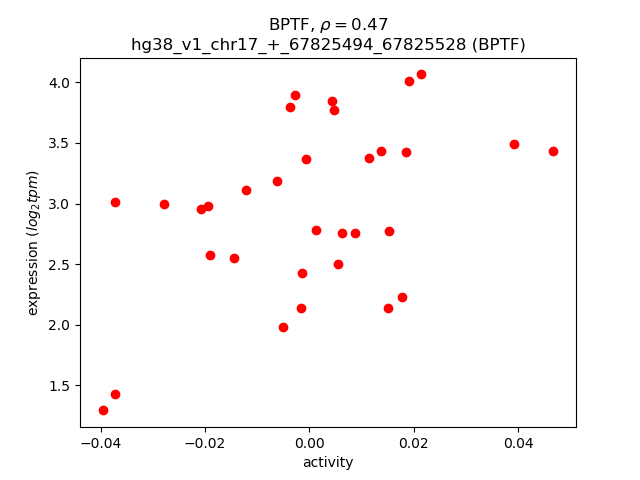
Activity-expression correlation:
| Gene | Promoter | Pearson corr. coef. | P-value | Plot |
|---|---|---|---|---|
| BPTF | hg38_v1_chr17_+_67825494_67825528 | 0.47 | 6.7e-03 | Click! |
Activity profile of BPTF motif
Sorted Z-values of BPTF motif
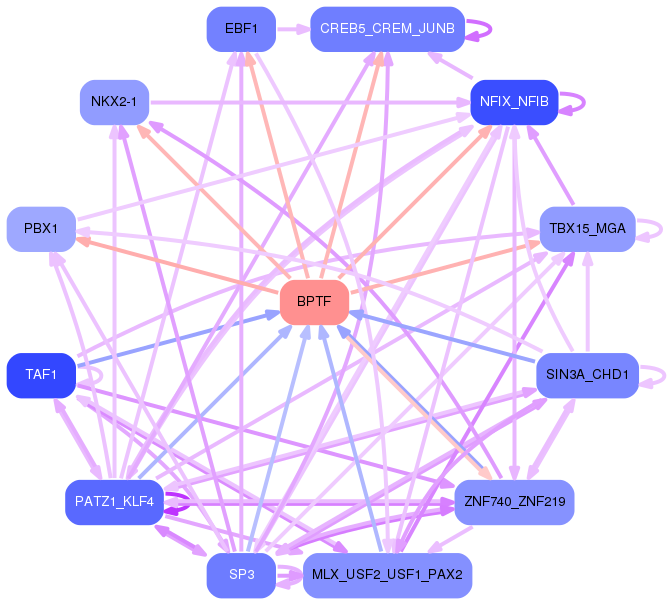
Network of associatons between targets according to the STRING database.

First level regulatory network of BPTF
Gene Ontology Analysis
Gene overrepresentation in biological process category:
| Log-likelihood per target | Total log-likelihood | Term | Description |
|---|---|---|---|
| 1.4 | 7.2 | GO:1901846 | positive regulation of cell communication by electrical coupling involved in cardiac conduction(GO:1901846) |
| 0.8 | 4.0 | GO:1902081 | regulation of calcium ion import into sarcoplasmic reticulum(GO:1902080) negative regulation of calcium ion import into sarcoplasmic reticulum(GO:1902081) |
| 0.5 | 2.5 | GO:0072709 | cellular response to sorbitol(GO:0072709) |
| 0.5 | 1.8 | GO:2000569 | T-helper 2 cell activation(GO:0035712) regulation of T-helper 2 cell activation(GO:2000569) positive regulation of T-helper 2 cell activation(GO:2000570) |
| 0.4 | 1.6 | GO:1901421 | positive regulation of response to alcohol(GO:1901421) |
| 0.4 | 3.5 | GO:0031444 | slow-twitch skeletal muscle fiber contraction(GO:0031444) |
| 0.4 | 4.9 | GO:0098735 | positive regulation of the force of heart contraction(GO:0098735) |
| 0.4 | 1.1 | GO:0036292 | DNA rewinding(GO:0036292) |
| 0.3 | 6.5 | GO:0001778 | plasma membrane repair(GO:0001778) |
| 0.3 | 1.4 | GO:0050992 | dimethylallyl diphosphate biosynthetic process(GO:0050992) dimethylallyl diphosphate metabolic process(GO:0050993) |
| 0.3 | 2.0 | GO:1904383 | response to sodium phosphate(GO:1904383) |
| 0.3 | 1.0 | GO:1904596 | regulation of connective tissue replacement involved in inflammatory response wound healing(GO:1904596) negative regulation of connective tissue replacement involved in inflammatory response wound healing(GO:1904597) regulation of advanced glycation end-product receptor activity(GO:1904603) negative regulation of advanced glycation end-product receptor activity(GO:1904604) negative regulation of connective tissue replacement(GO:1905204) |
| 0.3 | 1.2 | GO:0044145 | multi-organism catabolic process(GO:0044035) development of symbiont involved in interaction with host(GO:0044115) modulation of development of symbiont involved in interaction with host(GO:0044145) negative regulation of development of symbiont involved in interaction with host(GO:0044147) metabolism of substance in other organism involved in symbiotic interaction(GO:0052214) catabolism of substance in other organism involved in symbiotic interaction(GO:0052227) metabolism of macromolecule in other organism involved in symbiotic interaction(GO:0052229) catabolism by host of symbiont macromolecule(GO:0052360) catabolism by organism of macromolecule in other organism involved in symbiotic interaction(GO:0052361) catabolism by host of symbiont protein(GO:0052362) catabolism by organism of protein in other organism involved in symbiotic interaction(GO:0052363) catabolism by host of substance in symbiont(GO:0052364) metabolism by host of symbiont macromolecule(GO:0052416) metabolism by host of symbiont protein(GO:0052417) metabolism by organism of protein in other organism involved in symbiotic interaction(GO:0052418) metabolism by host of substance in symbiont(GO:0052419) |
| 0.3 | 2.8 | GO:0048769 | sarcomerogenesis(GO:0048769) |
| 0.3 | 1.5 | GO:2000691 | regulation of cardiac muscle cell myoblast differentiation(GO:2000690) negative regulation of cardiac muscle cell myoblast differentiation(GO:2000691) |
| 0.3 | 0.9 | GO:0036353 | histone H2A-K119 monoubiquitination(GO:0036353) |
| 0.3 | 9.7 | GO:0006590 | thyroid hormone generation(GO:0006590) |
| 0.3 | 0.9 | GO:0099403 | negative regulation of maintenance of sister chromatid cohesion(GO:0034092) negative regulation of maintenance of mitotic sister chromatid cohesion(GO:0034183) maintenance of mitotic sister chromatid cohesion, telomeric(GO:0099403) mitotic sister chromatid cohesion, telomeric(GO:0099404) regulation of maintenance of mitotic sister chromatid cohesion, telomeric(GO:1904907) negative regulation of maintenance of mitotic sister chromatid cohesion, telomeric(GO:1904908) |
| 0.3 | 1.2 | GO:2000638 | regulation of SREBP signaling pathway(GO:2000638) negative regulation of SREBP signaling pathway(GO:2000639) |
| 0.3 | 0.9 | GO:0045175 | basal protein localization(GO:0045175) |
| 0.3 | 1.6 | GO:2000984 | regulation of ATP citrate synthase activity(GO:2000983) negative regulation of ATP citrate synthase activity(GO:2000984) |
| 0.3 | 4.1 | GO:0071688 | striated muscle myosin thick filament assembly(GO:0071688) |
| 0.3 | 3.0 | GO:0015705 | iodide transport(GO:0015705) |
| 0.2 | 1.2 | GO:0003245 | cardiac muscle tissue growth involved in heart morphogenesis(GO:0003245) |
| 0.2 | 0.9 | GO:0035853 | chromosome passenger complex localization to spindle midzone(GO:0035853) |
| 0.2 | 0.9 | GO:0007499 | ectoderm and mesoderm interaction(GO:0007499) |
| 0.2 | 1.8 | GO:0018197 | peptidyl-aspartic acid modification(GO:0018197) |
| 0.2 | 1.4 | GO:0035803 | egg coat formation(GO:0035803) |
| 0.2 | 0.7 | GO:0042144 | vacuole fusion, non-autophagic(GO:0042144) |
| 0.2 | 1.1 | GO:0002384 | hepatic immune response(GO:0002384) |
| 0.2 | 2.3 | GO:0032264 | IMP salvage(GO:0032264) |
| 0.2 | 0.8 | GO:1904924 | negative regulation of mitophagy in response to mitochondrial depolarization(GO:1904924) |
| 0.2 | 1.2 | GO:1990539 | fructose import(GO:0032445) carbohydrate import into cell(GO:0097319) carbohydrate import across plasma membrane(GO:0098704) fructose import across plasma membrane(GO:1990539) |
| 0.2 | 0.6 | GO:2001037 | tongue muscle cell differentiation(GO:0035981) positive regulation of skeletal muscle fiber differentiation(GO:1902811) regulation of tongue muscle cell differentiation(GO:2001035) positive regulation of tongue muscle cell differentiation(GO:2001037) |
| 0.2 | 0.7 | GO:1905150 | regulation of voltage-gated sodium channel activity(GO:1905150) |
| 0.2 | 1.4 | GO:0061709 | reticulophagy(GO:0061709) |
| 0.2 | 2.2 | GO:2000334 | response to linoleic acid(GO:0070543) blood microparticle formation(GO:0072564) regulation of blood microparticle formation(GO:2000332) positive regulation of blood microparticle formation(GO:2000334) |
| 0.2 | 0.5 | GO:0042245 | RNA repair(GO:0042245) |
| 0.2 | 0.7 | GO:0006556 | S-adenosylmethionine biosynthetic process(GO:0006556) |
| 0.2 | 1.2 | GO:0033133 | positive regulation of glucokinase activity(GO:0033133) |
| 0.2 | 0.7 | GO:0006542 | glutamine biosynthetic process(GO:0006542) |
| 0.2 | 0.6 | GO:0019355 | nicotinamide nucleotide biosynthetic process from aspartate(GO:0019355) 'de novo' NAD biosynthetic process from aspartate(GO:0034628) |
| 0.2 | 1.1 | GO:0044245 | polysaccharide digestion(GO:0044245) |
| 0.2 | 0.6 | GO:0032208 | regulation of telomere maintenance via recombination(GO:0032207) negative regulation of telomere maintenance via recombination(GO:0032208) negative regulation of single strand break repair(GO:1903517) negative regulation of beta-galactosidase activity(GO:1903770) telomere single strand break repair(GO:1903823) negative regulation of telomere single strand break repair(GO:1903824) |
| 0.2 | 0.9 | GO:0044861 | protein transport into plasma membrane raft(GO:0044861) |
| 0.2 | 0.9 | GO:0021691 | cerebellar Purkinje cell layer maturation(GO:0021691) |
| 0.2 | 1.1 | GO:0035616 | histone H2B conserved C-terminal lysine deubiquitination(GO:0035616) |
| 0.1 | 1.3 | GO:0021759 | globus pallidus development(GO:0021759) |
| 0.1 | 0.6 | GO:1903487 | regulation of lactation(GO:1903487) |
| 0.1 | 0.9 | GO:0071630 | nucleus-associated proteasomal ubiquitin-dependent protein catabolic process(GO:0071630) |
| 0.1 | 1.8 | GO:1903943 | regulation of hepatocyte apoptotic process(GO:1903943) negative regulation of hepatocyte apoptotic process(GO:1903944) |
| 0.1 | 0.4 | GO:1904719 | excitatory chemical synaptic transmission(GO:0098976) regulation of AMPA glutamate receptor clustering(GO:1904717) positive regulation of AMPA glutamate receptor clustering(GO:1904719) |
| 0.1 | 0.8 | GO:0009051 | pentose-phosphate shunt, oxidative branch(GO:0009051) |
| 0.1 | 0.6 | GO:2000435 | regulation of protein neddylation(GO:2000434) negative regulation of protein neddylation(GO:2000435) |
| 0.1 | 0.4 | GO:0002728 | negative regulation of natural killer cell cytokine production(GO:0002728) |
| 0.1 | 1.0 | GO:0001920 | negative regulation of receptor recycling(GO:0001920) |
| 0.1 | 0.5 | GO:1903173 | phytol metabolic process(GO:0033306) fatty alcohol metabolic process(GO:1903173) |
| 0.1 | 1.2 | GO:1900169 | regulation of glucocorticoid mediated signaling pathway(GO:1900169) |
| 0.1 | 0.8 | GO:0023016 | signal transduction by trans-phosphorylation(GO:0023016) |
| 0.1 | 0.4 | GO:1902824 | positive regulation of late endosome to lysosome transport(GO:1902824) |
| 0.1 | 0.9 | GO:0031161 | phosphatidylinositol catabolic process(GO:0031161) |
| 0.1 | 0.5 | GO:0090149 | mitochondrial membrane fission(GO:0090149) |
| 0.1 | 0.3 | GO:1904430 | negative regulation of t-circle formation(GO:1904430) |
| 0.1 | 0.4 | GO:0046521 | sphingoid catabolic process(GO:0046521) |
| 0.1 | 1.3 | GO:0060316 | positive regulation of ryanodine-sensitive calcium-release channel activity(GO:0060316) |
| 0.1 | 0.1 | GO:0070889 | platelet alpha granule organization(GO:0070889) |
| 0.1 | 2.4 | GO:1903286 | regulation of potassium ion import(GO:1903286) |
| 0.1 | 0.4 | GO:0061027 | umbilical cord morphogenesis(GO:0036304) umbilical cord development(GO:0061027) |
| 0.1 | 0.2 | GO:0048633 | positive regulation of skeletal muscle tissue growth(GO:0048633) |
| 0.1 | 0.2 | GO:0070904 | L-ascorbic acid transport(GO:0015882) transepithelial L-ascorbic acid transport(GO:0070904) |
| 0.1 | 0.4 | GO:0034130 | toll-like receptor 1 signaling pathway(GO:0034130) |
| 0.1 | 0.4 | GO:0070898 | RNA polymerase III transcriptional preinitiation complex assembly(GO:0070898) |
| 0.1 | 0.5 | GO:0070213 | protein auto-ADP-ribosylation(GO:0070213) |
| 0.1 | 0.5 | GO:0016119 | carotene metabolic process(GO:0016119) |
| 0.1 | 2.7 | GO:0014870 | response to muscle inactivity(GO:0014870) |
| 0.1 | 1.5 | GO:0055118 | negative regulation of cardiac muscle contraction(GO:0055118) |
| 0.1 | 0.4 | GO:0061182 | negative regulation of chondrocyte development(GO:0061182) |
| 0.1 | 0.4 | GO:0019417 | sulfur oxidation(GO:0019417) |
| 0.1 | 1.6 | GO:0035457 | cellular response to interferon-alpha(GO:0035457) |
| 0.1 | 0.2 | GO:0032258 | CVT pathway(GO:0032258) |
| 0.1 | 0.5 | GO:0010652 | regulation of cell communication by chemical coupling(GO:0010645) positive regulation of cell communication by chemical coupling(GO:0010652) |
| 0.1 | 0.3 | GO:0046586 | regulation of calcium-dependent cell-cell adhesion(GO:0046586) |
| 0.1 | 0.7 | GO:0001757 | somite specification(GO:0001757) |
| 0.1 | 0.8 | GO:0040030 | regulation of molecular function, epigenetic(GO:0040030) |
| 0.1 | 0.3 | GO:0097252 | oligodendrocyte apoptotic process(GO:0097252) |
| 0.1 | 0.7 | GO:0010387 | COP9 signalosome assembly(GO:0010387) |
| 0.1 | 0.7 | GO:0006127 | glycerophosphate shuttle(GO:0006127) |
| 0.1 | 0.9 | GO:0010025 | wax biosynthetic process(GO:0010025) wax metabolic process(GO:0010166) |
| 0.1 | 1.1 | GO:0035405 | histone-threonine phosphorylation(GO:0035405) |
| 0.1 | 0.3 | GO:0003365 | establishment of cell polarity involved in ameboidal cell migration(GO:0003365) |
| 0.1 | 1.2 | GO:0003172 | primary heart field specification(GO:0003138) sinoatrial valve development(GO:0003172) sinoatrial valve morphogenesis(GO:0003185) |
| 0.1 | 0.9 | GO:0048254 | snoRNA localization(GO:0048254) |
| 0.1 | 0.9 | GO:0030242 | pexophagy(GO:0030242) |
| 0.1 | 0.1 | GO:0043006 | activation of phospholipase A2 activity by calcium-mediated signaling(GO:0043006) |
| 0.1 | 0.5 | GO:0007206 | phospholipase C-activating G-protein coupled glutamate receptor signaling pathway(GO:0007206) |
| 0.1 | 0.8 | GO:0090230 | regulation of centromere complex assembly(GO:0090230) |
| 0.1 | 0.5 | GO:1904491 | protein localization to ciliary transition zone(GO:1904491) |
| 0.1 | 0.6 | GO:0086048 | membrane depolarization during bundle of His cell action potential(GO:0086048) |
| 0.1 | 1.5 | GO:1900623 | regulation of monocyte aggregation(GO:1900623) positive regulation of monocyte aggregation(GO:1900625) |
| 0.1 | 0.7 | GO:0002318 | myeloid progenitor cell differentiation(GO:0002318) |
| 0.1 | 0.3 | GO:0050717 | positive regulation of interleukin-1 alpha secretion(GO:0050717) |
| 0.1 | 1.7 | GO:1901898 | negative regulation of relaxation of cardiac muscle(GO:1901898) |
| 0.1 | 0.5 | GO:0044858 | plasma membrane raft distribution(GO:0044855) plasma membrane raft localization(GO:0044856) plasma membrane raft polarization(GO:0044858) renal protein absorption(GO:0097017) regulation of plasma membrane raft polarization(GO:1903906) |
| 0.1 | 0.3 | GO:1904211 | membrane protein proteolysis involved in retrograde protein transport, ER to cytosol(GO:1904211) |
| 0.1 | 0.5 | GO:0038155 | interleukin-23-mediated signaling pathway(GO:0038155) |
| 0.1 | 0.7 | GO:0090669 | telomerase RNA stabilization(GO:0090669) |
| 0.1 | 0.6 | GO:0038112 | interleukin-8-mediated signaling pathway(GO:0038112) |
| 0.1 | 0.3 | GO:2000506 | negative regulation of energy homeostasis(GO:2000506) |
| 0.1 | 0.4 | GO:0061534 | gamma-aminobutyric acid secretion, neurotransmission(GO:0061534) |
| 0.1 | 0.3 | GO:1905006 | negative regulation of epithelial to mesenchymal transition involved in endocardial cushion formation(GO:1905006) |
| 0.1 | 0.4 | GO:1904172 | septin ring assembly(GO:0000921) septin ring organization(GO:0031106) regulation of bleb assembly(GO:1904170) positive regulation of bleb assembly(GO:1904172) |
| 0.1 | 0.6 | GO:1904304 | regulation of gastro-intestinal system smooth muscle contraction(GO:1904304) positive regulation of gastro-intestinal system smooth muscle contraction(GO:1904306) |
| 0.1 | 0.4 | GO:0071442 | positive regulation of histone H3-K14 acetylation(GO:0071442) |
| 0.1 | 0.6 | GO:0002370 | natural killer cell cytokine production(GO:0002370) regulation of natural killer cell cytokine production(GO:0002727) positive regulation of natural killer cell cytokine production(GO:0002729) |
| 0.1 | 0.3 | GO:0010933 | macrophage tolerance induction(GO:0010931) regulation of macrophage tolerance induction(GO:0010932) positive regulation of macrophage tolerance induction(GO:0010933) |
| 0.1 | 0.4 | GO:1902617 | response to fluoride(GO:1902617) |
| 0.1 | 0.7 | GO:0045653 | negative regulation of megakaryocyte differentiation(GO:0045653) |
| 0.1 | 0.5 | GO:0070837 | dehydroascorbic acid transport(GO:0070837) |
| 0.1 | 0.2 | GO:0036146 | cellular response to mycotoxin(GO:0036146) |
| 0.1 | 0.3 | GO:0002528 | regulation of vascular permeability involved in acute inflammatory response(GO:0002528) |
| 0.1 | 1.0 | GO:0000389 | mRNA 3'-splice site recognition(GO:0000389) |
| 0.1 | 0.3 | GO:2000157 | regulation of protein K48-linked deubiquitination(GO:1903093) negative regulation of protein K48-linked deubiquitination(GO:1903094) negative regulation of ubiquitin-specific protease activity(GO:2000157) |
| 0.1 | 0.4 | GO:0044691 | tooth eruption(GO:0044691) |
| 0.1 | 0.6 | GO:0090038 | negative regulation of protein kinase C signaling(GO:0090038) |
| 0.1 | 0.6 | GO:0034441 | plasma lipoprotein particle oxidation(GO:0034441) |
| 0.1 | 1.2 | GO:0015820 | leucine transport(GO:0015820) |
| 0.1 | 0.3 | GO:0044417 | translocation of peptides or proteins into host(GO:0042000) translocation of peptides or proteins into host cell cytoplasm(GO:0044053) translocation of molecules into host(GO:0044417) translocation of peptides or proteins into other organism involved in symbiotic interaction(GO:0051808) translocation of molecules into other organism involved in symbiotic interaction(GO:0051836) |
| 0.1 | 0.4 | GO:0034148 | regulation of toll-like receptor 5 signaling pathway(GO:0034147) negative regulation of toll-like receptor 5 signaling pathway(GO:0034148) negative regulation of nucleotide-binding oligomerization domain containing 1 signaling pathway(GO:0070429) |
| 0.1 | 0.6 | GO:0071477 | hypotonic salinity response(GO:0042539) cellular hypotonic salinity response(GO:0071477) |
| 0.1 | 0.1 | GO:0002428 | antigen processing and presentation of peptide antigen via MHC class Ib(GO:0002428) |
| 0.1 | 0.3 | GO:0006391 | transcription initiation from mitochondrial promoter(GO:0006391) |
| 0.1 | 0.3 | GO:1901388 | regulation of transforming growth factor beta activation(GO:1901388) negative regulation of transforming growth factor beta activation(GO:1901389) |
| 0.1 | 0.5 | GO:2000563 | positive regulation of CD4-positive, alpha-beta T cell proliferation(GO:2000563) |
| 0.1 | 0.5 | GO:1904207 | regulation of chemokine (C-C motif) ligand 2 secretion(GO:1904207) positive regulation of chemokine (C-C motif) ligand 2 secretion(GO:1904209) |
| 0.1 | 1.2 | GO:0071316 | cellular response to nicotine(GO:0071316) |
| 0.1 | 1.1 | GO:0034058 | endosomal vesicle fusion(GO:0034058) |
| 0.1 | 0.2 | GO:1903516 | regulation of single strand break repair(GO:1903516) |
| 0.1 | 0.9 | GO:0055048 | regulation of spindle elongation(GO:0032887) regulation of mitotic spindle elongation(GO:0032888) anastral spindle assembly(GO:0055048) protein localization to spindle pole body(GO:0071988) regulation of protein localization to spindle pole body(GO:1902363) positive regulation of protein localization to spindle pole body(GO:1902365) positive regulation of mitotic spindle elongation(GO:1902846) |
| 0.1 | 0.9 | GO:1901844 | regulation of cell communication by electrical coupling involved in cardiac conduction(GO:1901844) |
| 0.1 | 0.9 | GO:1905068 | arterial endothelial cell fate commitment(GO:0060844) positive regulation of ephrin receptor signaling pathway(GO:1901189) positive regulation of canonical Wnt signaling pathway involved in cardiac muscle cell fate commitment(GO:1901297) positive regulation of canonical Wnt signaling pathway involved in heart development(GO:1905068) |
| 0.1 | 0.7 | GO:0090309 | positive regulation of methylation-dependent chromatin silencing(GO:0090309) |
| 0.1 | 4.0 | GO:0006376 | mRNA splice site selection(GO:0006376) |
| 0.1 | 0.5 | GO:0071475 | cellular hyperosmotic salinity response(GO:0071475) |
| 0.1 | 0.9 | GO:2000324 | positive regulation of glucocorticoid receptor signaling pathway(GO:2000324) |
| 0.1 | 0.7 | GO:2000490 | negative regulation of hepatic stellate cell activation(GO:2000490) |
| 0.1 | 0.8 | GO:0050882 | voluntary musculoskeletal movement(GO:0050882) |
| 0.1 | 0.3 | GO:0009224 | CMP salvage(GO:0006238) CMP biosynthetic process(GO:0009224) CMP metabolic process(GO:0046035) |
| 0.1 | 0.3 | GO:1903182 | regulation of SUMO transferase activity(GO:1903182) positive regulation of SUMO transferase activity(GO:1903755) |
| 0.1 | 0.3 | GO:0070650 | endoplasmic reticulum polarization(GO:0061163) actin filament bundle retrograde transport(GO:0061573) actin filament bundle distribution(GO:0070650) |
| 0.1 | 1.7 | GO:0045835 | negative regulation of meiotic nuclear division(GO:0045835) |
| 0.1 | 0.2 | GO:0007231 | osmosensory signaling pathway(GO:0007231) |
| 0.1 | 0.5 | GO:0033029 | regulation of neutrophil apoptotic process(GO:0033029) |
| 0.1 | 0.6 | GO:0072011 | glomerular endothelium development(GO:0072011) |
| 0.1 | 0.2 | GO:1990654 | sebum secreting cell proliferation(GO:1990654) |
| 0.1 | 0.3 | GO:0098957 | anterograde axonal transport of mitochondrion(GO:0098957) |
| 0.1 | 0.3 | GO:0061763 | multivesicular body-lysosome fusion(GO:0061763) |
| 0.1 | 0.3 | GO:2000254 | regulation of male germ cell proliferation(GO:2000254) |
| 0.1 | 1.6 | GO:0007021 | tubulin complex assembly(GO:0007021) |
| 0.1 | 0.5 | GO:0051621 | negative regulation of dopamine uptake involved in synaptic transmission(GO:0051585) norepinephrine uptake(GO:0051620) regulation of norepinephrine uptake(GO:0051621) negative regulation of norepinephrine uptake(GO:0051622) negative regulation of catecholamine uptake involved in synaptic transmission(GO:0051945) regulation of glutathione peroxidase activity(GO:1903282) positive regulation of glutathione peroxidase activity(GO:1903284) positive regulation of hydrogen peroxide catabolic process(GO:1903285) positive regulation of peroxidase activity(GO:2000470) |
| 0.1 | 0.4 | GO:0043553 | negative regulation of phosphatidylinositol 3-kinase activity(GO:0043553) |
| 0.1 | 0.4 | GO:0060474 | positive regulation of sperm motility involved in capacitation(GO:0060474) |
| 0.1 | 0.2 | GO:1904562 | phosphatidylinositol 5-phosphate metabolic process(GO:1904562) |
| 0.1 | 0.5 | GO:1904796 | regulation of core promoter binding(GO:1904796) |
| 0.1 | 0.2 | GO:0007518 | myoblast fate determination(GO:0007518) |
| 0.1 | 1.3 | GO:0044341 | sodium-dependent phosphate transport(GO:0044341) |
| 0.1 | 0.4 | GO:0030961 | peptidyl-arginine hydroxylation(GO:0030961) |
| 0.1 | 0.4 | GO:2001013 | epithelial cell proliferation involved in renal tubule morphogenesis(GO:2001013) |
| 0.1 | 0.3 | GO:0006447 | regulation of translational initiation by iron(GO:0006447) |
| 0.1 | 0.3 | GO:1990168 | protein K27-linked deubiquitination(GO:1990167) protein K33-linked deubiquitination(GO:1990168) |
| 0.1 | 1.4 | GO:0006610 | ribosomal protein import into nucleus(GO:0006610) |
| 0.1 | 0.5 | GO:0046684 | response to pyrethroid(GO:0046684) |
| 0.1 | 1.4 | GO:0090091 | positive regulation of extracellular matrix disassembly(GO:0090091) |
| 0.1 | 0.8 | GO:0071963 | establishment or maintenance of cell polarity regulating cell shape(GO:0071963) |
| 0.1 | 0.5 | GO:0051684 | maintenance of Golgi location(GO:0051684) |
| 0.1 | 0.3 | GO:0022018 | subpallium cell proliferation in forebrain(GO:0022012) lateral ganglionic eminence cell proliferation(GO:0022018) lambdoid suture morphogenesis(GO:0060366) sagittal suture morphogenesis(GO:0060367) anterior semicircular canal development(GO:0060873) lateral semicircular canal development(GO:0060875) |
| 0.1 | 0.9 | GO:0061179 | negative regulation of insulin secretion involved in cellular response to glucose stimulus(GO:0061179) |
| 0.1 | 0.5 | GO:0051012 | microtubule sliding(GO:0051012) |
| 0.1 | 0.8 | GO:0010606 | positive regulation of cytoplasmic mRNA processing body assembly(GO:0010606) |
| 0.1 | 0.3 | GO:0097535 | lymphoid lineage cell migration(GO:0097534) lymphoid lineage cell migration into thymus(GO:0097535) |
| 0.1 | 0.5 | GO:0051389 | inactivation of MAPKK activity(GO:0051389) |
| 0.1 | 0.7 | GO:2000344 | positive regulation of acrosome reaction(GO:2000344) |
| 0.1 | 1.6 | GO:0015671 | oxygen transport(GO:0015671) |
| 0.1 | 0.1 | GO:0040009 | regulation of growth rate(GO:0040009) |
| 0.1 | 0.1 | GO:1904204 | regulation of skeletal muscle hypertrophy(GO:1904204) |
| 0.1 | 0.5 | GO:0042791 | 5S class rRNA transcription from RNA polymerase III type 1 promoter(GO:0042791) tRNA transcription from RNA polymerase III promoter(GO:0042797) |
| 0.1 | 0.3 | GO:1903593 | regulation of histamine secretion by mast cell(GO:1903593) |
| 0.1 | 0.1 | GO:1901979 | regulation of inward rectifier potassium channel activity(GO:1901979) |
| 0.1 | 0.2 | GO:1904226 | regulation of UDP-glucose catabolic process(GO:0010904) negative regulation of UDP-glucose catabolic process(GO:0010905) regulation of glycogen synthase activity, transferring glucose-1-phosphate(GO:1904226) negative regulation of glycogen synthase activity, transferring glucose-1-phosphate(GO:1904227) |
| 0.1 | 0.7 | GO:0031022 | nuclear migration along microfilament(GO:0031022) |
| 0.1 | 0.4 | GO:0043353 | enucleate erythrocyte differentiation(GO:0043353) |
| 0.1 | 0.5 | GO:0043402 | glucocorticoid mediated signaling pathway(GO:0043402) |
| 0.1 | 0.4 | GO:0036493 | positive regulation of translation in response to endoplasmic reticulum stress(GO:0036493) |
| 0.1 | 0.2 | GO:0002752 | cell surface pattern recognition receptor signaling pathway(GO:0002752) |
| 0.1 | 0.3 | GO:0002337 | B-1a B cell differentiation(GO:0002337) |
| 0.1 | 0.3 | GO:0007571 | age-dependent response to oxidative stress(GO:0001306) age-dependent response to reactive oxygen species(GO:0001315) regulation of systemic arterial blood pressure by acetylcholine(GO:0003068) vasodilation by acetylcholine involved in regulation of systemic arterial blood pressure(GO:0003069) regulation of systemic arterial blood pressure by neurotransmitter(GO:0003070) age-dependent general metabolic decline(GO:0007571) |
| 0.1 | 0.4 | GO:0006269 | DNA replication, synthesis of RNA primer(GO:0006269) |
| 0.1 | 0.4 | GO:0071896 | protein localization to adherens junction(GO:0071896) |
| 0.1 | 0.2 | GO:0046452 | dihydrofolate metabolic process(GO:0046452) |
| 0.1 | 0.5 | GO:0061767 | negative regulation of lung blood pressure(GO:0061767) |
| 0.1 | 0.2 | GO:0000412 | histone peptidyl-prolyl isomerization(GO:0000412) |
| 0.1 | 0.9 | GO:0006268 | DNA unwinding involved in DNA replication(GO:0006268) |
| 0.1 | 0.4 | GO:0098838 | reduced folate transmembrane transport(GO:0098838) |
| 0.1 | 0.2 | GO:0036215 | response to stem cell factor(GO:0036215) cellular response to stem cell factor stimulus(GO:0036216) Kit signaling pathway(GO:0038109) |
| 0.1 | 0.2 | GO:0034729 | histone H3-K79 methylation(GO:0034729) |
| 0.1 | 0.4 | GO:0043103 | adenosine catabolic process(GO:0006154) hypoxanthine salvage(GO:0043103) inosine biosynthetic process(GO:0046103) |
| 0.1 | 2.0 | GO:0043968 | histone H2A acetylation(GO:0043968) |
| 0.1 | 0.3 | GO:0061026 | cardiac muscle tissue regeneration(GO:0061026) |
| 0.1 | 0.7 | GO:0006537 | glutamate biosynthetic process(GO:0006537) |
| 0.1 | 0.7 | GO:0035095 | behavioral response to nicotine(GO:0035095) |
| 0.1 | 0.4 | GO:0090070 | positive regulation of ribosome biogenesis(GO:0090070) positive regulation of rRNA processing(GO:2000234) |
| 0.1 | 1.7 | GO:0030208 | dermatan sulfate biosynthetic process(GO:0030208) |
| 0.1 | 0.2 | GO:0000349 | generation of catalytic spliceosome for first transesterification step(GO:0000349) |
| 0.1 | 0.5 | GO:0060160 | negative regulation of dopamine receptor signaling pathway(GO:0060160) |
| 0.1 | 0.3 | GO:1904550 | chemotaxis to arachidonic acid(GO:0034670) response to arachidonic acid(GO:1904550) |
| 0.1 | 0.2 | GO:0021913 | regulation of transcription from RNA polymerase II promoter involved in ventral spinal cord interneuron specification(GO:0021913) type B pancreatic cell maturation(GO:0072560) positive regulation of type B pancreatic cell development(GO:2000078) |
| 0.1 | 0.4 | GO:0038195 | urokinase plasminogen activator signaling pathway(GO:0038195) |
| 0.1 | 0.3 | GO:0035983 | response to trichostatin A(GO:0035983) cellular response to trichostatin A(GO:0035984) |
| 0.1 | 0.2 | GO:0043366 | beta selection(GO:0043366) |
| 0.1 | 1.1 | GO:1990403 | embryonic brain development(GO:1990403) |
| 0.1 | 0.6 | GO:0002480 | antigen processing and presentation of exogenous peptide antigen via MHC class I, TAP-independent(GO:0002480) |
| 0.1 | 0.7 | GO:1905146 | lysosomal protein catabolic process(GO:1905146) |
| 0.1 | 0.4 | GO:1902966 | regulation of protein localization to early endosome(GO:1902965) positive regulation of protein localization to early endosome(GO:1902966) |
| 0.1 | 0.3 | GO:0072369 | regulation of lipid transport by positive regulation of transcription from RNA polymerase II promoter(GO:0072369) |
| 0.1 | 0.1 | GO:0061428 | negative regulation of transcription from RNA polymerase II promoter in response to hypoxia(GO:0061428) |
| 0.1 | 0.9 | GO:0060159 | regulation of dopamine receptor signaling pathway(GO:0060159) |
| 0.1 | 0.9 | GO:0060742 | epithelial cell differentiation involved in prostate gland development(GO:0060742) |
| 0.1 | 1.2 | GO:0043306 | positive regulation of mast cell activation involved in immune response(GO:0033008) positive regulation of mast cell degranulation(GO:0043306) |
| 0.1 | 0.3 | GO:0010936 | negative regulation of macrophage cytokine production(GO:0010936) |
| 0.1 | 0.3 | GO:0072553 | terminal button organization(GO:0072553) |
| 0.1 | 0.5 | GO:1901314 | negative regulation of histone ubiquitination(GO:0033183) negative regulation of protein K63-linked ubiquitination(GO:1900045) regulation of histone H2A K63-linked ubiquitination(GO:1901314) negative regulation of histone H2A K63-linked ubiquitination(GO:1901315) negative regulation of protein polyubiquitination(GO:1902915) |
| 0.1 | 0.2 | GO:2000793 | gonad morphogenesis(GO:0035262) cell proliferation involved in heart valve development(GO:2000793) |
| 0.1 | 0.6 | GO:0048386 | positive regulation of retinoic acid receptor signaling pathway(GO:0048386) |
| 0.1 | 0.3 | GO:0098746 | fast, calcium ion-dependent exocytosis of neurotransmitter(GO:0098746) |
| 0.1 | 0.3 | GO:2000426 | negative regulation of apoptotic cell clearance(GO:2000426) |
| 0.1 | 0.3 | GO:0002669 | positive regulation of T cell anergy(GO:0002669) positive regulation of lymphocyte anergy(GO:0002913) |
| 0.1 | 1.3 | GO:0016075 | rRNA catabolic process(GO:0016075) |
| 0.1 | 0.2 | GO:0032289 | central nervous system myelin formation(GO:0032289) |
| 0.1 | 0.9 | GO:0072619 | interleukin-21 production(GO:0032625) interleukin-21 secretion(GO:0072619) |
| 0.1 | 0.4 | GO:2001168 | regulation of histone H2B ubiquitination(GO:2001166) positive regulation of histone H2B ubiquitination(GO:2001168) |
| 0.1 | 1.0 | GO:2001214 | positive regulation of vasculogenesis(GO:2001214) |
| 0.0 | 0.5 | GO:1901341 | activation of store-operated calcium channel activity(GO:0032237) positive regulation of store-operated calcium channel activity(GO:1901341) |
| 0.0 | 0.1 | GO:0006043 | glucosamine catabolic process(GO:0006043) |
| 0.0 | 1.8 | GO:0007095 | mitotic G2 DNA damage checkpoint(GO:0007095) |
| 0.0 | 0.3 | GO:1900165 | negative regulation of interleukin-6 secretion(GO:1900165) |
| 0.0 | 2.7 | GO:0007274 | neuromuscular synaptic transmission(GO:0007274) |
| 0.0 | 0.1 | GO:0002876 | positive regulation of chronic inflammatory response to antigenic stimulus(GO:0002876) |
| 0.0 | 0.3 | GO:0002679 | respiratory burst involved in defense response(GO:0002679) |
| 0.0 | 0.1 | GO:0000964 | mitochondrial RNA 5'-end processing(GO:0000964) |
| 0.0 | 0.5 | GO:1901731 | positive regulation of platelet aggregation(GO:1901731) |
| 0.0 | 0.5 | GO:0051182 | coenzyme transport(GO:0051182) |
| 0.0 | 0.4 | GO:0001672 | regulation of chromatin assembly or disassembly(GO:0001672) |
| 0.0 | 0.6 | GO:1902857 | positive regulation of nonmotile primary cilium assembly(GO:1902857) |
| 0.0 | 0.3 | GO:2001271 | negative regulation of cysteine-type endopeptidase activity involved in execution phase of apoptosis(GO:2001271) |
| 0.0 | 0.2 | GO:0071596 | ubiquitin-dependent protein catabolic process via the N-end rule pathway(GO:0071596) |
| 0.0 | 1.1 | GO:0016254 | preassembly of GPI anchor in ER membrane(GO:0016254) |
| 0.0 | 0.9 | GO:0051256 | mitotic spindle midzone assembly(GO:0051256) |
| 0.0 | 0.7 | GO:0006685 | sphingomyelin catabolic process(GO:0006685) |
| 0.0 | 0.8 | GO:0046784 | viral mRNA export from host cell nucleus(GO:0046784) |
| 0.0 | 0.9 | GO:0007158 | neuron cell-cell adhesion(GO:0007158) |
| 0.0 | 0.5 | GO:0006682 | galactosylceramide biosynthetic process(GO:0006682) galactolipid biosynthetic process(GO:0019375) |
| 0.0 | 0.4 | GO:0071109 | superior temporal gyrus development(GO:0071109) |
| 0.0 | 0.3 | GO:0034351 | regulation of glial cell apoptotic process(GO:0034350) negative regulation of glial cell apoptotic process(GO:0034351) |
| 0.0 | 0.8 | GO:0001833 | inner cell mass cell proliferation(GO:0001833) |
| 0.0 | 0.3 | GO:0090625 | mRNA cleavage involved in gene silencing by siRNA(GO:0090625) |
| 0.0 | 0.1 | GO:0003218 | cardiac left ventricle formation(GO:0003218) |
| 0.0 | 0.1 | GO:0071264 | regulation of eIF2 alpha phosphorylation by amino acid starvation(GO:0060733) regulation of translational initiation in response to starvation(GO:0071262) positive regulation of translational initiation in response to starvation(GO:0071264) |
| 0.0 | 1.6 | GO:0006833 | water transport(GO:0006833) |
| 0.0 | 0.6 | GO:0099515 | vesicle transport along actin filament(GO:0030050) actin filament-based transport(GO:0099515) |
| 0.0 | 0.1 | GO:0043973 | histone H3-K4 acetylation(GO:0043973) |
| 0.0 | 0.1 | GO:0000710 | meiotic mismatch repair(GO:0000710) |
| 0.0 | 0.3 | GO:2001034 | positive regulation of double-strand break repair via nonhomologous end joining(GO:2001034) |
| 0.0 | 0.6 | GO:2000620 | positive regulation of histone H4-K16 acetylation(GO:2000620) |
| 0.0 | 0.5 | GO:0018094 | protein polyglycylation(GO:0018094) |
| 0.0 | 1.0 | GO:0071294 | cellular response to zinc ion(GO:0071294) |
| 0.0 | 0.2 | GO:0032487 | regulation of Rap protein signal transduction(GO:0032487) |
| 0.0 | 0.1 | GO:0002581 | negative regulation of antigen processing and presentation of peptide or polysaccharide antigen via MHC class II(GO:0002581) |
| 0.0 | 0.9 | GO:0001542 | ovulation from ovarian follicle(GO:0001542) |
| 0.0 | 0.3 | GO:0071802 | negative regulation of podosome assembly(GO:0071802) |
| 0.0 | 0.2 | GO:1902045 | negative regulation of Fas signaling pathway(GO:1902045) |
| 0.0 | 0.2 | GO:0035063 | nuclear speck organization(GO:0035063) |
| 0.0 | 0.1 | GO:0045897 | positive regulation of transcription during mitosis(GO:0045897) |
| 0.0 | 0.2 | GO:0007023 | post-chaperonin tubulin folding pathway(GO:0007023) |
| 0.0 | 0.5 | GO:2000773 | negative regulation of cellular senescence(GO:2000773) |
| 0.0 | 0.3 | GO:0035990 | tendon cell differentiation(GO:0035990) tendon formation(GO:0035992) |
| 0.0 | 3.9 | GO:0042059 | negative regulation of epidermal growth factor receptor signaling pathway(GO:0042059) |
| 0.0 | 2.1 | GO:0006370 | 7-methylguanosine mRNA capping(GO:0006370) |
| 0.0 | 0.1 | GO:0033140 | negative regulation of peptidyl-serine phosphorylation of STAT protein(GO:0033140) |
| 0.0 | 0.3 | GO:0050916 | sensory perception of sweet taste(GO:0050916) |
| 0.0 | 0.2 | GO:0070269 | pyroptosis(GO:0070269) |
| 0.0 | 0.6 | GO:0035563 | positive regulation of chromatin binding(GO:0035563) |
| 0.0 | 1.2 | GO:0006294 | nucleotide-excision repair, preincision complex assembly(GO:0006294) |
| 0.0 | 0.4 | GO:2001137 | positive regulation of endocytic recycling(GO:2001137) |
| 0.0 | 0.2 | GO:0001880 | Mullerian duct regression(GO:0001880) |
| 0.0 | 0.5 | GO:0090160 | Golgi to lysosome transport(GO:0090160) |
| 0.0 | 0.8 | GO:0034587 | piRNA metabolic process(GO:0034587) |
| 0.0 | 3.3 | GO:0055008 | cardiac muscle tissue morphogenesis(GO:0055008) |
| 0.0 | 0.4 | GO:0071816 | tail-anchored membrane protein insertion into ER membrane(GO:0071816) |
| 0.0 | 0.4 | GO:0009756 | carbohydrate mediated signaling(GO:0009756) |
| 0.0 | 0.2 | GO:0015692 | lead ion transport(GO:0015692) |
| 0.0 | 0.3 | GO:0000066 | mitochondrial ornithine transport(GO:0000066) |
| 0.0 | 0.2 | GO:0006051 | mannosamine metabolic process(GO:0006050) N-acetylmannosamine metabolic process(GO:0006051) |
| 0.0 | 0.2 | GO:1901529 | positive regulation of anion channel activity(GO:1901529) |
| 0.0 | 0.1 | GO:0048478 | replication fork protection(GO:0048478) |
| 0.0 | 0.4 | GO:2001106 | regulation of Rho guanyl-nucleotide exchange factor activity(GO:2001106) |
| 0.0 | 0.3 | GO:0018032 | protein amidation(GO:0018032) |
| 0.0 | 0.1 | GO:0001806 | type IV hypersensitivity(GO:0001806) regulation of type IV hypersensitivity(GO:0001807) |
| 0.0 | 0.1 | GO:0002678 | positive regulation of chronic inflammatory response(GO:0002678) |
| 0.0 | 0.2 | GO:0090521 | glomerular visceral epithelial cell migration(GO:0090521) |
| 0.0 | 0.2 | GO:0034184 | positive regulation of maintenance of sister chromatid cohesion(GO:0034093) positive regulation of maintenance of mitotic sister chromatid cohesion(GO:0034184) |
| 0.0 | 0.1 | GO:1903061 | establishment of protein localization to endoplasmic reticulum membrane(GO:0097051) positive regulation of protein lipidation(GO:1903061) |
| 0.0 | 0.1 | GO:0060672 | epithelial cell differentiation involved in embryonic placenta development(GO:0060671) epithelial cell morphogenesis involved in placental branching(GO:0060672) |
| 0.0 | 0.1 | GO:0006667 | sphinganine metabolic process(GO:0006667) |
| 0.0 | 0.1 | GO:1902626 | assembly of large subunit precursor of preribosome(GO:1902626) |
| 0.0 | 0.3 | GO:2000229 | cellular response to vitamin E(GO:0071306) pancreatic stellate cell proliferation(GO:0072343) regulation of pancreatic stellate cell proliferation(GO:2000229) negative regulation of pancreatic stellate cell proliferation(GO:2000230) |
| 0.0 | 1.4 | GO:0030220 | platelet formation(GO:0030220) |
| 0.0 | 0.3 | GO:0002457 | T cell antigen processing and presentation(GO:0002457) |
| 0.0 | 0.3 | GO:0046078 | dUMP metabolic process(GO:0046078) |
| 0.0 | 0.2 | GO:0006049 | UDP-N-acetylglucosamine catabolic process(GO:0006049) |
| 0.0 | 0.5 | GO:0070934 | CRD-mediated mRNA stabilization(GO:0070934) |
| 0.0 | 0.2 | GO:0010836 | negative regulation of protein ADP-ribosylation(GO:0010836) |
| 0.0 | 0.1 | GO:0010040 | response to iron(II) ion(GO:0010040) |
| 0.0 | 0.1 | GO:1903565 | negative regulation of protein localization to cilium(GO:1903565) regulation of protein localization to ciliary membrane(GO:1903567) negative regulation of protein localization to ciliary membrane(GO:1903568) |
| 0.0 | 0.2 | GO:0014886 | transition between slow and fast fiber(GO:0014886) |
| 0.0 | 0.1 | GO:0000492 | box C/D snoRNP assembly(GO:0000492) |
| 0.0 | 0.1 | GO:0002361 | CD4-positive, CD25-positive, alpha-beta regulatory T cell differentiation(GO:0002361) |
| 0.0 | 0.2 | GO:0021817 | nucleokinesis involved in cell motility in cerebral cortex radial glia guided migration(GO:0021817) nuclear migration along microtubule(GO:0030473) |
| 0.0 | 0.2 | GO:0007549 | dosage compensation(GO:0007549) dosage compensation by inactivation of X chromosome(GO:0009048) |
| 0.0 | 0.4 | GO:0002483 | antigen processing and presentation of endogenous peptide antigen(GO:0002483) antigen processing and presentation of endogenous peptide antigen via MHC class I(GO:0019885) |
| 0.0 | 0.3 | GO:0045591 | positive regulation of regulatory T cell differentiation(GO:0045591) |
| 0.0 | 0.3 | GO:0000480 | endonucleolytic cleavage in 5'-ETS of tricistronic rRNA transcript (SSU-rRNA, 5.8S rRNA, LSU-rRNA)(GO:0000480) |
| 0.0 | 0.1 | GO:0009213 | pyrimidine nucleoside triphosphate catabolic process(GO:0009149) pyrimidine deoxyribonucleoside triphosphate catabolic process(GO:0009213) |
| 0.0 | 1.3 | GO:1903432 | regulation of TORC1 signaling(GO:1903432) |
| 0.0 | 0.1 | GO:0036091 | positive regulation of transcription from RNA polymerase II promoter in response to oxidative stress(GO:0036091) |
| 0.0 | 0.2 | GO:0051534 | negative regulation of NFAT protein import into nucleus(GO:0051534) |
| 0.0 | 0.2 | GO:0006384 | transcription initiation from RNA polymerase III promoter(GO:0006384) |
| 0.0 | 0.5 | GO:0051531 | NFAT protein import into nucleus(GO:0051531) |
| 0.0 | 0.1 | GO:1904245 | regulation of polynucleotide adenylyltransferase activity(GO:1904245) |
| 0.0 | 0.7 | GO:0045162 | clustering of voltage-gated sodium channels(GO:0045162) |
| 0.0 | 0.6 | GO:0032486 | Rap protein signal transduction(GO:0032486) |
| 0.0 | 0.3 | GO:0006167 | AMP biosynthetic process(GO:0006167) |
| 0.0 | 0.4 | GO:0048227 | plasma membrane to endosome transport(GO:0048227) |
| 0.0 | 0.2 | GO:1900224 | positive regulation of nodal signaling pathway involved in determination of lateral mesoderm left/right asymmetry(GO:1900224) |
| 0.0 | 0.3 | GO:1902035 | positive regulation of hematopoietic stem cell proliferation(GO:1902035) |
| 0.0 | 0.4 | GO:0042754 | negative regulation of circadian rhythm(GO:0042754) |
| 0.0 | 0.1 | GO:1903031 | regulation of microtubule plus-end binding(GO:1903031) positive regulation of microtubule plus-end binding(GO:1903033) |
| 0.0 | 0.3 | GO:0000707 | meiotic DNA recombinase assembly(GO:0000707) |
| 0.0 | 0.3 | GO:0034723 | DNA replication-dependent nucleosome assembly(GO:0006335) DNA replication-dependent nucleosome organization(GO:0034723) |
| 0.0 | 1.1 | GO:0031498 | nucleosome disassembly(GO:0006337) chromatin disassembly(GO:0031498) protein-DNA complex disassembly(GO:0032986) |
| 0.0 | 0.3 | GO:0090063 | positive regulation of microtubule nucleation(GO:0090063) |
| 0.0 | 1.2 | GO:0043984 | histone H4-K16 acetylation(GO:0043984) |
| 0.0 | 0.1 | GO:0050902 | leukocyte adhesive activation(GO:0050902) |
| 0.0 | 0.9 | GO:0051016 | barbed-end actin filament capping(GO:0051016) |
| 0.0 | 0.1 | GO:0006059 | hexitol metabolic process(GO:0006059) |
| 0.0 | 0.1 | GO:1900369 | negative regulation of RNA interference(GO:1900369) |
| 0.0 | 0.5 | GO:0030854 | positive regulation of granulocyte differentiation(GO:0030854) |
| 0.0 | 0.3 | GO:0034773 | histone H4-K20 trimethylation(GO:0034773) |
| 0.0 | 0.1 | GO:1902462 | regulation of mesenchymal stem cell proliferation(GO:1902460) positive regulation of mesenchymal stem cell proliferation(GO:1902462) |
| 0.0 | 1.8 | GO:1901224 | positive regulation of NIK/NF-kappaB signaling(GO:1901224) |
| 0.0 | 0.1 | GO:0038001 | autocrine signaling(GO:0035425) paracrine signaling(GO:0038001) |
| 0.0 | 6.6 | GO:0065004 | protein-DNA complex assembly(GO:0065004) |
| 0.0 | 0.1 | GO:1904565 | response to 1-oleoyl-sn-glycerol 3-phosphate(GO:1904565) cellular response to 1-oleoyl-sn-glycerol 3-phosphate(GO:1904566) |
| 0.0 | 3.5 | GO:0001578 | microtubule bundle formation(GO:0001578) |
| 0.0 | 0.2 | GO:0060010 | Sertoli cell fate commitment(GO:0060010) |
| 0.0 | 0.2 | GO:0045759 | negative regulation of action potential(GO:0045759) |
| 0.0 | 0.8 | GO:0071420 | cellular response to histamine(GO:0071420) |
| 0.0 | 0.9 | GO:0010971 | positive regulation of G2/M transition of mitotic cell cycle(GO:0010971) |
| 0.0 | 0.2 | GO:0045075 | interleukin-12 biosynthetic process(GO:0042090) regulation of interleukin-12 biosynthetic process(GO:0045075) |
| 0.0 | 0.8 | GO:0046475 | glycerophospholipid catabolic process(GO:0046475) |
| 0.0 | 0.1 | GO:1900227 | positive regulation of NLRP3 inflammasome complex assembly(GO:1900227) |
| 0.0 | 0.1 | GO:0060287 | epithelial cilium movement involved in determination of left/right asymmetry(GO:0060287) |
| 0.0 | 1.7 | GO:0010501 | RNA secondary structure unwinding(GO:0010501) |
| 0.0 | 0.1 | GO:1904732 | regulation of electron carrier activity(GO:1904732) |
| 0.0 | 0.2 | GO:2000489 | regulation of hepatic stellate cell activation(GO:2000489) |
| 0.0 | 0.1 | GO:0016240 | autophagosome docking(GO:0016240) |
| 0.0 | 0.4 | GO:0000715 | nucleotide-excision repair, DNA damage recognition(GO:0000715) |
| 0.0 | 0.2 | GO:0034164 | negative regulation of toll-like receptor 9 signaling pathway(GO:0034164) |
| 0.0 | 0.3 | GO:0043101 | purine-containing compound salvage(GO:0043101) |
| 0.0 | 0.1 | GO:1904864 | regulation of beta-catenin-TCF complex assembly(GO:1904863) negative regulation of beta-catenin-TCF complex assembly(GO:1904864) |
| 0.0 | 0.1 | GO:0034344 | type III interferon production(GO:0034343) regulation of type III interferon production(GO:0034344) |
| 0.0 | 0.5 | GO:2000353 | positive regulation of endothelial cell apoptotic process(GO:2000353) |
| 0.0 | 0.2 | GO:0045196 | establishment or maintenance of neuroblast polarity(GO:0045196) establishment of neuroblast polarity(GO:0045200) |
| 0.0 | 0.1 | GO:0035522 | monoubiquitinated histone deubiquitination(GO:0035521) monoubiquitinated histone H2A deubiquitination(GO:0035522) |
| 0.0 | 0.4 | GO:0090527 | actin filament reorganization(GO:0090527) |
| 0.0 | 0.3 | GO:0045023 | G0 to G1 transition(GO:0045023) |
| 0.0 | 0.5 | GO:0044458 | motile cilium assembly(GO:0044458) |
| 0.0 | 0.2 | GO:0010992 | ubiquitin homeostasis(GO:0010992) |
| 0.0 | 0.3 | GO:1904903 | ESCRT complex disassembly(GO:1904896) ESCRT III complex disassembly(GO:1904903) |
| 0.0 | 0.3 | GO:0097338 | response to clozapine(GO:0097338) |
| 0.0 | 0.1 | GO:0003190 | atrioventricular valve formation(GO:0003190) |
| 0.0 | 0.2 | GO:0080182 | histone H3-K4 trimethylation(GO:0080182) |
| 0.0 | 0.1 | GO:1901339 | regulation of store-operated calcium channel activity(GO:1901339) |
| 0.0 | 0.1 | GO:0072537 | fibroblast activation(GO:0072537) |
| 0.0 | 1.2 | GO:0031145 | anaphase-promoting complex-dependent catabolic process(GO:0031145) |
| 0.0 | 0.3 | GO:0060746 | maternal behavior(GO:0042711) parental behavior(GO:0060746) |
| 0.0 | 0.1 | GO:0061739 | protein lipidation involved in autophagosome assembly(GO:0061739) |
| 0.0 | 0.4 | GO:0010499 | proteasomal ubiquitin-independent protein catabolic process(GO:0010499) |
| 0.0 | 0.2 | GO:0008295 | spermidine biosynthetic process(GO:0008295) |
| 0.0 | 0.1 | GO:0009957 | epidermal cell fate specification(GO:0009957) |
| 0.0 | 0.1 | GO:0035574 | histone H4-K20 demethylation(GO:0035574) |
| 0.0 | 0.1 | GO:0018076 | N-terminal peptidyl-lysine acetylation(GO:0018076) |
| 0.0 | 0.2 | GO:0070212 | protein poly-ADP-ribosylation(GO:0070212) |
| 0.0 | 0.2 | GO:0031547 | brain-derived neurotrophic factor receptor signaling pathway(GO:0031547) |
| 0.0 | 0.2 | GO:0045347 | negative regulation of MHC class II biosynthetic process(GO:0045347) |
| 0.0 | 0.6 | GO:0042759 | long-chain fatty acid biosynthetic process(GO:0042759) |
| 0.0 | 0.3 | GO:0097324 | melanocyte migration(GO:0097324) positive regulation of lens fiber cell differentiation(GO:1902748) |
| 0.0 | 0.6 | GO:0006471 | protein ADP-ribosylation(GO:0006471) |
| 0.0 | 0.1 | GO:0002277 | myeloid dendritic cell activation involved in immune response(GO:0002277) |
| 0.0 | 0.1 | GO:0036233 | glycine import(GO:0036233) |
| 0.0 | 0.8 | GO:0032757 | positive regulation of interleukin-8 production(GO:0032757) |
| 0.0 | 0.4 | GO:0039536 | negative regulation of RIG-I signaling pathway(GO:0039536) |
| 0.0 | 0.4 | GO:0060074 | synapse maturation(GO:0060074) |
| 0.0 | 0.1 | GO:0002322 | B cell proliferation involved in immune response(GO:0002322) |
| 0.0 | 0.2 | GO:0042118 | endothelial cell activation(GO:0042118) |
| 0.0 | 0.4 | GO:0045199 | maintenance of apical/basal cell polarity(GO:0035090) maintenance of epithelial cell apical/basal polarity(GO:0045199) |
| 0.0 | 1.1 | GO:0042274 | ribosomal small subunit biogenesis(GO:0042274) |
| 0.0 | 0.3 | GO:0045793 | positive regulation of cell size(GO:0045793) |
| 0.0 | 0.2 | GO:0031118 | rRNA pseudouridine synthesis(GO:0031118) |
| 0.0 | 1.1 | GO:1903959 | regulation of anion transmembrane transport(GO:1903959) |
| 0.0 | 2.1 | GO:0000380 | alternative mRNA splicing, via spliceosome(GO:0000380) |
| 0.0 | 0.3 | GO:0015985 | energy coupled proton transport, down electrochemical gradient(GO:0015985) ATP synthesis coupled proton transport(GO:0015986) |
| 0.0 | 0.5 | GO:0006607 | NLS-bearing protein import into nucleus(GO:0006607) |
| 0.0 | 0.2 | GO:0034770 | histone H4-K20 methylation(GO:0034770) |
| 0.0 | 0.1 | GO:0046208 | spermine catabolic process(GO:0046208) |
| 0.0 | 0.6 | GO:0038063 | collagen-activated tyrosine kinase receptor signaling pathway(GO:0038063) |
| 0.0 | 0.7 | GO:0071431 | tRNA export from nucleus(GO:0006409) tRNA-containing ribonucleoprotein complex export from nucleus(GO:0071431) |
| 0.0 | 1.1 | GO:0007205 | protein kinase C-activating G-protein coupled receptor signaling pathway(GO:0007205) |
| 0.0 | 0.1 | GO:0006420 | arginyl-tRNA aminoacylation(GO:0006420) |
| 0.0 | 0.1 | GO:0097089 | methyl-branched fatty acid metabolic process(GO:0097089) |
| 0.0 | 0.8 | GO:0070534 | protein K63-linked ubiquitination(GO:0070534) |
| 0.0 | 3.8 | GO:0002220 | innate immune response activating cell surface receptor signaling pathway(GO:0002220) stimulatory C-type lectin receptor signaling pathway(GO:0002223) |
| 0.0 | 0.1 | GO:0008611 | ether lipid biosynthetic process(GO:0008611) glycerol ether biosynthetic process(GO:0046504) ether biosynthetic process(GO:1901503) |
| 0.0 | 0.3 | GO:0036066 | protein O-linked fucosylation(GO:0036066) |
| 0.0 | 0.8 | GO:0060325 | face morphogenesis(GO:0060325) |
| 0.0 | 0.5 | GO:0035589 | G-protein coupled purinergic nucleotide receptor signaling pathway(GO:0035589) |
| 0.0 | 0.2 | GO:0035278 | miRNA mediated inhibition of translation(GO:0035278) negative regulation of translation, ncRNA-mediated(GO:0040033) regulation of translation, ncRNA-mediated(GO:0045974) |
| 0.0 | 0.0 | GO:1901536 | chromatin reprogramming in the zygote(GO:0044725) regulation of DNA demethylation(GO:1901535) negative regulation of DNA demethylation(GO:1901536) |
| 0.0 | 0.3 | GO:0031339 | negative regulation of vesicle fusion(GO:0031339) |
| 0.0 | 0.3 | GO:0051712 | positive regulation of killing of cells of other organism(GO:0051712) |
| 0.0 | 0.3 | GO:0036342 | post-anal tail morphogenesis(GO:0036342) |
| 0.0 | 0.5 | GO:0042501 | serine phosphorylation of STAT protein(GO:0042501) |
| 0.0 | 0.9 | GO:0006735 | NADH regeneration(GO:0006735) glycolytic process through fructose-6-phosphate(GO:0061615) glycolytic process through glucose-6-phosphate(GO:0061620) canonical glycolysis(GO:0061621) glucose catabolic process to pyruvate(GO:0061718) |
| 0.0 | 0.7 | GO:0071108 | protein K48-linked deubiquitination(GO:0071108) |
| 0.0 | 0.1 | GO:1903259 | exon-exon junction complex disassembly(GO:1903259) |
| 0.0 | 1.1 | GO:0050775 | positive regulation of dendrite morphogenesis(GO:0050775) |
| 0.0 | 0.4 | GO:1902260 | negative regulation of delayed rectifier potassium channel activity(GO:1902260) negative regulation of voltage-gated potassium channel activity(GO:1903817) |
| 0.0 | 2.4 | GO:0051965 | positive regulation of synapse assembly(GO:0051965) |
| 0.0 | 0.6 | GO:0001696 | gastric acid secretion(GO:0001696) |
| 0.0 | 0.4 | GO:2001241 | positive regulation of extrinsic apoptotic signaling pathway in absence of ligand(GO:2001241) |
| 0.0 | 1.2 | GO:1902475 | L-alpha-amino acid transmembrane transport(GO:1902475) |
| 0.0 | 0.1 | GO:1904021 | negative regulation of G-protein coupled receptor internalization(GO:1904021) |
| 0.0 | 0.8 | GO:0051156 | glucose 6-phosphate metabolic process(GO:0051156) |
| 0.0 | 0.1 | GO:1900225 | regulation of NLRP3 inflammasome complex assembly(GO:1900225) |
| 0.0 | 0.1 | GO:0034214 | protein hexamerization(GO:0034214) |
| 0.0 | 0.1 | GO:0015862 | uridine transport(GO:0015862) |
| 0.0 | 0.1 | GO:0000711 | meiotic DNA repair synthesis(GO:0000711) |
| 0.0 | 0.1 | GO:0061484 | hematopoietic stem cell homeostasis(GO:0061484) |
| 0.0 | 0.3 | GO:0018026 | peptidyl-lysine monomethylation(GO:0018026) |
| 0.0 | 0.0 | GO:1903862 | positive regulation of oxidative phosphorylation(GO:1903862) |
| 0.0 | 0.2 | GO:0002943 | tRNA dihydrouridine synthesis(GO:0002943) |
| 0.0 | 1.0 | GO:0050690 | regulation of defense response to virus by virus(GO:0050690) |
| 0.0 | 0.2 | GO:0072092 | ureteric bud invasion(GO:0072092) |
| 0.0 | 0.2 | GO:0071847 | TNFSF11-mediated signaling pathway(GO:0071847) |
| 0.0 | 0.3 | GO:0010668 | ectodermal cell differentiation(GO:0010668) |
| 0.0 | 0.4 | GO:0051292 | nuclear pore complex assembly(GO:0051292) |
| 0.0 | 0.0 | GO:0018171 | peptidyl-cysteine oxidation(GO:0018171) |
| 0.0 | 0.1 | GO:0032510 | endosome to lysosome transport via multivesicular body sorting pathway(GO:0032510) |
| 0.0 | 0.1 | GO:0002677 | negative regulation of chronic inflammatory response(GO:0002677) |
| 0.0 | 0.1 | GO:0034349 | glial cell apoptotic process(GO:0034349) |
| 0.0 | 0.0 | GO:0072387 | flavin adenine dinucleotide metabolic process(GO:0072387) |
| 0.0 | 0.2 | GO:0007028 | cytoplasm organization(GO:0007028) |
| 0.0 | 0.2 | GO:0001865 | NK T cell differentiation(GO:0001865) |
| 0.0 | 0.1 | GO:1903385 | regulation of homophilic cell adhesion(GO:1903385) |
| 0.0 | 0.2 | GO:0032968 | positive regulation of transcription elongation from RNA polymerase II promoter(GO:0032968) |
| 0.0 | 0.1 | GO:0019418 | sulfide oxidation(GO:0019418) sulfide oxidation, using sulfide:quinone oxidoreductase(GO:0070221) |
| 0.0 | 0.0 | GO:1990086 | lens fiber cell apoptotic process(GO:1990086) |
| 0.0 | 0.1 | GO:2000676 | positive regulation of type B pancreatic cell apoptotic process(GO:2000676) |
| 0.0 | 0.5 | GO:0033198 | response to ATP(GO:0033198) |
| 0.0 | 0.5 | GO:0043392 | negative regulation of DNA binding(GO:0043392) |
| 0.0 | 0.3 | GO:0007213 | G-protein coupled acetylcholine receptor signaling pathway(GO:0007213) |
| 0.0 | 0.3 | GO:1903146 | regulation of mitophagy(GO:1903146) |
| 0.0 | 0.1 | GO:0002326 | B cell lineage commitment(GO:0002326) |
| 0.0 | 0.9 | GO:0042462 | eye photoreceptor cell development(GO:0042462) |
| 0.0 | 0.5 | GO:0031146 | SCF-dependent proteasomal ubiquitin-dependent protein catabolic process(GO:0031146) |
| 0.0 | 0.4 | GO:0007289 | spermatid nucleus differentiation(GO:0007289) |
| 0.0 | 0.2 | GO:2000678 | negative regulation of transcription regulatory region DNA binding(GO:2000678) |
| 0.0 | 0.0 | GO:0071895 | odontoblast differentiation(GO:0071895) |
| 0.0 | 0.3 | GO:0034498 | early endosome to Golgi transport(GO:0034498) |
| 0.0 | 0.6 | GO:0006283 | transcription-coupled nucleotide-excision repair(GO:0006283) |
| 0.0 | 0.1 | GO:0006931 | substrate-dependent cell migration, cell attachment to substrate(GO:0006931) |
| 0.0 | 0.1 | GO:0044387 | negative regulation of protein kinase activity by regulation of protein phosphorylation(GO:0044387) |
| 0.0 | 0.1 | GO:0071284 | response to platinum ion(GO:0070541) cellular response to lead ion(GO:0071284) |
| 0.0 | 0.1 | GO:1904354 | negative regulation of telomere capping(GO:1904354) |
| 0.0 | 0.1 | GO:0034501 | protein localization to kinetochore(GO:0034501) protein localization to chromosome, centromeric region(GO:0071459) |
| 0.0 | 0.1 | GO:0060235 | lens induction in camera-type eye(GO:0060235) |
| 0.0 | 0.5 | GO:0008053 | mitochondrial fusion(GO:0008053) |
| 0.0 | 0.4 | GO:0006309 | apoptotic DNA fragmentation(GO:0006309) |
| 0.0 | 0.3 | GO:0071578 | zinc II ion transmembrane import(GO:0071578) |
| 0.0 | 0.1 | GO:0030578 | PML body organization(GO:0030578) |
| 0.0 | 0.2 | GO:1900364 | negative regulation of mRNA polyadenylation(GO:1900364) |
| 0.0 | 0.0 | GO:0043932 | ossification involved in bone remodeling(GO:0043932) |
| 0.0 | 0.0 | GO:1903719 | regulation of I-kappaB phosphorylation(GO:1903719) positive regulation of I-kappaB phosphorylation(GO:1903721) |
| 0.0 | 0.1 | GO:0061084 | regulation of protein refolding(GO:0061083) negative regulation of protein refolding(GO:0061084) negative regulation of protein folding(GO:1903333) |
| 0.0 | 0.1 | GO:0070245 | positive regulation of thymocyte apoptotic process(GO:0070245) |
| 0.0 | 0.4 | GO:0090005 | negative regulation of establishment of protein localization to plasma membrane(GO:0090005) |
| 0.0 | 0.2 | GO:0045046 | protein import into peroxisome membrane(GO:0045046) |
| 0.0 | 0.3 | GO:0010663 | positive regulation of striated muscle cell apoptotic process(GO:0010663) positive regulation of cardiac muscle cell apoptotic process(GO:0010666) |
| 0.0 | 0.2 | GO:0031297 | replication fork processing(GO:0031297) |
| 0.0 | 0.1 | GO:0042276 | error-prone translesion synthesis(GO:0042276) |
| 0.0 | 0.0 | GO:0070358 | actin polymerization-dependent cell motility(GO:0070358) |
| 0.0 | 0.1 | GO:0003363 | lamellipodium assembly involved in ameboidal cell migration(GO:0003363) |
| 0.0 | 0.1 | GO:0016479 | negative regulation of transcription from RNA polymerase I promoter(GO:0016479) regulation of membrane repolarization during atrial cardiac muscle cell action potential(GO:1905000) |
| 0.0 | 0.0 | GO:1904828 | regulation of phenotypic switching by transcription from RNA polymerase II promoter(GO:0100057) regulation of hydrogen sulfide biosynthetic process(GO:1904826) positive regulation of hydrogen sulfide biosynthetic process(GO:1904828) |
| 0.0 | 0.1 | GO:1902412 | regulation of mitotic cytokinesis(GO:1902412) |
| 0.0 | 0.1 | GO:0070294 | renal sodium ion absorption(GO:0070294) |
| 0.0 | 0.4 | GO:0016024 | CDP-diacylglycerol biosynthetic process(GO:0016024) |
| 0.0 | 0.3 | GO:0006450 | regulation of translational fidelity(GO:0006450) |
| 0.0 | 0.1 | GO:0021942 | radial glia guided migration of Purkinje cell(GO:0021942) |
| 0.0 | 0.2 | GO:0010592 | positive regulation of lamellipodium assembly(GO:0010592) |
| 0.0 | 0.5 | GO:0000027 | ribosomal large subunit assembly(GO:0000027) |
| 0.0 | 0.1 | GO:0021527 | spinal cord association neuron differentiation(GO:0021527) |
| 0.0 | 0.4 | GO:2000144 | positive regulation of DNA-templated transcription, initiation(GO:2000144) |
| 0.0 | 0.5 | GO:1903861 | positive regulation of dendrite extension(GO:1903861) |
| 0.0 | 0.1 | GO:2000371 | regulation of isomerase activity(GO:0010911) positive regulation of isomerase activity(GO:0010912) regulation of DNA topoisomerase (ATP-hydrolyzing) activity(GO:2000371) positive regulation of DNA topoisomerase (ATP-hydrolyzing) activity(GO:2000373) |
| 0.0 | 4.3 | GO:0000209 | protein polyubiquitination(GO:0000209) |
| 0.0 | 0.2 | GO:0003351 | epithelial cilium movement(GO:0003351) |
| 0.0 | 0.2 | GO:0051451 | myoblast migration(GO:0051451) |
| 0.0 | 0.3 | GO:0090200 | positive regulation of release of cytochrome c from mitochondria(GO:0090200) |
| 0.0 | 0.4 | GO:0000185 | activation of MAPKKK activity(GO:0000185) |
| 0.0 | 0.1 | GO:0032489 | regulation of Cdc42 protein signal transduction(GO:0032489) |
| 0.0 | 0.1 | GO:1990668 | vesicle fusion with endoplasmic reticulum-Golgi intermediate compartment (ERGIC) membrane(GO:1990668) |
| 0.0 | 0.3 | GO:0070584 | mitochondrion morphogenesis(GO:0070584) |
| 0.0 | 0.1 | GO:0035372 | protein localization to microtubule(GO:0035372) |
| 0.0 | 0.1 | GO:1900383 | regulation of synaptic plasticity by receptor localization to synapse(GO:1900383) |
| 0.0 | 0.3 | GO:0006614 | SRP-dependent cotranslational protein targeting to membrane(GO:0006614) |
| 0.0 | 0.2 | GO:0014029 | neural crest formation(GO:0014029) |
| 0.0 | 0.2 | GO:0045943 | positive regulation of transcription from RNA polymerase I promoter(GO:0045943) |
| 0.0 | 1.7 | GO:0006338 | chromatin remodeling(GO:0006338) |
| 0.0 | 0.1 | GO:0061762 | CAMKK-AMPK signaling cascade(GO:0061762) |
| 0.0 | 0.1 | GO:0006933 | negative regulation of cell adhesion involved in substrate-bound cell migration(GO:0006933) |
| 0.0 | 0.1 | GO:2000059 | negative regulation of protein ubiquitination involved in ubiquitin-dependent protein catabolic process(GO:2000059) |
| 0.0 | 0.1 | GO:0098909 | regulation of cardiac muscle cell action potential involved in regulation of contraction(GO:0098909) |
| 0.0 | 0.0 | GO:0031104 | dendrite regeneration(GO:0031104) |
| 0.0 | 0.1 | GO:0043518 | negative regulation of DNA damage response, signal transduction by p53 class mediator(GO:0043518) |
| 0.0 | 0.1 | GO:0043555 | regulation of translation in response to stress(GO:0043555) |
| 0.0 | 0.6 | GO:0008045 | motor neuron axon guidance(GO:0008045) |
| 0.0 | 0.5 | GO:0043303 | mast cell activation involved in immune response(GO:0002279) mast cell degranulation(GO:0043303) |
| 0.0 | 0.1 | GO:0006003 | fructose 2,6-bisphosphate metabolic process(GO:0006003) |
| 0.0 | 0.1 | GO:0018230 | peptidyl-L-cysteine S-palmitoylation(GO:0018230) peptidyl-S-diacylglycerol-L-cysteine biosynthetic process from peptidyl-cysteine(GO:0018231) |
| 0.0 | 0.2 | GO:0070935 | 3'-UTR-mediated mRNA stabilization(GO:0070935) |
| 0.0 | 0.1 | GO:0090073 | positive regulation of protein homodimerization activity(GO:0090073) |
| 0.0 | 0.2 | GO:0050872 | white fat cell differentiation(GO:0050872) |
| 0.0 | 0.2 | GO:0042789 | mRNA transcription from RNA polymerase II promoter(GO:0042789) |
| 0.0 | 0.8 | GO:0048701 | embryonic cranial skeleton morphogenesis(GO:0048701) |
| 0.0 | 0.1 | GO:0007000 | nucleolus organization(GO:0007000) |
| 0.0 | 0.3 | GO:0032292 | myelination in peripheral nervous system(GO:0022011) peripheral nervous system axon ensheathment(GO:0032292) |
| 0.0 | 0.7 | GO:0042073 | intraciliary transport(GO:0042073) |
| 0.0 | 0.6 | GO:0016239 | positive regulation of macroautophagy(GO:0016239) |
| 0.0 | 0.1 | GO:0009726 | detection of endogenous stimulus(GO:0009726) |
| 0.0 | 0.2 | GO:0060049 | regulation of protein glycosylation(GO:0060049) |
| 0.0 | 0.2 | GO:0032793 | positive regulation of CREB transcription factor activity(GO:0032793) |
| 0.0 | 0.2 | GO:0070262 | peptidyl-serine dephosphorylation(GO:0070262) |
| 0.0 | 0.1 | GO:0018095 | protein polyglutamylation(GO:0018095) |
| 0.0 | 0.2 | GO:0050860 | negative regulation of T cell receptor signaling pathway(GO:0050860) |
| 0.0 | 1.1 | GO:0031338 | regulation of vesicle fusion(GO:0031338) |
| 0.0 | 0.2 | GO:0036315 | cellular response to sterol(GO:0036315) |
| 0.0 | 0.2 | GO:0001574 | ganglioside biosynthetic process(GO:0001574) |
| 0.0 | 0.2 | GO:1904714 | regulation of chaperone-mediated autophagy(GO:1904714) |
| 0.0 | 1.4 | GO:0006821 | chloride transport(GO:0006821) |
| 0.0 | 0.6 | GO:0048791 | calcium ion-regulated exocytosis of neurotransmitter(GO:0048791) |
| 0.0 | 0.2 | GO:1902187 | negative regulation of viral release from host cell(GO:1902187) |
| 0.0 | 0.1 | GO:0055014 | atrial cardiac muscle cell differentiation(GO:0055011) atrial cardiac muscle cell development(GO:0055014) |
| 0.0 | 2.0 | GO:0000184 | nuclear-transcribed mRNA catabolic process, nonsense-mediated decay(GO:0000184) |
| 0.0 | 0.3 | GO:0035196 | production of miRNAs involved in gene silencing by miRNA(GO:0035196) |
| 0.0 | 0.1 | GO:0017062 | respiratory chain complex III assembly(GO:0017062) mitochondrial respiratory chain complex III assembly(GO:0034551) |
| 0.0 | 0.1 | GO:1903588 | regulation of blood vessel endothelial cell proliferation involved in sprouting angiogenesis(GO:1903587) negative regulation of blood vessel endothelial cell proliferation involved in sprouting angiogenesis(GO:1903588) |
| 0.0 | 0.0 | GO:1904977 | lymphatic endothelial cell migration(GO:1904977) |
| 0.0 | 0.2 | GO:0090360 | platelet-derived growth factor production(GO:0090360) regulation of platelet-derived growth factor production(GO:0090361) |
| 0.0 | 0.1 | GO:0000255 | allantoin metabolic process(GO:0000255) |
| 0.0 | 0.2 | GO:0034975 | protein folding in endoplasmic reticulum(GO:0034975) |
| 0.0 | 3.0 | GO:0000398 | RNA splicing, via transesterification reactions with bulged adenosine as nucleophile(GO:0000377) mRNA splicing, via spliceosome(GO:0000398) |
Gene overrepresentation in cellular component category:
| Log-likelihood per target | Total log-likelihood | Term | Description |
|---|---|---|---|
| 0.7 | 7.1 | GO:0005826 | actomyosin contractile ring(GO:0005826) |
| 0.5 | 7.2 | GO:0030314 | junctional membrane complex(GO:0030314) sarcoplasmic reticulum lumen(GO:0033018) |
| 0.3 | 5.7 | GO:0097512 | cardiac myofibril(GO:0097512) |
| 0.3 | 1.9 | GO:0090571 | RNA polymerase II transcription repressor complex(GO:0090571) |
| 0.3 | 1.8 | GO:0005927 | muscle tendon junction(GO:0005927) |
| 0.3 | 1.1 | GO:0034271 | phosphatidylinositol 3-kinase complex, class III, type I(GO:0034271) phosphatidylinositol 3-kinase complex, class III, type II(GO:0034272) |
| 0.3 | 1.1 | GO:1902912 | pyruvate kinase complex(GO:1902912) |
| 0.3 | 3.0 | GO:0097442 | CA3 pyramidal cell dendrite(GO:0097442) |
| 0.2 | 1.2 | GO:1990667 | PCSK9-AnxA2 complex(GO:1990667) |
| 0.2 | 2.1 | GO:0016012 | sarcoglycan complex(GO:0016012) |
| 0.2 | 0.7 | GO:0048269 | methionine adenosyltransferase complex(GO:0048269) |
| 0.2 | 3.5 | GO:0005861 | troponin complex(GO:0005861) |
| 0.2 | 0.5 | GO:0034515 | proteasome storage granule(GO:0034515) |
| 0.2 | 1.1 | GO:0005896 | interleukin-6 receptor complex(GO:0005896) |
| 0.2 | 0.7 | GO:0097636 | intrinsic component of autophagosome membrane(GO:0097636) integral component of autophagosome membrane(GO:0097637) |
| 0.2 | 4.4 | GO:0032982 | myosin filament(GO:0032982) |
| 0.2 | 0.5 | GO:0042022 | interleukin-12 receptor complex(GO:0042022) |
| 0.2 | 1.1 | GO:0009331 | glycerol-3-phosphate dehydrogenase complex(GO:0009331) |
| 0.2 | 0.9 | GO:0031232 | extrinsic component of external side of plasma membrane(GO:0031232) |
| 0.2 | 0.8 | GO:0014701 | junctional sarcoplasmic reticulum membrane(GO:0014701) |
| 0.2 | 0.8 | GO:0043564 | Ku70:Ku80 complex(GO:0043564) |
| 0.1 | 0.7 | GO:0031933 | telomeric heterochromatin(GO:0031933) |
| 0.1 | 1.2 | GO:1990452 | Parkin-FBXW7-Cul1 ubiquitin ligase complex(GO:1990452) |
| 0.1 | 1.5 | GO:0005827 | polar microtubule(GO:0005827) |
| 0.1 | 1.1 | GO:0033263 | CORVET complex(GO:0033263) |
| 0.1 | 1.7 | GO:0035692 | macrophage migration inhibitory factor receptor complex(GO:0035692) |
| 0.1 | 0.8 | GO:0072557 | IPAF inflammasome complex(GO:0072557) |
| 0.1 | 0.8 | GO:0002081 | outer acrosomal membrane(GO:0002081) |
| 0.1 | 0.4 | GO:0097679 | symbiont-containing vacuole membrane(GO:0020005) other organism cytoplasm(GO:0097679) |
| 0.1 | 3.6 | GO:0005859 | muscle myosin complex(GO:0005859) |
| 0.1 | 0.6 | GO:1990393 | 3M complex(GO:1990393) |
| 0.1 | 0.4 | GO:0097441 | basilar dendrite(GO:0097441) |
| 0.1 | 0.5 | GO:0005944 | phosphatidylinositol 3-kinase complex, class IB(GO:0005944) |
| 0.1 | 0.3 | GO:0016939 | kinesin II complex(GO:0016939) |
| 0.1 | 0.7 | GO:0071547 | piP-body(GO:0071547) |
| 0.1 | 0.3 | GO:0031166 | integral component of vacuolar membrane(GO:0031166) |
| 0.1 | 0.6 | GO:0031905 | early endosome lumen(GO:0031905) |
| 0.1 | 1.7 | GO:0070938 | contractile ring(GO:0070938) |
| 0.1 | 0.7 | GO:0071942 | XPC complex(GO:0071942) |
| 0.1 | 0.5 | GO:0032301 | MutSalpha complex(GO:0032301) |
| 0.1 | 1.1 | GO:0042382 | paraspeckles(GO:0042382) |
| 0.1 | 0.3 | GO:0034676 | integrin alpha6-beta4 complex(GO:0034676) |
| 0.1 | 2.2 | GO:0097025 | MPP7-DLG1-LIN7 complex(GO:0097025) |
| 0.1 | 0.4 | GO:0008275 | gamma-tubulin small complex(GO:0008275) |
| 0.1 | 1.4 | GO:0032541 | cortical endoplasmic reticulum(GO:0032541) |
| 0.1 | 0.9 | GO:0044326 | dendritic spine neck(GO:0044326) |
| 0.1 | 0.5 | GO:0042643 | actomyosin, actin portion(GO:0042643) |
| 0.1 | 1.2 | GO:0070852 | cell body fiber(GO:0070852) |
| 0.1 | 0.3 | GO:0002947 | tumor necrosis factor receptor superfamily complex(GO:0002947) |
| 0.1 | 2.0 | GO:0031095 | platelet dense tubular network membrane(GO:0031095) |
| 0.1 | 1.5 | GO:0008290 | F-actin capping protein complex(GO:0008290) |
| 0.1 | 0.4 | GO:0035354 | Toll-like receptor 1-Toll-like receptor 2 protein complex(GO:0035354) |
| 0.1 | 1.2 | GO:0030981 | cortical microtubule cytoskeleton(GO:0030981) |
| 0.1 | 1.1 | GO:1990316 | ATG1/ULK1 kinase complex(GO:1990316) |
| 0.1 | 0.3 | GO:1990917 | sperm head plasma membrane(GO:1990913) ooplasm(GO:1990917) |
| 0.1 | 0.6 | GO:0001652 | granular component(GO:0001652) |
| 0.1 | 1.1 | GO:0072487 | MSL complex(GO:0072487) |
| 0.1 | 0.3 | GO:1990356 | sumoylated E2 ligase complex(GO:1990356) |
| 0.1 | 0.2 | GO:0001534 | radial spoke(GO:0001534) |
| 0.1 | 0.8 | GO:0000127 | transcription factor TFIIIC complex(GO:0000127) |
| 0.1 | 6.4 | GO:0016235 | aggresome(GO:0016235) |
| 0.1 | 0.2 | GO:0032444 | activin responsive factor complex(GO:0032444) |
| 0.1 | 0.4 | GO:0070044 | synaptobrevin 2-SNAP-25-syntaxin-1a complex(GO:0070044) |
| 0.1 | 0.9 | GO:0033269 | internode region of axon(GO:0033269) |
| 0.1 | 0.9 | GO:0000015 | phosphopyruvate hydratase complex(GO:0000015) |
| 0.1 | 4.0 | GO:0033017 | sarcoplasmic reticulum membrane(GO:0033017) |
| 0.1 | 0.9 | GO:0005828 | kinetochore microtubule(GO:0005828) |
| 0.1 | 1.7 | GO:0031588 | nucleotide-activated protein kinase complex(GO:0031588) |
| 0.1 | 0.4 | GO:0005658 | alpha DNA polymerase:primase complex(GO:0005658) |
| 0.1 | 1.8 | GO:0031265 | CD95 death-inducing signaling complex(GO:0031265) |
| 0.1 | 0.2 | GO:0036195 | muscle cell projection(GO:0036194) muscle cell projection membrane(GO:0036195) |
| 0.1 | 0.9 | GO:0002193 | MAML1-RBP-Jkappa- ICN1 complex(GO:0002193) |
| 0.1 | 0.4 | GO:0060053 | neurofilament cytoskeleton(GO:0060053) |
| 0.1 | 3.6 | GO:0031092 | platelet alpha granule membrane(GO:0031092) |
| 0.1 | 1.7 | GO:0001931 | uropod(GO:0001931) cell trailing edge(GO:0031254) |
| 0.1 | 0.7 | GO:0036449 | microtubule minus-end(GO:0036449) |
| 0.1 | 0.3 | GO:0035101 | FACT complex(GO:0035101) |
| 0.1 | 1.1 | GO:0042555 | MCM complex(GO:0042555) |
| 0.1 | 0.8 | GO:0030991 | intraciliary transport particle A(GO:0030991) |
| 0.1 | 0.4 | GO:1902560 | GMP reductase complex(GO:1902560) |
| 0.1 | 0.7 | GO:0044354 | pinosome(GO:0044352) macropinosome(GO:0044354) |
| 0.1 | 3.7 | GO:0016528 | sarcoplasm(GO:0016528) |
| 0.1 | 0.6 | GO:0005687 | U4 snRNP(GO:0005687) |
| 0.1 | 1.2 | GO:0042613 | MHC class II protein complex(GO:0042613) |
| 0.1 | 1.4 | GO:0000177 | cytoplasmic exosome (RNase complex)(GO:0000177) |
| 0.1 | 0.2 | GO:0097224 | sperm connecting piece(GO:0097224) |
| 0.1 | 0.6 | GO:0000243 | commitment complex(GO:0000243) |
| 0.1 | 0.3 | GO:1990876 | cytoplasmic side of nuclear pore(GO:1990876) |
| 0.1 | 0.5 | GO:1990578 | perinuclear endoplasmic reticulum membrane(GO:1990578) |
| 0.1 | 0.2 | GO:0070993 | translation preinitiation complex(GO:0070993) |
| 0.1 | 1.5 | GO:0016580 | Sin3 complex(GO:0016580) |
| 0.1 | 0.8 | GO:0031462 | Cul2-RING ubiquitin ligase complex(GO:0031462) |
| 0.1 | 0.7 | GO:0071144 | SMAD2-SMAD3 protein complex(GO:0071144) |
| 0.1 | 0.7 | GO:0005672 | transcription factor TFIIA complex(GO:0005672) |
| 0.1 | 0.2 | GO:0016590 | ACF complex(GO:0016590) |
| 0.1 | 0.9 | GO:0030870 | Mre11 complex(GO:0030870) |
| 0.1 | 0.3 | GO:0034715 | pICln-Sm protein complex(GO:0034715) |
| 0.0 | 0.1 | GO:0031467 | Cul7-RING ubiquitin ligase complex(GO:0031467) |
| 0.0 | 0.7 | GO:0000445 | THO complex(GO:0000347) THO complex part of transcription export complex(GO:0000445) |
| 0.0 | 0.7 | GO:0000812 | Swr1 complex(GO:0000812) |
| 0.0 | 0.1 | GO:0055087 | Ski complex(GO:0055087) |
| 0.0 | 0.1 | GO:0030678 | mitochondrial ribonuclease P complex(GO:0030678) |
| 0.0 | 0.6 | GO:0097197 | tetraspanin-enriched microdomain(GO:0097197) |
| 0.0 | 0.7 | GO:0000778 | condensed nuclear chromosome kinetochore(GO:0000778) |
| 0.0 | 0.1 | GO:0033186 | CAF-1 complex(GO:0033186) |
| 0.0 | 0.5 | GO:0005686 | U2 snRNP(GO:0005686) |
| 0.0 | 0.2 | GO:0045323 | interleukin-1 receptor complex(GO:0045323) |
| 0.0 | 0.7 | GO:0000322 | storage vacuole(GO:0000322) |
| 0.0 | 0.1 | GO:0035189 | Rb-E2F complex(GO:0035189) |
| 0.0 | 0.1 | GO:0001651 | dense fibrillar component(GO:0001651) |
| 0.0 | 0.4 | GO:0033503 | HULC complex(GO:0033503) |
| 0.0 | 0.3 | GO:1990589 | ATF4-CREB1 transcription factor complex(GO:1990589) |
| 0.0 | 0.4 | GO:0097524 | sperm plasma membrane(GO:0097524) |
| 0.0 | 0.3 | GO:0034709 | methylosome(GO:0034709) |
| 0.0 | 0.8 | GO:0032045 | guanyl-nucleotide exchange factor complex(GO:0032045) |
| 0.0 | 1.3 | GO:0005665 | DNA-directed RNA polymerase II, core complex(GO:0005665) |
| 0.0 | 0.7 | GO:0031080 | nuclear pore outer ring(GO:0031080) |
| 0.0 | 0.5 | GO:0005785 | signal recognition particle receptor complex(GO:0005785) |
| 0.0 | 0.2 | GO:0000126 | transcription factor TFIIIB complex(GO:0000126) |
| 0.0 | 0.6 | GO:0030897 | HOPS complex(GO:0030897) |
| 0.0 | 0.6 | GO:0071010 | prespliceosome(GO:0071010) |
| 0.0 | 0.9 | GO:0030056 | hemidesmosome(GO:0030056) |
| 0.0 | 0.7 | GO:0030008 | TRAPP complex(GO:0030008) |
| 0.0 | 0.2 | GO:0071817 | MMXD complex(GO:0071817) |
| 0.0 | 0.5 | GO:0000780 | condensed nuclear chromosome, centromeric region(GO:0000780) |
| 0.0 | 1.0 | GO:0000242 | pericentriolar material(GO:0000242) |
| 0.0 | 0.4 | GO:0072379 | BAT3 complex(GO:0071818) ER membrane insertion complex(GO:0072379) |
| 0.0 | 0.2 | GO:0070826 | paraferritin complex(GO:0070826) |
| 0.0 | 0.3 | GO:0032777 | Piccolo NuA4 histone acetyltransferase complex(GO:0032777) |
| 0.0 | 0.4 | GO:0042105 | alpha-beta T cell receptor complex(GO:0042105) |
| 0.0 | 0.2 | GO:0005958 | DNA-dependent protein kinase-DNA ligase 4 complex(GO:0005958) |
| 0.0 | 0.2 | GO:0044308 | axonal spine(GO:0044308) |
| 0.0 | 0.2 | GO:0036501 | UFD1-NPL4 complex(GO:0036501) |
| 0.0 | 0.4 | GO:0030915 | Smc5-Smc6 complex(GO:0030915) |
| 0.0 | 6.1 | GO:0016605 | PML body(GO:0016605) |
| 0.0 | 0.5 | GO:0035253 | ciliary rootlet(GO:0035253) |
| 0.0 | 0.3 | GO:0034098 | VCP-NPL4-UFD1 AAA ATPase complex(GO:0034098) |
| 0.0 | 0.5 | GO:0005689 | U12-type spliceosomal complex(GO:0005689) |
| 0.0 | 0.3 | GO:0060201 | clathrin-sculpted acetylcholine transport vesicle(GO:0060200) clathrin-sculpted acetylcholine transport vesicle membrane(GO:0060201) |
| 0.0 | 0.2 | GO:0071006 | U2-type catalytic step 1 spliceosome(GO:0071006) |
| 0.0 | 0.1 | GO:1990730 | VCP-NSFL1C complex(GO:1990730) |
| 0.0 | 0.7 | GO:0097539 | ciliary transition fiber(GO:0097539) |
| 0.0 | 0.4 | GO:0005675 | holo TFIIH complex(GO:0005675) |
| 0.0 | 0.3 | GO:0033063 | Rad51B-Rad51C-Rad51D-XRCC2 complex(GO:0033063) |
| 0.0 | 1.4 | GO:0071564 | npBAF complex(GO:0071564) |
| 0.0 | 0.3 | GO:0000220 | vacuolar proton-transporting V-type ATPase, V0 domain(GO:0000220) |
| 0.0 | 0.4 | GO:0042788 | polysomal ribosome(GO:0042788) |
| 0.0 | 0.1 | GO:0010370 | perinucleolar chromocenter(GO:0010370) |
| 0.0 | 0.2 | GO:0032044 | DSIF complex(GO:0032044) |
| 0.0 | 2.6 | GO:0031941 | filamentous actin(GO:0031941) |
| 0.0 | 0.2 | GO:1990031 | pinceau fiber(GO:1990031) |
| 0.0 | 0.3 | GO:0097550 | transcriptional preinitiation complex(GO:0097550) |
| 0.0 | 0.3 | GO:0030905 | retromer, tubulation complex(GO:0030905) |
| 0.0 | 0.3 | GO:0070761 | pre-snoRNP complex(GO:0070761) |
| 0.0 | 0.5 | GO:1990023 | mitotic spindle midzone(GO:1990023) |
| 0.0 | 1.2 | GO:0071437 | invadopodium(GO:0071437) |
| 0.0 | 0.1 | GO:0033150 | cytoskeletal calyx(GO:0033150) |
| 0.0 | 2.3 | GO:0019005 | SCF ubiquitin ligase complex(GO:0019005) |
| 0.0 | 1.7 | GO:0008180 | COP9 signalosome(GO:0008180) |
| 0.0 | 0.2 | GO:0071014 | post-mRNA release spliceosomal complex(GO:0071014) |
| 0.0 | 0.2 | GO:0034688 | integrin alphaM-beta2 complex(GO:0034688) |
| 0.0 | 0.6 | GO:0097038 | perinuclear endoplasmic reticulum(GO:0097038) |
| 0.0 | 0.2 | GO:0005899 | insulin receptor complex(GO:0005899) |
| 0.0 | 0.3 | GO:0001940 | male pronucleus(GO:0001940) |
| 0.0 | 3.6 | GO:0101003 | ficolin-1-rich granule membrane(GO:0101003) |
| 0.0 | 1.2 | GO:0042629 | mast cell granule(GO:0042629) |
| 0.0 | 0.5 | GO:0070937 | CRD-mediated mRNA stability complex(GO:0070937) |
| 0.0 | 0.3 | GO:0048500 | signal recognition particle, endoplasmic reticulum targeting(GO:0005786) signal recognition particle(GO:0048500) |
| 0.0 | 0.1 | GO:1990423 | RZZ complex(GO:1990423) |
| 0.0 | 0.5 | GO:0005885 | Arp2/3 protein complex(GO:0005885) |
| 0.0 | 0.6 | GO:0000815 | ESCRT III complex(GO:0000815) |
| 0.0 | 0.1 | GO:0000333 | telomerase catalytic core complex(GO:0000333) |
| 0.0 | 0.1 | GO:0030891 | VCB complex(GO:0030891) |
| 0.0 | 0.5 | GO:0030015 | CCR4-NOT core complex(GO:0030015) |
| 0.0 | 0.1 | GO:0031510 | SUMO activating enzyme complex(GO:0031510) |
| 0.0 | 0.4 | GO:0005869 | dynactin complex(GO:0005869) |
| 0.0 | 0.3 | GO:0000506 | glycosylphosphatidylinositol-N-acetylglucosaminyltransferase (GPI-GnT) complex(GO:0000506) |
| 0.0 | 0.9 | GO:0030992 | intraciliary transport particle B(GO:0030992) |
| 0.0 | 2.9 | GO:0034707 | chloride channel complex(GO:0034707) |
| 0.0 | 0.6 | GO:0034992 | microtubule organizing center attachment site(GO:0034992) LINC complex(GO:0034993) |
| 0.0 | 0.2 | GO:1990130 | Iml1 complex(GO:1990130) |
| 0.0 | 0.8 | GO:0090533 | cation-transporting ATPase complex(GO:0090533) |
| 0.0 | 0.2 | GO:0070847 | core mediator complex(GO:0070847) |
| 0.0 | 0.5 | GO:0070578 | RISC-loading complex(GO:0070578) |
| 0.0 | 0.6 | GO:0032591 | dendritic spine membrane(GO:0032591) |
| 0.0 | 0.2 | GO:0031313 | extrinsic component of endosome membrane(GO:0031313) |
| 0.0 | 1.0 | GO:0000407 | pre-autophagosomal structure(GO:0000407) |
| 0.0 | 0.6 | GO:0000930 | gamma-tubulin complex(GO:0000930) |
| 0.0 | 0.7 | GO:0005671 | Ada2/Gcn5/Ada3 transcription activator complex(GO:0005671) |
| 0.0 | 0.4 | GO:0033010 | paranodal junction(GO:0033010) |
| 0.0 | 0.5 | GO:0036038 | MKS complex(GO:0036038) |
| 0.0 | 0.4 | GO:0032433 | filopodium tip(GO:0032433) |
| 0.0 | 0.6 | GO:0030877 | beta-catenin destruction complex(GO:0030877) |
| 0.0 | 0.1 | GO:0000799 | nuclear condensin complex(GO:0000799) |
| 0.0 | 0.3 | GO:0005744 | mitochondrial inner membrane presequence translocase complex(GO:0005744) |
| 0.0 | 0.3 | GO:0033178 | proton-transporting two-sector ATPase complex, catalytic domain(GO:0033178) |
| 0.0 | 0.2 | GO:0030061 | mitochondrial crista(GO:0030061) |
| 0.0 | 0.2 | GO:0061689 | tricellular tight junction(GO:0061689) |
| 0.0 | 2.5 | GO:0005643 | nuclear pore(GO:0005643) |
| 0.0 | 0.9 | GO:0030686 | 90S preribosome(GO:0030686) |
| 0.0 | 0.4 | GO:0005666 | DNA-directed RNA polymerase III complex(GO:0005666) |
| 0.0 | 0.7 | GO:0097386 | glial cell projection(GO:0097386) |
| 0.0 | 0.6 | GO:0001518 | voltage-gated sodium channel complex(GO:0001518) |
| 0.0 | 3.7 | GO:0032993 | protein-DNA complex(GO:0032993) |
| 0.0 | 0.1 | GO:0044423 | virion(GO:0019012) virion part(GO:0044423) |
| 0.0 | 0.8 | GO:0044295 | axonal growth cone(GO:0044295) |
| 0.0 | 0.7 | GO:0005779 | integral component of peroxisomal membrane(GO:0005779) intrinsic component of peroxisomal membrane(GO:0031231) |
| 0.0 | 0.1 | GO:0005850 | eukaryotic translation initiation factor 2 complex(GO:0005850) |
| 0.0 | 0.1 | GO:0044307 | dendritic branch(GO:0044307) |
| 0.0 | 0.4 | GO:0043194 | axon initial segment(GO:0043194) |
| 0.0 | 0.1 | GO:0044530 | supraspliceosomal complex(GO:0044530) |
| 0.0 | 0.3 | GO:0005732 | small nucleolar ribonucleoprotein complex(GO:0005732) |
| 0.0 | 0.3 | GO:0010009 | cytoplasmic side of endosome membrane(GO:0010009) |
| 0.0 | 0.3 | GO:0097486 | multivesicular body lumen(GO:0097486) |
| 0.0 | 0.1 | GO:0035339 | SPOTS complex(GO:0035339) |
| 0.0 | 0.2 | GO:0070522 | ERCC4-ERCC1 complex(GO:0070522) |
| 0.0 | 0.1 | GO:0048787 | presynaptic active zone membrane(GO:0048787) |
| 0.0 | 0.1 | GO:0005967 | mitochondrial pyruvate dehydrogenase complex(GO:0005967) |
| 0.0 | 0.7 | GO:0044322 | endoplasmic reticulum quality control compartment(GO:0044322) |
| 0.0 | 0.5 | GO:0030687 | preribosome, large subunit precursor(GO:0030687) |
| 0.0 | 0.2 | GO:0071141 | SMAD protein complex(GO:0071141) |
| 0.0 | 0.2 | GO:0016461 | unconventional myosin complex(GO:0016461) |
| 0.0 | 0.1 | GO:1990745 | EARP complex(GO:1990745) |
| 0.0 | 1.6 | GO:0071013 | catalytic step 2 spliceosome(GO:0071013) |
| 0.0 | 0.2 | GO:0031258 | lamellipodium membrane(GO:0031258) |
| 0.0 | 0.5 | GO:0005669 | transcription factor TFIID complex(GO:0005669) |
| 0.0 | 0.5 | GO:0005892 | acetylcholine-gated channel complex(GO:0005892) |
| 0.0 | 0.3 | GO:0030867 | rough endoplasmic reticulum membrane(GO:0030867) |
| 0.0 | 1.0 | GO:0005801 | cis-Golgi network(GO:0005801) |
| 0.0 | 0.2 | GO:0043189 | NuA4 histone acetyltransferase complex(GO:0035267) H4/H2A histone acetyltransferase complex(GO:0043189) H4 histone acetyltransferase complex(GO:1902562) |
| 0.0 | 0.1 | GO:0061574 | ASAP complex(GO:0061574) |
| 0.0 | 0.3 | GO:0031045 | dense core granule(GO:0031045) |
| 0.0 | 1.6 | GO:0000781 | chromosome, telomeric region(GO:0000781) |
| 0.0 | 0.1 | GO:1990246 | uniplex complex(GO:1990246) |
| 0.0 | 1.3 | GO:0031463 | Cul3-RING ubiquitin ligase complex(GO:0031463) |
| 0.0 | 1.1 | GO:0030670 | phagocytic vesicle membrane(GO:0030670) |
| 0.0 | 0.1 | GO:0000176 | nuclear exosome (RNase complex)(GO:0000176) |
| 0.0 | 2.4 | GO:0043202 | lysosomal lumen(GO:0043202) |
| 0.0 | 0.2 | GO:0043596 | nuclear replication fork(GO:0043596) |
| 0.0 | 1.3 | GO:0000118 | histone deacetylase complex(GO:0000118) |
| 0.0 | 0.2 | GO:0043240 | Fanconi anaemia nuclear complex(GO:0043240) |
| 0.0 | 0.2 | GO:0005657 | replication fork(GO:0005657) |
| 0.0 | 0.6 | GO:1904115 | axon cytoplasm(GO:1904115) |
| 0.0 | 1.8 | GO:0034399 | nuclear periphery(GO:0034399) |
| 0.0 | 0.3 | GO:0005952 | cAMP-dependent protein kinase complex(GO:0005952) |
| 0.0 | 6.4 | GO:0016607 | nuclear speck(GO:0016607) |
| 0.0 | 0.3 | GO:0097346 | Ino80 complex(GO:0031011) DNA helicase complex(GO:0033202) INO80-type complex(GO:0097346) |
| 0.0 | 0.0 | GO:0009346 | citrate lyase complex(GO:0009346) |
| 0.0 | 0.2 | GO:0032040 | small-subunit processome(GO:0032040) |
| 0.0 | 0.1 | GO:0042721 | mitochondrial inner membrane protein insertion complex(GO:0042721) |
| 0.0 | 2.0 | GO:0000775 | chromosome, centromeric region(GO:0000775) |
| 0.0 | 1.6 | GO:0000922 | spindle pole(GO:0000922) |
| 0.0 | 0.8 | GO:0005791 | rough endoplasmic reticulum(GO:0005791) |
| 0.0 | 0.6 | GO:0055038 | recycling endosome membrane(GO:0055038) |
| 0.0 | 0.1 | GO:0005677 | chromatin silencing complex(GO:0005677) |
| 0.0 | 0.1 | GO:0044754 | autolysosome(GO:0044754) |
| 0.0 | 0.8 | GO:0032155 | cell division site(GO:0032153) cell division site part(GO:0032155) |
| 0.0 | 0.1 | GO:0000124 | SAGA complex(GO:0000124) |
| 0.0 | 0.4 | GO:0031235 | intrinsic component of the cytoplasmic side of the plasma membrane(GO:0031235) |
| 0.0 | 0.5 | GO:0030140 | trans-Golgi network transport vesicle(GO:0030140) |
| 0.0 | 0.1 | GO:0005736 | DNA-directed RNA polymerase I complex(GO:0005736) |
| 0.0 | 0.4 | GO:0005680 | anaphase-promoting complex(GO:0005680) |
Gene overrepresentation in molecular function category:
| Log-likelihood per target | Total log-likelihood | Term | Description |
|---|---|---|---|
| 1.0 | 5.2 | GO:0004447 | iodide peroxidase activity(GO:0004447) |
| 0.6 | 4.2 | GO:0004800 | thyroxine 5'-deiodinase activity(GO:0004800) |
| 0.3 | 1.4 | GO:0004452 | isopentenyl-diphosphate delta-isomerase activity(GO:0004452) |
| 0.3 | 1.0 | GO:1904599 | advanced glycation end-product binding(GO:1904599) |
| 0.3 | 2.9 | GO:0019834 | phospholipase A2 inhibitor activity(GO:0019834) |
| 0.3 | 0.9 | GO:0000386 | second spliceosomal transesterification activity(GO:0000386) |
| 0.3 | 0.9 | GO:0050309 | glucose-6-phosphatase activity(GO:0004346) sugar-terminal-phosphatase activity(GO:0050309) |
| 0.3 | 7.1 | GO:0032036 | myosin heavy chain binding(GO:0032036) |
| 0.3 | 0.9 | GO:0015616 | DNA translocase activity(GO:0015616) |
| 0.3 | 1.1 | GO:0070119 | ciliary neurotrophic factor binding(GO:0070119) |
| 0.2 | 3.5 | GO:0031014 | troponin T binding(GO:0031014) |
| 0.2 | 1.2 | GO:0004556 | alpha-amylase activity(GO:0004556) |
| 0.2 | 0.9 | GO:0017077 | oxidative phosphorylation uncoupler activity(GO:0017077) |
| 0.2 | 8.4 | GO:0051371 | muscle alpha-actinin binding(GO:0051371) |
| 0.2 | 0.6 | GO:0086057 | voltage-gated calcium channel activity involved in bundle of His cell action potential(GO:0086057) |
| 0.2 | 1.9 | GO:0015319 | sodium:inorganic phosphate symporter activity(GO:0015319) |
| 0.2 | 0.8 | GO:0050253 | retinyl-palmitate esterase activity(GO:0050253) |
| 0.2 | 1.2 | GO:0005353 | fructose transmembrane transporter activity(GO:0005353) |
| 0.2 | 0.4 | GO:0016160 | amylase activity(GO:0016160) |
| 0.2 | 1.2 | GO:0004597 | peptide-aspartate beta-dioxygenase activity(GO:0004597) |
| 0.2 | 0.9 | GO:0008267 | poly-glutamine tract binding(GO:0008267) |
| 0.2 | 0.7 | GO:0004345 | glucose-6-phosphate dehydrogenase activity(GO:0004345) |
| 0.2 | 0.5 | GO:0046577 | long-chain-alcohol oxidase activity(GO:0046577) |
| 0.2 | 2.2 | GO:0070892 | lipoteichoic acid receptor activity(GO:0070892) |
| 0.2 | 0.5 | GO:0016517 | interleukin-12 receptor activity(GO:0016517) |
| 0.2 | 0.9 | GO:0001069 | regulatory region RNA binding(GO:0001069) |
| 0.2 | 1.6 | GO:0015349 | thyroid hormone transmembrane transporter activity(GO:0015349) |
| 0.2 | 0.7 | GO:0004356 | glutamate-ammonia ligase activity(GO:0004356) ammonia ligase activity(GO:0016211) acid-ammonia (or amide) ligase activity(GO:0016880) |
| 0.2 | 0.6 | GO:0000309 | nicotinamide-nucleotide adenylyltransferase activity(GO:0000309) |
| 0.2 | 1.1 | GO:0004743 | pyruvate kinase activity(GO:0004743) |
| 0.2 | 0.8 | GO:0043035 | chromatin insulator sequence binding(GO:0043035) |
| 0.2 | 0.6 | GO:0047888 | fatty acid peroxidase activity(GO:0047888) |
| 0.2 | 0.5 | GO:0000992 | polymerase III regulatory region sequence-specific DNA binding(GO:0000992) RNA polymerase III type 1 promoter sequence-specific DNA binding(GO:0001002) RNA polymerase III type 2 promoter sequence-specific DNA binding(GO:0001003) |
| 0.2 | 0.9 | GO:0005298 | proline:sodium symporter activity(GO:0005298) |
| 0.2 | 0.6 | GO:0032089 | NACHT domain binding(GO:0032089) |
| 0.2 | 7.1 | GO:0051393 | alpha-actinin binding(GO:0051393) |
| 0.1 | 0.9 | GO:0080019 | fatty-acyl-CoA reductase (alcohol-forming) activity(GO:0080019) |
| 0.1 | 1.2 | GO:0050816 | phosphothreonine binding(GO:0050816) |
| 0.1 | 0.6 | GO:0031208 | POZ domain binding(GO:0031208) |
| 0.1 | 1.4 | GO:0032190 | acrosin binding(GO:0032190) |
| 0.1 | 1.4 | GO:0042835 | BRE binding(GO:0042835) |
| 0.1 | 1.2 | GO:0003873 | 6-phosphofructo-2-kinase activity(GO:0003873) |
| 0.1 | 6.8 | GO:0000146 | microfilament motor activity(GO:0000146) |
| 0.1 | 0.7 | GO:0052591 | sn-glycerol-3-phosphate:ubiquinone oxidoreductase activity(GO:0052590) sn-glycerol-3-phosphate:ubiquinone-8 oxidoreductase activity(GO:0052591) |
| 0.1 | 0.4 | GO:0005174 | CD40 receptor binding(GO:0005174) |
| 0.1 | 0.5 | GO:0004487 | methylenetetrahydrofolate dehydrogenase (NAD+) activity(GO:0004487) |
| 0.1 | 1.2 | GO:0003956 | NAD(P)+-protein-arginine ADP-ribosyltransferase activity(GO:0003956) |
| 0.1 | 0.5 | GO:0008336 | gamma-butyrobetaine dioxygenase activity(GO:0008336) |
| 0.1 | 0.8 | GO:0004376 | glycolipid mannosyltransferase activity(GO:0004376) |
| 0.1 | 0.6 | GO:0030622 | U4atac snRNA binding(GO:0030622) |
| 0.1 | 0.5 | GO:0035514 | DNA demethylase activity(GO:0035514) |
| 0.1 | 0.2 | GO:0008520 | L-ascorbate:sodium symporter activity(GO:0008520) L-ascorbic acid transporter activity(GO:0015229) sodium-dependent L-ascorbate transmembrane transporter activity(GO:0070890) |
| 0.1 | 2.4 | GO:0015250 | water channel activity(GO:0015250) |
| 0.1 | 0.9 | GO:0005220 | inositol 1,4,5-trisphosphate-sensitive calcium-release channel activity(GO:0005220) |
| 0.1 | 0.5 | GO:0051185 | coenzyme transporter activity(GO:0051185) |
| 0.1 | 3.6 | GO:0001011 | transcription factor activity, sequence-specific DNA binding, RNA polymerase recruiting(GO:0001011) transcription factor activity, TFIIB-class binding(GO:0001087) |
| 0.1 | 1.2 | GO:0017040 | ceramidase activity(GO:0017040) |
| 0.1 | 1.5 | GO:0047499 | calcium-independent phospholipase A2 activity(GO:0047499) |
| 0.1 | 1.1 | GO:0035184 | histone threonine kinase activity(GO:0035184) |
| 0.1 | 0.3 | GO:0004958 | prostaglandin F receptor activity(GO:0004958) |
| 0.1 | 0.3 | GO:0004531 | deoxyribonuclease II activity(GO:0004531) |
| 0.1 | 0.5 | GO:0032143 | single thymine insertion binding(GO:0032143) |
| 0.1 | 0.4 | GO:0048248 | CXCR3 chemokine receptor binding(GO:0048248) |
| 0.1 | 0.6 | GO:0004918 | interleukin-8 receptor activity(GO:0004918) |
| 0.1 | 0.5 | GO:0003896 | DNA primase activity(GO:0003896) |
| 0.1 | 0.5 | GO:0033300 | dehydroascorbic acid transporter activity(GO:0033300) |
| 0.1 | 0.6 | GO:0031750 | D3 dopamine receptor binding(GO:0031750) |
| 0.1 | 0.5 | GO:0005010 | insulin-like growth factor-activated receptor activity(GO:0005010) |
| 0.1 | 0.4 | GO:0035939 | microsatellite binding(GO:0035939) |
| 0.1 | 0.8 | GO:0034988 | Fc-gamma receptor I complex binding(GO:0034988) |
| 0.1 | 1.8 | GO:0001055 | RNA polymerase II activity(GO:0001055) |
| 0.1 | 0.6 | GO:0047894 | flavonol 3-sulfotransferase activity(GO:0047894) |
| 0.1 | 1.7 | GO:0097016 | L27 domain binding(GO:0097016) |
| 0.1 | 0.6 | GO:0030171 | voltage-gated proton channel activity(GO:0030171) |
| 0.1 | 0.4 | GO:0035663 | Toll-like receptor 2 binding(GO:0035663) |
| 0.1 | 0.7 | GO:0004111 | creatine kinase activity(GO:0004111) |
| 0.1 | 1.8 | GO:0046625 | sphingolipid binding(GO:0046625) |
| 0.1 | 2.9 | GO:0002162 | dystroglycan binding(GO:0002162) |
| 0.1 | 0.3 | GO:0002135 | CTP binding(GO:0002135) |
| 0.1 | 0.4 | GO:0070012 | oligopeptidase activity(GO:0070012) |
| 0.1 | 0.5 | GO:0000995 | transcription factor activity, core RNA polymerase III binding(GO:0000995) |
| 0.1 | 2.5 | GO:0031005 | filamin binding(GO:0031005) |
| 0.1 | 4.0 | GO:0005540 | hyaluronic acid binding(GO:0005540) |
| 0.1 | 1.7 | GO:0019911 | structural constituent of myelin sheath(GO:0019911) |
| 0.1 | 1.6 | GO:0005344 | oxygen transporter activity(GO:0005344) |
| 0.1 | 0.4 | GO:0004157 | dihydropyrimidinase activity(GO:0004157) |
| 0.1 | 0.3 | GO:0061656 | SUMO conjugating enzyme activity(GO:0061656) |
| 0.1 | 0.6 | GO:0019237 | centromeric DNA binding(GO:0019237) |
| 0.1 | 0.9 | GO:0004634 | phosphopyruvate hydratase activity(GO:0004634) |
| 0.1 | 0.5 | GO:0060961 | phospholipase D inhibitor activity(GO:0060961) |
| 0.1 | 0.3 | GO:0030395 | lactose binding(GO:0030395) |
| 0.1 | 0.4 | GO:0016524 | latrotoxin receptor activity(GO:0016524) |
| 0.1 | 0.2 | GO:0016005 | phospholipase A2 activator activity(GO:0016005) |
| 0.1 | 1.1 | GO:0097371 | MDM2/MDM4 family protein binding(GO:0097371) |
| 0.1 | 1.0 | GO:0019870 | potassium channel inhibitor activity(GO:0019870) |
| 0.1 | 0.3 | GO:0032427 | GBD domain binding(GO:0032427) |
| 0.1 | 0.7 | GO:0008597 | calcium-dependent protein serine/threonine phosphatase regulator activity(GO:0008597) |
| 0.1 | 0.9 | GO:0052834 | inositol monophosphate 1-phosphatase activity(GO:0008934) inositol monophosphate 3-phosphatase activity(GO:0052832) inositol monophosphate 4-phosphatase activity(GO:0052833) inositol monophosphate phosphatase activity(GO:0052834) |
| 0.1 | 0.4 | GO:0004616 | phosphogluconate dehydrogenase (decarboxylating) activity(GO:0004616) |
| 0.1 | 0.3 | GO:1904455 | ubiquitin-specific protease activity involved in negative regulation of ERAD pathway(GO:1904455) |
| 0.1 | 0.9 | GO:0004565 | beta-galactosidase activity(GO:0004565) |
| 0.1 | 1.3 | GO:0005078 | MAP-kinase scaffold activity(GO:0005078) |
| 0.1 | 0.8 | GO:0051575 | 5'-deoxyribose-5-phosphate lyase activity(GO:0051575) |
| 0.1 | 0.3 | GO:1903135 | cupric ion binding(GO:1903135) |
| 0.1 | 1.1 | GO:0032395 | MHC class II receptor activity(GO:0032395) |
| 0.1 | 0.4 | GO:0030377 | urokinase plasminogen activator receptor activity(GO:0030377) |
| 0.1 | 0.5 | GO:0048273 | mitogen-activated protein kinase p38 binding(GO:0048273) |
| 0.1 | 1.5 | GO:0008603 | cAMP-dependent protein kinase regulator activity(GO:0008603) |
| 0.1 | 0.1 | GO:0032564 | adenyl deoxyribonucleotide binding(GO:0032558) dATP binding(GO:0032564) |
| 0.1 | 2.3 | GO:0004697 | protein kinase C activity(GO:0004697) |
| 0.1 | 0.5 | GO:0004883 | glucocorticoid receptor activity(GO:0004883) glucocorticoid-activated RNA polymerase II transcription factor binding transcription factor activity(GO:0038051) |
| 0.1 | 1.2 | GO:0003680 | AT DNA binding(GO:0003680) |
| 0.1 | 0.4 | GO:0003920 | GMP reductase activity(GO:0003920) oxidoreductase activity, acting on NAD(P)H, nitrogenous group as acceptor(GO:0016657) |
| 0.1 | 0.3 | GO:0004449 | isocitrate dehydrogenase (NAD+) activity(GO:0004449) |
| 0.1 | 0.2 | GO:0004711 | ribosomal protein S6 kinase activity(GO:0004711) |
| 0.1 | 0.9 | GO:0015501 | glutamate:sodium symporter activity(GO:0015501) |
| 0.1 | 0.5 | GO:0031962 | mineralocorticoid receptor binding(GO:0031962) |
| 0.1 | 0.4 | GO:0008518 | reduced folate carrier activity(GO:0008518) |
| 0.1 | 2.1 | GO:0051010 | microtubule plus-end binding(GO:0051010) |
| 0.1 | 0.7 | GO:0016929 | SUMO-specific protease activity(GO:0016929) |
| 0.1 | 0.2 | GO:0008240 | tripeptidyl-peptidase activity(GO:0008240) |
| 0.1 | 0.8 | GO:0051880 | G-quadruplex DNA binding(GO:0051880) |
| 0.1 | 0.2 | GO:0005151 | interleukin-1, Type II receptor binding(GO:0005151) |
| 0.1 | 2.6 | GO:0004708 | MAP kinase kinase activity(GO:0004708) |
| 0.1 | 0.3 | GO:0048408 | epidermal growth factor binding(GO:0048408) |
| 0.1 | 0.3 | GO:1990460 | leptin receptor binding(GO:1990460) |
| 0.1 | 0.7 | GO:0004767 | sphingomyelin phosphodiesterase activity(GO:0004767) |
| 0.1 | 0.3 | GO:0001225 | RNA polymerase II transcription coactivator binding(GO:0001225) |
| 0.1 | 0.2 | GO:0004766 | spermidine synthase activity(GO:0004766) |
| 0.1 | 0.4 | GO:0042500 | aspartic endopeptidase activity, intramembrane cleaving(GO:0042500) |
| 0.1 | 0.5 | GO:1990446 | U1 snRNP binding(GO:1990446) |
| 0.1 | 0.3 | GO:0000990 | transcription factor activity, core RNA polymerase binding(GO:0000990) |
| 0.1 | 0.4 | GO:0004430 | 1-phosphatidylinositol 4-kinase activity(GO:0004430) |
| 0.1 | 0.2 | GO:0070053 | thrombospondin receptor activity(GO:0070053) |
| 0.1 | 2.0 | GO:0097200 | cysteine-type endopeptidase activity involved in execution phase of apoptosis(GO:0097200) |
| 0.1 | 1.1 | GO:0043295 | glutathione binding(GO:0043295) |
| 0.1 | 1.6 | GO:0017166 | vinculin binding(GO:0017166) |
| 0.1 | 0.2 | GO:0001034 | RNA polymerase III transcription factor activity, sequence-specific DNA binding(GO:0001034) |
| 0.1 | 0.2 | GO:0030366 | molybdopterin synthase activity(GO:0030366) |
| 0.1 | 0.6 | GO:0000182 | rDNA binding(GO:0000182) |
| 0.1 | 0.5 | GO:0086075 | gap junction channel activity involved in cardiac conduction electrical coupling(GO:0086075) |
| 0.0 | 0.3 | GO:0034714 | type III transforming growth factor beta receptor binding(GO:0034714) |
| 0.0 | 1.8 | GO:0070742 | C2H2 zinc finger domain binding(GO:0070742) |
| 0.0 | 0.1 | GO:0004342 | glucosamine-6-phosphate deaminase activity(GO:0004342) |
| 0.0 | 0.3 | GO:0005119 | smoothened binding(GO:0005119) |
| 0.0 | 0.5 | GO:0086006 | voltage-gated sodium channel activity involved in cardiac muscle cell action potential(GO:0086006) |
| 0.0 | 0.4 | GO:0017050 | sphinganine kinase activity(GO:0008481) D-erythro-sphingosine kinase activity(GO:0017050) |
| 0.0 | 0.3 | GO:0051373 | FATZ binding(GO:0051373) |
| 0.0 | 1.1 | GO:0000150 | recombinase activity(GO:0000150) |
| 0.0 | 0.5 | GO:0000405 | bubble DNA binding(GO:0000405) |
| 0.0 | 0.5 | GO:0031685 | adenosine receptor binding(GO:0031685) |
| 0.0 | 3.6 | GO:0019894 | kinesin binding(GO:0019894) |
| 0.0 | 0.4 | GO:0004609 | phosphatidylserine decarboxylase activity(GO:0004609) |
| 0.0 | 0.9 | GO:0017034 | Rap guanyl-nucleotide exchange factor activity(GO:0017034) |
| 0.0 | 0.2 | GO:0046592 | polyamine oxidase activity(GO:0046592) spermine:oxygen oxidoreductase (spermidine-forming) activity(GO:0052901) |
| 0.0 | 1.2 | GO:0070016 | armadillo repeat domain binding(GO:0070016) |
| 0.0 | 0.1 | GO:0055077 | gap junction hemi-channel activity(GO:0055077) |
| 0.0 | 0.5 | GO:0005168 | neurotrophin TRKA receptor binding(GO:0005168) |
| 0.0 | 2.6 | GO:0046875 | ephrin receptor binding(GO:0046875) |
| 0.0 | 0.9 | GO:0019871 | sodium channel inhibitor activity(GO:0019871) |
| 0.0 | 0.5 | GO:0016842 | amidine-lyase activity(GO:0016842) |
| 0.0 | 0.3 | GO:0004677 | DNA-dependent protein kinase activity(GO:0004677) |
| 0.0 | 0.3 | GO:0008454 | alpha-1,3-mannosylglycoprotein 4-beta-N-acetylglucosaminyltransferase activity(GO:0008454) |
| 0.0 | 11.6 | GO:0044325 | ion channel binding(GO:0044325) |
| 0.0 | 0.2 | GO:0043273 | CTPase activity(GO:0043273) |
| 0.0 | 0.1 | GO:0001094 | TFIID-class transcription factor binding(GO:0001094) |
| 0.0 | 0.6 | GO:0003720 | telomerase activity(GO:0003720) RNA-directed DNA polymerase activity(GO:0003964) |
| 0.0 | 0.5 | GO:0070735 | protein-glycine ligase activity(GO:0070735) |
| 0.0 | 0.2 | GO:0004906 | interferon-gamma receptor activity(GO:0004906) |
| 0.0 | 0.6 | GO:0019534 | toxin transporter activity(GO:0019534) |
| 0.0 | 0.2 | GO:0072345 | NAADP-sensitive calcium-release channel activity(GO:0072345) |
| 0.0 | 1.1 | GO:0005247 | voltage-gated chloride channel activity(GO:0005247) |
| 0.0 | 0.5 | GO:0002161 | aminoacyl-tRNA editing activity(GO:0002161) |
| 0.0 | 0.3 | GO:0030346 | protein phosphatase 2B binding(GO:0030346) |
| 0.0 | 0.3 | GO:0015450 | P-P-bond-hydrolysis-driven protein transmembrane transporter activity(GO:0015450) |
| 0.0 | 2.5 | GO:0003678 | DNA helicase activity(GO:0003678) |
| 0.0 | 0.8 | GO:0005176 | ErbB-2 class receptor binding(GO:0005176) |
| 0.0 | 0.8 | GO:0010314 | phosphatidylinositol-5-phosphate binding(GO:0010314) |
| 0.0 | 0.7 | GO:0061578 | Lys63-specific deubiquitinase activity(GO:0061578) |
| 0.0 | 0.2 | GO:0098625 | methylselenol reductase activity(GO:0098625) methylseleninic acid reductase activity(GO:0098626) |
| 0.0 | 0.2 | GO:0015086 | cadmium ion transmembrane transporter activity(GO:0015086) cobalt ion transmembrane transporter activity(GO:0015087) lead ion transmembrane transporter activity(GO:0015094) ferrous iron uptake transmembrane transporter activity(GO:0015639) |
| 0.0 | 0.6 | GO:0015379 | potassium:chloride symporter activity(GO:0015379) potassium ion symporter activity(GO:0022820) |
| 0.0 | 0.1 | GO:1990259 | protein-glutamine N-methyltransferase activity(GO:0036009) histone-glutamine methyltransferase activity(GO:1990259) |
| 0.0 | 0.3 | GO:0000064 | L-ornithine transmembrane transporter activity(GO:0000064) |
| 0.0 | 0.4 | GO:0042799 | histone methyltransferase activity (H4-K20 specific)(GO:0042799) |
| 0.0 | 0.3 | GO:0030942 | signal recognition particle binding(GO:0005047) endoplasmic reticulum signal peptide binding(GO:0030942) |
| 0.0 | 0.1 | GO:0004583 | dolichyl-phosphate-glucose-glycolipid alpha-glucosyltransferase activity(GO:0004583) |
| 0.0 | 0.2 | GO:0039552 | RIG-I binding(GO:0039552) |
| 0.0 | 0.3 | GO:0004694 | eukaryotic translation initiation factor 2alpha kinase activity(GO:0004694) |
| 0.0 | 0.2 | GO:0048101 | calcium- and calmodulin-regulated 3',5'-cyclic-GMP phosphodiesterase activity(GO:0048101) |
| 0.0 | 0.3 | GO:0016721 | superoxide dismutase activity(GO:0004784) oxidoreductase activity, acting on superoxide radicals as acceptor(GO:0016721) |
| 0.0 | 1.0 | GO:0070006 | metalloaminopeptidase activity(GO:0070006) |
| 0.0 | 2.9 | GO:0001105 | RNA polymerase II transcription coactivator activity(GO:0001105) |
| 0.0 | 0.3 | GO:0001165 | RNA polymerase I upstream control element sequence-specific DNA binding(GO:0001165) |
| 0.0 | 0.2 | GO:0042030 | ATPase inhibitor activity(GO:0042030) |
| 0.0 | 0.6 | GO:0042809 | vitamin D receptor binding(GO:0042809) |
| 0.0 | 1.7 | GO:0008139 | nuclear localization sequence binding(GO:0008139) |
| 0.0 | 0.1 | GO:0016300 | tRNA (uracil) methyltransferase activity(GO:0016300) |
| 0.0 | 0.2 | GO:0047391 | alkylglycerophosphoethanolamine phosphodiesterase activity(GO:0047391) |
| 0.0 | 0.2 | GO:1903136 | cuprous ion binding(GO:1903136) |
| 0.0 | 0.2 | GO:0003827 | alpha-1,3-mannosylglycoprotein 2-beta-N-acetylglucosaminyltransferase activity(GO:0003827) |
| 0.0 | 0.2 | GO:0051021 | GDP-dissociation inhibitor binding(GO:0051021) Rho GDP-dissociation inhibitor binding(GO:0051022) |
| 0.0 | 1.0 | GO:0005212 | structural constituent of eye lens(GO:0005212) |
| 0.0 | 0.3 | GO:0070573 | metallodipeptidase activity(GO:0070573) |
| 0.0 | 0.3 | GO:0019784 | NEDD8-specific protease activity(GO:0019784) |
| 0.0 | 0.1 | GO:0061676 | importin-alpha family protein binding(GO:0061676) |
| 0.0 | 0.1 | GO:0033754 | indoleamine 2,3-dioxygenase activity(GO:0033754) |
| 0.0 | 0.1 | GO:0015633 | zinc transporting ATPase activity(GO:0015633) |
| 0.0 | 0.3 | GO:0071532 | ankyrin repeat binding(GO:0071532) |
| 0.0 | 0.2 | GO:0071535 | RING-like zinc finger domain binding(GO:0071535) |
| 0.0 | 0.3 | GO:0017176 | phosphatidylinositol N-acetylglucosaminyltransferase activity(GO:0017176) |
| 0.0 | 0.4 | GO:0030618 | transforming growth factor beta receptor, pathway-specific cytoplasmic mediator activity(GO:0030618) |
| 0.0 | 0.1 | GO:0070224 | sulfide:quinone oxidoreductase activity(GO:0070224) |
| 0.0 | 2.8 | GO:0004004 | RNA helicase activity(GO:0003724) ATP-dependent RNA helicase activity(GO:0004004) RNA-dependent ATPase activity(GO:0008186) |
| 0.0 | 0.2 | GO:0042015 | interleukin-20 binding(GO:0042015) |
| 0.0 | 0.3 | GO:0030348 | syntaxin-3 binding(GO:0030348) |
| 0.0 | 0.3 | GO:0019863 | IgE binding(GO:0019863) |
| 0.0 | 0.8 | GO:0004143 | diacylglycerol kinase activity(GO:0004143) |
| 0.0 | 1.8 | GO:0004177 | aminopeptidase activity(GO:0004177) |
| 0.0 | 0.3 | GO:0004849 | uridine kinase activity(GO:0004849) |
| 0.0 | 0.2 | GO:0001609 | G-protein coupled adenosine receptor activity(GO:0001609) |
| 0.0 | 0.6 | GO:0043422 | protein kinase B binding(GO:0043422) |
| 0.0 | 0.1 | GO:0016429 | tRNA (adenine-N1-)-methyltransferase activity(GO:0016429) |
| 0.0 | 0.3 | GO:0036435 | K48-linked polyubiquitin binding(GO:0036435) |
| 0.0 | 0.2 | GO:0003960 | NADPH:quinone reductase activity(GO:0003960) |
| 0.0 | 7.4 | GO:0017124 | SH3 domain binding(GO:0017124) |
| 0.0 | 0.1 | GO:0015173 | aromatic amino acid transmembrane transporter activity(GO:0015173) |
| 0.0 | 0.4 | GO:0004971 | AMPA glutamate receptor activity(GO:0004971) |
| 0.0 | 0.1 | GO:0019948 | SUMO activating enzyme activity(GO:0019948) |
| 0.0 | 0.2 | GO:0099529 | neurotransmitter receptor activity involved in regulation of postsynaptic membrane potential(GO:0099529) transmitter-gated ion channel activity involved in regulation of postsynaptic membrane potential(GO:1904315) |
| 0.0 | 0.8 | GO:0043548 | phosphatidylinositol 3-kinase binding(GO:0043548) |
| 0.0 | 0.5 | GO:0004089 | carbonate dehydratase activity(GO:0004089) |
| 0.0 | 0.1 | GO:0042954 | lipoprotein transporter activity(GO:0042954) |
| 0.0 | 0.5 | GO:0038062 | protein tyrosine kinase collagen receptor activity(GO:0038062) |
| 0.0 | 0.1 | GO:0016418 | S-acetyltransferase activity(GO:0016418) |
| 0.0 | 0.3 | GO:0008440 | inositol-1,4,5-trisphosphate 3-kinase activity(GO:0008440) |
| 0.0 | 0.2 | GO:0102008 | cytosolic dipeptidase activity(GO:0102008) |
| 0.0 | 1.0 | GO:0070530 | K63-linked polyubiquitin binding(GO:0070530) |
| 0.0 | 0.4 | GO:0001056 | RNA polymerase III activity(GO:0001056) |
| 0.0 | 0.3 | GO:0004128 | cytochrome-b5 reductase activity, acting on NAD(P)H(GO:0004128) |
| 0.0 | 0.2 | GO:0032027 | myosin light chain binding(GO:0032027) |
| 0.0 | 1.0 | GO:0031593 | polyubiquitin binding(GO:0031593) |
| 0.0 | 1.0 | GO:1990841 | promoter-specific chromatin binding(GO:1990841) |
| 0.0 | 0.5 | GO:0001161 | intronic transcription regulatory region sequence-specific DNA binding(GO:0001161) intronic transcription regulatory region DNA binding(GO:0044213) |
| 0.0 | 0.2 | GO:0043813 | phosphatidylinositol-3,5-bisphosphate 5-phosphatase activity(GO:0043813) |
| 0.0 | 1.9 | GO:0017112 | Rab guanyl-nucleotide exchange factor activity(GO:0017112) |
| 0.0 | 0.3 | GO:0000268 | peroxisome targeting sequence binding(GO:0000268) |
| 0.0 | 0.1 | GO:0035575 | histone demethylase activity (H4-K20 specific)(GO:0035575) |
| 0.0 | 0.7 | GO:0008499 | UDP-galactose:beta-N-acetylglucosamine beta-1,3-galactosyltransferase activity(GO:0008499) |
| 0.0 | 0.5 | GO:0051019 | mitogen-activated protein kinase binding(GO:0051019) |
| 0.0 | 3.6 | GO:0036459 | thiol-dependent ubiquitinyl hydrolase activity(GO:0036459) ubiquitinyl hydrolase activity(GO:0101005) |
| 0.0 | 0.1 | GO:0016230 | sphingomyelin phosphodiesterase activator activity(GO:0016230) |
| 0.0 | 0.4 | GO:0003899 | DNA-directed RNA polymerase activity(GO:0003899) |
| 0.0 | 0.1 | GO:0046403 | polynucleotide 3'-phosphatase activity(GO:0046403) |
| 0.0 | 0.3 | GO:0038132 | neuregulin binding(GO:0038132) |
| 0.0 | 0.4 | GO:0032453 | histone demethylase activity (H3-K4 specific)(GO:0032453) |
| 0.0 | 0.4 | GO:0005391 | sodium:potassium-exchanging ATPase activity(GO:0005391) |
| 0.0 | 0.3 | GO:0010857 | calcium-dependent protein serine/threonine kinase activity(GO:0009931) calcium-dependent protein kinase activity(GO:0010857) |
| 0.0 | 1.0 | GO:0004435 | phosphatidylinositol phospholipase C activity(GO:0004435) |
| 0.0 | 0.9 | GO:0070840 | dynein complex binding(GO:0070840) |
| 0.0 | 0.1 | GO:0032393 | MHC class I receptor activity(GO:0032393) |
| 0.0 | 1.2 | GO:0030507 | spectrin binding(GO:0030507) |
| 0.0 | 0.2 | GO:0004704 | NF-kappaB-inducing kinase activity(GO:0004704) |
| 0.0 | 0.4 | GO:0015172 | L-glutamate transmembrane transporter activity(GO:0005313) acidic amino acid transmembrane transporter activity(GO:0015172) |
| 0.0 | 0.1 | GO:0004814 | arginine-tRNA ligase activity(GO:0004814) |
| 0.0 | 0.3 | GO:0004716 | receptor signaling protein tyrosine kinase activity(GO:0004716) |
| 0.0 | 0.3 | GO:0035198 | miRNA binding(GO:0035198) |
| 0.0 | 0.2 | GO:0003726 | double-stranded RNA adenosine deaminase activity(GO:0003726) |
| 0.0 | 0.2 | GO:0044547 | DNA topoisomerase binding(GO:0044547) |
| 0.0 | 0.1 | GO:0002094 | polyprenyltransferase activity(GO:0002094) |
| 0.0 | 0.1 | GO:0045322 | unmethylated CpG binding(GO:0045322) |
| 0.0 | 0.5 | GO:0042800 | histone methyltransferase activity (H3-K4 specific)(GO:0042800) |
| 0.0 | 0.4 | GO:0008301 | DNA binding, bending(GO:0008301) |
| 0.0 | 0.1 | GO:0004949 | cannabinoid receptor activity(GO:0004949) |
| 0.0 | 0.2 | GO:0030274 | LIM domain binding(GO:0030274) |
| 0.0 | 1.0 | GO:0042162 | telomeric DNA binding(GO:0042162) |
| 0.0 | 0.7 | GO:0030506 | ankyrin binding(GO:0030506) |
| 0.0 | 0.2 | GO:0070740 | tubulin-glutamic acid ligase activity(GO:0070740) |
| 0.0 | 0.2 | GO:0004687 | myosin light chain kinase activity(GO:0004687) |
| 0.0 | 0.3 | GO:0005432 | calcium:sodium antiporter activity(GO:0005432) |
| 0.0 | 0.2 | GO:1990599 | 3' overhang single-stranded DNA endodeoxyribonuclease activity(GO:1990599) |
| 0.0 | 6.7 | GO:0061630 | ubiquitin protein ligase activity(GO:0061630) |
| 0.0 | 0.2 | GO:0001851 | complement component C3b binding(GO:0001851) |
| 0.0 | 0.2 | GO:0017150 | tRNA dihydrouridine synthase activity(GO:0017150) |
| 0.0 | 0.2 | GO:0005237 | inhibitory extracellular ligand-gated ion channel activity(GO:0005237) |
| 0.0 | 0.6 | GO:0071837 | HMG box domain binding(GO:0071837) |
| 0.0 | 0.2 | GO:0043533 | inositol 1,3,4,5 tetrakisphosphate binding(GO:0043533) |
| 0.0 | 0.1 | GO:0015433 | peptide antigen-transporting ATPase activity(GO:0015433) |
| 0.0 | 0.1 | GO:0097157 | pre-mRNA intronic binding(GO:0097157) |
| 0.0 | 0.1 | GO:0004803 | transposase activity(GO:0004803) |
| 0.0 | 0.2 | GO:0030368 | interleukin-17 receptor activity(GO:0030368) |
| 0.0 | 0.1 | GO:0052810 | 1-phosphatidylinositol-5-kinase activity(GO:0052810) |
| 0.0 | 0.4 | GO:0001784 | phosphotyrosine binding(GO:0001784) |
| 0.0 | 0.2 | GO:0019103 | pyrimidine nucleotide binding(GO:0019103) |
| 0.0 | 0.2 | GO:0005068 | transmembrane receptor protein tyrosine kinase adaptor activity(GO:0005068) |
| 0.0 | 0.1 | GO:0004366 | glycerol-3-phosphate O-acyltransferase activity(GO:0004366) |
| 0.0 | 0.1 | GO:1904854 | proteasome core complex binding(GO:1904854) |
| 0.0 | 2.0 | GO:0005254 | chloride channel activity(GO:0005254) |
| 0.0 | 0.2 | GO:0070290 | N-acylphosphatidylethanolamine-specific phospholipase D activity(GO:0070290) |
| 0.0 | 0.7 | GO:0003950 | NAD+ ADP-ribosyltransferase activity(GO:0003950) |
| 0.0 | 0.1 | GO:0005483 | soluble NSF attachment protein activity(GO:0005483) |
| 0.0 | 0.2 | GO:0008097 | 5S rRNA binding(GO:0008097) |
| 0.0 | 0.5 | GO:0022848 | acetylcholine-gated cation channel activity(GO:0022848) |
| 0.0 | 0.3 | GO:0045028 | G-protein coupled nucleotide receptor activity(GO:0001608) G-protein coupled purinergic nucleotide receptor activity(GO:0045028) |
| 0.0 | 0.1 | GO:0035374 | chondroitin sulfate binding(GO:0035374) |
| 0.0 | 0.9 | GO:0050681 | androgen receptor binding(GO:0050681) |
| 0.0 | 0.3 | GO:0004691 | cAMP-dependent protein kinase activity(GO:0004691) |
| 0.0 | 0.5 | GO:0008327 | methyl-CpG binding(GO:0008327) |
| 0.0 | 0.4 | GO:0019789 | SUMO transferase activity(GO:0019789) |
| 0.0 | 0.4 | GO:0005123 | death receptor binding(GO:0005123) |
| 0.0 | 0.5 | GO:0008574 | ATP-dependent microtubule motor activity, plus-end-directed(GO:0008574) |
| 0.0 | 0.3 | GO:0008429 | phosphatidylethanolamine binding(GO:0008429) |
| 0.0 | 5.8 | GO:0004842 | ubiquitin-protein transferase activity(GO:0004842) |
| 0.0 | 0.1 | GO:0070087 | chromo shadow domain binding(GO:0070087) |
| 0.0 | 0.2 | GO:0017056 | structural constituent of nuclear pore(GO:0017056) |
| 0.0 | 0.4 | GO:0070034 | telomerase RNA binding(GO:0070034) |
| 0.0 | 0.1 | GO:0047493 | sphingomyelin synthase activity(GO:0033188) ceramide cholinephosphotransferase activity(GO:0047493) |
| 0.0 | 0.4 | GO:0035035 | histone acetyltransferase binding(GO:0035035) |
| 0.0 | 0.1 | GO:0001075 | transcription factor activity, RNA polymerase II core promoter sequence-specific binding involved in preinitiation complex assembly(GO:0001075) |
| 0.0 | 0.2 | GO:0034236 | protein kinase A catalytic subunit binding(GO:0034236) |
| 0.0 | 0.2 | GO:0010859 | calcium-dependent cysteine-type endopeptidase inhibitor activity(GO:0010859) |
| 0.0 | 0.1 | GO:0097322 | 7SK snRNA binding(GO:0097322) |
| 0.0 | 1.0 | GO:0004402 | histone acetyltransferase activity(GO:0004402) |
| 0.0 | 0.2 | GO:0004465 | lipoprotein lipase activity(GO:0004465) |
| 0.0 | 0.1 | GO:0043515 | kinetochore binding(GO:0043515) |
| 0.0 | 0.0 | GO:0004483 | mRNA (nucleoside-2'-O-)-methyltransferase activity(GO:0004483) |
| 0.0 | 0.2 | GO:0052629 | phosphatidylinositol-3,5-bisphosphate 3-phosphatase activity(GO:0052629) |
| 0.0 | 0.1 | GO:0016454 | serine C-palmitoyltransferase activity(GO:0004758) C-palmitoyltransferase activity(GO:0016454) |
| 0.0 | 0.5 | GO:0036002 | pre-mRNA binding(GO:0036002) |
| 0.0 | 0.2 | GO:0050291 | sphingosine N-acyltransferase activity(GO:0050291) |
| 0.0 | 0.5 | GO:0005521 | lamin binding(GO:0005521) |
| 0.0 | 0.5 | GO:0051721 | protein phosphatase 2A binding(GO:0051721) |
| 0.0 | 0.4 | GO:0017025 | TBP-class protein binding(GO:0017025) |
| 0.0 | 0.1 | GO:0031730 | CCR5 chemokine receptor binding(GO:0031730) |
| 0.0 | 3.0 | GO:0051015 | actin filament binding(GO:0051015) |
| 0.0 | 0.5 | GO:0008157 | protein phosphatase 1 binding(GO:0008157) |
| 0.0 | 0.0 | GO:0003878 | ATP citrate synthase activity(GO:0003878) |
| 0.0 | 0.2 | GO:0008428 | ribonuclease inhibitor activity(GO:0008428) |
| 0.0 | 0.1 | GO:0004594 | pantothenate kinase activity(GO:0004594) |
| 0.0 | 0.5 | GO:0000175 | 3'-5'-exoribonuclease activity(GO:0000175) exoribonuclease activity, producing 5'-phosphomonoesters(GO:0016896) |
| 0.0 | 0.5 | GO:0005184 | neuropeptide hormone activity(GO:0005184) |
| 0.0 | 0.5 | GO:0044183 | protein binding involved in protein folding(GO:0044183) |
| 0.0 | 0.3 | GO:0033038 | bitter taste receptor activity(GO:0033038) |
| 0.0 | 0.1 | GO:0050510 | N-acetylgalactosaminyl-proteoglycan 3-beta-glucuronosyltransferase activity(GO:0050510) |
| 0.0 | 1.5 | GO:0019208 | phosphatase regulator activity(GO:0019208) |
| 0.0 | 2.4 | GO:0005089 | Rho guanyl-nucleotide exchange factor activity(GO:0005089) |
| 0.0 | 0.1 | GO:0003689 | DNA clamp loader activity(GO:0003689) protein-DNA loading ATPase activity(GO:0033170) |
| 0.0 | 0.1 | GO:0008273 | calcium, potassium:sodium antiporter activity(GO:0008273) |
| 0.0 | 0.0 | GO:0051734 | ATP-dependent polydeoxyribonucleotide 5'-hydroxyl-kinase activity(GO:0046404) polydeoxyribonucleotide kinase activity(GO:0051733) ATP-dependent polynucleotide kinase activity(GO:0051734) |
| 0.0 | 3.7 | GO:0044822 | mRNA binding(GO:0003729) poly(A) RNA binding(GO:0044822) |
| 0.0 | 0.2 | GO:0022821 | potassium ion antiporter activity(GO:0022821) |
| 0.0 | 0.1 | GO:0070182 | DNA polymerase binding(GO:0070182) |
| 0.0 | 0.0 | GO:0004917 | interleukin-7 receptor activity(GO:0004917) |
| 0.0 | 0.1 | GO:0005157 | macrophage colony-stimulating factor receptor binding(GO:0005157) |
| 0.0 | 0.1 | GO:0042609 | CD4 receptor binding(GO:0042609) |
| 0.0 | 0.1 | GO:0050659 | N-acetylgalactosamine 4-sulfate 6-O-sulfotransferase activity(GO:0050659) |
| 0.0 | 0.1 | GO:0070644 | vitamin D response element binding(GO:0070644) |
| 0.0 | 0.1 | GO:0031681 | G-protein beta-subunit binding(GO:0031681) |
| 0.0 | 0.2 | GO:0071889 | 14-3-3 protein binding(GO:0071889) |
| 0.0 | 0.2 | GO:0047372 | acylglycerol lipase activity(GO:0047372) |
Gene overrepresentation in curated gene sets: canonical pathways category:
| Log-likelihood per target | Total log-likelihood | Term | Description |
|---|---|---|---|
| 0.2 | 5.3 | PID THROMBIN PAR4 PATHWAY | PAR4-mediated thrombin signaling events |
| 0.2 | 0.2 | PID ERB GENOMIC PATHWAY | Validated nuclear estrogen receptor beta network |
| 0.1 | 3.1 | PID P38 GAMMA DELTA PATHWAY | Signaling mediated by p38-gamma and p38-delta |
| 0.1 | 1.5 | ST PAC1 RECEPTOR PATHWAY | PAC1 Receptor Pathway |
| 0.1 | 0.5 | ST PHOSPHOINOSITIDE 3 KINASE PATHWAY | PI3K Pathway |
| 0.1 | 8.3 | PID AMB2 NEUTROPHILS PATHWAY | amb2 Integrin signaling |
| 0.1 | 3.7 | SA MMP CYTOKINE CONNECTION | Cytokines can induce activation of matrix metalloproteinases, which degrade extracellular matrix. |
| 0.1 | 0.8 | PID INTEGRIN3 PATHWAY | Beta3 integrin cell surface interactions |
| 0.1 | 1.3 | PID INTEGRIN2 PATHWAY | Beta2 integrin cell surface interactions |
| 0.1 | 2.4 | PID TOLL ENDOGENOUS PATHWAY | Endogenous TLR signaling |
| 0.1 | 0.5 | PID IL27 PATHWAY | IL27-mediated signaling events |
| 0.1 | 0.4 | PID AVB3 INTEGRIN PATHWAY | Integrins in angiogenesis |
| 0.1 | 1.4 | ST G ALPHA S PATHWAY | G alpha s Pathway |
| 0.0 | 1.9 | SA FAS SIGNALING | The TNF-type receptor Fas induces apoptosis on ligand binding. |
| 0.0 | 2.1 | ST WNT CA2 CYCLIC GMP PATHWAY | Wnt/Ca2+/cyclic GMP signaling. |
| 0.0 | 1.4 | PID INSULIN GLUCOSE PATHWAY | Insulin-mediated glucose transport |
| 0.0 | 1.5 | SA PTEN PATHWAY | PTEN is a tumor suppressor that dephosphorylates the lipid messenger phosphatidylinositol triphosphate. |
| 0.0 | 3.5 | PID ERBB1 INTERNALIZATION PATHWAY | Internalization of ErbB1 |
| 0.0 | 2.2 | PID IL8 CXCR2 PATHWAY | IL8- and CXCR2-mediated signaling events |
| 0.0 | 1.8 | PID MYC PATHWAY | C-MYC pathway |
| 0.0 | 1.2 | PID NCADHERIN PATHWAY | N-cadherin signaling events |
| 0.0 | 2.1 | PID LIS1 PATHWAY | Lissencephaly gene (LIS1) in neuronal migration and development |
| 0.0 | 1.0 | PID DNA PK PATHWAY | DNA-PK pathway in nonhomologous end joining |
| 0.0 | 1.5 | PID REELIN PATHWAY | Reelin signaling pathway |
| 0.0 | 2.6 | PID CD8 TCR PATHWAY | TCR signaling in naïve CD8+ T cells |
| 0.0 | 3.8 | PID LKB1 PATHWAY | LKB1 signaling events |
| 0.0 | 0.4 | PID ECADHERIN KERATINOCYTE PATHWAY | E-cadherin signaling in keratinocytes |
| 0.0 | 2.2 | PID FOXO PATHWAY | FoxO family signaling |
| 0.0 | 0.3 | PID MET PATHWAY | Signaling events mediated by Hepatocyte Growth Factor Receptor (c-Met) |
| 0.0 | 2.6 | PID FCER1 PATHWAY | Fc-epsilon receptor I signaling in mast cells |
| 0.0 | 1.5 | PID SMAD2 3PATHWAY | Regulation of cytoplasmic and nuclear SMAD2/3 signaling |
| 0.0 | 1.5 | PID MAPK TRK PATHWAY | Trk receptor signaling mediated by the MAPK pathway |
| 0.0 | 1.4 | PID PS1 PATHWAY | Presenilin action in Notch and Wnt signaling |
| 0.0 | 1.9 | PID ECADHERIN NASCENT AJ PATHWAY | E-cadherin signaling in the nascent adherens junction |
| 0.0 | 1.6 | PID WNT NONCANONICAL PATHWAY | Noncanonical Wnt signaling pathway |
| 0.0 | 2.2 | PID ILK PATHWAY | Integrin-linked kinase signaling |
| 0.0 | 0.9 | PID RHOA PATHWAY | RhoA signaling pathway |
| 0.0 | 4.5 | PID BETA CATENIN NUC PATHWAY | Regulation of nuclear beta catenin signaling and target gene transcription |
| 0.0 | 0.9 | PID P38 MK2 PATHWAY | p38 signaling mediated by MAPKAP kinases |
| 0.0 | 1.1 | PID WNT CANONICAL PATHWAY | Canonical Wnt signaling pathway |
| 0.0 | 0.3 | SIG CD40PATHWAYMAP | Genes related to CD40 signaling |
| 0.0 | 1.0 | PID RAS PATHWAY | Regulation of Ras family activation |
| 0.0 | 2.0 | PID AR TF PATHWAY | Regulation of Androgen receptor activity |
| 0.0 | 1.3 | PID TNF PATHWAY | TNF receptor signaling pathway |
| 0.0 | 0.4 | ST GAQ PATHWAY | G alpha q Pathway |
| 0.0 | 0.6 | PID HIF1A PATHWAY | Hypoxic and oxygen homeostasis regulation of HIF-1-alpha |
| 0.0 | 0.2 | PID CXCR3 PATHWAY | CXCR3-mediated signaling events |
| 0.0 | 0.5 | PID CD40 PATHWAY | CD40/CD40L signaling |
| 0.0 | 0.9 | PID A6B1 A6B4 INTEGRIN PATHWAY | a6b1 and a6b4 Integrin signaling |
| 0.0 | 0.8 | PID FAK PATHWAY | Signaling events mediated by focal adhesion kinase |
| 0.0 | 0.2 | PID NECTIN PATHWAY | Nectin adhesion pathway |
| 0.0 | 0.6 | PID PTP1B PATHWAY | Signaling events mediated by PTP1B |
| 0.0 | 0.7 | PID P53 REGULATION PATHWAY | p53 pathway |
| 0.0 | 0.2 | PID FGF PATHWAY | FGF signaling pathway |
| 0.0 | 0.9 | PID ATR PATHWAY | ATR signaling pathway |
| 0.0 | 0.6 | PID THROMBIN PAR1 PATHWAY | PAR1-mediated thrombin signaling events |
| 0.0 | 0.3 | PID HEDGEHOG 2PATHWAY | Signaling events mediated by the Hedgehog family |
| 0.0 | 0.1 | SIG PIP3 SIGNALING IN B LYMPHOCYTES | Genes related to PIP3 signaling in B lymphocytes |
| 0.0 | 0.6 | PID DELTA NP63 PATHWAY | Validated transcriptional targets of deltaNp63 isoforms |
| 0.0 | 0.6 | PID ERBB4 PATHWAY | ErbB4 signaling events |
| 0.0 | 0.3 | PID INTEGRIN A4B1 PATHWAY | Alpha4 beta1 integrin signaling events |
| 0.0 | 0.3 | PID IL3 PATHWAY | IL3-mediated signaling events |
| 0.0 | 0.2 | PID TCR PATHWAY | TCR signaling in naïve CD4+ T cells |
| 0.0 | 0.9 | PID CASPASE PATHWAY | Caspase cascade in apoptosis |
Gene overrepresentation in curated gene sets: REACTOME pathways category:
| Log-likelihood per target | Total log-likelihood | Term | Description |
|---|---|---|---|
| 0.4 | 9.4 | REACTOME AMINE DERIVED HORMONES | Genes involved in Amine-derived hormones |
| 0.2 | 0.9 | REACTOME APC C CDH1 MEDIATED DEGRADATION OF CDC20 AND OTHER APC C CDH1 TARGETED PROTEINS IN LATE MITOSIS EARLY G1 | Genes involved in APC/C:Cdh1 mediated degradation of Cdc20 and other APC/C:Cdh1 targeted proteins in late mitosis/early G1 |
| 0.2 | 2.4 | REACTOME DIGESTION OF DIETARY CARBOHYDRATE | Genes involved in Digestion of dietary carbohydrate |
| 0.1 | 2.2 | REACTOME PASSIVE TRANSPORT BY AQUAPORINS | Genes involved in Passive Transport by Aquaporins |
| 0.1 | 9.5 | REACTOME STRIATED MUSCLE CONTRACTION | Genes involved in Striated Muscle Contraction |
| 0.1 | 2.7 | REACTOME PURINE SALVAGE | Genes involved in Purine salvage |
| 0.1 | 0.2 | REACTOME ADP SIGNALLING THROUGH P2RY12 | Genes involved in ADP signalling through P2Y purinoceptor 12 |
| 0.1 | 3.1 | REACTOME ACTIVATED TAK1 MEDIATES P38 MAPK ACTIVATION | Genes involved in activated TAK1 mediates p38 MAPK activation |
| 0.1 | 2.0 | REACTOME HYALURONAN UPTAKE AND DEGRADATION | Genes involved in Hyaluronan uptake and degradation |
| 0.1 | 3.0 | REACTOME IONOTROPIC ACTIVITY OF KAINATE RECEPTORS | Genes involved in Ionotropic activity of Kainate Receptors |
| 0.1 | 1.8 | REACTOME VIRAL MESSENGER RNA SYNTHESIS | Genes involved in Viral Messenger RNA Synthesis |
| 0.1 | 0.6 | REACTOME INHIBITION OF REPLICATION INITIATION OF DAMAGED DNA BY RB1 E2F1 | Genes involved in Inhibition of replication initiation of damaged DNA by RB1/E2F1 |
| 0.1 | 1.4 | REACTOME TRANSLOCATION OF ZAP 70 TO IMMUNOLOGICAL SYNAPSE | Genes involved in Translocation of ZAP-70 to Immunological synapse |
| 0.1 | 0.3 | REACTOME RAS ACTIVATION UOPN CA2 INFUX THROUGH NMDA RECEPTOR | Genes involved in Ras activation uopn Ca2+ infux through NMDA receptor |
| 0.1 | 1.7 | REACTOME CS DS DEGRADATION | Genes involved in CS/DS degradation |
| 0.1 | 3.5 | REACTOME DARPP 32 EVENTS | Genes involved in DARPP-32 events |
| 0.1 | 2.5 | REACTOME CELL EXTRACELLULAR MATRIX INTERACTIONS | Genes involved in Cell-extracellular matrix interactions |
| 0.1 | 1.2 | REACTOME IL 6 SIGNALING | Genes involved in Interleukin-6 signaling |
| 0.1 | 1.0 | REACTOME TAK1 ACTIVATES NFKB BY PHOSPHORYLATION AND ACTIVATION OF IKKS COMPLEX | Genes involved in TAK1 activates NFkB by phosphorylation and activation of IKKs complex |
| 0.1 | 2.0 | REACTOME DOWNSTREAM TCR SIGNALING | Genes involved in Downstream TCR signaling |
| 0.1 | 0.2 | REACTOME IRAK2 MEDIATED ACTIVATION OF TAK1 COMPLEX UPON TLR7 8 OR 9 STIMULATION | Genes involved in IRAK2 mediated activation of TAK1 complex upon TLR7/8 or 9 stimulation |
| 0.1 | 0.8 | REACTOME PACKAGING OF TELOMERE ENDS | Genes involved in Packaging Of Telomere Ends |
| 0.1 | 0.9 | REACTOME UNWINDING OF DNA | Genes involved in Unwinding of DNA |
| 0.1 | 1.9 | REACTOME EXTRINSIC PATHWAY FOR APOPTOSIS | Genes involved in Extrinsic Pathway for Apoptosis |
| 0.1 | 0.6 | REACTOME ENDOSOMAL VACUOLAR PATHWAY | Genes involved in Endosomal/Vacuolar pathway |
| 0.1 | 1.9 | REACTOME PLATELET SENSITIZATION BY LDL | Genes involved in Platelet sensitization by LDL |
| 0.0 | 0.9 | REACTOME SYNTHESIS OF PIPS AT THE LATE ENDOSOME MEMBRANE | Genes involved in Synthesis of PIPs at the late endosome membrane |
| 0.0 | 4.4 | REACTOME MYOGENESIS | Genes involved in Myogenesis |
| 0.0 | 2.5 | REACTOME ANTIGEN ACTIVATES B CELL RECEPTOR LEADING TO GENERATION OF SECOND MESSENGERS | Genes involved in Antigen Activates B Cell Receptor Leading to Generation of Second Messengers |
| 0.0 | 1.6 | REACTOME CREB PHOSPHORYLATION THROUGH THE ACTIVATION OF CAMKII | Genes involved in CREB phosphorylation through the activation of CaMKII |
| 0.0 | 1.0 | REACTOME RECRUITMENT OF NUMA TO MITOTIC CENTROSOMES | Genes involved in Recruitment of NuMA to mitotic centrosomes |
| 0.0 | 1.2 | REACTOME NOTCH HLH TRANSCRIPTION PATHWAY | Genes involved in Notch-HLH transcription pathway |
| 0.0 | 0.8 | REACTOME INTEGRATION OF PROVIRUS | Genes involved in Integration of provirus |
| 0.0 | 2.3 | REACTOME ASSOCIATION OF TRIC CCT WITH TARGET PROTEINS DURING BIOSYNTHESIS | Genes involved in Association of TriC/CCT with target proteins during biosynthesis |
| 0.0 | 0.4 | REACTOME DOWNREGULATION OF ERBB2 ERBB3 SIGNALING | Genes involved in Downregulation of ERBB2:ERBB3 signaling |
| 0.0 | 0.7 | REACTOME REVERSIBLE HYDRATION OF CARBON DIOXIDE | Genes involved in Reversible Hydration of Carbon Dioxide |
| 0.0 | 0.6 | REACTOME THE NLRP3 INFLAMMASOME | Genes involved in The NLRP3 inflammasome |
| 0.0 | 0.6 | REACTOME INFLAMMASOMES | Genes involved in Inflammasomes |
| 0.0 | 1.4 | REACTOME FORMATION OF INCISION COMPLEX IN GG NER | Genes involved in Formation of incision complex in GG-NER |
| 0.0 | 0.4 | REACTOME APOPTOSIS INDUCED DNA FRAGMENTATION | Genes involved in Apoptosis induced DNA fragmentation |
| 0.0 | 2.2 | REACTOME GLYCOLYSIS | Genes involved in Glycolysis |
| 0.0 | 1.1 | REACTOME RNA POL III TRANSCRIPTION INITIATION FROM TYPE 2 PROMOTER | Genes involved in RNA Polymerase III Transcription Initiation From Type 2 Promoter |
| 0.0 | 0.2 | REACTOME INFLUENZA VIRAL RNA TRANSCRIPTION AND REPLICATION | Genes involved in Influenza Viral RNA Transcription and Replication |
| 0.0 | 0.2 | REACTOME NFKB ACTIVATION THROUGH FADD RIP1 PATHWAY MEDIATED BY CASPASE 8 AND10 | Genes involved in NF-kB activation through FADD/RIP-1 pathway mediated by caspase-8 and -10 |
| 0.0 | 0.6 | REACTOME PRE NOTCH TRANSCRIPTION AND TRANSLATION | Genes involved in Pre-NOTCH Transcription and Translation |
| 0.0 | 1.0 | REACTOME SYNTHESIS OF GLYCOSYLPHOSPHATIDYLINOSITOL GPI | Genes involved in Synthesis of glycosylphosphatidylinositol (GPI) |
| 0.0 | 0.4 | REACTOME REGULATED PROTEOLYSIS OF P75NTR | Genes involved in Regulated proteolysis of p75NTR |
| 0.0 | 1.0 | REACTOME SYNTHESIS OF PA | Genes involved in Synthesis of PA |
| 0.0 | 1.4 | REACTOME CHOLESTEROL BIOSYNTHESIS | Genes involved in Cholesterol biosynthesis |
| 0.0 | 0.9 | REACTOME NOREPINEPHRINE NEUROTRANSMITTER RELEASE CYCLE | Genes involved in Norepinephrine Neurotransmitter Release Cycle |
| 0.0 | 1.2 | REACTOME ANTIGEN PROCESSING CROSS PRESENTATION | Genes involved in Antigen processing-Cross presentation |
| 0.0 | 0.7 | REACTOME ACYL CHAIN REMODELLING OF PI | Genes involved in Acyl chain remodelling of PI |
| 0.0 | 1.7 | REACTOME INTERACTION BETWEEN L1 AND ANKYRINS | Genes involved in Interaction between L1 and Ankyrins |
| 0.0 | 0.5 | REACTOME PYRIMIDINE CATABOLISM | Genes involved in Pyrimidine catabolism |
| 0.0 | 0.8 | REACTOME SIGNALING BY FGFR1 FUSION MUTANTS | Genes involved in Signaling by FGFR1 fusion mutants |
| 0.0 | 1.9 | REACTOME MEIOTIC SYNAPSIS | Genes involved in Meiotic Synapsis |
| 0.0 | 0.5 | REACTOME ELONGATION ARREST AND RECOVERY | Genes involved in Elongation arrest and recovery |
| 0.0 | 1.7 | REACTOME GLUCOSE TRANSPORT | Genes involved in Glucose transport |
| 0.0 | 1.3 | REACTOME G BETA GAMMA SIGNALLING THROUGH PI3KGAMMA | Genes involved in G beta:gamma signalling through PI3Kgamma |
| 0.0 | 0.3 | REACTOME REGULATION OF SIGNALING BY CBL | Genes involved in Regulation of signaling by CBL |
| 0.0 | 0.8 | REACTOME CASPASE MEDIATED CLEAVAGE OF CYTOSKELETAL PROTEINS | Genes involved in Caspase-mediated cleavage of cytoskeletal proteins |
| 0.0 | 0.8 | REACTOME AMINO ACID SYNTHESIS AND INTERCONVERSION TRANSAMINATION | Genes involved in Amino acid synthesis and interconversion (transamination) |
| 0.0 | 0.6 | REACTOME GENERATION OF SECOND MESSENGER MOLECULES | Genes involved in Generation of second messenger molecules |
| 0.0 | 0.1 | REACTOME RNA POL I PROMOTER OPENING | Genes involved in RNA Polymerase I Promoter Opening |
| 0.0 | 1.0 | REACTOME RECYCLING PATHWAY OF L1 | Genes involved in Recycling pathway of L1 |
| 0.0 | 1.1 | REACTOME THE ROLE OF NEF IN HIV1 REPLICATION AND DISEASE PATHOGENESIS | Genes involved in The role of Nef in HIV-1 replication and disease pathogenesis |
| 0.0 | 7.7 | REACTOME ANTIGEN PROCESSING UBIQUITINATION PROTEASOME DEGRADATION | Genes involved in Antigen processing: Ubiquitination & Proteasome degradation |
| 0.0 | 0.4 | REACTOME UNBLOCKING OF NMDA RECEPTOR GLUTAMATE BINDING AND ACTIVATION | Genes involved in Unblocking of NMDA receptor, glutamate binding and activation |
| 0.0 | 0.1 | REACTOME BASIGIN INTERACTIONS | Genes involved in Basigin interactions |
| 0.0 | 0.4 | REACTOME POST TRANSLATIONAL MODIFICATION SYNTHESIS OF GPI ANCHORED PROTEINS | Genes involved in Post-translational modification: synthesis of GPI-anchored proteins |
| 0.0 | 0.7 | REACTOME PEROXISOMAL LIPID METABOLISM | Genes involved in Peroxisomal lipid metabolism |
| 0.0 | 0.4 | REACTOME PURINE RIBONUCLEOSIDE MONOPHOSPHATE BIOSYNTHESIS | Genes involved in Purine ribonucleoside monophosphate biosynthesis |
| 0.0 | 0.4 | REACTOME SIGNAL REGULATORY PROTEIN SIRP FAMILY INTERACTIONS | Genes involved in Signal regulatory protein (SIRP) family interactions |
| 0.0 | 2.1 | REACTOME IMMUNOREGULATORY INTERACTIONS BETWEEN A LYMPHOID AND A NON LYMPHOID CELL | Genes involved in Immunoregulatory interactions between a Lymphoid and a non-Lymphoid cell |
| 0.0 | 0.4 | REACTOME ACTIVATION OF BH3 ONLY PROTEINS | Genes involved in Activation of BH3-only proteins |
| 0.0 | 3.1 | REACTOME MRNA SPLICING | Genes involved in mRNA Splicing |
| 0.0 | 0.8 | REACTOME NEGATIVE REGULATORS OF RIG I MDA5 SIGNALING | Genes involved in Negative regulators of RIG-I/MDA5 signaling |
| 0.0 | 0.1 | REACTOME ADP SIGNALLING THROUGH P2RY1 | Genes involved in ADP signalling through P2Y purinoceptor 1 |
| 0.0 | 2.1 | REACTOME NRAGE SIGNALS DEATH THROUGH JNK | Genes involved in NRAGE signals death through JNK |
| 0.0 | 0.4 | REACTOME TRANSPORT OF ORGANIC ANIONS | Genes involved in Transport of organic anions |
| 0.0 | 0.5 | REACTOME POST CHAPERONIN TUBULIN FOLDING PATHWAY | Genes involved in Post-chaperonin tubulin folding pathway |
| 0.0 | 1.3 | REACTOME NUCLEAR SIGNALING BY ERBB4 | Genes involved in Nuclear signaling by ERBB4 |
| 0.0 | 0.5 | REACTOME DCC MEDIATED ATTRACTIVE SIGNALING | Genes involved in DCC mediated attractive signaling |
| 0.0 | 0.7 | REACTOME GABA A RECEPTOR ACTIVATION | Genes involved in GABA A receptor activation |
| 0.0 | 1.3 | REACTOME MITOTIC PROMETAPHASE | Genes involved in Mitotic Prometaphase |
| 0.0 | 0.9 | REACTOME TGF BETA RECEPTOR SIGNALING ACTIVATES SMADS | Genes involved in TGF-beta receptor signaling activates SMADs |
| 0.0 | 1.5 | REACTOME LOSS OF NLP FROM MITOTIC CENTROSOMES | Genes involved in Loss of Nlp from mitotic centrosomes |
| 0.0 | 0.2 | REACTOME ADVANCED GLYCOSYLATION ENDPRODUCT RECEPTOR SIGNALING | Genes involved in Advanced glycosylation endproduct receptor signaling |
| 0.0 | 3.2 | REACTOME SIGNALING BY RHO GTPASES | Genes involved in Signaling by Rho GTPases |
| 0.0 | 0.3 | REACTOME N GLYCAN ANTENNAE ELONGATION | Genes involved in N-Glycan antennae elongation |
| 0.0 | 1.1 | REACTOME GLYCOSPHINGOLIPID METABOLISM | Genes involved in Glycosphingolipid metabolism |
| 0.0 | 0.1 | REACTOME TRAF6 MEDIATED INDUCTION OF NFKB AND MAP KINASES UPON TLR7 8 OR 9 ACTIVATION | Genes involved in TRAF6 mediated induction of NFkB and MAP kinases upon TLR7/8 or 9 activation |
| 0.0 | 0.5 | REACTOME NETRIN1 SIGNALING | Genes involved in Netrin-1 signaling |
| 0.0 | 0.9 | REACTOME MYD88 MAL CASCADE INITIATED ON PLASMA MEMBRANE | Genes involved in MyD88:Mal cascade initiated on plasma membrane |
| 0.0 | 0.6 | REACTOME REGULATION OF GENE EXPRESSION IN BETA CELLS | Genes involved in Regulation of gene expression in beta cells |
| 0.0 | 0.5 | REACTOME DEPOSITION OF NEW CENPA CONTAINING NUCLEOSOMES AT THE CENTROMERE | Genes involved in Deposition of New CENPA-containing Nucleosomes at the Centromere |
| 0.0 | 0.1 | REACTOME ACYL CHAIN REMODELLING OF PC | Genes involved in Acyl chain remodelling of PC |
| 0.0 | 0.5 | REACTOME SULFUR AMINO ACID METABOLISM | Genes involved in Sulfur amino acid metabolism |
| 0.0 | 0.3 | REACTOME MRNA DECAY BY 5 TO 3 EXORIBONUCLEASE | Genes involved in mRNA Decay by 5' to 3' Exoribonuclease |
| 0.0 | 0.7 | REACTOME EFFECTS OF PIP2 HYDROLYSIS | Genes involved in Effects of PIP2 hydrolysis |
| 0.0 | 0.4 | REACTOME DOUBLE STRAND BREAK REPAIR | Genes involved in Double-Strand Break Repair |
| 0.0 | 0.3 | REACTOME METABOLISM OF POLYAMINES | Genes involved in Metabolism of polyamines |
| 0.0 | 0.3 | REACTOME PYRIMIDINE METABOLISM | Genes involved in Pyrimidine metabolism |
| 0.0 | 2.4 | REACTOME NONSENSE MEDIATED DECAY ENHANCED BY THE EXON JUNCTION COMPLEX | Genes involved in Nonsense Mediated Decay Enhanced by the Exon Junction Complex |
| 0.0 | 0.4 | REACTOME NA CL DEPENDENT NEUROTRANSMITTER TRANSPORTERS | Genes involved in Na+/Cl- dependent neurotransmitter transporters |
| 0.0 | 0.2 | REACTOME HORMONE SENSITIVE LIPASE HSL MEDIATED TRIACYLGLYCEROL HYDROLYSIS | Genes involved in Hormone-sensitive lipase (HSL)-mediated triacylglycerol hydrolysis |
| 0.0 | 0.2 | REACTOME ACTIVATION OF RAC | Genes involved in Activation of Rac |
| 0.0 | 0.3 | REACTOME RNA POL II PRE TRANSCRIPTION EVENTS | Genes involved in RNA Polymerase II Pre-transcription Events |
| 0.0 | 0.1 | REACTOME GAP JUNCTION DEGRADATION | Genes involved in Gap junction degradation |
| 0.0 | 0.2 | REACTOME DESTABILIZATION OF MRNA BY TRISTETRAPROLIN TTP | Genes involved in Destabilization of mRNA by Tristetraprolin (TTP) |
| 0.0 | 0.3 | REACTOME LYSOSOME VESICLE BIOGENESIS | Genes involved in Lysosome Vesicle Biogenesis |