Project
Illumina Body Map 2 (GSE30611)
Navigation
Downloads
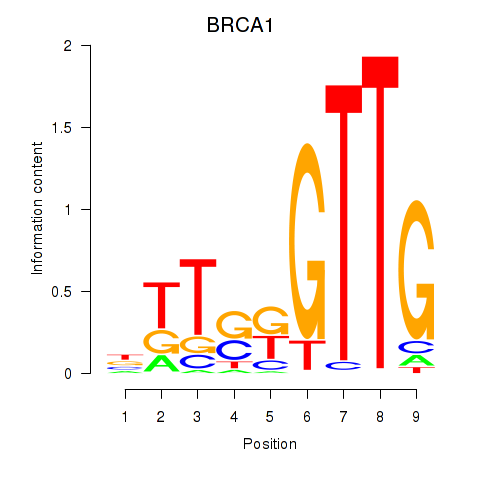
Results for BRCA1
Z-value: 0.53
Motif logo
Transcription factors associated with BRCA1
| Gene Symbol | Gene ID | Gene Info |
|---|---|---|
|
BRCA1
|
ENSG00000012048.23 | BRCA1 DNA repair associated |
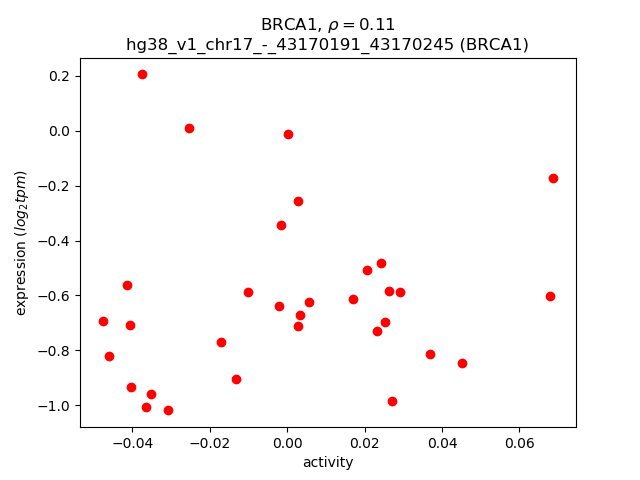
Activity-expression correlation:
| Gene | Promoter | Pearson corr. coef. | P-value | Plot |
|---|---|---|---|---|
| BRCA1 | hg38_v1_chr17_-_43170191_43170245 | 0.11 | 5.7e-01 | Click! |
Activity profile of BRCA1 motif
Sorted Z-values of BRCA1 motif
| Promoter | Log-likelihood | Transcript | Gene | Gene Info |
|---|---|---|---|---|
| chr11_+_124919244 | 2.01 |
ENST00000408930.6
|
HEPN1
|
hepatocellular carcinoma, down-regulated 1 |
| chr14_-_59630806 | 1.78 |
ENST00000342503.8
|
RTN1
|
reticulon 1 |
| chr1_+_159171607 | 1.66 |
ENST00000368124.8
ENST00000368125.9 ENST00000416746.1 |
CADM3
|
cell adhesion molecule 3 |
| chr14_-_59630582 | 1.63 |
ENST00000395090.5
|
RTN1
|
reticulon 1 |
| chr2_-_157325808 | 1.45 |
ENST00000410096.6
ENST00000420719.6 ENST00000409216.5 ENST00000419116.2 |
ERMN
|
ermin |
| chr2_-_49974083 | 1.06 |
ENST00000636345.1
|
NRXN1
|
neurexin 1 |
| chr6_+_12717660 | 0.92 |
ENST00000674637.1
|
PHACTR1
|
phosphatase and actin regulator 1 |
| chr19_+_45467988 | 0.79 |
ENST00000615753.4
ENST00000585836.5 ENST00000417353.6 ENST00000591858.5 ENST00000443841.6 ENST00000590335.1 ENST00000353609.8 |
FOSB
|
FosB proto-oncogene, AP-1 transcription factor subunit |
| chr13_-_49444004 | 0.75 |
ENST00000410043.5
ENST00000409308.6 |
CAB39L
|
calcium binding protein 39 like |
| chr4_+_625555 | 0.71 |
ENST00000496514.6
ENST00000255622.10 |
PDE6B
|
phosphodiesterase 6B |
| chr1_+_84181630 | 0.70 |
ENST00000610457.1
|
PRKACB
|
protein kinase cAMP-activated catalytic subunit beta |
| chr10_-_24706622 | 0.68 |
ENST00000680286.1
|
ARHGAP21
|
Rho GTPase activating protein 21 |
| chr2_-_157325659 | 0.67 |
ENST00000409925.1
|
ERMN
|
ermin |
| chr10_-_114632011 | 0.64 |
ENST00000651023.1
|
ABLIM1
|
actin binding LIM protein 1 |
| chr3_-_127736329 | 0.59 |
ENST00000398101.7
|
MGLL
|
monoglyceride lipase |
| chr10_+_120851341 | 0.56 |
ENST00000263461.11
|
WDR11
|
WD repeat domain 11 |
| chr14_+_31561376 | 0.54 |
ENST00000550649.5
ENST00000281081.12 |
NUBPL
|
nucleotide binding protein like |
| chr7_-_78771265 | 0.51 |
ENST00000630991.2
ENST00000629359.2 |
MAGI2
|
membrane associated guanylate kinase, WW and PDZ domain containing 2 |
| chr11_+_101914997 | 0.50 |
ENST00000263468.13
|
CEP126
|
centrosomal protein 126 |
| chr5_+_140700437 | 0.49 |
ENST00000274712.8
|
ZMAT2
|
zinc finger matrin-type 2 |
| chr10_-_100529854 | 0.48 |
ENST00000370320.4
ENST00000299166.9 ENST00000370322.5 |
NDUFB8
|
NADH:ubiquinone oxidoreductase subunit B8 |
| chr2_-_144517506 | 0.47 |
ENST00000431672.4
ENST00000558170.6 |
ZEB2
|
zinc finger E-box binding homeobox 2 |
| chr4_-_48780242 | 0.46 |
ENST00000507711.5
ENST00000358350.9 |
FRYL
|
FRY like transcription coactivator |
| chr10_+_120851427 | 0.45 |
ENST00000604585.5
|
WDR11
|
WD repeat domain 11 |
| chr2_-_144517663 | 0.44 |
ENST00000427902.5
ENST00000462355.2 ENST00000470879.5 ENST00000409487.7 ENST00000435831.5 ENST00000630572.2 |
ZEB2
|
zinc finger E-box binding homeobox 2 |
| chr2_-_49973939 | 0.43 |
ENST00000630656.1
|
NRXN1
|
neurexin 1 |
| chr11_+_33258304 | 0.43 |
ENST00000531504.5
ENST00000456517.2 |
HIPK3
|
homeodomain interacting protein kinase 3 |
| chr13_+_27251569 | 0.42 |
ENST00000272274.8
ENST00000319826.8 ENST00000326092.8 |
RPL21
|
ribosomal protein L21 |
| chr2_+_108378176 | 0.42 |
ENST00000409309.3
|
SULT1C4
|
sulfotransferase family 1C member 4 |
| chr5_+_126462339 | 0.42 |
ENST00000502348.5
|
GRAMD2B
|
GRAM domain containing 2B |
| chr13_+_27251545 | 0.42 |
ENST00000311549.11
|
RPL21
|
ribosomal protein L21 |
| chr4_+_73436244 | 0.41 |
ENST00000226359.2
|
AFP
|
alpha fetoprotein |
| chr4_+_73436198 | 0.39 |
ENST00000395792.7
|
AFP
|
alpha fetoprotein |
| chr11_-_13463168 | 0.36 |
ENST00000526841.1
ENST00000278174.10 ENST00000529708.5 ENST00000528120.5 |
BTBD10
|
BTB domain containing 10 |
| chr2_+_195657308 | 0.36 |
ENST00000418005.1
|
SLC39A10
|
solute carrier family 39 member 10 |
| chrX_-_71068384 | 0.35 |
ENST00000276105.3
ENST00000622259.4 |
SNX12
|
sorting nexin 12 |
| chr9_-_83978429 | 0.35 |
ENST00000351839.7
|
HNRNPK
|
heterogeneous nuclear ribonucleoprotein K |
| chr9_-_21031614 | 0.35 |
ENST00000495827.3
|
HACD4
|
3-hydroxyacyl-CoA dehydratase 4 |
| chr3_-_116445458 | 0.34 |
ENST00000490035.7
|
LSAMP
|
limbic system associated membrane protein |
| chr8_-_17002327 | 0.33 |
ENST00000180166.6
|
FGF20
|
fibroblast growth factor 20 |
| chr11_-_72112750 | 0.31 |
ENST00000545680.5
ENST00000543587.5 ENST00000538393.5 ENST00000535234.5 ENST00000227618.8 ENST00000535503.5 |
ANAPC15
|
anaphase promoting complex subunit 15 |
| chr1_-_170074568 | 0.27 |
ENST00000367767.5
ENST00000361580.7 ENST00000538366.5 |
KIFAP3
|
kinesin associated protein 3 |
| chr3_+_184338826 | 0.27 |
ENST00000453072.5
|
FAM131A
|
family with sequence similarity 131 member A |
| chr19_+_47130782 | 0.26 |
ENST00000597808.5
ENST00000413379.7 ENST00000600706.5 ENST00000270225.12 ENST00000598840.5 ENST00000600753.1 ENST00000392776.3 |
SAE1
|
SUMO1 activating enzyme subunit 1 |
| chr7_-_78770859 | 0.26 |
ENST00000636717.1
|
MAGI2
|
membrane associated guanylate kinase, WW and PDZ domain containing 2 |
| chr11_-_61429934 | 0.26 |
ENST00000541963.5
ENST00000477890.6 ENST00000439958.8 |
CPSF7
|
cleavage and polyadenylation specific factor 7 |
| chr14_+_22040576 | 0.25 |
ENST00000390448.3
|
TRAV20
|
T cell receptor alpha variable 20 |
| chr7_-_78771058 | 0.24 |
ENST00000628781.1
|
MAGI2
|
membrane associated guanylate kinase, WW and PDZ domain containing 2 |
| chr11_-_61430008 | 0.23 |
ENST00000394888.8
|
CPSF7
|
cleavage and polyadenylation specific factor 7 |
| chr2_+_108377947 | 0.23 |
ENST00000272452.7
|
SULT1C4
|
sulfotransferase family 1C member 4 |
| chr6_-_158999748 | 0.22 |
ENST00000449822.5
|
RSPH3
|
radial spoke head 3 |
| chr7_+_100119607 | 0.21 |
ENST00000262932.5
|
CNPY4
|
canopy FGF signaling regulator 4 |
| chr3_-_177196451 | 0.20 |
ENST00000430069.5
ENST00000630796.2 ENST00000428970.5 |
TBL1XR1
|
TBL1X receptor 1 |
| chr12_-_116881431 | 0.20 |
ENST00000257572.5
|
HRK
|
harakiri, BCL2 interacting protein |
| chr8_+_96761232 | 0.20 |
ENST00000521142.1
|
CPQ
|
carboxypeptidase Q |
| chr3_-_177196402 | 0.20 |
ENST00000437738.5
ENST00000424913.5 ENST00000443315.5 |
TBL1XR1
|
TBL1X receptor 1 |
| chr6_+_33204645 | 0.18 |
ENST00000374662.4
|
HSD17B8
|
hydroxysteroid 17-beta dehydrogenase 8 |
| chr11_+_1099730 | 0.18 |
ENST00000674892.1
|
MUC2
|
mucin 2, oligomeric mucus/gel-forming |
| chr11_+_61430036 | 0.18 |
ENST00000541135.5
|
ENSG00000256591.5
|
novel transcript |
| chr2_-_151261839 | 0.17 |
ENST00000331426.6
|
RBM43
|
RNA binding motif protein 43 |
| chr7_-_78771108 | 0.17 |
ENST00000626691.2
|
MAGI2
|
membrane associated guanylate kinase, WW and PDZ domain containing 2 |
| chr8_-_80171106 | 0.16 |
ENST00000519303.6
|
TPD52
|
tumor protein D52 |
| chr14_+_22163226 | 0.16 |
ENST00000390458.3
|
TRAV29DV5
|
T cell receptor alpha variable 29/delta variable 5 |
| chr19_-_34677157 | 0.16 |
ENST00000601241.6
|
SCGB2B2
|
secretoglobin family 2B member 2 |
| chr4_-_184649436 | 0.16 |
ENST00000308394.9
ENST00000517513.5 ENST00000447121.2 ENST00000393588.8 ENST00000523916.5 |
CASP3
|
caspase 3 |
| chr12_-_80937918 | 0.16 |
ENST00000552864.6
|
LIN7A
|
lin-7 homolog A, crumbs cell polarity complex component |
| chr17_+_76376581 | 0.15 |
ENST00000591651.5
ENST00000545180.5 |
SPHK1
|
sphingosine kinase 1 |
| chr14_-_68794597 | 0.14 |
ENST00000336440.3
|
ZFP36L1
|
ZFP36 ring finger protein like 1 |
| chr15_+_57248015 | 0.13 |
ENST00000559710.5
ENST00000559703.1 |
TCF12
|
transcription factor 12 |
| chr8_+_96760974 | 0.13 |
ENST00000519484.1
|
CPQ
|
carboxypeptidase Q |
| chr14_+_72926377 | 0.13 |
ENST00000353777.7
ENST00000358377.7 ENST00000394234.6 ENST00000509153.5 ENST00000555042.5 |
DCAF4
|
DDB1 and CUL4 associated factor 4 |
| chrX_-_143635081 | 0.12 |
ENST00000338017.8
|
SLITRK4
|
SLIT and NTRK like family member 4 |
| chr1_-_160262501 | 0.12 |
ENST00000447377.5
|
DCAF8
|
DDB1 and CUL4 associated factor 8 |
| chr14_+_88385643 | 0.12 |
ENST00000393545.9
ENST00000356583.9 ENST00000555401.5 ENST00000553885.5 |
SPATA7
|
spermatogenesis associated 7 |
| chr9_+_2015969 | 0.12 |
ENST00000636903.1
ENST00000637352.1 |
SMARCA2
|
SWI/SNF related, matrix associated, actin dependent regulator of chromatin, subfamily a, member 2 |
| chr13_-_30464234 | 0.12 |
ENST00000399489.5
ENST00000339872.8 |
HMGB1
|
high mobility group box 1 |
| chr20_+_58907981 | 0.11 |
ENST00000656419.1
|
GNAS
|
GNAS complex locus |
| chr19_-_37172670 | 0.11 |
ENST00000588354.1
ENST00000292841.10 ENST00000356958.8 |
ZNF585A
|
zinc finger protein 585A |
| chr18_-_26091175 | 0.11 |
ENST00000579061.5
ENST00000542420.6 |
SS18
|
SS18 subunit of BAF chromatin remodeling complex |
| chr5_+_146203544 | 0.11 |
ENST00000506502.2
|
ENSG00000275740.1
|
novel readthrough transcript |
| chr1_+_171557845 | 0.10 |
ENST00000644916.1
|
PRRC2C
|
proline rich coiled-coil 2C |
| chr13_+_102799322 | 0.09 |
ENST00000639132.1
|
BIVM-ERCC5
|
BIVM-ERCC5 readthrough |
| chr12_-_95116967 | 0.09 |
ENST00000551521.5
|
FGD6
|
FYVE, RhoGEF and PH domain containing 6 |
| chr11_-_119340914 | 0.09 |
ENST00000634633.1
|
C1QTNF5
|
C1q and TNF related 5 |
| chr5_+_146203593 | 0.09 |
ENST00000265271.7
|
RBM27
|
RNA binding motif protein 27 |
| chr20_-_49913693 | 0.09 |
ENST00000422556.1
|
SPATA2
|
spermatogenesis associated 2 |
| chr12_-_66678934 | 0.09 |
ENST00000545666.5
ENST00000398016.7 ENST00000359742.9 ENST00000538211.5 |
GRIP1
|
glutamate receptor interacting protein 1 |
| chr19_-_12801787 | 0.08 |
ENST00000334482.9
ENST00000301522.3 |
PRDX2
|
peroxiredoxin 2 |
| chr12_+_401621 | 0.08 |
ENST00000412006.6
ENST00000239830.9 |
CCDC77
|
coiled-coil domain containing 77 |
| chr17_-_43661915 | 0.08 |
ENST00000318579.9
ENST00000393661.2 |
MEOX1
|
mesenchyme homeobox 1 |
| chr10_-_73625951 | 0.07 |
ENST00000433394.1
ENST00000422491.7 |
USP54
|
ubiquitin specific peptidase 54 |
| chr2_-_133568393 | 0.07 |
ENST00000317721.10
ENST00000405974.7 ENST00000409261.6 ENST00000409213.5 |
NCKAP5
|
NCK associated protein 5 |
| chr6_-_43014254 | 0.06 |
ENST00000642748.1
|
MEA1
|
male-enhanced antigen 1 |
| chr20_-_35438218 | 0.05 |
ENST00000374369.8
|
GDF5
|
growth differentiation factor 5 |
| chr2_-_179049986 | 0.05 |
ENST00000409284.1
ENST00000443758.6 ENST00000446116.5 |
CCDC141
|
coiled-coil domain containing 141 |
| chr1_+_161766282 | 0.05 |
ENST00000680688.1
|
ATF6
|
activating transcription factor 6 |
| chr1_+_161766347 | 0.04 |
ENST00000679833.1
|
ATF6
|
activating transcription factor 6 |
| chr11_+_73308237 | 0.04 |
ENST00000263674.4
|
ARHGEF17
|
Rho guanine nucleotide exchange factor 17 |
| chr19_+_48469354 | 0.04 |
ENST00000452733.7
ENST00000641098.1 |
CYTH2
|
cytohesin 2 |
| chr9_-_92424427 | 0.04 |
ENST00000375550.5
|
OMD
|
osteomodulin |
| chr6_+_16129077 | 0.03 |
ENST00000356840.8
ENST00000349606.4 |
MYLIP
|
myosin regulatory light chain interacting protein |
| chr6_-_170553216 | 0.03 |
ENST00000262193.7
|
PSMB1
|
proteasome 20S subunit beta 1 |
| chr2_+_203014721 | 0.03 |
ENST00000683091.1
|
NBEAL1
|
neurobeachin like 1 |
| chr11_-_61429385 | 0.03 |
ENST00000413184.6
|
CPSF7
|
cleavage and polyadenylation specific factor 7 |
| chr6_-_159000174 | 0.03 |
ENST00000367069.7
|
RSPH3
|
radial spoke head 3 |
| chr13_+_29428603 | 0.02 |
ENST00000380808.6
|
MTUS2
|
microtubule associated scaffold protein 2 |
| chr11_-_27700472 | 0.01 |
ENST00000418212.5
ENST00000533246.5 |
BDNF
|
brain derived neurotrophic factor |
| chr14_+_21042352 | 0.01 |
ENST00000298690.5
|
RNASE7
|
ribonuclease A family member 7 |
| chr13_+_29428709 | 0.01 |
ENST00000542829.1
|
MTUS2
|
microtubule associated scaffold protein 2 |
| chr22_+_41621163 | 0.01 |
ENST00000428575.6
|
XRCC6
|
X-ray repair cross complementing 6 |
| chr2_-_24972032 | 0.00 |
ENST00000534855.5
|
DNAJC27
|
DnaJ heat shock protein family (Hsp40) member C27 |
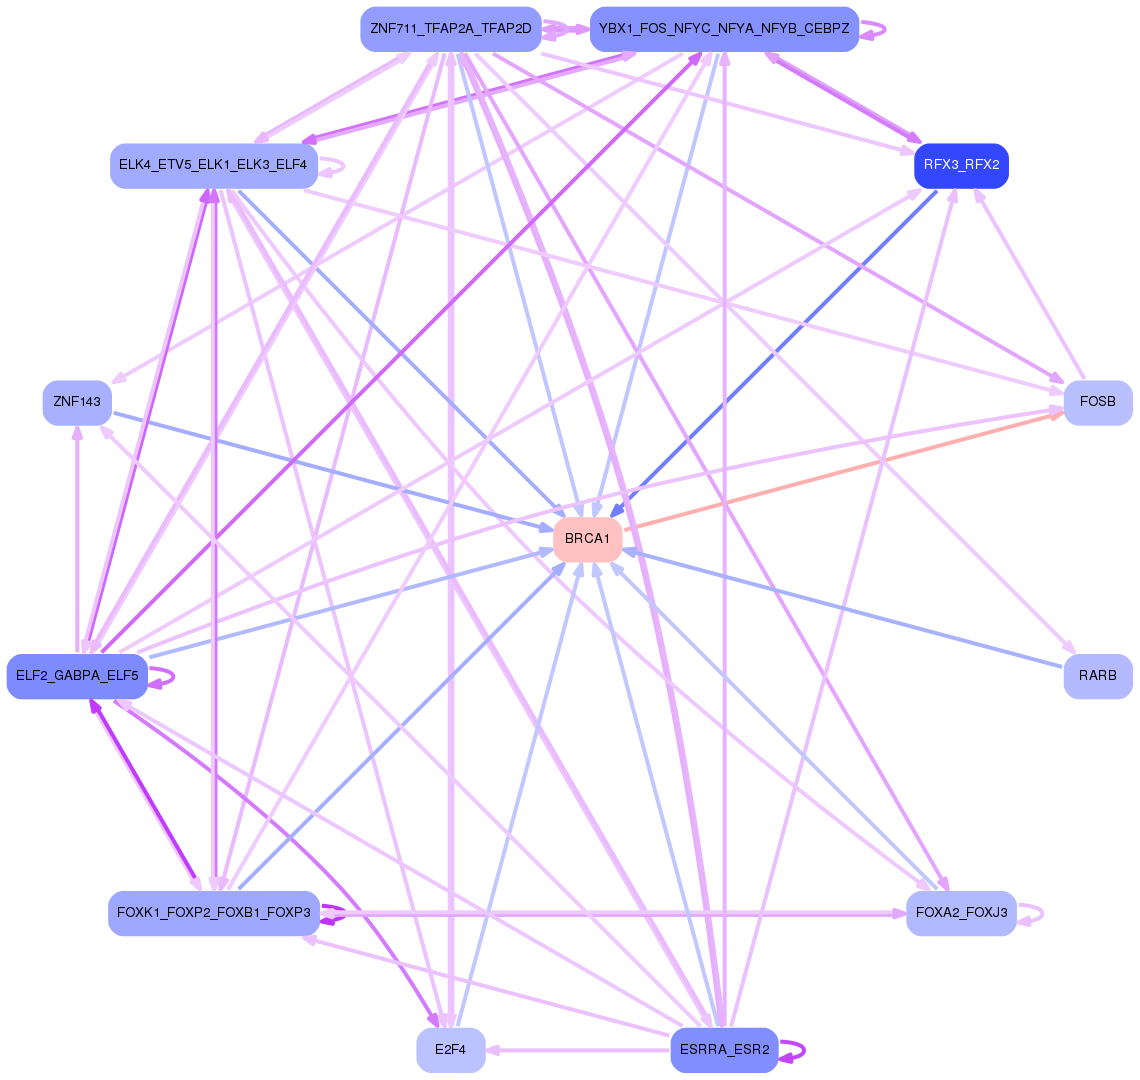
Network of associatons between targets according to the STRING database.

First level regulatory network of BRCA1
Gene Ontology Analysis
Gene overrepresentation in biological process category:
| Log-likelihood per target | Total log-likelihood | Term | Description |
|---|---|---|---|
| 0.1 | 0.3 | GO:2000642 | negative regulation of early endosome to late endosome transport(GO:2000642) |
| 0.1 | 1.5 | GO:0097116 | gephyrin clustering involved in postsynaptic density assembly(GO:0097116) |
| 0.1 | 0.3 | GO:0046586 | regulation of calcium-dependent cell-cell adhesion(GO:0046586) |
| 0.1 | 0.7 | GO:0051684 | maintenance of Golgi location(GO:0051684) |
| 0.1 | 1.2 | GO:0097118 | neuroligin clustering involved in postsynaptic membrane assembly(GO:0097118) |
| 0.1 | 0.4 | GO:1903613 | regulation of protein tyrosine phosphatase activity(GO:1903613) positive regulation of protein tyrosine phosphatase activity(GO:1903615) |
| 0.1 | 0.7 | GO:0097338 | response to clozapine(GO:0097338) |
| 0.1 | 0.9 | GO:1902748 | positive regulation of lens fiber cell differentiation(GO:1902748) |
| 0.1 | 0.3 | GO:0072369 | regulation of lipid transport by positive regulation of transcription from RNA polymerase II promoter(GO:0072369) |
| 0.1 | 0.6 | GO:2000124 | regulation of endocannabinoid signaling pathway(GO:2000124) |
| 0.1 | 0.2 | GO:0046521 | sphingoid catabolic process(GO:0046521) |
| 0.0 | 0.8 | GO:0001542 | ovulation from ovarian follicle(GO:0001542) |
| 0.0 | 0.1 | GO:0032072 | plasmacytoid dendritic cell activation(GO:0002270) regulation of restriction endodeoxyribonuclease activity(GO:0032072) |
| 0.0 | 0.1 | GO:0097403 | cellular response to raffinose(GO:0097403) response to raffinose(GO:1901545) |
| 0.0 | 0.4 | GO:0060613 | fat pad development(GO:0060613) |
| 0.0 | 0.3 | GO:1904338 | regulation of dopaminergic neuron differentiation(GO:1904338) |
| 0.0 | 0.8 | GO:0051412 | response to corticosterone(GO:0051412) |
| 0.0 | 0.2 | GO:0072734 | response to staurosporine(GO:0072733) cellular response to staurosporine(GO:0072734) |
| 0.0 | 0.4 | GO:0043508 | negative regulation of JUN kinase activity(GO:0043508) |
| 0.0 | 1.7 | GO:0007157 | heterophilic cell-cell adhesion via plasma membrane cell adhesion molecules(GO:0007157) |
| 0.0 | 0.7 | GO:0022400 | regulation of rhodopsin mediated signaling pathway(GO:0022400) |
| 0.0 | 0.2 | GO:1903361 | protein localization to basolateral plasma membrane(GO:1903361) |
| 0.0 | 0.3 | GO:0030497 | fatty acid elongation(GO:0030497) |
| 0.0 | 0.5 | GO:0090527 | actin filament reorganization(GO:0090527) |
| 0.0 | 0.3 | GO:1903504 | regulation of mitotic cell cycle spindle assembly checkpoint(GO:0090266) regulation of mitotic spindle checkpoint(GO:1903504) |
| 0.0 | 0.5 | GO:0070584 | mitochondrion morphogenesis(GO:0070584) |
| 0.0 | 0.3 | GO:0035641 | locomotory exploration behavior(GO:0035641) |
| 0.0 | 0.1 | GO:1903546 | protein localization to photoreceptor outer segment(GO:1903546) |
| 0.0 | 0.4 | GO:0044342 | type B pancreatic cell proliferation(GO:0044342) |
| 0.0 | 0.3 | GO:0006590 | thyroid hormone generation(GO:0006590) |
| 0.0 | 0.1 | GO:0006990 | positive regulation of transcription from RNA polymerase II promoter involved in unfolded protein response(GO:0006990) |
Gene overrepresentation in cellular component category:
| Log-likelihood per target | Total log-likelihood | Term | Description |
|---|---|---|---|
| 0.2 | 2.1 | GO:0033269 | internode region of axon(GO:0033269) |
| 0.1 | 0.3 | GO:0016939 | kinesin II complex(GO:0016939) |
| 0.1 | 1.2 | GO:0036056 | filtration diaphragm(GO:0036056) slit diaphragm(GO:0036057) |
| 0.1 | 0.3 | GO:0031510 | SUMO activating enzyme complex(GO:0031510) |
| 0.0 | 0.2 | GO:0070701 | mucus layer(GO:0070701) |
| 0.0 | 0.7 | GO:0005952 | cAMP-dependent protein kinase complex(GO:0005952) |
| 0.0 | 0.7 | GO:0097381 | photoreceptor disc membrane(GO:0097381) |
| 0.0 | 3.9 | GO:0030176 | integral component of endoplasmic reticulum membrane(GO:0030176) |
| 0.0 | 0.5 | GO:0005849 | mRNA cleavage factor complex(GO:0005849) |
| 0.0 | 0.5 | GO:0046540 | U4/U6 x U5 tri-snRNP complex(GO:0046540) |
Gene overrepresentation in molecular function category:
| Log-likelihood per target | Total log-likelihood | Term | Description |
|---|---|---|---|
| 0.1 | 1.2 | GO:0070699 | type II activin receptor binding(GO:0070699) |
| 0.1 | 0.3 | GO:0019948 | SUMO activating enzyme activity(GO:0019948) |
| 0.1 | 0.2 | GO:0047025 | 3-oxoacyl-[acyl-carrier-protein] reductase (NADH) activity(GO:0047025) |
| 0.1 | 0.2 | GO:0016005 | phospholipase A2 activator activity(GO:0016005) |
| 0.0 | 0.3 | GO:0102344 | 3-hydroxy-behenoyl-CoA dehydratase activity(GO:0102344) 3-hydroxy-lignoceroyl-CoA dehydratase activity(GO:0102345) |
| 0.0 | 1.5 | GO:0097109 | neuroligin family protein binding(GO:0097109) |
| 0.0 | 0.3 | GO:0070573 | metallodipeptidase activity(GO:0070573) |
| 0.0 | 0.6 | GO:0047372 | acylglycerol lipase activity(GO:0047372) |
| 0.0 | 0.7 | GO:0004691 | cAMP-dependent protein kinase activity(GO:0004691) |
| 0.0 | 0.7 | GO:0047555 | 3',5'-cyclic-GMP phosphodiesterase activity(GO:0047555) |
| 0.0 | 0.2 | GO:0017050 | sphinganine kinase activity(GO:0008481) D-erythro-sphingosine kinase activity(GO:0017050) |
| 0.0 | 0.9 | GO:0008157 | protein phosphatase 1 binding(GO:0008157) |
| 0.0 | 0.1 | GO:0010858 | calcium-dependent protein kinase regulator activity(GO:0010858) |
| 0.0 | 0.3 | GO:0043395 | heparan sulfate proteoglycan binding(GO:0043395) |
| 0.0 | 0.9 | GO:0001205 | transcriptional activator activity, RNA polymerase II distal enhancer sequence-specific binding(GO:0001205) |
Gene overrepresentation in curated gene sets: canonical pathways category:
| Log-likelihood per target | Total log-likelihood | Term | Description |
|---|---|---|---|
| 0.0 | 0.7 | PID RHODOPSIN PATHWAY | Visual signal transduction: Rods |
Gene overrepresentation in curated gene sets: REACTOME pathways category:
| Log-likelihood per target | Total log-likelihood | Term | Description |
|---|---|---|---|
| 0.0 | 1.3 | REACTOME HORMONE SENSITIVE LIPASE HSL MEDIATED TRIACYLGLYCEROL HYDROLYSIS | Genes involved in Hormone-sensitive lipase (HSL)-mediated triacylglycerol hydrolysis |
| 0.0 | 0.8 | REACTOME REGULATION OF AMPK ACTIVITY VIA LKB1 | Genes involved in Regulation of AMPK activity via LKB1 |
| 0.0 | 1.2 | REACTOME NEPHRIN INTERACTIONS | Genes involved in Nephrin interactions |
| 0.0 | 0.6 | REACTOME DCC MEDIATED ATTRACTIVE SIGNALING | Genes involved in DCC mediated attractive signaling |
| 0.0 | 0.3 | REACTOME APOPTOSIS INDUCED DNA FRAGMENTATION | Genes involved in Apoptosis induced DNA fragmentation |
| 0.0 | 0.5 | REACTOME PROCESSING OF INTRONLESS PRE MRNAS | Genes involved in Processing of Intronless Pre-mRNAs |
| 0.0 | 0.3 | REACTOME SIGNALING BY FGFR3 MUTANTS | Genes involved in Signaling by FGFR3 mutants |
| 0.0 | 0.7 | REACTOME CGMP EFFECTS | Genes involved in cGMP effects |
| 0.0 | 0.4 | REACTOME ZINC TRANSPORTERS | Genes involved in Zinc transporters |