Project
Illumina Body Map 2 (GSE30611)
Navigation
Downloads
Results for CAGUAGU
Z-value: 0.94
Motif logo

miRNA associated with seed CAGUAGU
| Name | miRBASE accession |
|---|---|
|
hsa-miR-199a-3p
|
MIMAT0000232 |
|
hsa-miR-199b-3p
|
MIMAT0004563 |
|
hsa-miR-3129-5p
|
MIMAT0014992 |
Activity profile of CAGUAGU motif
Sorted Z-values of CAGUAGU motif
Network of associatons between targets according to the STRING database.

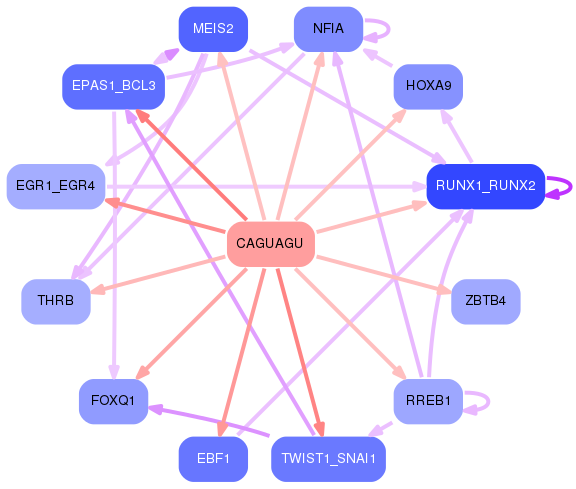
First level regulatory network of CAGUAGU
Gene Ontology Analysis
Gene overrepresentation in biological process category:
| Log-likelihood per target | Total log-likelihood | Term | Description |
|---|---|---|---|
| 0.7 | 2.2 | GO:2000793 | negative regulation of oxidative phosphorylation uncoupler activity(GO:2000276) cell proliferation involved in heart valve development(GO:2000793) |
| 0.6 | 1.8 | GO:0050720 | interleukin-1 beta biosynthetic process(GO:0050720) |
| 0.5 | 3.1 | GO:0008218 | bioluminescence(GO:0008218) |
| 0.5 | 1.4 | GO:0061033 | secretion by lung epithelial cell involved in lung growth(GO:0061033) |
| 0.4 | 0.4 | GO:1900155 | regulation of bone trabecula formation(GO:1900154) negative regulation of bone trabecula formation(GO:1900155) |
| 0.4 | 1.2 | GO:0042660 | positive regulation of cell fate specification(GO:0042660) |
| 0.4 | 2.1 | GO:1903588 | negative regulation of blood vessel endothelial cell proliferation involved in sprouting angiogenesis(GO:1903588) |
| 0.3 | 2.2 | GO:1903385 | regulation of homophilic cell adhesion(GO:1903385) |
| 0.3 | 1.1 | GO:1903045 | neural crest cell migration involved in sympathetic nervous system development(GO:1903045) |
| 0.3 | 0.8 | GO:0051821 | negative regulation of transcription from RNA polymerase II promoter in response to UV-induced DNA damage(GO:0010768) transmission of virus(GO:0019089) dissemination or transmission of symbiont from host(GO:0044007) dissemination or transmission of organism from other organism involved in symbiotic interaction(GO:0051821) |
| 0.2 | 1.7 | GO:0042986 | positive regulation of amyloid precursor protein biosynthetic process(GO:0042986) |
| 0.2 | 1.1 | GO:0035801 | adrenal cortex development(GO:0035801) adrenal cortex formation(GO:0035802) |
| 0.2 | 1.3 | GO:2000721 | positive regulation of transcription from RNA polymerase II promoter involved in smooth muscle cell differentiation(GO:2000721) |
| 0.2 | 1.0 | GO:0035790 | platelet-derived growth factor receptor-alpha signaling pathway(GO:0035790) |
| 0.2 | 2.4 | GO:0048625 | myoblast fate commitment(GO:0048625) |
| 0.2 | 2.8 | GO:0008354 | germ cell migration(GO:0008354) |
| 0.2 | 1.5 | GO:0034436 | glycoprotein transport(GO:0034436) |
| 0.2 | 2.0 | GO:2000324 | positive regulation of glucocorticoid receptor signaling pathway(GO:2000324) |
| 0.2 | 1.3 | GO:0019065 | receptor-mediated endocytosis of virus by host cell(GO:0019065) modulation by host of viral release from host cell(GO:0044789) positive regulation by host of viral release from host cell(GO:0044791) endocytosis involved in viral entry into host cell(GO:0075509) |
| 0.2 | 0.5 | GO:1990709 | presynaptic active zone organization(GO:1990709) |
| 0.2 | 0.8 | GO:1904073 | regulation of trophectodermal cell proliferation(GO:1904073) positive regulation of trophectodermal cell proliferation(GO:1904075) |
| 0.2 | 0.5 | GO:0002025 | vasodilation by norepinephrine-epinephrine involved in regulation of systemic arterial blood pressure(GO:0002025) positive regulation of the force of heart contraction by chemical signal(GO:0003099) |
| 0.1 | 1.9 | GO:0048251 | elastic fiber assembly(GO:0048251) |
| 0.1 | 0.4 | GO:1903691 | positive regulation of wound healing, spreading of epidermal cells(GO:1903691) |
| 0.1 | 2.9 | GO:0040015 | negative regulation of multicellular organism growth(GO:0040015) |
| 0.1 | 0.3 | GO:1901383 | negative regulation of chorionic trophoblast cell proliferation(GO:1901383) |
| 0.1 | 0.7 | GO:0032911 | negative regulation of transforming growth factor beta1 production(GO:0032911) |
| 0.1 | 0.8 | GO:0070966 | nuclear-transcribed mRNA catabolic process, no-go decay(GO:0070966) |
| 0.1 | 0.3 | GO:0100057 | regulation of phenotypic switching by transcription from RNA polymerase II promoter(GO:0100057) regulation of hydrogen sulfide biosynthetic process(GO:1904826) positive regulation of hydrogen sulfide biosynthetic process(GO:1904828) |
| 0.1 | 2.0 | GO:0090091 | positive regulation of extracellular matrix disassembly(GO:0090091) |
| 0.1 | 1.6 | GO:0060449 | bud elongation involved in lung branching(GO:0060449) positive regulation of stem cell population maintenance(GO:1902459) |
| 0.1 | 0.3 | GO:0015917 | aminophospholipid transport(GO:0015917) |
| 0.1 | 0.5 | GO:0060011 | Sertoli cell proliferation(GO:0060011) |
| 0.1 | 0.8 | GO:0007185 | transmembrane receptor protein tyrosine phosphatase signaling pathway(GO:0007185) |
| 0.1 | 0.6 | GO:0008050 | female courtship behavior(GO:0008050) |
| 0.1 | 0.2 | GO:0003064 | regulation of heart rate by hormone(GO:0003064) negative regulation of peptidyl-serine dephosphorylation(GO:1902309) |
| 0.1 | 0.3 | GO:0009236 | cobalamin biosynthetic process(GO:0009236) |
| 0.1 | 0.9 | GO:0051451 | myoblast migration(GO:0051451) |
| 0.1 | 0.4 | GO:2000381 | negative regulation of mesoderm development(GO:2000381) |
| 0.0 | 0.2 | GO:2000687 | negative regulation of rubidium ion transport(GO:2000681) negative regulation of rubidium ion transmembrane transporter activity(GO:2000687) |
| 0.0 | 0.1 | GO:0035668 | TRAM-dependent toll-like receptor signaling pathway(GO:0035668) TRAM-dependent toll-like receptor 4 signaling pathway(GO:0035669) |
| 0.0 | 1.1 | GO:0061303 | cornea development in camera-type eye(GO:0061303) |
| 0.0 | 1.1 | GO:0051195 | negative regulation of glycolytic process(GO:0045820) negative regulation of cofactor metabolic process(GO:0051195) negative regulation of coenzyme metabolic process(GO:0051198) |
| 0.0 | 0.7 | GO:1902414 | protein localization to cell junction(GO:1902414) |
| 0.0 | 0.2 | GO:0051138 | positive regulation of NK T cell differentiation(GO:0051138) |
| 0.0 | 0.5 | GO:1904885 | beta-catenin destruction complex assembly(GO:1904885) |
| 0.0 | 0.3 | GO:0097368 | establishment of Sertoli cell barrier(GO:0097368) |
| 0.0 | 0.2 | GO:0001692 | histamine metabolic process(GO:0001692) |
| 0.0 | 0.1 | GO:0060623 | regulation of chromosome condensation(GO:0060623) |
| 0.0 | 0.3 | GO:0001661 | conditioned taste aversion(GO:0001661) |
| 0.0 | 0.3 | GO:0030043 | actin filament fragmentation(GO:0030043) |
| 0.0 | 1.2 | GO:0031581 | hemidesmosome assembly(GO:0031581) |
| 0.0 | 0.5 | GO:0006002 | fructose 6-phosphate metabolic process(GO:0006002) |
| 0.0 | 1.1 | GO:0031069 | hair follicle morphogenesis(GO:0031069) |
| 0.0 | 1.2 | GO:0071711 | basement membrane organization(GO:0071711) |
| 0.0 | 1.8 | GO:0030199 | collagen fibril organization(GO:0030199) |
| 0.0 | 2.4 | GO:0046949 | fatty-acyl-CoA biosynthetic process(GO:0046949) |
| 0.0 | 0.4 | GO:1900623 | regulation of monocyte aggregation(GO:1900623) positive regulation of monocyte aggregation(GO:1900625) |
| 0.0 | 1.0 | GO:0097062 | dendritic spine maintenance(GO:0097062) |
| 0.0 | 0.8 | GO:0002089 | lens morphogenesis in camera-type eye(GO:0002089) |
| 0.0 | 0.3 | GO:0031339 | negative regulation of vesicle fusion(GO:0031339) |
| 0.0 | 0.4 | GO:0015693 | magnesium ion transport(GO:0015693) |
| 0.0 | 0.4 | GO:0030854 | positive regulation of granulocyte differentiation(GO:0030854) |
| 0.0 | 0.5 | GO:0035970 | peptidyl-threonine dephosphorylation(GO:0035970) |
| 0.0 | 0.4 | GO:0000338 | protein deneddylation(GO:0000338) |
| 0.0 | 1.4 | GO:0048009 | insulin-like growth factor receptor signaling pathway(GO:0048009) |
| 0.0 | 0.6 | GO:0007172 | signal complex assembly(GO:0007172) |
| 0.0 | 0.3 | GO:0044341 | sodium-dependent phosphate transport(GO:0044341) |
| 0.0 | 0.1 | GO:1903613 | regulation of protein tyrosine phosphatase activity(GO:1903613) positive regulation of protein tyrosine phosphatase activity(GO:1903615) |
| 0.0 | 0.6 | GO:0045880 | positive regulation of smoothened signaling pathway(GO:0045880) |
| 0.0 | 0.4 | GO:0043508 | negative regulation of JUN kinase activity(GO:0043508) |
| 0.0 | 0.4 | GO:0072189 | ureter development(GO:0072189) |
| 0.0 | 0.1 | GO:0006651 | diacylglycerol biosynthetic process(GO:0006651) |
| 0.0 | 0.5 | GO:0036152 | phosphatidylethanolamine acyl-chain remodeling(GO:0036152) |
| 0.0 | 0.2 | GO:0043950 | positive regulation of cAMP-mediated signaling(GO:0043950) |
| 0.0 | 0.3 | GO:0042118 | endothelial cell activation(GO:0042118) |
| 0.0 | 0.5 | GO:0048026 | positive regulation of mRNA splicing, via spliceosome(GO:0048026) |
| 0.0 | 1.1 | GO:0046626 | regulation of insulin receptor signaling pathway(GO:0046626) |
| 0.0 | 0.1 | GO:0051088 | PMA-inducible membrane protein ectodomain proteolysis(GO:0051088) |
| 0.0 | 0.1 | GO:0031087 | deadenylation-independent decapping of nuclear-transcribed mRNA(GO:0031087) |
| 0.0 | 0.2 | GO:0000183 | chromatin silencing at rDNA(GO:0000183) |
| 0.0 | 0.1 | GO:0006621 | protein retention in ER lumen(GO:0006621) |
| 0.0 | 0.0 | GO:0044205 | 'de novo' UMP biosynthetic process(GO:0044205) |
Gene overrepresentation in cellular component category:
| Log-likelihood per target | Total log-likelihood | Term | Description |
|---|---|---|---|
| 0.8 | 0.8 | GO:0034665 | integrin alpha1-beta1 complex(GO:0034665) |
| 0.4 | 2.0 | GO:0005595 | collagen type XII trimer(GO:0005595) |
| 0.3 | 1.6 | GO:0071148 | TEAD-1-YAP complex(GO:0071148) TEAD-2-YAP complex(GO:0071149) |
| 0.2 | 1.3 | GO:0034678 | integrin alpha8-beta1 complex(GO:0034678) |
| 0.1 | 0.2 | GO:0034686 | integrin alphav-beta8 complex(GO:0034686) |
| 0.1 | 0.8 | GO:0035867 | alphav-beta3 integrin-IGF-1-IGF1R complex(GO:0035867) |
| 0.1 | 0.5 | GO:0034673 | inhibin-betaglycan-ActRII complex(GO:0034673) |
| 0.1 | 0.3 | GO:0048179 | activin receptor complex(GO:0048179) |
| 0.0 | 1.5 | GO:0034361 | very-low-density lipoprotein particle(GO:0034361) triglyceride-rich lipoprotein particle(GO:0034385) |
| 0.0 | 0.3 | GO:0035976 | AP1 complex(GO:0035976) |
| 0.0 | 0.4 | GO:0035692 | macrophage migration inhibitory factor receptor complex(GO:0035692) |
| 0.0 | 1.3 | GO:0002080 | acrosomal membrane(GO:0002080) |
| 0.0 | 0.2 | GO:0033553 | rDNA heterochromatin(GO:0033553) |
| 0.0 | 0.4 | GO:0033018 | sarcoplasmic reticulum lumen(GO:0033018) |
| 0.0 | 0.3 | GO:0097197 | tetraspanin-enriched microdomain(GO:0097197) |
| 0.0 | 0.4 | GO:0008250 | oligosaccharyltransferase complex(GO:0008250) |
| 0.0 | 0.5 | GO:0005847 | mRNA cleavage and polyadenylation specificity factor complex(GO:0005847) |
| 0.0 | 0.8 | GO:0016327 | apicolateral plasma membrane(GO:0016327) |
| 0.0 | 3.1 | GO:0043202 | lysosomal lumen(GO:0043202) |
| 0.0 | 0.2 | GO:0030123 | AP-3 adaptor complex(GO:0030123) |
| 0.0 | 2.0 | GO:0005581 | collagen trimer(GO:0005581) |
| 0.0 | 0.4 | GO:0035098 | ESC/E(Z) complex(GO:0035098) |
| 0.0 | 0.3 | GO:0034364 | high-density lipoprotein particle(GO:0034364) |
| 0.0 | 0.6 | GO:0031092 | platelet alpha granule membrane(GO:0031092) |
| 0.0 | 0.1 | GO:0032301 | MutSalpha complex(GO:0032301) |
Gene overrepresentation in molecular function category:
| Log-likelihood per target | Total log-likelihood | Term | Description |
|---|---|---|---|
| 0.5 | 2.8 | GO:0042392 | sphingosine-1-phosphate phosphatase activity(GO:0042392) |
| 0.4 | 1.5 | GO:0034189 | very-low-density lipoprotein particle binding(GO:0034189) |
| 0.3 | 2.4 | GO:0004768 | stearoyl-CoA 9-desaturase activity(GO:0004768) acyl-CoA desaturase activity(GO:0016215) |
| 0.3 | 1.7 | GO:0005010 | insulin-like growth factor-activated receptor activity(GO:0005010) |
| 0.3 | 1.8 | GO:0044729 | hemi-methylated DNA-binding(GO:0044729) |
| 0.2 | 1.9 | GO:0004720 | protein-lysine 6-oxidase activity(GO:0004720) |
| 0.2 | 1.0 | GO:0005017 | platelet-derived growth factor-activated receptor activity(GO:0005017) |
| 0.2 | 0.5 | GO:0004939 | beta-adrenergic receptor activity(GO:0004939) |
| 0.1 | 0.5 | GO:0004360 | glutamine-fructose-6-phosphate transaminase (isomerizing) activity(GO:0004360) |
| 0.1 | 1.0 | GO:0050815 | phosphoserine binding(GO:0050815) |
| 0.1 | 2.0 | GO:0030020 | extracellular matrix structural constituent conferring tensile strength(GO:0030020) |
| 0.1 | 0.3 | GO:0038100 | nodal binding(GO:0038100) |
| 0.1 | 2.0 | GO:0038062 | protein tyrosine kinase collagen receptor activity(GO:0038062) |
| 0.1 | 0.3 | GO:0090556 | apolipoprotein A-I receptor activity(GO:0034188) phosphatidylserine-translocating ATPase activity(GO:0090556) |
| 0.1 | 1.7 | GO:0043522 | leucine zipper domain binding(GO:0043522) |
| 0.1 | 0.8 | GO:0098639 | collagen binding involved in cell-matrix adhesion(GO:0098639) |
| 0.1 | 3.1 | GO:0005001 | transmembrane receptor protein tyrosine phosphatase activity(GO:0005001) transmembrane receptor protein phosphatase activity(GO:0019198) |
| 0.1 | 2.6 | GO:0005104 | fibroblast growth factor receptor binding(GO:0005104) |
| 0.1 | 0.7 | GO:0008440 | inositol-1,4,5-trisphosphate 3-kinase activity(GO:0008440) |
| 0.1 | 2.1 | GO:0005112 | Notch binding(GO:0005112) |
| 0.1 | 0.3 | GO:0050510 | N-acetylgalactosaminyl-proteoglycan 3-beta-glucuronosyltransferase activity(GO:0050510) |
| 0.1 | 0.5 | GO:0034711 | inhibin binding(GO:0034711) BMP receptor activity(GO:0098821) |
| 0.1 | 1.1 | GO:0050693 | LBD domain binding(GO:0050693) |
| 0.0 | 1.1 | GO:0030215 | semaphorin receptor binding(GO:0030215) |
| 0.0 | 1.6 | GO:0070742 | C2H2 zinc finger domain binding(GO:0070742) |
| 0.0 | 0.2 | GO:0001069 | regulatory region RNA binding(GO:0001069) |
| 0.0 | 1.6 | GO:0070064 | proline-rich region binding(GO:0070064) |
| 0.0 | 2.7 | GO:0035035 | histone acetyltransferase binding(GO:0035035) |
| 0.0 | 0.3 | GO:0015319 | sodium:inorganic phosphate symporter activity(GO:0015319) |
| 0.0 | 0.2 | GO:1990430 | extracellular matrix protein binding(GO:1990430) |
| 0.0 | 1.0 | GO:0017049 | GTP-Rho binding(GO:0017049) |
| 0.0 | 0.2 | GO:0048248 | CXCR3 chemokine receptor binding(GO:0048248) |
| 0.0 | 0.6 | GO:0070324 | thyroid hormone binding(GO:0070324) |
| 0.0 | 0.4 | GO:0004579 | dolichyl-diphosphooligosaccharide-protein glycotransferase activity(GO:0004579) |
| 0.0 | 0.5 | GO:0017017 | MAP kinase tyrosine/serine/threonine phosphatase activity(GO:0017017) |
| 0.0 | 2.0 | GO:0043425 | bHLH transcription factor binding(GO:0043425) |
| 0.0 | 0.1 | GO:0035276 | ethanol binding(GO:0035276) |
| 0.0 | 3.7 | GO:0005179 | hormone activity(GO:0005179) |
| 0.0 | 0.2 | GO:0060002 | plus-end directed microfilament motor activity(GO:0060002) |
| 0.0 | 1.1 | GO:0005109 | frizzled binding(GO:0005109) |
| 0.0 | 0.7 | GO:0098641 | cadherin binding involved in cell-cell adhesion(GO:0098641) |
| 0.0 | 3.2 | GO:0030165 | PDZ domain binding(GO:0030165) |
| 0.0 | 0.2 | GO:0005172 | vascular endothelial growth factor receptor binding(GO:0005172) |
| 0.0 | 0.1 | GO:0008426 | protein kinase C inhibitor activity(GO:0008426) |
| 0.0 | 1.1 | GO:0071889 | 14-3-3 protein binding(GO:0071889) |
| 0.0 | 0.9 | GO:0031624 | ubiquitin conjugating enzyme binding(GO:0031624) |
| 0.0 | 1.0 | GO:0008138 | protein tyrosine/serine/threonine phosphatase activity(GO:0008138) |
| 0.0 | 0.6 | GO:0017166 | vinculin binding(GO:0017166) |
| 0.0 | 1.2 | GO:0097110 | scaffold protein binding(GO:0097110) |
| 0.0 | 0.1 | GO:0003828 | alpha-N-acetylneuraminate alpha-2,8-sialyltransferase activity(GO:0003828) |
| 0.0 | 0.3 | GO:0035613 | RNA stem-loop binding(GO:0035613) |
| 0.0 | 0.1 | GO:0032143 | single thymine insertion binding(GO:0032143) |
| 0.0 | 0.5 | GO:0008327 | methyl-CpG binding(GO:0008327) |
| 0.0 | 1.7 | GO:0005518 | collagen binding(GO:0005518) |
Gene overrepresentation in curated gene sets: canonical pathways category:
| Log-likelihood per target | Total log-likelihood | Term | Description |
|---|---|---|---|
| 0.1 | 6.0 | PID HIF2PATHWAY | HIF-2-alpha transcription factor network |
| 0.1 | 4.4 | PID SYNDECAN 2 PATHWAY | Syndecan-2-mediated signaling events |
| 0.1 | 2.6 | PID PRL SIGNALING EVENTS PATHWAY | Signaling events mediated by PRL |
| 0.1 | 0.8 | ST TYPE I INTERFERON PATHWAY | Type I Interferon (alpha/beta IFN) Pathway |
| 0.0 | 1.4 | PID PDGFRA PATHWAY | PDGFR-alpha signaling pathway |
| 0.0 | 4.8 | PID AVB3 INTEGRIN PATHWAY | Integrins in angiogenesis |
| 0.0 | 1.5 | PID UPA UPAR PATHWAY | Urokinase-type plasminogen activator (uPA) and uPAR-mediated signaling |
| 0.0 | 1.5 | PID INTEGRIN CS PATHWAY | Integrin family cell surface interactions |
| 0.0 | 0.7 | PID VEGFR1 PATHWAY | VEGFR1 specific signals |
| 0.0 | 1.2 | NABA BASEMENT MEMBRANES | Genes encoding structural components of basement membranes |
| 0.0 | 1.6 | PID TAP63 PATHWAY | Validated transcriptional targets of TAp63 isoforms |
| 0.0 | 2.0 | PID DELTA NP63 PATHWAY | Validated transcriptional targets of deltaNp63 isoforms |
| 0.0 | 1.5 | PID ATF2 PATHWAY | ATF-2 transcription factor network |
| 0.0 | 2.2 | PID NOTCH PATHWAY | Notch signaling pathway |
| 0.0 | 0.4 | PID AVB3 OPN PATHWAY | Osteopontin-mediated events |
| 0.0 | 1.7 | PID CERAMIDE PATHWAY | Ceramide signaling pathway |
| 0.0 | 1.5 | PID LKB1 PATHWAY | LKB1 signaling events |
| 0.0 | 0.7 | PID PS1 PATHWAY | Presenilin action in Notch and Wnt signaling |
| 0.0 | 1.0 | PID RXR VDR PATHWAY | RXR and RAR heterodimerization with other nuclear receptor |
| 0.0 | 0.9 | PID MTOR 4PATHWAY | mTOR signaling pathway |
| 0.0 | 1.0 | SIG REGULATION OF THE ACTIN CYTOSKELETON BY RHO GTPASES | Genes related to regulation of the actin cytoskeleton |
| 0.0 | 0.8 | PID CDC42 REG PATHWAY | Regulation of CDC42 activity |
| 0.0 | 0.3 | PID INSULIN GLUCOSE PATHWAY | Insulin-mediated glucose transport |
| 0.0 | 0.4 | PID FRA PATHWAY | Validated transcriptional targets of AP1 family members Fra1 and Fra2 |
| 0.0 | 0.5 | ST MYOCYTE AD PATHWAY | Myocyte Adrenergic Pathway is a specific case of the generalized Adrenergic Pathway. |
Gene overrepresentation in curated gene sets: REACTOME pathways category:
| Log-likelihood per target | Total log-likelihood | Term | Description |
|---|---|---|---|
| 0.1 | 2.2 | REACTOME SIGNALING BY NOTCH4 | Genes involved in Signaling by NOTCH4 |
| 0.1 | 3.1 | REACTOME HS GAG DEGRADATION | Genes involved in HS-GAG degradation |
| 0.1 | 2.6 | REACTOME ACTIVATED POINT MUTANTS OF FGFR2 | Genes involved in Activated point mutants of FGFR2 |
| 0.1 | 2.4 | REACTOME OXYGEN DEPENDENT PROLINE HYDROXYLATION OF HYPOXIA INDUCIBLE FACTOR ALPHA | Genes involved in Oxygen-dependent Proline Hydroxylation of Hypoxia-inducible Factor Alpha |
| 0.0 | 1.8 | REACTOME SIGNALING BY HIPPO | Genes involved in Signaling by Hippo |
| 0.0 | 1.1 | REACTOME SEMA3A PLEXIN REPULSION SIGNALING BY INHIBITING INTEGRIN ADHESION | Genes involved in SEMA3A-Plexin repulsion signaling by inhibiting Integrin adhesion |
| 0.0 | 0.5 | REACTOME SYNTHESIS OF SUBSTRATES IN N GLYCAN BIOSYTHESIS | Genes involved in Synthesis of substrates in N-glycan biosythesis |
| 0.0 | 0.7 | REACTOME ACTIVATION OF RAC | Genes involved in Activation of Rac |
| 0.0 | 0.8 | REACTOME OTHER SEMAPHORIN INTERACTIONS | Genes involved in Other semaphorin interactions |
| 0.0 | 2.4 | REACTOME COLLAGEN FORMATION | Genes involved in Collagen formation |
| 0.0 | 0.4 | REACTOME HYALURONAN UPTAKE AND DEGRADATION | Genes involved in Hyaluronan uptake and degradation |
| 0.0 | 1.8 | REACTOME INTERFERON ALPHA BETA SIGNALING | Genes involved in Interferon alpha/beta signaling |
| 0.0 | 0.7 | REACTOME SEMA4D INDUCED CELL MIGRATION AND GROWTH CONE COLLAPSE | Genes involved in Sema4D induced cell migration and growth-cone collapse |
| 0.0 | 0.3 | REACTOME HDL MEDIATED LIPID TRANSPORT | Genes involved in HDL-mediated lipid transport |
| 0.0 | 0.5 | REACTOME CTNNB1 PHOSPHORYLATION CASCADE | Genes involved in Beta-catenin phosphorylation cascade |
| 0.0 | 0.3 | REACTOME ACTIVATION OF THE AP1 FAMILY OF TRANSCRIPTION FACTORS | Genes involved in Activation of the AP-1 family of transcription factors |