Project
Illumina Body Map 2 (GSE30611)
Navigation
Downloads
Results for CCCUGAG
Z-value: 1.50
Motif logo

miRNA associated with seed CCCUGAG
| Name | miRBASE accession |
|---|---|
|
hsa-miR-125a-5p
|
MIMAT0000443 |
|
hsa-miR-125b-5p
|
MIMAT0000423 |
|
hsa-miR-4319
|
MIMAT0016870 |
Activity profile of CCCUGAG motif
Sorted Z-values of CCCUGAG motif
| Promoter | Log-likelihood | Transcript | Gene | Gene Info |
|---|---|---|---|---|
| chr17_-_63700100 | 6.47 |
ENST00000578993.5
ENST00000259006.8 ENST00000583211.5 |
LIMD2
|
LIM domain containing 2 |
| chr15_-_89814845 | 6.18 |
ENST00000679248.1
ENST00000300060.7 ENST00000560137.2 |
ANPEP
|
alanyl aminopeptidase, membrane |
| chr6_-_24911029 | 5.54 |
ENST00000259698.9
ENST00000644621.1 ENST00000644411.1 |
RIPOR2
|
RHO family interacting cell polarization regulator 2 |
| chr3_-_13420307 | 5.20 |
ENST00000254508.7
|
NUP210
|
nucleoporin 210 |
| chr15_+_81196871 | 4.98 |
ENST00000559383.5
ENST00000394660.6 ENST00000683961.1 |
IL16
|
interleukin 16 |
| chr5_-_100903252 | 4.42 |
ENST00000231461.10
|
ST8SIA4
|
ST8 alpha-N-acetyl-neuraminide alpha-2,8-sialyltransferase 4 |
| chr17_-_78717018 | 4.21 |
ENST00000585509.5
|
CYTH1
|
cytohesin 1 |
| chr6_+_391743 | 4.13 |
ENST00000380956.9
|
IRF4
|
interferon regulatory factor 4 |
| chr3_+_46979659 | 4.10 |
ENST00000450053.8
|
NBEAL2
|
neurobeachin like 2 |
| chr15_+_31326807 | 3.99 |
ENST00000307145.4
|
KLF13
|
Kruppel like factor 13 |
| chr1_+_12166978 | 3.98 |
ENST00000376259.7
ENST00000536782.2 |
TNFRSF1B
|
TNF receptor superfamily member 1B |
| chr1_+_26529745 | 3.95 |
ENST00000374168.7
ENST00000374166.8 |
RPS6KA1
|
ribosomal protein S6 kinase A1 |
| chr12_-_89352487 | 3.91 |
ENST00000548755.1
ENST00000279488.8 |
DUSP6
|
dual specificity phosphatase 6 |
| chr11_+_122655712 | 3.85 |
ENST00000284273.6
|
UBASH3B
|
ubiquitin associated and SH3 domain containing B |
| chr6_+_106098933 | 3.82 |
ENST00000369089.3
|
PRDM1
|
PR/SET domain 1 |
| chr11_-_128522264 | 3.56 |
ENST00000531611.5
|
ETS1
|
ETS proto-oncogene 1, transcription factor |
| chr3_+_186930518 | 3.48 |
ENST00000169298.8
ENST00000457772.6 ENST00000455441.5 ENST00000427315.5 |
ST6GAL1
|
ST6 beta-galactoside alpha-2,6-sialyltransferase 1 |
| chr19_+_10848366 | 3.29 |
ENST00000397820.5
|
C19orf38
|
chromosome 19 open reading frame 38 |
| chr1_-_107965009 | 3.15 |
ENST00000527011.5
ENST00000370056.9 |
VAV3
|
vav guanine nucleotide exchange factor 3 |
| chr3_+_5187697 | 3.07 |
ENST00000256497.9
|
EDEM1
|
ER degradation enhancing alpha-mannosidase like protein 1 |
| chr9_-_120714457 | 3.05 |
ENST00000373930.4
|
MEGF9
|
multiple EGF like domains 9 |
| chr3_-_183555696 | 3.04 |
ENST00000341319.8
|
KLHL6
|
kelch like family member 6 |
| chr19_-_11339573 | 2.81 |
ENST00000222120.8
|
RAB3D
|
RAB3D, member RAS oncogene family |
| chr19_+_926001 | 2.78 |
ENST00000263620.8
|
ARID3A
|
AT-rich interaction domain 3A |
| chr5_+_56815534 | 2.74 |
ENST00000399503.4
|
MAP3K1
|
mitogen-activated protein kinase kinase kinase 1 |
| chr18_-_21704763 | 2.64 |
ENST00000580981.5
ENST00000289119.7 |
ABHD3
|
abhydrolase domain containing 3, phospholipase |
| chr17_-_39864304 | 2.54 |
ENST00000346872.8
|
IKZF3
|
IKAROS family zinc finger 3 |
| chr6_-_16761447 | 2.52 |
ENST00000244769.8
ENST00000436367.6 |
ATXN1
|
ataxin 1 |
| chr9_-_35650902 | 2.52 |
ENST00000259608.8
ENST00000618781.1 |
SIT1
|
signaling threshold regulating transmembrane adaptor 1 |
| chr19_+_13150386 | 2.50 |
ENST00000292433.4
ENST00000587885.1 |
IER2
|
immediate early response 2 |
| chr5_-_176537361 | 2.47 |
ENST00000274811.9
|
RNF44
|
ring finger protein 44 |
| chr19_-_1863497 | 2.42 |
ENST00000617223.1
ENST00000250916.6 |
KLF16
|
Kruppel like factor 16 |
| chr7_+_143288215 | 2.41 |
ENST00000619992.4
ENST00000310447.10 |
CASP2
|
caspase 2 |
| chr2_+_73984902 | 2.40 |
ENST00000409262.8
|
TET3
|
tet methylcytosine dioxygenase 3 |
| chr5_+_134525649 | 2.39 |
ENST00000282605.8
ENST00000681547.2 ENST00000361895.6 ENST00000402835.5 |
JADE2
|
jade family PHD finger 2 |
| chr6_-_89352706 | 2.32 |
ENST00000435041.3
|
UBE2J1
|
ubiquitin conjugating enzyme E2 J1 |
| chr17_-_68291116 | 2.30 |
ENST00000327268.8
ENST00000580666.6 |
SLC16A6
|
solute carrier family 16 member 6 |
| chr2_+_46941199 | 2.29 |
ENST00000319190.11
ENST00000394850.6 |
TTC7A
|
tetratricopeptide repeat domain 7A |
| chr10_+_80454148 | 2.26 |
ENST00000429989.7
|
TSPAN14
|
tetraspanin 14 |
| chr11_-_65614195 | 2.23 |
ENST00000309100.8
ENST00000529839.1 ENST00000526293.1 |
MAP3K11
|
mitogen-activated protein kinase kinase kinase 11 |
| chr11_+_94543894 | 2.21 |
ENST00000358752.4
|
FUT4
|
fucosyltransferase 4 |
| chr6_-_32843994 | 2.18 |
ENST00000395339.7
ENST00000374882.8 |
PSMB8
|
proteasome 20S subunit beta 8 |
| chr12_-_57846686 | 2.13 |
ENST00000548823.1
ENST00000398073.7 |
CTDSP2
|
CTD small phosphatase 2 |
| chr9_+_76459152 | 2.10 |
ENST00000444201.6
ENST00000376730.5 |
GCNT1
|
glucosaminyl (N-acetyl) transferase 1 |
| chr19_-_19643597 | 2.10 |
ENST00000587205.1
ENST00000203556.9 |
GMIP
|
GEM interacting protein |
| chr14_-_67515429 | 2.05 |
ENST00000357461.7
ENST00000557006.6 |
TMEM229B
|
transmembrane protein 229B |
| chr10_-_71773513 | 2.04 |
ENST00000394957.8
|
VSIR
|
V-set immunoregulatory receptor |
| chr11_-_102452758 | 2.04 |
ENST00000398136.7
ENST00000361236.7 |
TMEM123
|
transmembrane protein 123 |
| chr6_+_20401864 | 1.97 |
ENST00000346618.8
ENST00000613242.4 |
E2F3
|
E2F transcription factor 3 |
| chr2_-_201071579 | 1.97 |
ENST00000453765.5
ENST00000452799.5 ENST00000446678.5 ENST00000418596.7 ENST00000681958.1 |
FAM126B
|
family with sequence similarity 126 member B |
| chr3_+_141487008 | 1.95 |
ENST00000286364.9
ENST00000452898.2 |
RASA2
|
RAS p21 protein activator 2 |
| chr8_-_65842051 | 1.93 |
ENST00000401827.8
|
PDE7A
|
phosphodiesterase 7A |
| chr16_-_85011463 | 1.92 |
ENST00000564466.5
ENST00000313732.9 |
ZDHHC7
|
zinc finger DHHC-type palmitoyltransferase 7 |
| chr12_-_54385727 | 1.90 |
ENST00000551109.5
ENST00000546970.5 |
ZNF385A
|
zinc finger protein 385A |
| chr6_+_11537738 | 1.90 |
ENST00000379426.2
|
TMEM170B
|
transmembrane protein 170B |
| chr15_-_61229297 | 1.89 |
ENST00000335670.11
|
RORA
|
RAR related orphan receptor A |
| chr14_+_69611586 | 1.85 |
ENST00000342745.5
|
SUSD6
|
sushi domain containing 6 |
| chr1_+_182789765 | 1.83 |
ENST00000367555.5
ENST00000367553.6 |
NPL
|
N-acetylneuraminate pyruvate lyase |
| chr18_-_63319987 | 1.80 |
ENST00000398117.1
|
BCL2
|
BCL2 apoptosis regulator |
| chr17_+_75516514 | 1.71 |
ENST00000333213.11
ENST00000545228.3 ENST00000680999.1 |
TSEN54
|
tRNA splicing endonuclease subunit 54 |
| chr10_-_89251768 | 1.68 |
ENST00000336233.10
|
LIPA
|
lipase A, lysosomal acid type |
| chr20_-_63979629 | 1.66 |
ENST00000369886.8
ENST00000450107.1 |
SAMD10
|
sterile alpha motif domain containing 10 |
| chr11_+_59172116 | 1.66 |
ENST00000227451.4
|
DTX4
|
deltex E3 ubiquitin ligase 4 |
| chr10_+_96043394 | 1.66 |
ENST00000403870.7
ENST00000265992.9 ENST00000465148.3 |
CCNJ
|
cyclin J |
| chr8_-_8893548 | 1.66 |
ENST00000276282.7
|
MFHAS1
|
malignant fibrous histiocytoma amplified sequence 1 |
| chr1_-_23531206 | 1.63 |
ENST00000361729.3
|
E2F2
|
E2F transcription factor 2 |
| chr5_+_96936071 | 1.62 |
ENST00000231368.10
|
LNPEP
|
leucyl and cystinyl aminopeptidase |
| chr15_+_22786610 | 1.61 |
ENST00000337435.9
|
NIPA1
|
NIPA magnesium transporter 1 |
| chr15_+_63189554 | 1.59 |
ENST00000559006.1
ENST00000321437.9 |
RAB8B
|
RAB8B, member RAS oncogene family |
| chr12_+_121712740 | 1.59 |
ENST00000449592.7
|
TMEM120B
|
transmembrane protein 120B |
| chr3_-_72446623 | 1.56 |
ENST00000477973.4
|
RYBP
|
RING1 and YY1 binding protein |
| chr1_-_111140040 | 1.55 |
ENST00000286692.8
ENST00000484310.6 |
DRAM2
|
DNA damage regulated autophagy modulator 2 |
| chr12_+_103965863 | 1.54 |
ENST00000392872.8
ENST00000537100.5 |
TDG
|
thymine DNA glycosylase |
| chr4_+_25234003 | 1.46 |
ENST00000264864.8
|
PI4K2B
|
phosphatidylinositol 4-kinase type 2 beta |
| chr4_-_2262082 | 1.46 |
ENST00000337190.7
|
MXD4
|
MAX dimerization protein 4 |
| chr12_-_122896066 | 1.45 |
ENST00000267202.7
ENST00000535765.5 |
VPS37B
|
VPS37B subunit of ESCRT-I |
| chr19_-_4066892 | 1.44 |
ENST00000322357.9
|
ZBTB7A
|
zinc finger and BTB domain containing 7A |
| chr1_-_207051202 | 1.43 |
ENST00000315927.9
|
YOD1
|
YOD1 deubiquitinase |
| chr17_+_63622406 | 1.43 |
ENST00000579585.5
ENST00000361733.8 ENST00000584573.5 ENST00000361357.7 |
MAP3K3
|
mitogen-activated protein kinase kinase kinase 3 |
| chr1_+_154405193 | 1.42 |
ENST00000622330.4
ENST00000344086.8 |
IL6R
|
interleukin 6 receptor |
| chr10_+_70815889 | 1.42 |
ENST00000373202.8
|
SGPL1
|
sphingosine-1-phosphate lyase 1 |
| chr11_-_65134507 | 1.40 |
ENST00000377190.8
ENST00000294256.12 |
SYVN1
|
synoviolin 1 |
| chr8_-_73878816 | 1.40 |
ENST00000602593.6
ENST00000651945.1 ENST00000419880.7 ENST00000517608.5 ENST00000650817.1 |
UBE2W
|
ubiquitin conjugating enzyme E2 W |
| chr19_+_3185911 | 1.39 |
ENST00000246117.9
ENST00000588428.5 |
NCLN
|
nicalin |
| chr7_-_140176970 | 1.39 |
ENST00000397560.7
|
KDM7A
|
lysine demethylase 7A |
| chr17_+_40219276 | 1.38 |
ENST00000583268.1
ENST00000323571.9 |
WIPF2
|
WAS/WASL interacting protein family member 2 |
| chr12_+_11649666 | 1.37 |
ENST00000396373.9
|
ETV6
|
ETS variant transcription factor 6 |
| chr3_+_15427551 | 1.36 |
ENST00000396842.7
|
EAF1
|
ELL associated factor 1 |
| chr15_-_79090760 | 1.36 |
ENST00000419573.7
ENST00000558480.7 |
RASGRF1
|
Ras protein specific guanine nucleotide releasing factor 1 |
| chr2_+_130356036 | 1.35 |
ENST00000347849.7
ENST00000175756.10 |
PTPN18
|
protein tyrosine phosphatase non-receptor type 18 |
| chr17_-_42609356 | 1.34 |
ENST00000309428.10
|
RETREG3
|
reticulophagy regulator family member 3 |
| chr12_+_67648737 | 1.34 |
ENST00000344096.4
ENST00000393555.3 |
DYRK2
|
dual specificity tyrosine phosphorylation regulated kinase 2 |
| chr17_-_81918134 | 1.34 |
ENST00000328666.11
|
SIRT7
|
sirtuin 7 |
| chr1_-_200410052 | 1.34 |
ENST00000294740.3
|
ZNF281
|
zinc finger protein 281 |
| chr11_+_45805108 | 1.33 |
ENST00000530471.1
ENST00000314134.4 |
SLC35C1
|
solute carrier family 35 member C1 |
| chr9_-_128067310 | 1.33 |
ENST00000373078.5
|
NAIF1
|
nuclear apoptosis inducing factor 1 |
| chr7_-_106661148 | 1.32 |
ENST00000523505.3
|
CCDC71L
|
coiled-coil domain containing 71 like |
| chr14_-_70809494 | 1.31 |
ENST00000381250.8
ENST00000554752.7 ENST00000555993.6 |
MAP3K9
|
mitogen-activated protein kinase kinase kinase 9 |
| chr15_+_74541200 | 1.29 |
ENST00000622429.1
ENST00000346246.10 |
ARID3B
|
AT-rich interaction domain 3B |
| chr8_-_140635617 | 1.28 |
ENST00000220592.10
|
AGO2
|
argonaute RISC catalytic component 2 |
| chr9_+_126860625 | 1.28 |
ENST00000319119.4
|
ZBTB34
|
zinc finger and BTB domain containing 34 |
| chr18_-_46072244 | 1.27 |
ENST00000589328.5
ENST00000409746.5 |
PSTPIP2
|
proline-serine-threonine phosphatase interacting protein 2 |
| chr8_-_94949350 | 1.26 |
ENST00000448464.6
ENST00000342697.5 |
TP53INP1
|
tumor protein p53 inducible nuclear protein 1 |
| chr3_+_58237501 | 1.26 |
ENST00000295962.8
|
ABHD6
|
abhydrolase domain containing 6, acylglycerol lipase |
| chr1_+_178725227 | 1.26 |
ENST00000367635.8
|
RALGPS2
|
Ral GEF with PH domain and SH3 binding motif 2 |
| chr12_+_111405861 | 1.25 |
ENST00000341259.7
|
SH2B3
|
SH2B adaptor protein 3 |
| chr22_+_29883158 | 1.22 |
ENST00000333027.7
ENST00000401950.7 ENST00000445401.5 ENST00000323630.9 ENST00000351488.7 |
MTMR3
|
myotubularin related protein 3 |
| chr12_-_51324138 | 1.22 |
ENST00000452142.7
|
BIN2
|
bridging integrator 2 |
| chr1_+_89524819 | 1.20 |
ENST00000439853.6
ENST00000330947.7 ENST00000449440.5 ENST00000640258.1 |
LRRC8B
|
leucine rich repeat containing 8 VRAC subunit B |
| chr5_+_177592182 | 1.20 |
ENST00000332598.7
|
TMED9
|
transmembrane p24 trafficking protein 9 |
| chr6_-_30690968 | 1.19 |
ENST00000376420.9
ENST00000376421.7 |
NRM
|
nurim |
| chr11_+_63938971 | 1.17 |
ENST00000539656.5
ENST00000377793.9 |
NAA40
|
N-alpha-acetyltransferase 40, NatD catalytic subunit |
| chr2_-_75560893 | 1.17 |
ENST00000410113.5
ENST00000393913.8 |
EVA1A
|
eva-1 homolog A, regulator of programmed cell death |
| chr11_-_78341876 | 1.16 |
ENST00000340149.6
|
GAB2
|
GRB2 associated binding protein 2 |
| chr19_+_13795434 | 1.15 |
ENST00000254323.6
|
ZSWIM4
|
zinc finger SWIM-type containing 4 |
| chr16_-_23510389 | 1.14 |
ENST00000562117.1
ENST00000567468.5 ENST00000562944.5 ENST00000309859.8 |
GGA2
|
golgi associated, gamma adaptin ear containing, ARF binding protein 2 |
| chr8_-_23457618 | 1.13 |
ENST00000358689.9
ENST00000518718.1 |
ENTPD4
|
ectonucleoside triphosphate diphosphohydrolase 4 |
| chr3_-_52056552 | 1.13 |
ENST00000495880.2
|
DUSP7
|
dual specificity phosphatase 7 |
| chr10_-_14548646 | 1.13 |
ENST00000378470.5
|
FAM107B
|
family with sequence similarity 107 member B |
| chr13_+_40789548 | 1.13 |
ENST00000338625.9
|
SLC25A15
|
solute carrier family 25 member 15 |
| chr3_-_57693045 | 1.13 |
ENST00000311128.10
|
DENND6A
|
DENN domain containing 6A |
| chrX_+_78747705 | 1.11 |
ENST00000614823.5
ENST00000435339.3 ENST00000514744.5 |
LPAR4
|
lysophosphatidic acid receptor 4 |
| chr2_+_30231524 | 1.11 |
ENST00000395323.9
ENST00000406087.5 ENST00000404397.5 |
LBH
|
LBH regulator of WNT signaling pathway |
| chr11_-_67401782 | 1.11 |
ENST00000527663.6
ENST00000312989.11 ENST00000376745.9 ENST00000358239.8 |
PPP1CA
|
protein phosphatase 1 catalytic subunit alpha |
| chr1_+_35807974 | 1.10 |
ENST00000373210.4
|
AGO4
|
argonaute RISC component 4 |
| chr6_-_33580229 | 1.10 |
ENST00000374467.4
ENST00000442998.6 ENST00000360661.9 |
BAK1
|
BCL2 antagonist/killer 1 |
| chr12_+_49539022 | 1.09 |
ENST00000257981.7
|
KCNH3
|
potassium voltage-gated channel subfamily H member 3 |
| chr5_+_111224374 | 1.09 |
ENST00000282356.9
|
CAMK4
|
calcium/calmodulin dependent protein kinase IV |
| chr12_+_49741802 | 1.09 |
ENST00000423828.5
ENST00000550445.5 |
TMBIM6
|
transmembrane BAX inhibitor motif containing 6 |
| chr4_-_56435581 | 1.08 |
ENST00000264220.6
|
PPAT
|
phosphoribosyl pyrophosphate amidotransferase |
| chr14_-_74713041 | 1.07 |
ENST00000356357.9
ENST00000555249.1 ENST00000681599.1 ENST00000556202.5 ENST00000681099.1 |
AREL1
|
apoptosis resistant E3 ubiquitin protein ligase 1 |
| chr18_+_57435366 | 1.05 |
ENST00000491143.3
|
ONECUT2
|
one cut homeobox 2 |
| chr2_-_197310767 | 1.05 |
ENST00000282272.15
ENST00000409153.5 ENST00000409919.5 |
ANKRD44
|
ankyrin repeat domain 44 |
| chr12_-_55830738 | 1.04 |
ENST00000357606.7
ENST00000547445.2 |
DNAJC14
|
DnaJ heat shock protein family (Hsp40) member C14 |
| chr12_-_109880527 | 1.03 |
ENST00000318348.9
|
GLTP
|
glycolipid transfer protein |
| chr5_+_75337211 | 1.02 |
ENST00000287936.9
ENST00000343975.9 |
HMGCR
|
3-hydroxy-3-methylglutaryl-CoA reductase |
| chr11_-_66002123 | 1.01 |
ENST00000532707.5
ENST00000526451.5 ENST00000312234.6 ENST00000533544.6 ENST00000530462.5 ENST00000525767.5 ENST00000529964.5 ENST00000527249.5 |
EIF1AD
|
eukaryotic translation initiation factor 1A domain containing |
| chr14_-_91510144 | 1.00 |
ENST00000554684.5
ENST00000554511.1 ENST00000554943.6 |
PPP4R3A
|
protein phosphatase 4 regulatory subunit 3A |
| chr6_-_31862809 | 1.00 |
ENST00000375631.5
|
NEU1
|
neuraminidase 1 |
| chr2_+_12716893 | 0.99 |
ENST00000381465.2
ENST00000155926.9 |
TRIB2
|
tribbles pseudokinase 2 |
| chr3_-_48635426 | 0.99 |
ENST00000455886.6
ENST00000431739.5 ENST00000426599.1 ENST00000383733.7 ENST00000395550.7 ENST00000420764.6 ENST00000337000.12 |
SLC26A6
|
solute carrier family 26 member 6 |
| chr1_+_203305510 | 0.97 |
ENST00000290551.5
|
BTG2
|
BTG anti-proliferation factor 2 |
| chr12_+_82686889 | 0.97 |
ENST00000321196.8
|
TMTC2
|
transmembrane O-mannosyltransferase targeting cadherins 2 |
| chr12_-_49828394 | 0.97 |
ENST00000335999.7
|
NCKAP5L
|
NCK associated protein 5 like |
| chr1_-_173205543 | 0.97 |
ENST00000367718.5
|
TNFSF4
|
TNF superfamily member 4 |
| chr8_-_66667138 | 0.97 |
ENST00000310421.5
|
VCPIP1
|
valosin containing protein interacting protein 1 |
| chr10_-_58267868 | 0.96 |
ENST00000373935.4
|
IPMK
|
inositol polyphosphate multikinase |
| chr1_-_150579530 | 0.96 |
ENST00000307940.3
ENST00000678610.1 ENST00000678770.1 ENST00000369026.3 |
MCL1
|
MCL1 apoptosis regulator, BCL2 family member |
| chr17_-_28897602 | 0.96 |
ENST00000394906.6
ENST00000585169.5 |
FLOT2
|
flotillin 2 |
| chr1_+_47438036 | 0.95 |
ENST00000334793.6
|
FOXD2
|
forkhead box D2 |
| chr1_-_23168847 | 0.95 |
ENST00000418342.5
|
LUZP1
|
leucine zipper protein 1 |
| chr4_+_56907876 | 0.94 |
ENST00000640168.2
ENST00000309042.12 |
REST
|
RE1 silencing transcription factor |
| chr1_-_155911340 | 0.94 |
ENST00000368323.8
|
RIT1
|
Ras like without CAAX 1 |
| chr12_+_64610458 | 0.92 |
ENST00000542104.6
|
RASSF3
|
Ras association domain family member 3 |
| chr13_-_52450590 | 0.92 |
ENST00000378060.9
|
VPS36
|
vacuolar protein sorting 36 homolog |
| chr2_+_5692357 | 0.91 |
ENST00000322002.5
|
SOX11
|
SRY-box transcription factor 11 |
| chr17_-_42388360 | 0.91 |
ENST00000678960.1
ENST00000404395.3 ENST00000389272.7 ENST00000677421.1 ENST00000585517.5 ENST00000264657.10 ENST00000678048.1 ENST00000678674.1 ENST00000678913.1 ENST00000678572.1 ENST00000678906.1 |
STAT3
|
signal transducer and activator of transcription 3 |
| chr2_-_206086057 | 0.91 |
ENST00000403263.6
|
INO80D
|
INO80 complex subunit D |
| chr2_+_9961165 | 0.90 |
ENST00000405379.6
|
GRHL1
|
grainyhead like transcription factor 1 |
| chr19_+_55339867 | 0.89 |
ENST00000255613.8
|
KMT5C
|
lysine methyltransferase 5C |
| chr14_-_92106607 | 0.88 |
ENST00000340660.10
ENST00000393287.9 ENST00000429774.6 ENST00000545170.5 ENST00000620536.4 ENST00000621269.4 |
ATXN3
|
ataxin 3 |
| chr12_+_56128217 | 0.88 |
ENST00000267113.4
ENST00000394048.10 |
ESYT1
|
extended synaptotagmin 1 |
| chr1_-_21345475 | 0.87 |
ENST00000415912.6
|
ECE1
|
endothelin converting enzyme 1 |
| chr9_-_136245802 | 0.87 |
ENST00000358701.10
|
QSOX2
|
quiescin sulfhydryl oxidase 2 |
| chr1_-_23344314 | 0.87 |
ENST00000374612.5
ENST00000675048.1 ENST00000478691.5 |
HNRNPR
|
heterogeneous nuclear ribonucleoprotein R |
| chr15_+_90201301 | 0.86 |
ENST00000411539.6
|
SEMA4B
|
semaphorin 4B |
| chr4_-_10116779 | 0.86 |
ENST00000499869.7
|
WDR1
|
WD repeat domain 1 |
| chr3_+_172040554 | 0.86 |
ENST00000336824.8
ENST00000423424.5 |
FNDC3B
|
fibronectin type III domain containing 3B |
| chr9_+_123356189 | 0.84 |
ENST00000373631.8
|
CRB2
|
crumbs cell polarity complex component 2 |
| chr15_+_85380565 | 0.84 |
ENST00000559362.5
ENST00000394518.7 |
AKAP13
|
A-kinase anchoring protein 13 |
| chr1_-_37859583 | 0.83 |
ENST00000373036.5
|
MTF1
|
metal regulatory transcription factor 1 |
| chr19_-_18522051 | 0.83 |
ENST00000262809.9
|
ELL
|
elongation factor for RNA polymerase II |
| chr2_-_31138041 | 0.81 |
ENST00000324589.9
|
GALNT14
|
polypeptide N-acetylgalactosaminyltransferase 14 |
| chr6_+_36027677 | 0.81 |
ENST00000622903.4
ENST00000229795.7 |
MAPK14
|
mitogen-activated protein kinase 14 |
| chr17_+_18315273 | 0.81 |
ENST00000406438.5
|
SMCR8
|
SMCR8-C9orf72 complex subunit |
| chr6_-_31660735 | 0.80 |
ENST00000375911.2
|
C6orf47
|
chromosome 6 open reading frame 47 |
| chr10_-_92243246 | 0.80 |
ENST00000412050.8
ENST00000614585.4 |
CPEB3
|
cytoplasmic polyadenylation element binding protein 3 |
| chr12_+_53380639 | 0.79 |
ENST00000426431.2
|
SP1
|
Sp1 transcription factor |
| chr5_-_135452318 | 0.79 |
ENST00000537858.2
|
TIFAB
|
TIFA inhibitor |
| chr19_+_11374658 | 0.78 |
ENST00000674460.1
ENST00000312423.4 |
SWSAP1
|
SWIM-type zinc finger 7 associated protein 1 |
| chr5_-_134226059 | 0.77 |
ENST00000519718.1
ENST00000481195.6 |
ENSG00000272772.1
PPP2CA
|
novel protein protein phosphatase 2 catalytic subunit alpha |
| chr8_-_143617457 | 0.77 |
ENST00000529048.5
ENST00000529064.5 |
GFUS
|
GDP-L-fucose synthase |
| chr17_+_40121955 | 0.77 |
ENST00000398532.9
|
MSL1
|
MSL complex subunit 1 |
| chr20_+_64164446 | 0.76 |
ENST00000328439.6
|
MYT1
|
myelin transcription factor 1 |
| chr8_-_63086031 | 0.76 |
ENST00000260116.5
|
TTPA
|
alpha tocopherol transfer protein |
| chr9_-_19786928 | 0.75 |
ENST00000341998.6
ENST00000286344.3 |
SLC24A2
|
solute carrier family 24 member 2 |
| chr12_-_68159732 | 0.75 |
ENST00000229135.4
|
IFNG
|
interferon gamma |
| chr20_-_32483438 | 0.74 |
ENST00000359676.9
|
NOL4L
|
nucleolar protein 4 like |
| chr11_+_75815180 | 0.74 |
ENST00000356136.8
|
UVRAG
|
UV radiation resistance associated |
| chr1_-_35557378 | 0.73 |
ENST00000325722.8
ENST00000469892.5 |
KIAA0319L
|
KIAA0319 like |
| chr10_+_96832252 | 0.73 |
ENST00000676187.1
ENST00000675687.1 ENST00000676123.1 ENST00000675471.1 ENST00000371103.8 ENST00000421806.4 ENST00000675250.1 ENST00000540664.6 ENST00000676414.1 |
LCOR
|
ligand dependent nuclear receptor corepressor |
| chr8_+_75539862 | 0.73 |
ENST00000396423.4
|
HNF4G
|
hepatocyte nuclear factor 4 gamma |
| chr1_+_16367088 | 0.71 |
ENST00000471507.5
ENST00000401089.3 ENST00000401088.9 ENST00000492354.1 |
SZRD1
|
SUZ RNA binding domain containing 1 |
| chr6_-_110815408 | 0.71 |
ENST00000368911.8
|
CDK19
|
cyclin dependent kinase 19 |
| chr3_+_9731725 | 0.71 |
ENST00000433861.6
ENST00000383829.7 ENST00000684333.1 ENST00000683743.1 ENST00000683639.1 ENST00000684206.1 ENST00000420291.3 ENST00000424362.7 |
BRPF1
|
bromodomain and PHD finger containing 1 |
| chr8_-_52409743 | 0.71 |
ENST00000276480.11
|
ST18
|
ST18 C2H2C-type zinc finger transcription factor |
| chr6_-_43629222 | 0.70 |
ENST00000307126.10
|
GTPBP2
|
GTP binding protein 2 |
| chr5_+_151771884 | 0.70 |
ENST00000627077.2
ENST00000678976.1 ENST00000677408.1 ENST00000678070.1 ENST00000678964.1 ENST00000678925.1 ENST00000394123.7 ENST00000522761.6 ENST00000676827.1 |
G3BP1
|
G3BP stress granule assembly factor 1 |
| chr16_-_79600698 | 0.70 |
ENST00000393350.1
|
MAF
|
MAF bZIP transcription factor |
| chr1_+_160081529 | 0.70 |
ENST00000368088.4
|
KCNJ9
|
potassium inwardly rectifying channel subfamily J member 9 |
Network of associatons between targets according to the STRING database.

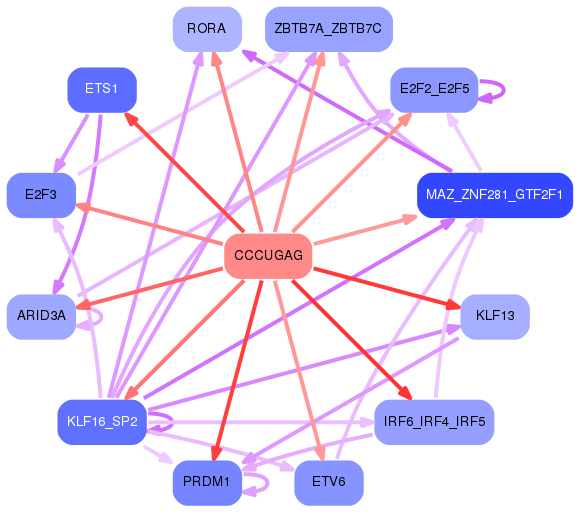
First level regulatory network of CCCUGAG
Gene Ontology Analysis
Gene overrepresentation in biological process category:
| Log-likelihood per target | Total log-likelihood | Term | Description |
|---|---|---|---|
| 1.4 | 4.1 | GO:0045082 | interleukin-13 biosynthetic process(GO:0042231) positive regulation of interleukin-10 biosynthetic process(GO:0045082) |
| 1.3 | 3.8 | GO:1990654 | sebum secreting cell proliferation(GO:1990654) |
| 1.2 | 3.6 | GO:0036510 | trimming of terminal mannose on C branch(GO:0036510) |
| 0.9 | 5.5 | GO:1903904 | negative regulation of establishment of T cell polarity(GO:1903904) negative regulation of Rho guanyl-nucleotide exchange factor activity(GO:2001107) |
| 0.8 | 2.4 | GO:0044725 | chromatin reprogramming in the zygote(GO:0044725) |
| 0.8 | 3.9 | GO:0042663 | regulation of endodermal cell fate specification(GO:0042663) |
| 0.7 | 2.8 | GO:0018125 | peptidyl-cysteine methylation(GO:0018125) |
| 0.5 | 1.0 | GO:0042091 | interleukin-10 biosynthetic process(GO:0042091) regulation of interleukin-10 biosynthetic process(GO:0045074) |
| 0.5 | 1.4 | GO:1903774 | positive regulation of viral budding via host ESCRT complex(GO:1903774) |
| 0.4 | 1.3 | GO:0045897 | positive regulation of transcription during mitosis(GO:0045897) |
| 0.4 | 1.6 | GO:1990086 | lens fiber cell apoptotic process(GO:1990086) |
| 0.4 | 1.2 | GO:1904562 | phosphatidylinositol 5-phosphate metabolic process(GO:1904562) |
| 0.4 | 4.0 | GO:2000491 | positive regulation of hepatic stellate cell activation(GO:2000491) |
| 0.4 | 1.5 | GO:1902544 | regulation of DNA N-glycosylase activity(GO:1902544) |
| 0.4 | 0.7 | GO:0060557 | positive regulation of vitamin metabolic process(GO:0046136) positive regulation of vitamin D biosynthetic process(GO:0060557) positive regulation of calcidiol 1-monooxygenase activity(GO:0060559) |
| 0.4 | 1.1 | GO:0002339 | B cell selection(GO:0002339) |
| 0.4 | 1.1 | GO:0002372 | myeloid dendritic cell cytokine production(GO:0002372) |
| 0.4 | 1.8 | GO:0046671 | negative regulation of cellular pH reduction(GO:0032848) CD8-positive, alpha-beta T cell lineage commitment(GO:0043375) negative regulation of retinal cell programmed cell death(GO:0046671) |
| 0.4 | 1.4 | GO:1990168 | protein K27-linked deubiquitination(GO:1990167) protein K33-linked deubiquitination(GO:1990168) |
| 0.3 | 1.7 | GO:0000379 | tRNA-type intron splice site recognition and cleavage(GO:0000379) |
| 0.3 | 1.0 | GO:0042938 | dipeptide transport(GO:0042938) |
| 0.3 | 3.6 | GO:1904996 | positive regulation of leukocyte adhesion to vascular endothelial cell(GO:1904996) |
| 0.3 | 1.0 | GO:2000523 | regulation of T cell costimulation(GO:2000523) positive regulation of T cell costimulation(GO:2000525) |
| 0.3 | 1.9 | GO:1902162 | mRNA localization resulting in posttranscriptional regulation of gene expression(GO:0010609) platelet alpha granule organization(GO:0070889) regulation of DNA damage response, signal transduction by p53 class mediator resulting in transcription of p21 class mediator(GO:1902162) positive regulation of DNA damage response, signal transduction by p53 class mediator resulting in transcription of p21 class mediator(GO:1902164) |
| 0.3 | 1.3 | GO:1904761 | negative regulation of myofibroblast differentiation(GO:1904761) |
| 0.3 | 0.9 | GO:0021503 | neural fold bending(GO:0021503) |
| 0.3 | 0.9 | GO:2000798 | amniotic stem cell differentiation(GO:0097086) negative regulation of dense core granule biogenesis(GO:2000706) negative regulation of mesenchymal stem cell differentiation(GO:2000740) regulation of amniotic stem cell differentiation(GO:2000797) negative regulation of amniotic stem cell differentiation(GO:2000798) |
| 0.3 | 0.9 | GO:0010730 | negative regulation of hydrogen peroxide biosynthetic process(GO:0010730) |
| 0.3 | 2.4 | GO:0035234 | ectopic germ cell programmed cell death(GO:0035234) |
| 0.3 | 1.2 | GO:0048205 | COPI-coated vesicle budding(GO:0035964) Golgi transport vesicle coating(GO:0048200) COPI coating of Golgi vesicle(GO:0048205) |
| 0.3 | 2.4 | GO:0090625 | mRNA cleavage involved in gene silencing by siRNA(GO:0090625) |
| 0.3 | 1.4 | GO:0002384 | hepatic immune response(GO:0002384) |
| 0.3 | 1.4 | GO:0035574 | histone H4-K20 demethylation(GO:0035574) |
| 0.3 | 1.1 | GO:0036496 | regulation of translational initiation by eIF2 alpha dephosphorylation(GO:0036496) |
| 0.3 | 0.8 | GO:1900365 | positive regulation of mRNA polyadenylation(GO:1900365) |
| 0.3 | 4.0 | GO:0045647 | negative regulation of erythrocyte differentiation(GO:0045647) |
| 0.3 | 1.6 | GO:0051461 | positive regulation of corticotropin secretion(GO:0051461) |
| 0.3 | 0.8 | GO:0100057 | regulation of phenotypic switching by transcription from RNA polymerase II promoter(GO:0100057) regulation of hydrogen sulfide biosynthetic process(GO:1904826) positive regulation of hydrogen sulfide biosynthetic process(GO:1904828) |
| 0.3 | 0.8 | GO:0071626 | mastication(GO:0071626) learned vocalization behavior(GO:0098583) |
| 0.3 | 3.1 | GO:0007256 | activation of JNKK activity(GO:0007256) |
| 0.2 | 0.9 | GO:0061386 | closure of optic fissure(GO:0061386) |
| 0.2 | 1.3 | GO:0036079 | GDP-fucose transport(GO:0015783) purine nucleotide-sugar transport(GO:0036079) |
| 0.2 | 2.0 | GO:0070345 | negative regulation of fat cell proliferation(GO:0070345) |
| 0.2 | 0.7 | GO:0006114 | glycerol biosynthetic process(GO:0006114) |
| 0.2 | 0.9 | GO:0016333 | morphogenesis of follicular epithelium(GO:0016333) establishment or maintenance of polarity of follicular epithelium(GO:0016334) establishment of planar polarity of follicular epithelium(GO:0042247) |
| 0.2 | 4.2 | GO:0001574 | ganglioside biosynthetic process(GO:0001574) |
| 0.2 | 0.8 | GO:0014028 | notochord formation(GO:0014028) |
| 0.2 | 4.1 | GO:0045779 | negative regulation of bone resorption(GO:0045779) |
| 0.2 | 2.5 | GO:0070862 | negative regulation of protein exit from endoplasmic reticulum(GO:0070862) negative regulation of retrograde protein transport, ER to cytosol(GO:1904153) |
| 0.2 | 1.8 | GO:0019262 | N-acetylneuraminate catabolic process(GO:0019262) |
| 0.2 | 3.5 | GO:0006054 | N-acetylneuraminate metabolic process(GO:0006054) |
| 0.2 | 5.0 | GO:0050930 | induction of positive chemotaxis(GO:0050930) |
| 0.2 | 2.1 | GO:0060352 | cell adhesion molecule production(GO:0060352) |
| 0.2 | 1.1 | GO:1903352 | L-ornithine transmembrane transport(GO:1903352) |
| 0.2 | 1.1 | GO:1904674 | positive regulation of somatic stem cell population maintenance(GO:1904674) |
| 0.2 | 0.6 | GO:1903691 | positive regulation of wound healing, spreading of epidermal cells(GO:1903691) |
| 0.2 | 0.9 | GO:0043328 | protein targeting to vacuole involved in ubiquitin-dependent protein catabolic process via the multivesicular body sorting pathway(GO:0043328) |
| 0.2 | 1.1 | GO:0035871 | protein K11-linked deubiquitination(GO:0035871) |
| 0.2 | 1.3 | GO:0032484 | Ral protein signal transduction(GO:0032484) regulation of Ral protein signal transduction(GO:0032485) |
| 0.2 | 0.5 | GO:2000646 | positive regulation of receptor catabolic process(GO:2000646) |
| 0.2 | 1.4 | GO:0007296 | vitellogenesis(GO:0007296) |
| 0.2 | 1.6 | GO:0002480 | antigen processing and presentation of exogenous peptide antigen via MHC class I, TAP-independent(GO:0002480) |
| 0.2 | 1.1 | GO:0009138 | pyrimidine nucleoside diphosphate metabolic process(GO:0009138) |
| 0.2 | 1.6 | GO:0071926 | endocannabinoid signaling pathway(GO:0071926) |
| 0.2 | 1.1 | GO:1904721 | negative regulation of mRNA cleavage(GO:0031438) negative regulation of mRNA endonucleolytic cleavage involved in unfolded protein response(GO:1904721) |
| 0.2 | 1.5 | GO:1901098 | positive regulation of autophagosome maturation(GO:1901098) |
| 0.2 | 1.5 | GO:0018230 | peptidyl-L-cysteine S-palmitoylation(GO:0018230) peptidyl-S-diacylglycerol-L-cysteine biosynthetic process from peptidyl-cysteine(GO:0018231) |
| 0.2 | 1.1 | GO:0006543 | glutamine catabolic process(GO:0006543) |
| 0.2 | 0.8 | GO:0042360 | vitamin E metabolic process(GO:0042360) |
| 0.1 | 0.6 | GO:0061163 | endoplasmic reticulum polarization(GO:0061163) actin filament bundle retrograde transport(GO:0061573) actin filament bundle distribution(GO:0070650) |
| 0.1 | 0.4 | GO:0090176 | microtubule cytoskeleton organization involved in establishment of planar polarity(GO:0090176) |
| 0.1 | 2.4 | GO:0043983 | histone H4-K12 acetylation(GO:0043983) |
| 0.1 | 0.3 | GO:0033023 | mast cell homeostasis(GO:0033023) mast cell apoptotic process(GO:0033024) regulation of mast cell apoptotic process(GO:0033025) |
| 0.1 | 1.0 | GO:1903903 | regulation of establishment of T cell polarity(GO:1903903) |
| 0.1 | 0.8 | GO:2001184 | myoblast differentiation involved in skeletal muscle regeneration(GO:0014835) positive regulation of interleukin-12 secretion(GO:2001184) |
| 0.1 | 1.3 | GO:0051534 | negative regulation of NFAT protein import into nucleus(GO:0051534) |
| 0.1 | 0.5 | GO:1903722 | regulation of centriole elongation(GO:1903722) |
| 0.1 | 3.5 | GO:0051044 | positive regulation of membrane protein ectodomain proteolysis(GO:0051044) |
| 0.1 | 1.4 | GO:0046836 | glycolipid transport(GO:0046836) |
| 0.1 | 2.2 | GO:0042354 | fucose catabolic process(GO:0019317) L-fucose metabolic process(GO:0042354) L-fucose catabolic process(GO:0042355) |
| 0.1 | 0.9 | GO:0010814 | substance P catabolic process(GO:0010814) calcitonin catabolic process(GO:0010816) endothelin maturation(GO:0034959) |
| 0.1 | 1.0 | GO:1903378 | positive regulation of oxidative stress-induced neuron intrinsic apoptotic signaling pathway(GO:1903378) |
| 0.1 | 0.8 | GO:0042796 | snRNA transcription from RNA polymerase III promoter(GO:0042796) |
| 0.1 | 1.9 | GO:0021702 | cerebellar Purkinje cell layer formation(GO:0021694) cerebellar Purkinje cell differentiation(GO:0021702) |
| 0.1 | 0.3 | GO:0015882 | L-ascorbic acid transport(GO:0015882) molecular hydrogen transport(GO:0015993) transepithelial L-ascorbic acid transport(GO:0070904) |
| 0.1 | 0.5 | GO:0003342 | proepicardium development(GO:0003342) septum transversum development(GO:0003343) occluding junction disassembly(GO:1905071) regulation of occluding junction disassembly(GO:1905073) positive regulation of occluding junction disassembly(GO:1905075) |
| 0.1 | 1.1 | GO:2000049 | positive regulation of cell-cell adhesion mediated by cadherin(GO:2000049) |
| 0.1 | 1.8 | GO:0015693 | magnesium ion transport(GO:0015693) |
| 0.1 | 3.9 | GO:0030220 | platelet formation(GO:0030220) |
| 0.1 | 3.0 | GO:0002467 | germinal center formation(GO:0002467) |
| 0.1 | 0.3 | GO:0060392 | negative regulation of SMAD protein import into nucleus(GO:0060392) |
| 0.1 | 0.4 | GO:0060057 | lactose metabolic process(GO:0005988) lactose biosynthetic process(GO:0005989) apoptotic process involved in mammary gland involution(GO:0060057) positive regulation of apoptotic process involved in mammary gland involution(GO:0060058) positive regulation of apoptotic process involved in morphogenesis(GO:1902339) regulation of mammary gland involution(GO:1903519) positive regulation of mammary gland involution(GO:1903521) positive regulation of apoptotic process involved in development(GO:1904747) |
| 0.1 | 5.8 | GO:0006409 | tRNA export from nucleus(GO:0006409) tRNA-containing ribonucleoprotein complex export from nucleus(GO:0071431) |
| 0.1 | 0.5 | GO:1902268 | negative regulation of polyamine transmembrane transport(GO:1902268) |
| 0.1 | 0.8 | GO:0071883 | activation of MAPK activity by adrenergic receptor signaling pathway(GO:0071883) regulation of glucocorticoid mediated signaling pathway(GO:1900169) |
| 0.1 | 0.5 | GO:0071034 | CUT catabolic process(GO:0071034) CUT metabolic process(GO:0071043) |
| 0.1 | 1.9 | GO:0045793 | positive regulation of cell size(GO:0045793) |
| 0.1 | 0.5 | GO:2001270 | regulation of cysteine-type endopeptidase activity involved in execution phase of apoptosis(GO:2001270) negative regulation of cysteine-type endopeptidase activity involved in execution phase of apoptosis(GO:2001271) |
| 0.1 | 0.9 | GO:0034773 | histone H4-K20 trimethylation(GO:0034773) |
| 0.1 | 1.4 | GO:0001553 | luteinization(GO:0001553) |
| 0.1 | 0.5 | GO:1900224 | positive regulation of nodal signaling pathway involved in determination of lateral mesoderm left/right asymmetry(GO:1900224) |
| 0.1 | 0.4 | GO:0010587 | miRNA catabolic process(GO:0010587) |
| 0.1 | 0.9 | GO:1904379 | protein localization to cytosolic proteasome complex(GO:1904327) protein localization to cytosolic proteasome complex involved in ERAD pathway(GO:1904379) |
| 0.1 | 0.6 | GO:0009838 | abscission(GO:0009838) |
| 0.1 | 2.5 | GO:0045577 | regulation of B cell differentiation(GO:0045577) |
| 0.1 | 1.0 | GO:0061179 | negative regulation of insulin secretion involved in cellular response to glucose stimulus(GO:0061179) |
| 0.1 | 0.5 | GO:0045410 | positive regulation of interleukin-6 biosynthetic process(GO:0045410) |
| 0.1 | 0.5 | GO:0048549 | positive regulation of pinocytosis(GO:0048549) |
| 0.1 | 1.0 | GO:0006689 | ganglioside catabolic process(GO:0006689) |
| 0.1 | 0.5 | GO:0034499 | late endosome to Golgi transport(GO:0034499) |
| 0.1 | 0.2 | GO:1901383 | negative regulation of chorionic trophoblast cell proliferation(GO:1901383) |
| 0.1 | 4.2 | GO:0090162 | establishment of epithelial cell polarity(GO:0090162) |
| 0.1 | 0.5 | GO:1904448 | negative regulation of gamma-aminobutyric acid secretion(GO:0014053) aspartate secretion(GO:0061528) regulation of aspartate secretion(GO:1904448) positive regulation of aspartate secretion(GO:1904450) |
| 0.1 | 1.8 | GO:1904380 | endoplasmic reticulum mannose trimming(GO:1904380) |
| 0.1 | 0.3 | GO:0009298 | GDP-mannose biosynthetic process(GO:0009298) |
| 0.1 | 0.6 | GO:0072719 | copper ion import(GO:0015677) cellular response to cisplatin(GO:0072719) |
| 0.1 | 1.4 | GO:1900745 | positive regulation of p38MAPK cascade(GO:1900745) |
| 0.1 | 3.7 | GO:0043171 | peptide catabolic process(GO:0043171) |
| 0.1 | 0.7 | GO:0000160 | phosphorelay signal transduction system(GO:0000160) |
| 0.1 | 3.2 | GO:0030890 | positive regulation of B cell proliferation(GO:0030890) |
| 0.1 | 0.6 | GO:0007217 | tachykinin receptor signaling pathway(GO:0007217) |
| 0.1 | 0.7 | GO:0070102 | interleukin-6-mediated signaling pathway(GO:0070102) |
| 0.1 | 1.2 | GO:0033008 | positive regulation of mast cell activation involved in immune response(GO:0033008) positive regulation of mast cell degranulation(GO:0043306) |
| 0.1 | 0.3 | GO:1904550 | chemotaxis to arachidonic acid(GO:0034670) response to arachidonic acid(GO:1904550) |
| 0.1 | 0.5 | GO:0036089 | cleavage furrow formation(GO:0036089) |
| 0.1 | 0.6 | GO:0006572 | tyrosine catabolic process(GO:0006572) |
| 0.1 | 1.4 | GO:0035020 | regulation of Rac protein signal transduction(GO:0035020) |
| 0.1 | 2.5 | GO:0043029 | T cell homeostasis(GO:0043029) |
| 0.1 | 1.7 | GO:0048873 | homeostasis of number of cells within a tissue(GO:0048873) |
| 0.1 | 0.6 | GO:0034378 | chylomicron assembly(GO:0034378) |
| 0.1 | 1.2 | GO:0006474 | N-terminal protein amino acid acetylation(GO:0006474) |
| 0.0 | 0.9 | GO:0002934 | desmosome organization(GO:0002934) |
| 0.0 | 0.2 | GO:0016062 | adaptation of rhodopsin mediated signaling(GO:0016062) light adaption(GO:0036367) |
| 0.0 | 2.7 | GO:0002755 | MyD88-dependent toll-like receptor signaling pathway(GO:0002755) |
| 0.0 | 2.3 | GO:0045747 | positive regulation of Notch signaling pathway(GO:0045747) |
| 0.0 | 0.4 | GO:0099590 | neurotransmitter receptor internalization(GO:0099590) |
| 0.0 | 1.1 | GO:0007084 | mitotic nuclear envelope reassembly(GO:0007084) |
| 0.0 | 1.2 | GO:0097320 | membrane tubulation(GO:0097320) |
| 0.0 | 1.3 | GO:0010172 | embryonic body morphogenesis(GO:0010172) |
| 0.0 | 1.2 | GO:0035162 | embryonic hemopoiesis(GO:0035162) |
| 0.0 | 0.5 | GO:0000183 | chromatin silencing at rDNA(GO:0000183) |
| 0.0 | 1.4 | GO:0071218 | cellular response to misfolded protein(GO:0071218) |
| 0.0 | 3.8 | GO:0006977 | DNA damage response, signal transduction by p53 class mediator resulting in cell cycle arrest(GO:0006977) signal transduction involved in mitotic G1 DNA damage checkpoint(GO:0072431) intracellular signal transduction involved in G1 DNA damage checkpoint(GO:1902400) |
| 0.0 | 0.5 | GO:0070544 | histone H3-K36 demethylation(GO:0070544) |
| 0.0 | 1.3 | GO:0035518 | histone H2A monoubiquitination(GO:0035518) |
| 0.0 | 0.2 | GO:0042369 | vitamin D catabolic process(GO:0042369) |
| 0.0 | 0.3 | GO:1990928 | response to amino acid starvation(GO:1990928) |
| 0.0 | 0.5 | GO:0006655 | phosphatidylglycerol biosynthetic process(GO:0006655) |
| 0.0 | 0.7 | GO:0032464 | positive regulation of protein homooligomerization(GO:0032464) |
| 0.0 | 0.2 | GO:0090370 | negative regulation of cholesterol efflux(GO:0090370) |
| 0.0 | 2.3 | GO:0006656 | phosphatidylcholine biosynthetic process(GO:0006656) |
| 0.0 | 1.4 | GO:0031648 | protein destabilization(GO:0031648) |
| 0.0 | 0.2 | GO:0035549 | positive regulation of interferon-beta secretion(GO:0035549) |
| 0.0 | 1.9 | GO:0006198 | cAMP catabolic process(GO:0006198) |
| 0.0 | 0.7 | GO:0061157 | mRNA destabilization(GO:0061157) |
| 0.0 | 0.4 | GO:0006999 | nuclear pore organization(GO:0006999) nuclear pore complex assembly(GO:0051292) |
| 0.0 | 2.0 | GO:2000134 | negative regulation of G1/S transition of mitotic cell cycle(GO:2000134) |
| 0.0 | 0.2 | GO:0008063 | Toll signaling pathway(GO:0008063) |
| 0.0 | 0.1 | GO:0002071 | glandular epithelial cell maturation(GO:0002071) type B pancreatic cell maturation(GO:0072560) positive regulation of type B pancreatic cell development(GO:2000078) |
| 0.0 | 1.6 | GO:0045494 | photoreceptor cell maintenance(GO:0045494) |
| 0.0 | 0.6 | GO:0034656 | nucleobase-containing small molecule catabolic process(GO:0034656) |
| 0.0 | 0.2 | GO:0036155 | acylglycerol acyl-chain remodeling(GO:0036155) |
| 0.0 | 0.3 | GO:0035372 | protein localization to microtubule(GO:0035372) |
| 0.0 | 2.3 | GO:0006879 | cellular iron ion homeostasis(GO:0006879) |
| 0.0 | 0.5 | GO:0030150 | protein import into mitochondrial matrix(GO:0030150) |
| 0.0 | 1.1 | GO:0051482 | positive regulation of cytosolic calcium ion concentration involved in phospholipase C-activating G-protein coupled signaling pathway(GO:0051482) |
| 0.0 | 0.3 | GO:0090161 | Golgi ribbon formation(GO:0090161) |
| 0.0 | 0.4 | GO:0070389 | chaperone cofactor-dependent protein refolding(GO:0070389) |
| 0.0 | 2.4 | GO:0007212 | dopamine receptor signaling pathway(GO:0007212) |
| 0.0 | 0.3 | GO:0044387 | negative regulation of protein kinase activity by regulation of protein phosphorylation(GO:0044387) |
| 0.0 | 1.9 | GO:0046580 | negative regulation of Ras protein signal transduction(GO:0046580) |
| 0.0 | 0.5 | GO:0007175 | negative regulation of epidermal growth factor-activated receptor activity(GO:0007175) |
| 0.0 | 0.4 | GO:0061099 | negative regulation of protein tyrosine kinase activity(GO:0061099) |
| 0.0 | 1.0 | GO:0007019 | microtubule depolymerization(GO:0007019) |
| 0.0 | 0.1 | GO:0060023 | soft palate development(GO:0060023) |
| 0.0 | 0.2 | GO:2001241 | positive regulation of extrinsic apoptotic signaling pathway in absence of ligand(GO:2001241) |
| 0.0 | 1.0 | GO:0031018 | endocrine pancreas development(GO:0031018) |
| 0.0 | 0.5 | GO:2000758 | positive regulation of histone acetylation(GO:0035066) positive regulation of peptidyl-lysine acetylation(GO:2000758) |
| 0.0 | 1.9 | GO:0002479 | antigen processing and presentation of exogenous peptide antigen via MHC class I, TAP-dependent(GO:0002479) |
| 0.0 | 1.7 | GO:0016266 | O-glycan processing(GO:0016266) |
| 0.0 | 0.1 | GO:0021699 | cerebellum maturation(GO:0021590) cerebellar Purkinje cell layer maturation(GO:0021691) cerebellar cortex maturation(GO:0021699) |
| 0.0 | 0.1 | GO:0046952 | ketone body catabolic process(GO:0046952) |
| 0.0 | 0.7 | GO:0032008 | positive regulation of TOR signaling(GO:0032008) |
| 0.0 | 0.8 | GO:0043984 | histone H4-K16 acetylation(GO:0043984) |
| 0.0 | 0.2 | GO:2000773 | negative regulation of cellular senescence(GO:2000773) |
| 0.0 | 0.2 | GO:0000338 | protein deneddylation(GO:0000338) |
| 0.0 | 0.4 | GO:0031998 | regulation of fatty acid beta-oxidation(GO:0031998) |
| 0.0 | 0.5 | GO:0034204 | lipid translocation(GO:0034204) phospholipid translocation(GO:0045332) |
| 0.0 | 0.6 | GO:0000188 | inactivation of MAPK activity(GO:0000188) |
| 0.0 | 0.8 | GO:0046686 | response to cadmium ion(GO:0046686) |
| 0.0 | 1.0 | GO:1902108 | regulation of mitochondrial membrane permeability involved in apoptotic process(GO:1902108) |
| 0.0 | 0.8 | GO:0034260 | negative regulation of GTPase activity(GO:0034260) |
| 0.0 | 1.3 | GO:0007032 | endosome organization(GO:0007032) |
| 0.0 | 0.0 | GO:0003358 | noradrenergic neuron development(GO:0003358) |
| 0.0 | 0.2 | GO:0016973 | poly(A)+ mRNA export from nucleus(GO:0016973) |
| 0.0 | 0.2 | GO:0038003 | opioid receptor signaling pathway(GO:0038003) |
| 0.0 | 0.4 | GO:0090503 | RNA phosphodiester bond hydrolysis, exonucleolytic(GO:0090503) |
| 0.0 | 0.7 | GO:0070306 | lens fiber cell differentiation(GO:0070306) |
| 0.0 | 2.6 | GO:0051168 | nuclear export(GO:0051168) |
| 0.0 | 1.4 | GO:0043647 | inositol phosphate metabolic process(GO:0043647) |
| 0.0 | 0.6 | GO:1902042 | negative regulation of extrinsic apoptotic signaling pathway via death domain receptors(GO:1902042) |
| 0.0 | 0.6 | GO:0021762 | substantia nigra development(GO:0021762) |
| 0.0 | 0.9 | GO:0015701 | bicarbonate transport(GO:0015701) |
Gene overrepresentation in cellular component category:
| Log-likelihood per target | Total log-likelihood | Term | Description |
|---|---|---|---|
| 0.6 | 4.1 | GO:0000788 | nuclear nucleosome(GO:0000788) |
| 0.5 | 4.3 | GO:0043196 | varicosity(GO:0043196) |
| 0.5 | 5.5 | GO:0060171 | stereocilium membrane(GO:0060171) |
| 0.4 | 2.5 | GO:0042272 | nuclear RNA export factor complex(GO:0042272) |
| 0.4 | 1.8 | GO:0000839 | Hrd1p ubiquitin ligase ERAD-L complex(GO:0000839) |
| 0.3 | 1.6 | GO:0031905 | early endosome lumen(GO:0031905) |
| 0.3 | 0.9 | GO:0000814 | ESCRT II complex(GO:0000814) |
| 0.3 | 1.7 | GO:0000214 | tRNA-intron endonuclease complex(GO:0000214) |
| 0.3 | 1.1 | GO:0097637 | intrinsic component of autophagosome membrane(GO:0097636) integral component of autophagosome membrane(GO:0097637) |
| 0.3 | 2.2 | GO:1990111 | spermatoproteasome complex(GO:1990111) |
| 0.2 | 1.4 | GO:0005896 | interleukin-6 receptor complex(GO:0005896) |
| 0.2 | 2.4 | GO:0001940 | male pronucleus(GO:0001940) |
| 0.2 | 0.8 | GO:0097196 | Shu complex(GO:0097196) |
| 0.2 | 0.5 | GO:0002947 | tumor necrosis factor receptor superfamily complex(GO:0002947) |
| 0.2 | 2.3 | GO:0097197 | tetraspanin-enriched microdomain(GO:0097197) |
| 0.2 | 0.9 | GO:0042643 | actomyosin, actin portion(GO:0042643) |
| 0.2 | 2.4 | GO:0035068 | micro-ribonucleoprotein complex(GO:0035068) |
| 0.2 | 0.8 | GO:0035363 | histone locus body(GO:0035363) |
| 0.1 | 0.4 | GO:0031251 | PAN complex(GO:0031251) |
| 0.1 | 1.8 | GO:0097136 | Bcl-2 family protein complex(GO:0097136) |
| 0.1 | 0.9 | GO:0031302 | intrinsic component of endosome membrane(GO:0031302) |
| 0.1 | 1.6 | GO:0051286 | cell tip(GO:0051286) |
| 0.1 | 2.8 | GO:0042588 | zymogen granule(GO:0042588) |
| 0.1 | 3.6 | GO:0044322 | endoplasmic reticulum quality control compartment(GO:0044322) |
| 0.1 | 0.4 | GO:0097629 | extrinsic component of omegasome membrane(GO:0097629) |
| 0.1 | 1.4 | GO:0000813 | ESCRT I complex(GO:0000813) |
| 0.1 | 1.2 | GO:0042405 | nuclear inclusion body(GO:0042405) |
| 0.1 | 1.1 | GO:0042587 | glycogen granule(GO:0042587) |
| 0.1 | 0.5 | GO:0033553 | rDNA heterochromatin(GO:0033553) |
| 0.1 | 2.1 | GO:0046930 | pore complex(GO:0046930) |
| 0.1 | 0.5 | GO:0032444 | activin responsive factor complex(GO:0032444) |
| 0.1 | 0.8 | GO:1990316 | ATG1/ULK1 kinase complex(GO:1990316) |
| 0.1 | 0.5 | GO:0032144 | 4-aminobutyrate transaminase complex(GO:0032144) |
| 0.1 | 0.7 | GO:0071986 | Ragulator complex(GO:0071986) |
| 0.1 | 0.8 | GO:0072487 | MSL complex(GO:0072487) |
| 0.1 | 1.2 | GO:0090543 | Flemming body(GO:0090543) |
| 0.1 | 1.9 | GO:0031235 | intrinsic component of the cytoplasmic side of the plasma membrane(GO:0031235) |
| 0.1 | 0.5 | GO:0070022 | transforming growth factor beta receptor homodimeric complex(GO:0070022) |
| 0.1 | 5.8 | GO:0018995 | host(GO:0018995) host cell(GO:0043657) |
| 0.1 | 0.5 | GO:0097443 | sorting endosome(GO:0097443) |
| 0.0 | 0.4 | GO:0000235 | astral microtubule(GO:0000235) aster(GO:0005818) |
| 0.0 | 0.4 | GO:0097427 | microtubule bundle(GO:0097427) |
| 0.0 | 0.3 | GO:1990589 | ATF4-CREB1 transcription factor complex(GO:1990589) |
| 0.0 | 0.7 | GO:0070775 | H3 histone acetyltransferase complex(GO:0070775) MOZ/MORF histone acetyltransferase complex(GO:0070776) |
| 0.0 | 0.5 | GO:0042382 | paraspeckles(GO:0042382) |
| 0.0 | 0.7 | GO:0030897 | HOPS complex(GO:0030897) |
| 0.0 | 5.6 | GO:0032580 | Golgi cisterna membrane(GO:0032580) |
| 0.0 | 1.0 | GO:0031254 | uropod(GO:0001931) cell trailing edge(GO:0031254) |
| 0.0 | 1.0 | GO:0097225 | sperm midpiece(GO:0097225) |
| 0.0 | 0.1 | GO:0005592 | collagen type XI trimer(GO:0005592) |
| 0.0 | 7.6 | GO:0005793 | endoplasmic reticulum-Golgi intermediate compartment(GO:0005793) |
| 0.0 | 0.9 | GO:0044232 | organelle membrane contact site(GO:0044232) |
| 0.0 | 4.1 | GO:0101003 | ficolin-1-rich granule membrane(GO:0101003) |
| 0.0 | 0.2 | GO:0032937 | SREBP-SCAP-Insig complex(GO:0032937) |
| 0.0 | 1.2 | GO:0001891 | phagocytic cup(GO:0001891) |
| 0.0 | 0.5 | GO:0000176 | nuclear exosome (RNase complex)(GO:0000176) |
| 0.0 | 0.9 | GO:0000780 | condensed nuclear chromosome, centromeric region(GO:0000780) |
| 0.0 | 0.5 | GO:0030914 | STAGA complex(GO:0030914) |
| 0.0 | 0.5 | GO:0035631 | CD40 receptor complex(GO:0035631) |
| 0.0 | 0.1 | GO:0036513 | Derlin-1 retrotranslocation complex(GO:0036513) |
| 0.0 | 0.2 | GO:0048179 | activin receptor complex(GO:0048179) |
| 0.0 | 0.8 | GO:0030014 | CCR4-NOT complex(GO:0030014) |
| 0.0 | 1.4 | GO:0035371 | microtubule plus-end(GO:0035371) |
| 0.0 | 2.4 | GO:0000123 | histone acetyltransferase complex(GO:0000123) |
| 0.0 | 2.9 | GO:0005637 | nuclear inner membrane(GO:0005637) |
| 0.0 | 0.4 | GO:0098839 | postsynaptic density membrane(GO:0098839) |
| 0.0 | 0.2 | GO:0030663 | COPI vesicle coat(GO:0030126) COPI-coated vesicle membrane(GO:0030663) |
| 0.0 | 1.6 | GO:0045171 | intercellular bridge(GO:0045171) |
| 0.0 | 1.6 | GO:0001917 | photoreceptor inner segment(GO:0001917) |
| 0.0 | 1.1 | GO:0030131 | clathrin adaptor complex(GO:0030131) |
| 0.0 | 0.2 | GO:0005744 | mitochondrial inner membrane presequence translocase complex(GO:0005744) |
| 0.0 | 3.7 | GO:0090575 | RNA polymerase II transcription factor complex(GO:0090575) |
| 0.0 | 4.4 | GO:0031234 | extrinsic component of cytoplasmic side of plasma membrane(GO:0031234) |
| 0.0 | 3.3 | GO:0016605 | PML body(GO:0016605) |
| 0.0 | 0.9 | GO:0000159 | protein phosphatase type 2A complex(GO:0000159) |
| 0.0 | 0.6 | GO:0044295 | axonal growth cone(GO:0044295) |
| 0.0 | 0.7 | GO:0016592 | mediator complex(GO:0016592) |
| 0.0 | 3.6 | GO:0044452 | nucleolar part(GO:0044452) |
| 0.0 | 3.4 | GO:0005802 | trans-Golgi network(GO:0005802) |
| 0.0 | 0.1 | GO:0031466 | Cul5-RING ubiquitin ligase complex(GO:0031466) |
| 0.0 | 1.0 | GO:0031519 | PcG protein complex(GO:0031519) |
| 0.0 | 1.0 | GO:0035580 | specific granule lumen(GO:0035580) |
| 0.0 | 1.0 | GO:0010494 | cytoplasmic stress granule(GO:0010494) |
Gene overrepresentation in molecular function category:
| Log-likelihood per target | Total log-likelihood | Term | Description |
|---|---|---|---|
| 0.9 | 2.6 | GO:0052739 | phosphatidylserine 1-acylhydrolase activity(GO:0052739) |
| 0.5 | 1.5 | GO:0043739 | G/U mismatch-specific uracil-DNA glycosylase activity(GO:0043739) |
| 0.5 | 3.0 | GO:0004706 | JUN kinase kinase kinase activity(GO:0004706) |
| 0.5 | 4.4 | GO:0003828 | alpha-N-acetylneuraminate alpha-2,8-sialyltransferase activity(GO:0003828) |
| 0.5 | 2.4 | GO:0070579 | methylcytosine dioxygenase activity(GO:0070579) |
| 0.4 | 2.1 | GO:0003829 | beta-1,3-galactosyl-O-glycosyl-glycoprotein beta-1,6-N-acetylglucosaminyltransferase activity(GO:0003829) |
| 0.4 | 3.6 | GO:0004571 | mannosyl-oligosaccharide 1,2-alpha-mannosidase activity(GO:0004571) |
| 0.4 | 1.4 | GO:1904455 | ubiquitin-specific protease activity involved in negative regulation of ERAD pathway(GO:1904455) |
| 0.4 | 1.4 | GO:0070119 | ciliary neurotrophic factor binding(GO:0070119) |
| 0.3 | 3.5 | GO:0003835 | beta-galactoside alpha-2,6-sialyltransferase activity(GO:0003835) |
| 0.3 | 1.3 | GO:0034739 | histone deacetylase activity (H4-K16 specific)(GO:0034739) |
| 0.3 | 1.2 | GO:1990189 | peptide-serine-N-acetyltransferase activity(GO:1990189) |
| 0.3 | 1.4 | GO:0017089 | glycolipid transporter activity(GO:0017089) |
| 0.3 | 1.4 | GO:0035575 | histone demethylase activity (H4-K20 specific)(GO:0035575) |
| 0.3 | 5.0 | GO:0017017 | MAP kinase tyrosine/serine/threonine phosphatase activity(GO:0017017) |
| 0.3 | 1.8 | GO:0016833 | oxo-acid-lyase activity(GO:0016833) |
| 0.3 | 1.3 | GO:0098808 | mRNA cap binding(GO:0098808) |
| 0.3 | 1.0 | GO:0004420 | hydroxymethylglutaryl-CoA reductase (NADPH) activity(GO:0004420) hydroxymethylglutaryl-CoA reductase activity(GO:0042282) |
| 0.2 | 1.0 | GO:0015563 | uptake transmembrane transporter activity(GO:0015563) |
| 0.2 | 2.5 | GO:0034046 | poly(G) binding(GO:0034046) |
| 0.2 | 1.0 | GO:0051765 | inositol tetrakisphosphate kinase activity(GO:0051765) |
| 0.2 | 1.3 | GO:0036080 | GDP-fucose transmembrane transporter activity(GO:0005457) purine nucleotide-sugar transmembrane transporter activity(GO:0036080) |
| 0.2 | 0.6 | GO:0090541 | MIT domain binding(GO:0090541) |
| 0.2 | 1.7 | GO:0004771 | sterol esterase activity(GO:0004771) |
| 0.2 | 6.3 | GO:0070006 | metalloaminopeptidase activity(GO:0070006) |
| 0.2 | 2.8 | GO:0051434 | BH3 domain binding(GO:0051434) |
| 0.2 | 0.8 | GO:0008431 | vitamin E binding(GO:0008431) |
| 0.2 | 1.7 | GO:0000213 | tRNA-intron endonuclease activity(GO:0000213) |
| 0.2 | 0.6 | GO:0080130 | L-phenylalanine:2-oxoglutarate aminotransferase activity(GO:0080130) |
| 0.2 | 5.0 | GO:0042609 | CD4 receptor binding(GO:0042609) |
| 0.2 | 1.5 | GO:0004430 | 1-phosphatidylinositol 4-kinase activity(GO:0004430) |
| 0.2 | 0.9 | GO:0016971 | flavin-linked sulfhydryl oxidase activity(GO:0016971) |
| 0.2 | 2.2 | GO:0046920 | alpha-(1->3)-fucosyltransferase activity(GO:0046920) |
| 0.2 | 2.1 | GO:0008420 | CTD phosphatase activity(GO:0008420) |
| 0.2 | 0.7 | GO:0008967 | phosphoglycolate phosphatase activity(GO:0008967) |
| 0.1 | 1.9 | GO:0008142 | oxysterol binding(GO:0008142) |
| 0.1 | 1.1 | GO:0045134 | uridine-diphosphatase activity(GO:0045134) |
| 0.1 | 1.1 | GO:0000064 | L-ornithine transmembrane transporter activity(GO:0000064) |
| 0.1 | 0.8 | GO:0019828 | aspartic-type endopeptidase inhibitor activity(GO:0019828) |
| 0.1 | 1.1 | GO:0060698 | endoribonuclease inhibitor activity(GO:0060698) |
| 0.1 | 1.0 | GO:0052795 | exo-alpha-(2->3)-sialidase activity(GO:0052794) exo-alpha-(2->6)-sialidase activity(GO:0052795) exo-alpha-(2->8)-sialidase activity(GO:0052796) |
| 0.1 | 1.1 | GO:0035727 | lysophosphatidic acid binding(GO:0035727) |
| 0.1 | 1.6 | GO:0030911 | TPR domain binding(GO:0030911) |
| 0.1 | 0.5 | GO:0004605 | phosphatidate cytidylyltransferase activity(GO:0004605) |
| 0.1 | 0.3 | GO:0015229 | L-ascorbate:sodium symporter activity(GO:0008520) L-ascorbic acid transporter activity(GO:0015229) sodium-dependent L-ascorbate transmembrane transporter activity(GO:0070890) |
| 0.1 | 4.6 | GO:0004709 | MAP kinase kinase kinase activity(GO:0004709) |
| 0.1 | 0.3 | GO:0004615 | phosphomannomutase activity(GO:0004615) |
| 0.1 | 0.8 | GO:0008273 | calcium, potassium:sodium antiporter activity(GO:0008273) |
| 0.1 | 0.9 | GO:0051400 | BH domain binding(GO:0051400) |
| 0.1 | 4.0 | GO:0005035 | tumor necrosis factor-activated receptor activity(GO:0005031) death receptor activity(GO:0005035) |
| 0.1 | 7.0 | GO:0035035 | histone acetyltransferase binding(GO:0035035) |
| 0.1 | 0.9 | GO:0031730 | CCR5 chemokine receptor binding(GO:0031730) |
| 0.1 | 0.6 | GO:0047696 | beta-adrenergic receptor kinase activity(GO:0047696) |
| 0.1 | 1.4 | GO:0004726 | non-membrane spanning protein tyrosine phosphatase activity(GO:0004726) |
| 0.1 | 0.5 | GO:0008073 | ornithine decarboxylase inhibitor activity(GO:0008073) |
| 0.1 | 0.7 | GO:0010484 | H3 histone acetyltransferase activity(GO:0010484) |
| 0.1 | 0.4 | GO:0052836 | inositol 5-diphosphate pentakisphosphate 5-kinase activity(GO:0052836) inositol diphosphate tetrakisphosphate kinase activity(GO:0052839) |
| 0.1 | 1.6 | GO:0047372 | acylglycerol lipase activity(GO:0047372) |
| 0.1 | 5.7 | GO:0071889 | 14-3-3 protein binding(GO:0071889) |
| 0.1 | 1.4 | GO:1904264 | ubiquitin protein ligase activity involved in ERAD pathway(GO:1904264) |
| 0.1 | 0.3 | GO:0045145 | single-stranded DNA 5'-3' exodeoxyribonuclease activity(GO:0045145) |
| 0.1 | 1.8 | GO:0015095 | magnesium ion transmembrane transporter activity(GO:0015095) |
| 0.1 | 0.4 | GO:0004461 | lactose synthase activity(GO:0004461) |
| 0.1 | 0.9 | GO:0042799 | histone methyltransferase activity (H4-K20 specific)(GO:0042799) |
| 0.1 | 4.0 | GO:0043027 | cysteine-type endopeptidase inhibitor activity involved in apoptotic process(GO:0043027) |
| 0.1 | 0.7 | GO:0000155 | phosphorelay sensor kinase activity(GO:0000155) |
| 0.1 | 0.8 | GO:0051525 | NFAT protein binding(GO:0051525) |
| 0.1 | 0.5 | GO:0032145 | 4-aminobutyrate transaminase activity(GO:0003867) succinate-semialdehyde dehydrogenase binding(GO:0032145) (S)-3-amino-2-methylpropionate transaminase activity(GO:0047298) |
| 0.1 | 2.4 | GO:0097200 | cysteine-type endopeptidase activity involved in execution phase of apoptosis(GO:0097200) |
| 0.1 | 1.2 | GO:0005225 | volume-sensitive anion channel activity(GO:0005225) |
| 0.1 | 3.8 | GO:1990841 | promoter-specific chromatin binding(GO:1990841) |
| 0.1 | 1.9 | GO:0004298 | threonine-type endopeptidase activity(GO:0004298) threonine-type peptidase activity(GO:0070003) |
| 0.1 | 2.0 | GO:0031489 | myosin V binding(GO:0031489) |
| 0.1 | 1.1 | GO:0061578 | Lys63-specific deubiquitinase activity(GO:0061578) |
| 0.1 | 0.2 | GO:0017057 | glucose-6-phosphate dehydrogenase activity(GO:0004345) 6-phosphogluconolactonase activity(GO:0017057) |
| 0.1 | 3.2 | GO:0030676 | Rac guanyl-nucleotide exchange factor activity(GO:0030676) |
| 0.1 | 2.9 | GO:0005086 | ARF guanyl-nucleotide exchange factor activity(GO:0005086) |
| 0.1 | 0.3 | GO:0005138 | interleukin-6 receptor binding(GO:0005138) |
| 0.1 | 0.2 | GO:0000247 | C-8 sterol isomerase activity(GO:0000247) |
| 0.1 | 1.4 | GO:0016832 | aldehyde-lyase activity(GO:0016832) |
| 0.1 | 1.1 | GO:0009931 | calcium-dependent protein serine/threonine kinase activity(GO:0009931) |
| 0.1 | 1.1 | GO:0030306 | ADP-ribosylation factor binding(GO:0030306) |
| 0.1 | 1.2 | GO:0052629 | phosphatidylinositol-3,5-bisphosphate 3-phosphatase activity(GO:0052629) |
| 0.1 | 0.2 | GO:0038100 | nodal binding(GO:0038100) |
| 0.0 | 0.8 | GO:0005078 | MAP-kinase scaffold activity(GO:0005078) |
| 0.0 | 0.6 | GO:0005375 | copper ion transmembrane transporter activity(GO:0005375) |
| 0.0 | 1.4 | GO:0004653 | polypeptide N-acetylgalactosaminyltransferase activity(GO:0004653) |
| 0.0 | 1.0 | GO:0031434 | mitogen-activated protein kinase kinase binding(GO:0031434) |
| 0.0 | 0.6 | GO:0017110 | nucleoside-diphosphatase activity(GO:0017110) |
| 0.0 | 2.6 | GO:0061631 | ubiquitin conjugating enzyme activity(GO:0061631) |
| 0.0 | 0.5 | GO:0098599 | palmitoyl-(protein) hydrolase activity(GO:0008474) palmitoyl hydrolase activity(GO:0098599) |
| 0.0 | 1.2 | GO:0005068 | transmembrane receptor protein tyrosine kinase adaptor activity(GO:0005068) |
| 0.0 | 0.2 | GO:0050252 | retinol O-fatty-acyltransferase activity(GO:0050252) |
| 0.0 | 3.6 | GO:0016279 | protein-lysine N-methyltransferase activity(GO:0016279) |
| 0.0 | 0.5 | GO:0015266 | protein channel activity(GO:0015266) |
| 0.0 | 0.8 | GO:0035613 | RNA stem-loop binding(GO:0035613) |
| 0.0 | 0.5 | GO:0034713 | type I transforming growth factor beta receptor binding(GO:0034713) |
| 0.0 | 0.2 | GO:0070576 | vitamin D 24-hydroxylase activity(GO:0070576) |
| 0.0 | 1.9 | GO:0004115 | 3',5'-cyclic-AMP phosphodiesterase activity(GO:0004115) |
| 0.0 | 2.5 | GO:0042169 | SH2 domain binding(GO:0042169) |
| 0.0 | 1.5 | GO:0019706 | protein-cysteine S-palmitoyltransferase activity(GO:0019706) protein-cysteine S-acyltransferase activity(GO:0019707) |
| 0.0 | 0.5 | GO:0005114 | type II transforming growth factor beta receptor binding(GO:0005114) |
| 0.0 | 0.1 | GO:0003858 | 3-hydroxybutyrate dehydrogenase activity(GO:0003858) |
| 0.0 | 0.9 | GO:0015271 | outward rectifier potassium channel activity(GO:0015271) |
| 0.0 | 0.5 | GO:0031435 | mitogen-activated protein kinase kinase kinase binding(GO:0031435) |
| 0.0 | 4.6 | GO:0051219 | phosphoprotein binding(GO:0051219) |
| 0.0 | 0.8 | GO:0035198 | miRNA binding(GO:0035198) |
| 0.0 | 0.4 | GO:0008525 | phosphatidylcholine transporter activity(GO:0008525) |
| 0.0 | 0.1 | GO:0005168 | neurotrophin TRKA receptor binding(GO:0005168) |
| 0.0 | 1.3 | GO:0038191 | neuropilin binding(GO:0038191) |
| 0.0 | 0.9 | GO:0008510 | sodium:bicarbonate symporter activity(GO:0008510) |
| 0.0 | 0.3 | GO:0035252 | UDP-xylosyltransferase activity(GO:0035252) xylosyltransferase activity(GO:0042285) |
| 0.0 | 0.5 | GO:0051864 | histone demethylase activity (H3-K9 specific)(GO:0032454) histone demethylase activity (H3-K36 specific)(GO:0051864) |
| 0.0 | 1.2 | GO:0008157 | protein phosphatase 1 binding(GO:0008157) |
| 0.0 | 0.8 | GO:0050811 | GABA receptor binding(GO:0050811) |
| 0.0 | 1.9 | GO:0017112 | Rab guanyl-nucleotide exchange factor activity(GO:0017112) |
| 0.0 | 7.7 | GO:0001047 | core promoter binding(GO:0001047) |
| 0.0 | 2.7 | GO:0002039 | p53 binding(GO:0002039) |
| 0.0 | 2.7 | GO:0035254 | glutamate receptor binding(GO:0035254) |
| 0.0 | 1.0 | GO:0005164 | tumor necrosis factor receptor binding(GO:0005164) |
| 0.0 | 0.2 | GO:0050682 | AF-2 domain binding(GO:0050682) |
| 0.0 | 1.3 | GO:0001205 | transcriptional activator activity, RNA polymerase II distal enhancer sequence-specific binding(GO:0001205) |
| 0.0 | 1.4 | GO:0030145 | manganese ion binding(GO:0030145) |
| 0.0 | 12.9 | GO:0001228 | transcriptional activator activity, RNA polymerase II transcription regulatory region sequence-specific binding(GO:0001228) |
| 0.0 | 0.5 | GO:0004012 | phospholipid-translocating ATPase activity(GO:0004012) |
| 0.0 | 1.8 | GO:0008028 | monocarboxylic acid transmembrane transporter activity(GO:0008028) |
| 0.0 | 1.1 | GO:0051539 | 4 iron, 4 sulfur cluster binding(GO:0051539) |
| 0.0 | 0.1 | GO:0033842 | N-acetyl-beta-glucosaminyl-glycoprotein 4-beta-N-acetylgalactosaminyltransferase activity(GO:0033842) |
| 0.0 | 0.3 | GO:0001222 | transcription corepressor binding(GO:0001222) |
| 0.0 | 0.7 | GO:0004003 | ATP-dependent DNA helicase activity(GO:0004003) |
| 0.0 | 0.9 | GO:0000175 | 3'-5'-exoribonuclease activity(GO:0000175) |
| 0.0 | 0.4 | GO:0050321 | tau-protein kinase activity(GO:0050321) |
| 0.0 | 0.3 | GO:0017034 | Rap guanyl-nucleotide exchange factor activity(GO:0017034) |
| 0.0 | 0.3 | GO:0008190 | eukaryotic initiation factor 4E binding(GO:0008190) |
| 0.0 | 0.4 | GO:0043325 | phosphatidylinositol-3,4-bisphosphate binding(GO:0043325) |
| 0.0 | 0.2 | GO:0034450 | ubiquitin-ubiquitin ligase activity(GO:0034450) |
| 0.0 | 1.4 | GO:0048306 | calcium-dependent protein binding(GO:0048306) |
| 0.0 | 1.0 | GO:0003743 | translation initiation factor activity(GO:0003743) |
| 0.0 | 0.8 | GO:0017046 | peptide hormone binding(GO:0017046) |
| 0.0 | 0.2 | GO:0050700 | CARD domain binding(GO:0050700) |
| 0.0 | 0.5 | GO:0005158 | insulin receptor binding(GO:0005158) |
| 0.0 | 0.3 | GO:0004185 | serine-type carboxypeptidase activity(GO:0004185) |
| 0.0 | 0.3 | GO:0070034 | telomerase RNA binding(GO:0070034) |
| 0.0 | 0.5 | GO:0032266 | phosphatidylinositol-3-phosphate binding(GO:0032266) |
| 0.0 | 1.2 | GO:0035591 | signaling adaptor activity(GO:0035591) |
| 0.0 | 1.3 | GO:0016209 | antioxidant activity(GO:0016209) |
Gene overrepresentation in curated gene sets: canonical pathways category:
| Log-likelihood per target | Total log-likelihood | Term | Description |
|---|---|---|---|
| 0.2 | 9.9 | SA B CELL RECEPTOR COMPLEXES | Antigen binding to B cell receptors activates protein tyrosine kinases, such as the Src family, which ultimate activate MAP kinases. |
| 0.1 | 5.4 | SA MMP CYTOKINE CONNECTION | Cytokines can induce activation of matrix metalloproteinases, which degrade extracellular matrix. |
| 0.1 | 2.9 | SA PROGRAMMED CELL DEATH | Programmed cell death, or apoptosis, eliminates damaged or unneeded cells. |
| 0.1 | 4.2 | ST ERK1 ERK2 MAPK PATHWAY | ERK1/ERK2 MAPK Pathway |
| 0.1 | 1.6 | SA REG CASCADE OF CYCLIN EXPR | Expression of cyclins regulates progression through the cell cycle by activating cyclin-dependent kinases. |
| 0.1 | 5.3 | PID IL2 1PATHWAY | IL2-mediated signaling events |
| 0.1 | 9.3 | PID IL4 2PATHWAY | IL4-mediated signaling events |
| 0.1 | 4.0 | ST JNK MAPK PATHWAY | JNK MAPK Pathway |
| 0.1 | 1.3 | PID EPO PATHWAY | EPO signaling pathway |
| 0.1 | 2.7 | PID SMAD2 3PATHWAY | Regulation of cytoplasmic and nuclear SMAD2/3 signaling |
| 0.1 | 4.2 | PID PI3KCI PATHWAY | Class I PI3K signaling events |
| 0.1 | 3.7 | PID RAS PATHWAY | Regulation of Ras family activation |
| 0.1 | 13.4 | PID P53 DOWNSTREAM PATHWAY | Direct p53 effectors |
| 0.1 | 6.9 | PID CMYB PATHWAY | C-MYB transcription factor network |
| 0.0 | 1.1 | PID LPA4 PATHWAY | LPA4-mediated signaling events |
| 0.0 | 0.4 | SA G1 AND S PHASES | Cdk2, 4, and 6 bind cyclin D in G1, while cdk2/cyclin E promotes the G1/S transition. |
| 0.0 | 2.0 | PID HIV NEF PATHWAY | HIV-1 Nef: Negative effector of Fas and TNF-alpha |
| 0.0 | 2.6 | SIG INSULIN RECEPTOR PATHWAY IN CARDIAC MYOCYTES | Genes related to the insulin receptor pathway |
| 0.0 | 1.3 | PID HDAC CLASSIII PATHWAY | Signaling events mediated by HDAC Class III |
| 0.0 | 1.1 | PID PI3K PLC TRK PATHWAY | Trk receptor signaling mediated by PI3K and PLC-gamma |
| 0.0 | 1.4 | PID S1P META PATHWAY | Sphingosine 1-phosphate (S1P) pathway |
| 0.0 | 2.1 | PID P53 REGULATION PATHWAY | p53 pathway |
| 0.0 | 1.1 | PID TNF PATHWAY | TNF receptor signaling pathway |
| 0.0 | 0.5 | PID P38 MKK3 6PATHWAY | p38 MAPK signaling pathway |
| 0.0 | 0.7 | PID MAPK TRK PATHWAY | Trk receptor signaling mediated by the MAPK pathway |
| 0.0 | 0.8 | PID CONE PATHWAY | Visual signal transduction: Cones |
| 0.0 | 0.7 | ST ADRENERGIC | Adrenergic Pathway |
| 0.0 | 1.6 | PID E2F PATHWAY | E2F transcription factor network |
| 0.0 | 0.5 | PID CXCR4 PATHWAY | CXCR4-mediated signaling events |
| 0.0 | 0.8 | PID THROMBIN PAR1 PATHWAY | PAR1-mediated thrombin signaling events |
| 0.0 | 1.6 | PID HIF1 TFPATHWAY | HIF-1-alpha transcription factor network |
| 0.0 | 1.0 | PID TGFBR PATHWAY | TGF-beta receptor signaling |
| 0.0 | 1.4 | PID MYC REPRESS PATHWAY | Validated targets of C-MYC transcriptional repression |
| 0.0 | 0.2 | SA CASPASE CASCADE | Apoptosis is mediated by caspases, cysteine proteases arranged in a proteolytic cascade. |
| 0.0 | 0.4 | PID REELIN PATHWAY | Reelin signaling pathway |
| 0.0 | 0.7 | PID HNF3B PATHWAY | FOXA2 and FOXA3 transcription factor networks |
Gene overrepresentation in curated gene sets: REACTOME pathways category:
| Log-likelihood per target | Total log-likelihood | Term | Description |
|---|---|---|---|
| 0.2 | 5.5 | REACTOME ERKS ARE INACTIVATED | Genes involved in ERKs are inactivated |
| 0.2 | 3.3 | REACTOME CDC6 ASSOCIATION WITH THE ORC ORIGIN COMPLEX | Genes involved in CDC6 association with the ORC:origin complex |
| 0.2 | 3.6 | REACTOME CALNEXIN CALRETICULIN CYCLE | Genes involved in Calnexin/calreticulin cycle |
| 0.1 | 1.6 | REACTOME ENDOSOMAL VACUOLAR PATHWAY | Genes involved in Endosomal/Vacuolar pathway |
| 0.1 | 4.8 | REACTOME ERK MAPK TARGETS | Genes involved in ERK/MAPK targets |
| 0.1 | 3.5 | REACTOME N GLYCAN ANTENNAE ELONGATION | Genes involved in N-Glycan antennae elongation |
| 0.1 | 5.8 | REACTOME REGULATION OF GLUCOKINASE BY GLUCOKINASE REGULATORY PROTEIN | Genes involved in Regulation of Glucokinase by Glucokinase Regulatory Protein |
| 0.1 | 2.3 | REACTOME IL 6 SIGNALING | Genes involved in Interleukin-6 signaling |
| 0.1 | 1.4 | REACTOME MEMBRANE BINDING AND TARGETTING OF GAG PROTEINS | Genes involved in Membrane binding and targetting of GAG proteins |
| 0.1 | 3.4 | REACTOME TRAF6 MEDIATED NFKB ACTIVATION | Genes involved in TRAF6 mediated NF-kB activation |
| 0.1 | 1.3 | REACTOME REGULATION OF IFNG SIGNALING | Genes involved in Regulation of IFNG signaling |
| 0.1 | 1.5 | REACTOME BASE FREE SUGAR PHOSPHATE REMOVAL VIA THE SINGLE NUCLEOTIDE REPLACEMENT PATHWAY | Genes involved in Base-free sugar-phosphate removal via the single-nucleotide replacement pathway |
| 0.1 | 6.3 | REACTOME INTERFERON ALPHA BETA SIGNALING | Genes involved in Interferon alpha/beta signaling |
| 0.1 | 1.8 | REACTOME ACTIVATION OF BH3 ONLY PROTEINS | Genes involved in Activation of BH3-only proteins |
| 0.1 | 1.9 | REACTOME SYNTHESIS OF PIPS AT THE GOLGI MEMBRANE | Genes involved in Synthesis of PIPs at the Golgi membrane |
| 0.1 | 8.1 | REACTOME CELL DEATH SIGNALLING VIA NRAGE NRIF AND NADE | Genes involved in Cell death signalling via NRAGE, NRIF and NADE |
| 0.1 | 2.4 | REACTOME ACTIVATED NOTCH1 TRANSMITS SIGNAL TO THE NUCLEUS | Genes involved in Activated NOTCH1 Transmits Signal to the Nucleus |
| 0.1 | 1.1 | REACTOME PURINE RIBONUCLEOSIDE MONOPHOSPHATE BIOSYNTHESIS | Genes involved in Purine ribonucleoside monophosphate biosynthesis |
| 0.1 | 1.5 | REACTOME ENDOSOMAL SORTING COMPLEX REQUIRED FOR TRANSPORT ESCRT | Genes involved in Endosomal Sorting Complex Required For Transport (ESCRT) |
| 0.0 | 0.9 | REACTOME SIGNALLING TO P38 VIA RIT AND RIN | Genes involved in Signalling to p38 via RIT and RIN |
| 0.0 | 1.1 | REACTOME P2Y RECEPTORS | Genes involved in P2Y receptors |
| 0.0 | 1.2 | REACTOME REGULATION OF KIT SIGNALING | Genes involved in Regulation of KIT signaling |
| 0.0 | 0.5 | REACTOME REGULATION OF ORNITHINE DECARBOXYLASE ODC | Genes involved in Regulation of ornithine decarboxylase (ODC) |
| 0.0 | 1.7 | REACTOME SIGNALING BY FGFR1 FUSION MUTANTS | Genes involved in Signaling by FGFR1 fusion mutants |
| 0.0 | 3.5 | REACTOME O LINKED GLYCOSYLATION OF MUCINS | Genes involved in O-linked glycosylation of mucins |
| 0.0 | 1.9 | REACTOME CIRCADIAN REPRESSION OF EXPRESSION BY REV ERBA | Genes involved in Circadian Repression of Expression by REV-ERBA |
| 0.0 | 0.3 | REACTOME NUCLEAR EVENTS KINASE AND TRANSCRIPTION FACTOR ACTIVATION | Genes involved in Nuclear Events (kinase and transcription factor activation) |
| 0.0 | 1.1 | REACTOME INTRINSIC PATHWAY FOR APOPTOSIS | Genes involved in Intrinsic Pathway for Apoptosis |
| 0.0 | 0.2 | REACTOME IRAK1 RECRUITS IKK COMPLEX | Genes involved in IRAK1 recruits IKK complex |
| 0.0 | 3.3 | REACTOME ACTIVATION OF CHAPERONE GENES BY XBP1S | Genes involved in Activation of Chaperone Genes by XBP1(S) |
| 0.0 | 0.5 | REACTOME MRNA DECAY BY 3 TO 5 EXORIBONUCLEASE | Genes involved in mRNA Decay by 3' to 5' Exoribonuclease |
| 0.0 | 1.6 | REACTOME DOWNREGULATION OF TGF BETA RECEPTOR SIGNALING | Genes involved in Downregulation of TGF-beta receptor signaling |
| 0.0 | 2.6 | REACTOME NCAM1 INTERACTIONS | Genes involved in NCAM1 interactions |
| 0.0 | 0.3 | REACTOME TRANSPORT OF MATURE MRNA DERIVED FROM AN INTRONLESS TRANSCRIPT | Genes involved in Transport of Mature mRNA Derived from an Intronless Transcript |
| 0.0 | 1.4 | REACTOME IL1 SIGNALING | Genes involved in Interleukin-1 signaling |
| 0.0 | 1.2 | REACTOME SYNTHESIS OF PIPS AT THE PLASMA MEMBRANE | Genes involved in Synthesis of PIPs at the plasma membrane |
| 0.0 | 1.0 | REACTOME CHOLESTEROL BIOSYNTHESIS | Genes involved in Cholesterol biosynthesis |
| 0.0 | 0.2 | REACTOME COPI MEDIATED TRANSPORT | Genes involved in COPI Mediated Transport |
| 0.0 | 0.3 | REACTOME SYNTHESIS OF SUBSTRATES IN N GLYCAN BIOSYTHESIS | Genes involved in Synthesis of substrates in N-glycan biosythesis |
| 0.0 | 0.8 | REACTOME ELONGATION ARREST AND RECOVERY | Genes involved in Elongation arrest and recovery |
| 0.0 | 1.1 | REACTOME POST NMDA RECEPTOR ACTIVATION EVENTS | Genes involved in Post NMDA receptor activation events |
| 0.0 | 0.7 | REACTOME SMAD2 SMAD3 SMAD4 HETEROTRIMER REGULATES TRANSCRIPTION | Genes involved in SMAD2/SMAD3:SMAD4 heterotrimer regulates transcription |
| 0.0 | 0.3 | REACTOME MTORC1 MEDIATED SIGNALLING | Genes involved in mTORC1-mediated signalling |
| 0.0 | 0.3 | REACTOME SIGNALING BY ROBO RECEPTOR | Genes involved in Signaling by Robo receptor |
| 0.0 | 1.0 | REACTOME GLYCOSPHINGOLIPID METABOLISM | Genes involved in Glycosphingolipid metabolism |
| 0.0 | 0.6 | REACTOME METAL ION SLC TRANSPORTERS | Genes involved in Metal ion SLC transporters |
| 0.0 | 2.0 | REACTOME PPARA ACTIVATES GENE EXPRESSION | Genes involved in PPARA Activates Gene Expression |
| 0.0 | 0.4 | REACTOME PRE NOTCH PROCESSING IN GOLGI | Genes involved in Pre-NOTCH Processing in Golgi |
| 0.0 | 0.7 | REACTOME TRANSPORT OF VITAMINS NUCLEOSIDES AND RELATED MOLECULES | Genes involved in Transport of vitamins, nucleosides, and related molecules |
| 0.0 | 0.6 | REACTOME REGULATION OF GENE EXPRESSION IN BETA CELLS | Genes involved in Regulation of gene expression in beta cells |
| 0.0 | 0.6 | REACTOME BASIGIN INTERACTIONS | Genes involved in Basigin interactions |