Project
Illumina Body Map 2 (GSE30611)
Navigation
Downloads
Results for CCUUGGC
Z-value: 0.17
Motif logo

miRNA associated with seed CCUUGGC
| Name | miRBASE accession |
|---|---|
|
hsa-miR-212-5p
|
MIMAT0022695 |
Activity profile of CCUUGGC motif
Sorted Z-values of CCUUGGC motif
| Promoter | Log-likelihood | Transcript | Gene | Gene Info |
|---|---|---|---|---|
| chr16_-_71577082 | 0.15 |
ENST00000355962.5
|
TAT
|
tyrosine aminotransferase |
| chr17_+_4583998 | 0.13 |
ENST00000338859.8
|
SMTNL2
|
smoothelin like 2 |
| chr3_+_51983438 | 0.12 |
ENST00000476351.5
ENST00000476854.5 ENST00000494103.5 ENST00000404366.7 ENST00000635797.1 ENST00000636358.2 ENST00000469863.1 |
ACY1
|
aminoacylase 1 |
| chr16_-_75116767 | 0.12 |
ENST00000300051.8
ENST00000450168.3 |
LDHD
|
lactate dehydrogenase D |
| chr1_+_213987929 | 0.12 |
ENST00000498508.6
ENST00000366958.9 |
PROX1
|
prospero homeobox 1 |
| chr2_-_20225123 | 0.11 |
ENST00000254351.9
|
SDC1
|
syndecan 1 |
| chr6_-_139291987 | 0.09 |
ENST00000358430.8
|
TXLNB
|
taxilin beta |
| chrY_+_12904860 | 0.09 |
ENST00000336079.8
|
DDX3Y
|
DEAD-box helicase 3 Y-linked |
| chr2_+_240435652 | 0.08 |
ENST00000264039.7
|
GPC1
|
glypican 1 |
| chrX_+_49922605 | 0.08 |
ENST00000376088.7
|
CLCN5
|
chloride voltage-gated channel 5 |
| chr1_-_51297990 | 0.08 |
ENST00000530004.5
|
TTC39A
|
tetratricopeptide repeat domain 39A |
| chr1_+_202010575 | 0.08 |
ENST00000367283.7
ENST00000367284.10 |
ELF3
|
E74 like ETS transcription factor 3 |
| chr3_-_53846374 | 0.08 |
ENST00000315251.11
|
CHDH
|
choline dehydrogenase |
| chr3_-_115071333 | 0.07 |
ENST00000462705.5
|
ZBTB20
|
zinc finger and BTB domain containing 20 |
| chr5_-_37840035 | 0.07 |
ENST00000326524.7
|
GDNF
|
glial cell derived neurotrophic factor |
| chr7_+_116672187 | 0.07 |
ENST00000318493.11
ENST00000397752.8 |
MET
|
MET proto-oncogene, receptor tyrosine kinase |
| chr20_-_49482645 | 0.07 |
ENST00000371741.6
|
KCNB1
|
potassium voltage-gated channel subfamily B member 1 |
| chr14_-_34713788 | 0.07 |
ENST00000341223.8
|
CFL2
|
cofilin 2 |
| chr16_-_46831134 | 0.06 |
ENST00000394806.6
ENST00000285697.9 |
C16orf87
|
chromosome 16 open reading frame 87 |
| chr2_+_218607861 | 0.06 |
ENST00000450993.7
|
PLCD4
|
phospholipase C delta 4 |
| chr18_+_13218769 | 0.06 |
ENST00000677055.1
ENST00000399848.7 |
LDLRAD4
|
low density lipoprotein receptor class A domain containing 4 |
| chr2_-_40452046 | 0.06 |
ENST00000406785.6
|
SLC8A1
|
solute carrier family 8 member A1 |
| chr1_-_32872473 | 0.06 |
ENST00000496770.1
|
FNDC5
|
fibronectin type III domain containing 5 |
| chr19_+_7888499 | 0.06 |
ENST00000618098.4
ENST00000306708.11 ENST00000600345.1 ENST00000598224.5 |
LRRC8E
|
leucine rich repeat containing 8 VRAC subunit E |
| chr8_+_75539862 | 0.06 |
ENST00000396423.4
|
HNF4G
|
hepatocyte nuclear factor 4 gamma |
| chr2_-_207769889 | 0.05 |
ENST00000295417.4
|
FZD5
|
frizzled class receptor 5 |
| chr1_+_39955112 | 0.05 |
ENST00000420632.6
ENST00000372811.10 ENST00000434861.5 ENST00000372809.5 |
MFSD2A
|
major facilitator superfamily domain containing 2A |
| chr21_+_31873010 | 0.05 |
ENST00000270112.7
|
HUNK
|
hormonally up-regulated Neu-associated kinase |
| chr6_+_50818857 | 0.05 |
ENST00000393655.4
|
TFAP2B
|
transcription factor AP-2 beta |
| chr3_+_38453832 | 0.05 |
ENST00000352511.5
|
ACVR2B
|
activin A receptor type 2B |
| chr11_+_7251886 | 0.04 |
ENST00000318881.11
|
SYT9
|
synaptotagmin 9 |
| chr15_+_44537136 | 0.04 |
ENST00000261868.10
ENST00000535391.5 |
EIF3J
|
eukaryotic translation initiation factor 3 subunit J |
| chr1_+_3069160 | 0.04 |
ENST00000511072.5
|
PRDM16
|
PR/SET domain 16 |
| chr7_+_141074038 | 0.04 |
ENST00000565468.6
ENST00000610315.1 |
TMEM178B
|
transmembrane protein 178B |
| chr5_+_177133741 | 0.04 |
ENST00000439151.7
|
NSD1
|
nuclear receptor binding SET domain protein 1 |
| chr13_-_49792675 | 0.04 |
ENST00000261667.8
|
KPNA3
|
karyopherin subunit alpha 3 |
| chr2_-_219229571 | 0.04 |
ENST00000436856.5
ENST00000428226.5 ENST00000409422.5 ENST00000361242.9 ENST00000431715.5 ENST00000457841.5 ENST00000439812.5 ENST00000396761.6 |
ATG9A
|
autophagy related 9A |
| chr1_+_25430854 | 0.04 |
ENST00000399766.7
|
MACO1
|
macoilin 1 |
| chr9_+_113876282 | 0.04 |
ENST00000374126.9
ENST00000615615.4 ENST00000288466.11 |
ZNF618
|
zinc finger protein 618 |
| chr11_+_120336357 | 0.04 |
ENST00000397843.7
|
ARHGEF12
|
Rho guanine nucleotide exchange factor 12 |
| chr2_+_218399838 | 0.04 |
ENST00000273062.7
|
CTDSP1
|
CTD small phosphatase 1 |
| chr1_-_118989504 | 0.04 |
ENST00000207157.7
|
TBX15
|
T-box transcription factor 15 |
| chr17_+_40443441 | 0.03 |
ENST00000269593.5
|
IGFBP4
|
insulin like growth factor binding protein 4 |
| chr16_-_2214776 | 0.03 |
ENST00000333503.8
|
PGP
|
phosphoglycolate phosphatase |
| chr1_-_117121692 | 0.03 |
ENST00000256649.9
ENST00000369464.7 ENST00000485032.1 |
TRIM45
|
tripartite motif containing 45 |
| chr15_+_96330691 | 0.03 |
ENST00000394166.8
|
NR2F2
|
nuclear receptor subfamily 2 group F member 2 |
| chr1_-_46668454 | 0.03 |
ENST00000576409.5
|
ATPAF1
|
ATP synthase mitochondrial F1 complex assembly factor 1 |
| chr7_-_45921264 | 0.03 |
ENST00000613132.5
ENST00000381083.9 ENST00000381086.9 |
IGFBP3
|
insulin like growth factor binding protein 3 |
| chr12_+_118981531 | 0.03 |
ENST00000267260.5
|
SRRM4
|
serine/arginine repetitive matrix 4 |
| chr2_-_96208815 | 0.03 |
ENST00000443962.1
ENST00000337288.10 |
STARD7
|
StAR related lipid transfer domain containing 7 |
| chr4_+_6782674 | 0.03 |
ENST00000307659.6
ENST00000425103.5 |
KIAA0232
|
KIAA0232 |
| chr17_-_64130125 | 0.03 |
ENST00000680433.1
ENST00000433197.4 |
ERN1
|
endoplasmic reticulum to nucleus signaling 1 |
| chr6_-_98947911 | 0.03 |
ENST00000369244.7
ENST00000229971.2 |
FBXL4
|
F-box and leucine rich repeat protein 4 |
| chr14_-_95319863 | 0.03 |
ENST00000298912.9
|
CLMN
|
calmin |
| chr5_+_109689915 | 0.03 |
ENST00000261483.5
|
MAN2A1
|
mannosidase alpha class 2A member 1 |
| chrX_+_153687918 | 0.03 |
ENST00000253122.10
|
SLC6A8
|
solute carrier family 6 member 8 |
| chr7_-_72336995 | 0.03 |
ENST00000329008.9
|
CALN1
|
calneuron 1 |
| chr2_+_85539158 | 0.03 |
ENST00000306434.8
|
MAT2A
|
methionine adenosyltransferase 2A |
| chr7_-_139777986 | 0.03 |
ENST00000406875.8
|
HIPK2
|
homeodomain interacting protein kinase 2 |
| chr8_-_65842051 | 0.03 |
ENST00000401827.8
|
PDE7A
|
phosphodiesterase 7A |
| chr3_+_32817990 | 0.03 |
ENST00000383763.6
|
TRIM71
|
tripartite motif containing 71 |
| chr1_-_6701795 | 0.03 |
ENST00000426784.1
ENST00000377577.10 ENST00000294401.11 |
DNAJC11
|
DnaJ heat shock protein family (Hsp40) member C11 |
| chr2_+_85753984 | 0.02 |
ENST00000306279.4
|
ATOH8
|
atonal bHLH transcription factor 8 |
| chr17_+_48997377 | 0.02 |
ENST00000290341.8
|
IGF2BP1
|
insulin like growth factor 2 mRNA binding protein 1 |
| chr5_-_138543198 | 0.02 |
ENST00000507939.5
ENST00000572514.5 ENST00000499810.6 ENST00000360541.10 |
ETF1
|
eukaryotic translation termination factor 1 |
| chr22_+_49853801 | 0.02 |
ENST00000216268.6
|
ZBED4
|
zinc finger BED-type containing 4 |
| chr9_-_124507382 | 0.02 |
ENST00000373588.9
ENST00000620110.4 |
NR5A1
|
nuclear receptor subfamily 5 group A member 1 |
| chr1_-_214551556 | 0.02 |
ENST00000366956.10
|
PTPN14
|
protein tyrosine phosphatase non-receptor type 14 |
| chr15_-_90233902 | 0.02 |
ENST00000328649.11
ENST00000650306.1 |
CIB1
|
calcium and integrin binding 1 |
| chr7_+_127652186 | 0.02 |
ENST00000354725.8
|
SND1
|
staphylococcal nuclease and tudor domain containing 1 |
| chr1_+_32741779 | 0.02 |
ENST00000401073.7
|
KIAA1522
|
KIAA1522 |
| chr13_-_78603539 | 0.02 |
ENST00000377208.7
|
POU4F1
|
POU class 4 homeobox 1 |
| chr8_+_55102012 | 0.02 |
ENST00000327381.7
|
XKR4
|
XK related 4 |
| chr5_-_128538230 | 0.02 |
ENST00000262464.9
|
FBN2
|
fibrillin 2 |
| chr3_-_156555083 | 0.02 |
ENST00000265044.7
ENST00000476217.5 |
SSR3
|
signal sequence receptor subunit 3 |
| chr9_+_33817126 | 0.02 |
ENST00000263228.4
|
UBE2R2
|
ubiquitin conjugating enzyme E2 R2 |
| chr3_-_138834752 | 0.02 |
ENST00000477593.5
ENST00000483968.5 |
PIK3CB
|
phosphatidylinositol-4,5-bisphosphate 3-kinase catalytic subunit beta |
| chr9_+_113221528 | 0.02 |
ENST00000374212.5
|
SLC31A1
|
solute carrier family 31 member 1 |
| chr1_-_248825906 | 0.02 |
ENST00000366472.6
|
SH3BP5L
|
SH3 binding domain protein 5 like |
| chr12_-_57846686 | 0.02 |
ENST00000548823.1
ENST00000398073.7 |
CTDSP2
|
CTD small phosphatase 2 |
| chr3_+_57227714 | 0.02 |
ENST00000288266.8
|
APPL1
|
adaptor protein, phosphotyrosine interacting with PH domain and leucine zipper 1 |
| chr11_-_64778502 | 0.02 |
ENST00000681407.1
ENST00000377390.8 |
SF1
|
splicing factor 1 |
| chr16_-_18926408 | 0.02 |
ENST00000446231.7
|
SMG1
|
SMG1 nonsense mediated mRNA decay associated PI3K related kinase |
| chr9_-_124771304 | 0.02 |
ENST00000416460.6
ENST00000487099.7 |
NR6A1
|
nuclear receptor subfamily 6 group A member 1 |
| chr1_+_180912876 | 0.02 |
ENST00000367588.9
|
KIAA1614
|
KIAA1614 |
| chr1_+_11691688 | 0.02 |
ENST00000294485.6
|
DRAXIN
|
dorsal inhibitory axon guidance protein |
| chr2_+_27148997 | 0.02 |
ENST00000296096.6
|
TCF23
|
transcription factor 23 |
| chr11_-_119729158 | 0.02 |
ENST00000264025.8
|
NECTIN1
|
nectin cell adhesion molecule 1 |
| chr6_-_90296824 | 0.02 |
ENST00000257749.9
|
BACH2
|
BTB domain and CNC homolog 2 |
| chr1_+_179025886 | 0.01 |
ENST00000263733.5
|
FAM20B
|
FAM20B glycosaminoglycan xylosylkinase |
| chr8_-_123042244 | 0.01 |
ENST00000259512.9
ENST00000419562.6 |
DERL1
|
derlin 1 |
| chr13_+_94601830 | 0.01 |
ENST00000376958.5
|
GPR180
|
G protein-coupled receptor 180 |
| chr9_+_121651594 | 0.01 |
ENST00000408936.7
|
DAB2IP
|
DAB2 interacting protein |
| chr10_+_70404129 | 0.01 |
ENST00000373218.5
|
EIF4EBP2
|
eukaryotic translation initiation factor 4E binding protein 2 |
| chr12_+_120534342 | 0.01 |
ENST00000542438.1
ENST00000325954.9 |
RNF10
|
ring finger protein 10 |
| chr5_+_140547632 | 0.01 |
ENST00000310331.3
|
EIF4EBP3
|
eukaryotic translation initiation factor 4E binding protein 3 |
| chr17_+_47531052 | 0.01 |
ENST00000532729.6
ENST00000322157.9 |
NPEPPS
|
aminopeptidase puromycin sensitive |
| chr8_+_127409026 | 0.01 |
ENST00000465342.4
|
POU5F1B
|
POU class 5 homeobox 1B |
| chr17_-_62065248 | 0.01 |
ENST00000397786.7
|
MED13
|
mediator complex subunit 13 |
| chr1_+_26190561 | 0.01 |
ENST00000338855.6
ENST00000456354.7 |
CATSPER4
|
cation channel sperm associated 4 |
| chr2_+_167868948 | 0.01 |
ENST00000392690.3
|
B3GALT1
|
beta-1,3-galactosyltransferase 1 |
| chr9_-_16870662 | 0.01 |
ENST00000380672.9
|
BNC2
|
basonuclin 2 |
| chr22_+_28772664 | 0.01 |
ENST00000448492.6
ENST00000421503.6 ENST00000249064.9 ENST00000444523.1 |
CCDC117
|
coiled-coil domain containing 117 |
| chr5_-_107670897 | 0.01 |
ENST00000333274.11
|
EFNA5
|
ephrin A5 |
| chr9_-_136050502 | 0.01 |
ENST00000371753.5
|
NACC2
|
NACC family member 2 |
| chrX_+_77910656 | 0.01 |
ENST00000343533.9
ENST00000341514.11 ENST00000645454.1 ENST00000642651.1 ENST00000644362.1 |
ATP7A
PGK1
|
ATPase copper transporting alpha phosphoglycerate kinase 1 |
| chr7_-_92833896 | 0.01 |
ENST00000265734.8
|
CDK6
|
cyclin dependent kinase 6 |
| chr8_-_96160716 | 0.01 |
ENST00000621429.1
ENST00000620978.1 ENST00000287020.7 |
GDF6
|
growth differentiation factor 6 |
| chr2_-_96265942 | 0.01 |
ENST00000432959.1
ENST00000258439.8 |
TMEM127
|
transmembrane protein 127 |
| chr12_+_55743110 | 0.01 |
ENST00000257868.10
|
GDF11
|
growth differentiation factor 11 |
| chr14_+_103385506 | 0.01 |
ENST00000303622.13
|
MARK3
|
microtubule affinity regulating kinase 3 |
| chr10_-_72354895 | 0.01 |
ENST00000444643.8
ENST00000338820.7 ENST00000394903.6 |
DNAJB12
|
DnaJ heat shock protein family (Hsp40) member B12 |
| chr17_+_34579487 | 0.01 |
ENST00000321639.7
|
TMEM132E
|
transmembrane protein 132E |
| chr15_-_59372863 | 0.01 |
ENST00000288235.9
|
MYO1E
|
myosin IE |
| chr3_-_119146014 | 0.01 |
ENST00000441144.6
ENST00000425327.6 |
IGSF11
|
immunoglobulin superfamily member 11 |
| chr8_-_80171496 | 0.01 |
ENST00000379096.9
ENST00000518937.6 |
TPD52
|
tumor protein D52 |
| chr1_+_54053573 | 0.01 |
ENST00000234827.6
|
TCEANC2
|
transcription elongation factor A N-terminal and central domain containing 2 |
| chr1_-_37034492 | 0.01 |
ENST00000373091.8
|
GRIK3
|
glutamate ionotropic receptor kainate type subunit 3 |
| chrX_+_41334154 | 0.01 |
ENST00000441189.4
ENST00000644513.1 ENST00000644109.1 ENST00000646122.1 ENST00000644074.1 ENST00000644876.2 ENST00000399959.7 ENST00000646319.1 |
DDX3X
|
DEAD-box helicase 3 X-linked |
| chr1_+_16004228 | 0.01 |
ENST00000329454.2
|
SRARP
|
steroid receptor associated and regulated protein |
| chr17_-_10838075 | 0.01 |
ENST00000580256.3
ENST00000643787.1 |
PIRT
ENSG00000284876.1
|
phosphoinositide interacting regulator of transient receptor potential channels novel transcript |
| chrX_+_123859976 | 0.01 |
ENST00000371199.8
|
XIAP
|
X-linked inhibitor of apoptosis |
| chr9_-_20622479 | 0.00 |
ENST00000380338.9
|
MLLT3
|
MLLT3 super elongation complex subunit |
| chr3_+_77039836 | 0.00 |
ENST00000461745.5
|
ROBO2
|
roundabout guidance receptor 2 |
| chr2_+_66435558 | 0.00 |
ENST00000488550.5
|
MEIS1
|
Meis homeobox 1 |
| chr20_+_35226676 | 0.00 |
ENST00000246186.8
|
MMP24
|
matrix metallopeptidase 24 |
| chr1_+_42380772 | 0.00 |
ENST00000431473.4
ENST00000410070.6 |
RIMKLA
|
ribosomal modification protein rimK like family member A |
| chr14_+_52552830 | 0.00 |
ENST00000321662.11
|
GPR137C
|
G protein-coupled receptor 137C |
| chr1_-_151006795 | 0.00 |
ENST00000312210.9
ENST00000683666.1 |
MINDY1
|
MINDY lysine 48 deubiquitinase 1 |
| chr17_+_30477362 | 0.00 |
ENST00000225724.9
ENST00000451249.7 ENST00000467337.6 ENST00000581721.5 ENST00000414833.2 |
GOSR1
|
golgi SNAP receptor complex member 1 |
| chr9_+_101398841 | 0.00 |
ENST00000339664.7
ENST00000374861.7 ENST00000259395.4 ENST00000615466.1 |
ZNF189
|
zinc finger protein 189 |
| chr6_+_41546340 | 0.00 |
ENST00000307972.10
ENST00000373063.7 |
FOXP4
|
forkhead box P4 |
| chr1_-_23559490 | 0.00 |
ENST00000374561.6
|
ID3
|
inhibitor of DNA binding 3, HLH protein |
| chr2_+_158456939 | 0.00 |
ENST00000389759.8
ENST00000628904.2 ENST00000389757.7 |
PKP4
|
plakophilin 4 |
| chr9_-_34126661 | 0.00 |
ENST00000361264.9
|
DCAF12
|
DDB1 and CUL4 associated factor 12 |
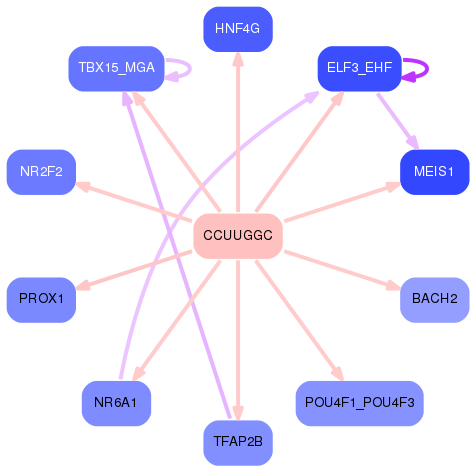
Network of associatons between targets according to the STRING database.

First level regulatory network of CCUUGGC
Gene Ontology Analysis
Gene overrepresentation in biological process category:
| Log-likelihood per target | Total log-likelihood | Term | Description |
|---|---|---|---|
| 0.0 | 0.1 | GO:0002194 | hepatocyte cell migration(GO:0002194) otic placode formation(GO:0043049) branching involved in pancreas morphogenesis(GO:0061114) acinar cell differentiation(GO:0090425) positive regulation of forebrain neuron differentiation(GO:2000979) |
| 0.0 | 0.1 | GO:0048627 | myoblast development(GO:0048627) |
| 0.0 | 0.1 | GO:0031456 | glycine betaine biosynthetic process from choline(GO:0019285) glycine betaine metabolic process(GO:0031455) glycine betaine biosynthetic process(GO:0031456) |
| 0.0 | 0.1 | GO:0021784 | postganglionic parasympathetic fiber development(GO:0021784) |
| 0.0 | 0.0 | GO:0097272 | ammonia homeostasis(GO:0097272) urea homeostasis(GO:0097274) |
| 0.0 | 0.1 | GO:0006572 | tyrosine catabolic process(GO:0006572) |
| 0.0 | 0.1 | GO:0060061 | Spemann organizer formation(GO:0060061) |
| 0.0 | 0.1 | GO:0030200 | heparan sulfate proteoglycan catabolic process(GO:0030200) |
| 0.0 | 0.0 | GO:0075732 | viral penetration into host nucleus(GO:0075732) multi-organism nuclear import(GO:1902594) |
| 0.0 | 0.1 | GO:0010701 | positive regulation of norepinephrine secretion(GO:0010701) |
Gene overrepresentation in molecular function category:
| Log-likelihood per target | Total log-likelihood | Term | Description |
|---|---|---|---|
| 0.0 | 0.1 | GO:0080130 | L-phenylalanine:2-oxoglutarate aminotransferase activity(GO:0080130) |
| 0.0 | 0.1 | GO:0004046 | aminoacylase activity(GO:0004046) |