Project
Illumina Body Map 2 (GSE30611)
Navigation
Downloads
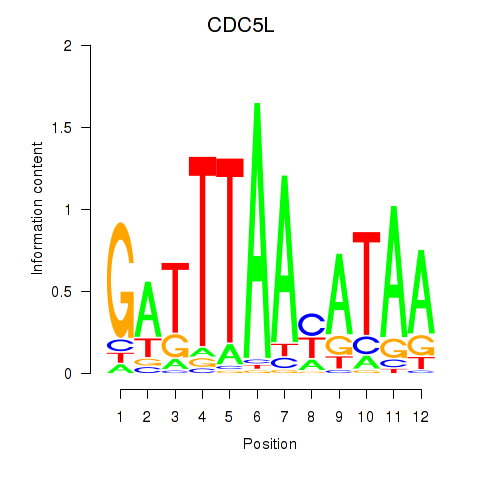
Results for CDC5L
Z-value: 1.60
Motif logo
Transcription factors associated with CDC5L
| Gene Symbol | Gene ID | Gene Info |
|---|---|---|
|
CDC5L
|
ENSG00000096401.8 | cell division cycle 5 like |
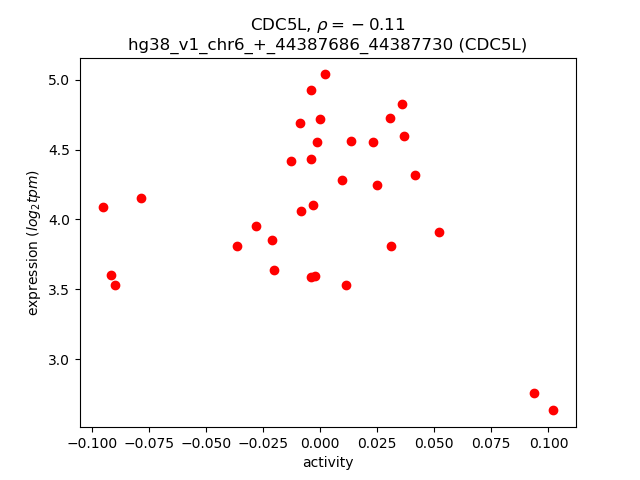
Activity-expression correlation:
| Gene | Promoter | Pearson corr. coef. | P-value | Plot |
|---|---|---|---|---|
| CDC5L | hg38_v1_chr6_+_44387686_44387730 | -0.11 | 5.3e-01 | Click! |
Activity profile of CDC5L motif
Sorted Z-values of CDC5L motif
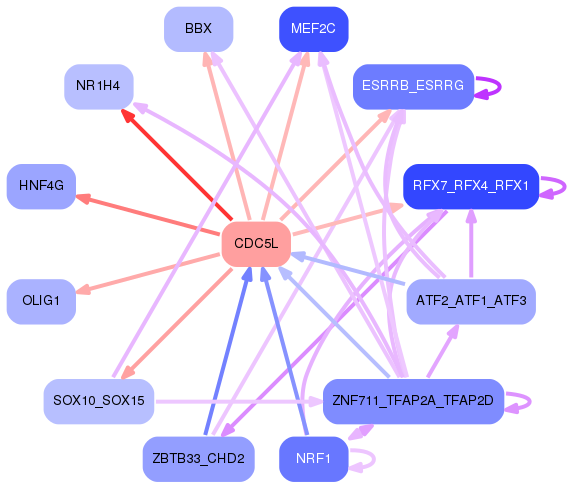
Network of associatons between targets according to the STRING database.

First level regulatory network of CDC5L
Gene Ontology Analysis
Gene overrepresentation in biological process category:
| Log-likelihood per target | Total log-likelihood | Term | Description |
|---|---|---|---|
| 1.1 | 3.4 | GO:2000296 | negative regulation of hydrogen peroxide catabolic process(GO:2000296) |
| 0.9 | 3.6 | GO:0051919 | positive regulation of fibrinolysis(GO:0051919) interaction with other organism via secreted substance involved in symbiotic interaction(GO:0052047) |
| 0.9 | 2.7 | GO:0044007 | negative regulation of transcription from RNA polymerase II promoter in response to UV-induced DNA damage(GO:0010768) transmission of virus(GO:0019089) dissemination or transmission of symbiont from host(GO:0044007) dissemination or transmission of organism from other organism involved in symbiotic interaction(GO:0051821) |
| 0.9 | 8.9 | GO:0006572 | tyrosine catabolic process(GO:0006572) |
| 0.9 | 4.4 | GO:0090290 | positive regulation of osteoclast proliferation(GO:0090290) |
| 0.8 | 2.4 | GO:0044278 | cell wall disruption in other organism(GO:0044278) |
| 0.8 | 10.9 | GO:0043152 | induction of bacterial agglutination(GO:0043152) |
| 0.7 | 5.1 | GO:0016098 | monoterpenoid metabolic process(GO:0016098) |
| 0.7 | 2.7 | GO:2001027 | negative regulation of endothelial cell chemotaxis(GO:2001027) |
| 0.7 | 4.0 | GO:0001079 | nitrogen catabolite regulation of transcription from RNA polymerase II promoter(GO:0001079) nitrogen catabolite activation of transcription from RNA polymerase II promoter(GO:0001080) regulation of urea metabolic process(GO:0034255) intracellular bile acid receptor signaling pathway(GO:0038185) interleukin-17 secretion(GO:0072615) nitrogen catabolite regulation of transcription(GO:0090293) nitrogen catabolite activation of transcription(GO:0090294) regulation of nitrogen cycle metabolic process(GO:1903314) positive regulation of glutamate metabolic process(GO:2000213) regulation of ammonia assimilation cycle(GO:2001248) positive regulation of ammonia assimilation cycle(GO:2001250) |
| 0.7 | 2.0 | GO:0070634 | transepithelial ammonium transport(GO:0070634) |
| 0.6 | 1.9 | GO:0071250 | cellular response to nitrite(GO:0071250) response to nitrite(GO:0080033) glomerular visceral epithelial cell apoptotic process(GO:1903210) regulation of glomerular visceral epithelial cell apoptotic process(GO:1904633) positive regulation of glomerular visceral epithelial cell apoptotic process(GO:1904635) response to resveratrol(GO:1904638) cellular response to resveratrol(GO:1904639) positive regulation of progesterone biosynthetic process(GO:2000184) |
| 0.6 | 2.3 | GO:0031455 | glycine betaine biosynthetic process from choline(GO:0019285) glycine betaine metabolic process(GO:0031455) glycine betaine biosynthetic process(GO:0031456) |
| 0.5 | 7.3 | GO:0010898 | positive regulation of triglyceride catabolic process(GO:0010898) |
| 0.5 | 4.8 | GO:0007598 | blood coagulation, extrinsic pathway(GO:0007598) |
| 0.4 | 4.4 | GO:0051918 | negative regulation of fibrinolysis(GO:0051918) |
| 0.4 | 1.1 | GO:0071449 | cellular response to lipid hydroperoxide(GO:0071449) |
| 0.4 | 1.1 | GO:0030505 | inorganic diphosphate transport(GO:0030505) |
| 0.3 | 1.0 | GO:0061713 | neural crest cell migration involved in heart formation(GO:0003147) anterior neural tube closure(GO:0061713) |
| 0.3 | 1.0 | GO:0018315 | molybdenum incorporation into molybdenum-molybdopterin complex(GO:0018315) metal incorporation into metallo-molybdopterin complex(GO:0042040) glycine receptor clustering(GO:0072579) |
| 0.3 | 1.0 | GO:0006864 | pyrimidine nucleotide transport(GO:0006864) mitochondrial pyrimidine nucleotide import(GO:1990519) |
| 0.3 | 1.8 | GO:0008218 | bioluminescence(GO:0008218) |
| 0.3 | 3.3 | GO:1902897 | regulation of postsynaptic density protein 95 clustering(GO:1902897) |
| 0.3 | 0.9 | GO:0045897 | positive regulation of transcription during mitosis(GO:0045897) |
| 0.3 | 2.5 | GO:0046726 | positive regulation by virus of viral protein levels in host cell(GO:0046726) |
| 0.3 | 0.8 | GO:0070318 | positive regulation of G0 to G1 transition(GO:0070318) |
| 0.2 | 0.9 | GO:0010983 | positive regulation of high-density lipoprotein particle clearance(GO:0010983) |
| 0.2 | 0.9 | GO:0010430 | fatty acid omega-oxidation(GO:0010430) |
| 0.2 | 1.8 | GO:0046952 | ketone body catabolic process(GO:0046952) |
| 0.2 | 1.1 | GO:0048388 | endosomal lumen acidification(GO:0048388) |
| 0.2 | 1.0 | GO:0097056 | selenocysteinyl-tRNA(Sec) biosynthetic process(GO:0097056) |
| 0.2 | 0.8 | GO:0018125 | peptidyl-cysteine methylation(GO:0018125) |
| 0.2 | 1.1 | GO:0090362 | positive regulation of platelet-derived growth factor production(GO:0090362) |
| 0.2 | 3.7 | GO:0006527 | arginine catabolic process(GO:0006527) |
| 0.2 | 0.7 | GO:0006169 | adenosine salvage(GO:0006169) dATP biosynthetic process(GO:0006175) |
| 0.2 | 1.8 | GO:0034378 | chylomicron assembly(GO:0034378) |
| 0.2 | 2.2 | GO:0045919 | positive regulation of cytolysis(GO:0045919) |
| 0.2 | 1.4 | GO:0002018 | renin-angiotensin regulation of aldosterone production(GO:0002018) |
| 0.2 | 0.9 | GO:0009236 | cobalamin biosynthetic process(GO:0009236) short-chain fatty acid catabolic process(GO:0019626) |
| 0.2 | 0.2 | GO:0045763 | negative regulation of cellular amino acid metabolic process(GO:0045763) |
| 0.2 | 0.5 | GO:0014810 | positive regulation of skeletal muscle contraction by regulation of release of sequestered calcium ion(GO:0014810) |
| 0.2 | 2.6 | GO:0008627 | intrinsic apoptotic signaling pathway in response to osmotic stress(GO:0008627) |
| 0.2 | 0.7 | GO:1904732 | regulation of electron carrier activity(GO:1904732) |
| 0.2 | 1.3 | GO:0009441 | glycolate metabolic process(GO:0009441) |
| 0.2 | 0.8 | GO:0019805 | quinolinate biosynthetic process(GO:0019805) |
| 0.2 | 0.8 | GO:0046121 | deoxyribonucleoside catabolic process(GO:0046121) |
| 0.2 | 2.8 | GO:0070050 | neuron cellular homeostasis(GO:0070050) |
| 0.2 | 2.1 | GO:0015747 | urate transport(GO:0015747) |
| 0.1 | 0.9 | GO:0034372 | very-low-density lipoprotein particle remodeling(GO:0034372) |
| 0.1 | 1.0 | GO:0060467 | negative regulation of fertilization(GO:0060467) |
| 0.1 | 1.7 | GO:0052697 | flavonoid glucuronidation(GO:0052696) xenobiotic glucuronidation(GO:0052697) |
| 0.1 | 0.5 | GO:0036269 | swimming behavior(GO:0036269) |
| 0.1 | 0.7 | GO:1904387 | cellular response to thyroxine stimulus(GO:0097069) cellular response to L-phenylalanine derivative(GO:1904387) |
| 0.1 | 2.8 | GO:0045945 | positive regulation of transcription from RNA polymerase III promoter(GO:0045945) |
| 0.1 | 1.2 | GO:0015811 | L-cystine transport(GO:0015811) |
| 0.1 | 1.8 | GO:0019530 | taurine metabolic process(GO:0019530) |
| 0.1 | 2.0 | GO:0044341 | sodium-dependent phosphate transport(GO:0044341) |
| 0.1 | 0.5 | GO:0021965 | spinal cord ventral commissure morphogenesis(GO:0021965) |
| 0.1 | 0.7 | GO:0006432 | phenylalanyl-tRNA aminoacylation(GO:0006432) |
| 0.1 | 1.0 | GO:1900827 | maintenance of protein location in membrane(GO:0072658) maintenance of protein location in plasma membrane(GO:0072660) positive regulation of membrane depolarization during cardiac muscle cell action potential(GO:1900827) |
| 0.1 | 0.5 | GO:0006617 | SRP-dependent cotranslational protein targeting to membrane, signal sequence recognition(GO:0006617) |
| 0.1 | 0.8 | GO:1901896 | positive regulation of calcium-transporting ATPase activity(GO:1901896) |
| 0.1 | 0.4 | GO:0002188 | translation reinitiation(GO:0002188) |
| 0.1 | 1.0 | GO:0086073 | bundle of His cell-Purkinje myocyte adhesion involved in cell communication(GO:0086073) |
| 0.1 | 0.9 | GO:0030242 | pexophagy(GO:0030242) |
| 0.1 | 0.5 | GO:0046946 | hydroxylysine metabolic process(GO:0046946) hydroxylysine biosynthetic process(GO:0046947) |
| 0.1 | 0.5 | GO:0002528 | regulation of vascular permeability involved in acute inflammatory response(GO:0002528) |
| 0.1 | 0.3 | GO:0042245 | RNA repair(GO:0042245) |
| 0.1 | 2.5 | GO:0005513 | detection of calcium ion(GO:0005513) |
| 0.1 | 0.3 | GO:0032747 | positive regulation of interleukin-23 production(GO:0032747) |
| 0.1 | 1.9 | GO:0033141 | positive regulation of peptidyl-serine phosphorylation of STAT protein(GO:0033141) |
| 0.1 | 0.9 | GO:0002084 | protein depalmitoylation(GO:0002084) |
| 0.1 | 0.5 | GO:0051792 | medium-chain fatty acid biosynthetic process(GO:0051792) |
| 0.1 | 2.4 | GO:0015812 | gamma-aminobutyric acid transport(GO:0015812) |
| 0.1 | 0.6 | GO:0099558 | maintenance of synapse structure(GO:0099558) |
| 0.1 | 1.0 | GO:0001887 | selenium compound metabolic process(GO:0001887) |
| 0.1 | 0.7 | GO:0010265 | SCF complex assembly(GO:0010265) |
| 0.1 | 0.6 | GO:0032377 | regulation of intracellular lipid transport(GO:0032377) regulation of intracellular sterol transport(GO:0032380) regulation of intracellular cholesterol transport(GO:0032383) |
| 0.1 | 1.0 | GO:0009812 | flavonoid metabolic process(GO:0009812) |
| 0.1 | 0.6 | GO:0042268 | regulation of cytolysis(GO:0042268) |
| 0.1 | 2.8 | GO:0043252 | sodium-independent organic anion transport(GO:0043252) |
| 0.1 | 0.2 | GO:0090133 | mesendoderm migration(GO:0090133) cell migration involved in mesendoderm migration(GO:0090134) |
| 0.1 | 0.4 | GO:0038016 | insulin receptor internalization(GO:0038016) |
| 0.1 | 3.6 | GO:0061049 | physiological muscle hypertrophy(GO:0003298) physiological cardiac muscle hypertrophy(GO:0003301) cell growth involved in cardiac muscle cell development(GO:0061049) |
| 0.1 | 0.4 | GO:0036233 | glycine import(GO:0036233) |
| 0.1 | 2.2 | GO:0042359 | vitamin D metabolic process(GO:0042359) |
| 0.1 | 1.6 | GO:1903830 | magnesium ion transmembrane transport(GO:1903830) |
| 0.1 | 1.2 | GO:0006105 | succinate metabolic process(GO:0006105) |
| 0.1 | 0.5 | GO:1903385 | regulation of homophilic cell adhesion(GO:1903385) |
| 0.1 | 0.9 | GO:0090360 | platelet-derived growth factor production(GO:0090360) regulation of platelet-derived growth factor production(GO:0090361) |
| 0.1 | 0.3 | GO:0051097 | negative regulation of helicase activity(GO:0051097) |
| 0.1 | 3.6 | GO:0048665 | neuron fate specification(GO:0048665) |
| 0.1 | 0.3 | GO:0045053 | protein retention in Golgi apparatus(GO:0045053) |
| 0.1 | 0.6 | GO:0060648 | mammary gland bud morphogenesis(GO:0060648) |
| 0.1 | 0.9 | GO:0034058 | endosomal vesicle fusion(GO:0034058) |
| 0.1 | 0.2 | GO:0045645 | regulation of eosinophil differentiation(GO:0045643) positive regulation of eosinophil differentiation(GO:0045645) |
| 0.1 | 2.0 | GO:0042744 | hydrogen peroxide catabolic process(GO:0042744) |
| 0.1 | 0.9 | GO:0060287 | epithelial cilium movement involved in determination of left/right asymmetry(GO:0060287) |
| 0.1 | 0.4 | GO:0048165 | ovarian cumulus expansion(GO:0001550) fused antrum stage(GO:0048165) negative regulation of chondrocyte proliferation(GO:1902731) |
| 0.1 | 0.6 | GO:2001288 | positive regulation of caveolin-mediated endocytosis(GO:2001288) |
| 0.1 | 0.5 | GO:0070649 | formin-nucleated actin cable assembly(GO:0070649) |
| 0.1 | 0.7 | GO:0036444 | calcium ion transmembrane import into mitochondrion(GO:0036444) |
| 0.1 | 0.3 | GO:0010615 | positive regulation of cardiac muscle adaptation(GO:0010615) positive regulation of cardiac muscle hypertrophy in response to stress(GO:1903244) |
| 0.1 | 0.6 | GO:0003228 | atrial cardiac muscle tissue development(GO:0003228) atrial cardiac muscle tissue morphogenesis(GO:0055009) |
| 0.1 | 0.3 | GO:0035973 | aggrephagy(GO:0035973) |
| 0.1 | 1.0 | GO:0000712 | resolution of meiotic recombination intermediates(GO:0000712) |
| 0.1 | 0.2 | GO:0035188 | blastocyst hatching(GO:0001835) hatching(GO:0035188) organism emergence from protective structure(GO:0071684) |
| 0.0 | 1.4 | GO:0015671 | oxygen transport(GO:0015671) |
| 0.0 | 0.8 | GO:0042407 | cristae formation(GO:0042407) |
| 0.0 | 0.2 | GO:0006480 | N-terminal protein amino acid methylation(GO:0006480) |
| 0.0 | 1.6 | GO:0002091 | negative regulation of receptor internalization(GO:0002091) |
| 0.0 | 0.3 | GO:1903566 | positive regulation of protein localization to cilium(GO:1903566) |
| 0.0 | 0.4 | GO:0018211 | protein C-linked glycosylation(GO:0018103) peptidyl-tryptophan modification(GO:0018211) protein C-linked glycosylation via tryptophan(GO:0018317) protein C-linked glycosylation via 2'-alpha-mannosyl-L-tryptophan(GO:0018406) |
| 0.0 | 0.5 | GO:0009256 | 10-formyltetrahydrofolate metabolic process(GO:0009256) |
| 0.0 | 0.5 | GO:0098814 | spontaneous neurotransmitter secretion(GO:0061669) spontaneous synaptic transmission(GO:0098814) |
| 0.0 | 0.3 | GO:2001045 | negative regulation of integrin-mediated signaling pathway(GO:2001045) |
| 0.0 | 2.8 | GO:0050435 | beta-amyloid metabolic process(GO:0050435) |
| 0.0 | 0.9 | GO:0070129 | regulation of mitochondrial translation(GO:0070129) |
| 0.0 | 0.1 | GO:1903348 | positive regulation of bicellular tight junction assembly(GO:1903348) |
| 0.0 | 0.1 | GO:0006597 | spermine biosynthetic process(GO:0006597) |
| 0.0 | 1.0 | GO:0021554 | optic nerve development(GO:0021554) |
| 0.0 | 1.1 | GO:0071786 | endoplasmic reticulum tubular network organization(GO:0071786) |
| 0.0 | 0.4 | GO:0018231 | peptidyl-L-cysteine S-palmitoylation(GO:0018230) peptidyl-S-diacylglycerol-L-cysteine biosynthetic process from peptidyl-cysteine(GO:0018231) |
| 0.0 | 3.2 | GO:0010107 | potassium ion import(GO:0010107) |
| 0.0 | 0.3 | GO:0030950 | establishment or maintenance of actin cytoskeleton polarity(GO:0030950) |
| 0.0 | 0.5 | GO:0090160 | Golgi to lysosome transport(GO:0090160) |
| 0.0 | 0.3 | GO:0033564 | anterior/posterior axon guidance(GO:0033564) |
| 0.0 | 0.8 | GO:0019227 | neuronal action potential propagation(GO:0019227) action potential propagation(GO:0098870) |
| 0.0 | 0.3 | GO:0046146 | tetrahydrobiopterin biosynthetic process(GO:0006729) tetrahydrobiopterin metabolic process(GO:0046146) |
| 0.0 | 0.2 | GO:0097498 | endothelial tube lumen extension(GO:0097498) |
| 0.0 | 0.6 | GO:0021840 | directional guidance of interneurons involved in migration from the subpallium to the cortex(GO:0021840) chemorepulsion involved in interneuron migration from the subpallium to the cortex(GO:0021842) ERBB3 signaling pathway(GO:0038129) |
| 0.0 | 0.3 | GO:1904694 | negative regulation of vascular smooth muscle contraction(GO:1904694) |
| 0.0 | 1.9 | GO:0030220 | platelet formation(GO:0030220) |
| 0.0 | 0.4 | GO:0006657 | CDP-choline pathway(GO:0006657) |
| 0.0 | 0.6 | GO:2000543 | positive regulation of gastrulation(GO:2000543) |
| 0.0 | 0.1 | GO:0051083 | 'de novo' cotranslational protein folding(GO:0051083) |
| 0.0 | 0.3 | GO:0021914 | negative regulation of smoothened signaling pathway involved in ventral spinal cord patterning(GO:0021914) |
| 0.0 | 0.1 | GO:1902725 | negative regulation of satellite cell differentiation(GO:1902725) |
| 0.0 | 1.6 | GO:0010842 | retina layer formation(GO:0010842) |
| 0.0 | 0.2 | GO:0016081 | synaptic vesicle docking(GO:0016081) |
| 0.0 | 0.6 | GO:0006957 | complement activation, alternative pathway(GO:0006957) |
| 0.0 | 1.1 | GO:0010592 | positive regulation of lamellipodium assembly(GO:0010592) |
| 0.0 | 0.4 | GO:0030952 | establishment or maintenance of microtubule cytoskeleton polarity(GO:0030951) establishment or maintenance of cytoskeleton polarity(GO:0030952) |
| 0.0 | 0.1 | GO:1903517 | regulation of telomere maintenance via recombination(GO:0032207) negative regulation of telomere maintenance via recombination(GO:0032208) negative regulation of single strand break repair(GO:1903517) negative regulation of beta-galactosidase activity(GO:1903770) telomere single strand break repair(GO:1903823) negative regulation of telomere single strand break repair(GO:1903824) |
| 0.0 | 0.5 | GO:0051661 | maintenance of centrosome location(GO:0051661) |
| 0.0 | 0.3 | GO:1900004 | negative regulation of serine-type endopeptidase activity(GO:1900004) negative regulation of serine-type peptidase activity(GO:1902572) |
| 0.0 | 0.4 | GO:0070560 | protein secretion by platelet(GO:0070560) |
| 0.0 | 0.7 | GO:0097264 | self proteolysis(GO:0097264) |
| 0.0 | 0.6 | GO:1904424 | regulation of GTP binding(GO:1904424) |
| 0.0 | 0.1 | GO:1900063 | regulation of peroxisome organization(GO:1900063) |
| 0.0 | 0.2 | GO:2000670 | positive regulation of cAMP-dependent protein kinase activity(GO:2000481) positive regulation of dendritic cell apoptotic process(GO:2000670) |
| 0.0 | 0.4 | GO:0035721 | intraciliary retrograde transport(GO:0035721) |
| 0.0 | 0.1 | GO:0070389 | chaperone cofactor-dependent protein refolding(GO:0070389) |
| 0.0 | 1.4 | GO:0097120 | receptor localization to synapse(GO:0097120) |
| 0.0 | 0.2 | GO:0010724 | regulation of definitive erythrocyte differentiation(GO:0010724) |
| 0.0 | 0.6 | GO:2001256 | regulation of store-operated calcium entry(GO:2001256) |
| 0.0 | 1.5 | GO:2000300 | regulation of synaptic vesicle exocytosis(GO:2000300) |
| 0.0 | 0.5 | GO:0060158 | phospholipase C-activating dopamine receptor signaling pathway(GO:0060158) |
| 0.0 | 1.1 | GO:0060292 | long term synaptic depression(GO:0060292) |
| 0.0 | 3.5 | GO:0006970 | response to osmotic stress(GO:0006970) |
| 0.0 | 0.2 | GO:0000117 | regulation of transcription involved in G2/M transition of mitotic cell cycle(GO:0000117) |
| 0.0 | 1.3 | GO:0016486 | peptide hormone processing(GO:0016486) |
| 0.0 | 0.4 | GO:0007258 | JUN phosphorylation(GO:0007258) |
| 0.0 | 0.5 | GO:0001767 | establishment of lymphocyte polarity(GO:0001767) |
| 0.0 | 0.8 | GO:0071447 | cellular response to hydroperoxide(GO:0071447) |
| 0.0 | 0.5 | GO:2000480 | negative regulation of cAMP-dependent protein kinase activity(GO:2000480) |
| 0.0 | 1.3 | GO:0042462 | eye photoreceptor cell development(GO:0042462) |
| 0.0 | 0.4 | GO:0046784 | viral mRNA export from host cell nucleus(GO:0046784) |
| 0.0 | 0.3 | GO:0070375 | ERK5 cascade(GO:0070375) |
| 0.0 | 0.8 | GO:0006750 | glutathione biosynthetic process(GO:0006750) |
| 0.0 | 0.3 | GO:0097475 | motor neuron migration(GO:0097475) |
| 0.0 | 0.1 | GO:1904158 | axonemal central apparatus assembly(GO:1904158) |
| 0.0 | 0.3 | GO:0007023 | post-chaperonin tubulin folding pathway(GO:0007023) |
| 0.0 | 0.3 | GO:0006451 | selenocysteine incorporation(GO:0001514) translational readthrough(GO:0006451) |
| 0.0 | 0.5 | GO:0051531 | NFAT protein import into nucleus(GO:0051531) |
| 0.0 | 0.6 | GO:0045292 | mRNA cis splicing, via spliceosome(GO:0045292) |
| 0.0 | 2.5 | GO:0051965 | positive regulation of synapse assembly(GO:0051965) |
| 0.0 | 0.2 | GO:0060005 | vestibular reflex(GO:0060005) |
| 0.0 | 0.4 | GO:0060134 | prepulse inhibition(GO:0060134) |
| 0.0 | 0.4 | GO:0098719 | sodium ion import across plasma membrane(GO:0098719) sodium ion import into cell(GO:1990118) |
| 0.0 | 0.3 | GO:0006011 | UDP-glucose metabolic process(GO:0006011) |
| 0.0 | 0.3 | GO:0021830 | interneuron migration from the subpallium to the cortex(GO:0021830) |
| 0.0 | 0.3 | GO:0006689 | ganglioside catabolic process(GO:0006689) |
| 0.0 | 0.2 | GO:0015705 | iodide transport(GO:0015705) |
| 0.0 | 0.3 | GO:0061635 | regulation of protein complex stability(GO:0061635) |
| 0.0 | 0.4 | GO:1904293 | negative regulation of ERAD pathway(GO:1904293) |
| 0.0 | 0.3 | GO:0045743 | positive regulation of fibroblast growth factor receptor signaling pathway(GO:0045743) |
| 0.0 | 6.8 | GO:0050911 | detection of chemical stimulus involved in sensory perception of smell(GO:0050911) |
| 0.0 | 0.2 | GO:0044829 | positive regulation by host of viral genome replication(GO:0044829) |
| 0.0 | 0.3 | GO:0099500 | synaptic vesicle fusion to presynaptic active zone membrane(GO:0031629) vesicle fusion to plasma membrane(GO:0099500) |
| 0.0 | 0.1 | GO:0006533 | aspartate catabolic process(GO:0006533) |
| 0.0 | 0.2 | GO:1902947 | regulation of tau-protein kinase activity(GO:1902947) |
| 0.0 | 0.1 | GO:0035526 | retrograde transport, plasma membrane to Golgi(GO:0035526) |
| 0.0 | 0.6 | GO:0048268 | clathrin coat assembly(GO:0048268) |
| 0.0 | 0.6 | GO:0017004 | cytochrome complex assembly(GO:0017004) |
| 0.0 | 0.3 | GO:2000828 | post-embryonic body morphogenesis(GO:0040032) regulation of parathyroid hormone secretion(GO:2000828) |
| 0.0 | 0.4 | GO:0034975 | protein folding in endoplasmic reticulum(GO:0034975) |
| 0.0 | 0.5 | GO:0017121 | phospholipid scrambling(GO:0017121) |
| 0.0 | 4.2 | GO:0050821 | protein stabilization(GO:0050821) |
| 0.0 | 0.1 | GO:0044334 | canonical Wnt signaling pathway involved in positive regulation of epithelial to mesenchymal transition(GO:0044334) |
| 0.0 | 0.1 | GO:0006883 | cellular sodium ion homeostasis(GO:0006883) |
| 0.0 | 0.8 | GO:0007205 | protein kinase C-activating G-protein coupled receptor signaling pathway(GO:0007205) |
| 0.0 | 1.0 | GO:0097352 | autophagosome maturation(GO:0097352) |
| 0.0 | 0.3 | GO:0003322 | pancreatic A cell development(GO:0003322) |
| 0.0 | 0.5 | GO:0016242 | negative regulation of macroautophagy(GO:0016242) |
| 0.0 | 0.5 | GO:0007077 | mitotic nuclear envelope disassembly(GO:0007077) |
| 0.0 | 0.0 | GO:0035048 | splicing factor protein import into nucleus(GO:0035048) |
| 0.0 | 0.0 | GO:0071639 | positive regulation of monocyte chemotactic protein-1 production(GO:0071639) |
| 0.0 | 1.8 | GO:0010923 | negative regulation of phosphatase activity(GO:0010923) |
| 0.0 | 0.4 | GO:0010818 | T cell chemotaxis(GO:0010818) |
| 0.0 | 0.9 | GO:0010259 | multicellular organism aging(GO:0010259) |
| 0.0 | 0.5 | GO:0043968 | histone H2A acetylation(GO:0043968) |
| 0.0 | 3.1 | GO:0034605 | cellular response to heat(GO:0034605) |
| 0.0 | 0.3 | GO:0035589 | G-protein coupled purinergic nucleotide receptor signaling pathway(GO:0035589) |
| 0.0 | 0.8 | GO:0045773 | positive regulation of axon extension(GO:0045773) |
| 0.0 | 0.2 | GO:0030259 | lipid glycosylation(GO:0030259) |
| 0.0 | 0.0 | GO:0072717 | transcription factor catabolic process(GO:0036369) cellular response to actinomycin D(GO:0072717) |
| 0.0 | 0.7 | GO:1903959 | regulation of anion transmembrane transport(GO:1903959) |
| 0.0 | 0.1 | GO:0008204 | ergosterol biosynthetic process(GO:0006696) ergosterol metabolic process(GO:0008204) cellular alcohol metabolic process(GO:0044107) cellular alcohol biosynthetic process(GO:0044108) |
| 0.0 | 0.3 | GO:0035162 | embryonic hemopoiesis(GO:0035162) |
| 0.0 | 0.3 | GO:0033539 | fatty acid beta-oxidation using acyl-CoA dehydrogenase(GO:0033539) |
| 0.0 | 0.9 | GO:0006120 | mitochondrial electron transport, NADH to ubiquinone(GO:0006120) |
| 0.0 | 0.9 | GO:0045214 | sarcomere organization(GO:0045214) |
| 0.0 | 0.1 | GO:0071763 | nuclear membrane organization(GO:0071763) |
| 0.0 | 0.3 | GO:0040036 | regulation of fibroblast growth factor receptor signaling pathway(GO:0040036) |
| 0.0 | 0.2 | GO:1902455 | negative regulation of stem cell population maintenance(GO:1902455) |
| 0.0 | 0.3 | GO:0006744 | ubiquinone biosynthetic process(GO:0006744) quinone biosynthetic process(GO:1901663) |
| 0.0 | 0.5 | GO:0022400 | regulation of rhodopsin mediated signaling pathway(GO:0022400) |
| 0.0 | 0.2 | GO:0034587 | piRNA metabolic process(GO:0034587) |
| 0.0 | 0.4 | GO:0072662 | protein targeting to peroxisome(GO:0006625) protein localization to peroxisome(GO:0072662) establishment of protein localization to peroxisome(GO:0072663) |
| 0.0 | 0.3 | GO:0071420 | cellular response to histamine(GO:0071420) |
| 0.0 | 0.7 | GO:0006749 | glutathione metabolic process(GO:0006749) |
| 0.0 | 0.2 | GO:0019800 | peptide cross-linking via chondroitin 4-sulfate glycosaminoglycan(GO:0019800) |
| 0.0 | 0.3 | GO:0046716 | muscle cell cellular homeostasis(GO:0046716) |
| 0.0 | 0.0 | GO:2001106 | regulation of Rho guanyl-nucleotide exchange factor activity(GO:2001106) |
| 0.0 | 0.2 | GO:0034498 | early endosome to Golgi transport(GO:0034498) |
Gene overrepresentation in cellular component category:
| Log-likelihood per target | Total log-likelihood | Term | Description |
|---|---|---|---|
| 0.9 | 3.4 | GO:0031838 | haptoglobin-hemoglobin complex(GO:0031838) |
| 0.8 | 10.9 | GO:0005577 | fibrinogen complex(GO:0005577) |
| 0.6 | 1.9 | GO:1990843 | subsarcolemmal mitochondrion(GO:1990843) interfibrillar mitochondrion(GO:1990844) |
| 0.5 | 3.8 | GO:0044279 | other organism cell membrane(GO:0044218) other organism membrane(GO:0044279) |
| 0.3 | 1.0 | GO:0071821 | FANCM-MHF complex(GO:0071821) |
| 0.2 | 5.4 | GO:0031089 | platelet dense granule lumen(GO:0031089) |
| 0.2 | 0.9 | GO:0045281 | mitochondrial respiratory chain complex II, succinate dehydrogenase complex (ubiquinone)(GO:0005749) succinate dehydrogenase complex (ubiquinone)(GO:0045257) respiratory chain complex II(GO:0045273) succinate dehydrogenase complex(GO:0045281) fumarate reductase complex(GO:0045283) |
| 0.2 | 0.7 | GO:0009328 | phenylalanine-tRNA ligase complex(GO:0009328) |
| 0.2 | 0.5 | GO:0070931 | Golgi-associated vesicle lumen(GO:0070931) |
| 0.2 | 0.8 | GO:0031510 | SUMO activating enzyme complex(GO:0031510) |
| 0.1 | 1.4 | GO:0000835 | ER ubiquitin ligase complex(GO:0000835) Hrd1p ubiquitin ligase complex(GO:0000836) |
| 0.1 | 0.7 | GO:0017109 | glutamate-cysteine ligase complex(GO:0017109) |
| 0.1 | 0.4 | GO:0034515 | proteasome storage granule(GO:0034515) |
| 0.1 | 4.1 | GO:0005916 | fascia adherens(GO:0005916) |
| 0.1 | 0.5 | GO:0044307 | dendritic branch(GO:0044307) |
| 0.1 | 0.9 | GO:0033263 | CORVET complex(GO:0033263) |
| 0.1 | 0.8 | GO:0061617 | MICOS complex(GO:0061617) |
| 0.1 | 0.7 | GO:0031467 | Cul7-RING ubiquitin ligase complex(GO:0031467) |
| 0.1 | 0.7 | GO:1990246 | uniplex complex(GO:1990246) |
| 0.1 | 3.3 | GO:0014731 | spectrin-associated cytoskeleton(GO:0014731) |
| 0.1 | 2.6 | GO:0001518 | voltage-gated sodium channel complex(GO:0001518) |
| 0.1 | 1.0 | GO:0097442 | CA3 pyramidal cell dendrite(GO:0097442) |
| 0.1 | 0.6 | GO:0005846 | nuclear cap binding complex(GO:0005846) |
| 0.1 | 0.2 | GO:0030849 | autosome(GO:0030849) |
| 0.1 | 0.4 | GO:0043527 | tRNA methyltransferase complex(GO:0043527) |
| 0.1 | 2.3 | GO:0098563 | integral component of synaptic vesicle membrane(GO:0030285) intrinsic component of synaptic vesicle membrane(GO:0098563) |
| 0.1 | 2.6 | GO:0005719 | nuclear euchromatin(GO:0005719) |
| 0.1 | 0.3 | GO:0034271 | phosphatidylinositol 3-kinase complex, class III, type I(GO:0034271) phosphatidylinositol 3-kinase complex, class III, type II(GO:0034272) |
| 0.1 | 0.3 | GO:0034274 | Atg12-Atg5-Atg16 complex(GO:0034274) |
| 0.1 | 4.0 | GO:0005782 | peroxisomal matrix(GO:0005782) microbody lumen(GO:0031907) |
| 0.1 | 1.0 | GO:0097433 | dense body(GO:0097433) |
| 0.1 | 0.4 | GO:0071942 | XPC complex(GO:0071942) |
| 0.1 | 1.8 | GO:0005942 | phosphatidylinositol 3-kinase complex(GO:0005942) |
| 0.1 | 2.0 | GO:0036019 | endolysosome(GO:0036019) |
| 0.0 | 1.2 | GO:0016461 | unconventional myosin complex(GO:0016461) |
| 0.0 | 0.5 | GO:0005786 | signal recognition particle, endoplasmic reticulum targeting(GO:0005786) |
| 0.0 | 0.6 | GO:0033588 | Elongator holoenzyme complex(GO:0033588) |
| 0.0 | 0.6 | GO:0030314 | junctional membrane complex(GO:0030314) |
| 0.0 | 0.5 | GO:0072487 | MSL complex(GO:0072487) |
| 0.0 | 0.8 | GO:0043194 | axon initial segment(GO:0043194) |
| 0.0 | 1.1 | GO:0070971 | endoplasmic reticulum exit site(GO:0070971) |
| 0.0 | 0.6 | GO:0000322 | storage vacuole(GO:0000322) |
| 0.0 | 1.4 | GO:0016327 | apicolateral plasma membrane(GO:0016327) |
| 0.0 | 0.7 | GO:0008250 | oligosaccharyltransferase complex(GO:0008250) |
| 0.0 | 0.4 | GO:0030991 | intraciliary transport particle A(GO:0030991) |
| 0.0 | 7.2 | GO:0008076 | voltage-gated potassium channel complex(GO:0008076) |
| 0.0 | 0.4 | GO:0033391 | chromatoid body(GO:0033391) |
| 0.0 | 8.8 | GO:0005875 | microtubule associated complex(GO:0005875) |
| 0.0 | 0.4 | GO:1990712 | HFE-transferrin receptor complex(GO:1990712) |
| 0.0 | 0.6 | GO:0043083 | synaptic cleft(GO:0043083) |
| 0.0 | 0.5 | GO:0071203 | WASH complex(GO:0071203) |
| 0.0 | 3.2 | GO:0033116 | endoplasmic reticulum-Golgi intermediate compartment membrane(GO:0033116) |
| 0.0 | 0.4 | GO:0000347 | THO complex(GO:0000347) THO complex part of transcription export complex(GO:0000445) |
| 0.0 | 0.4 | GO:0002178 | palmitoyltransferase complex(GO:0002178) |
| 0.0 | 0.2 | GO:0036449 | microtubule minus-end(GO:0036449) |
| 0.0 | 0.4 | GO:0031618 | nuclear pericentric heterochromatin(GO:0031618) |
| 0.0 | 0.6 | GO:0005922 | connexon complex(GO:0005922) |
| 0.0 | 0.4 | GO:0017146 | NMDA selective glutamate receptor complex(GO:0017146) |
| 0.0 | 0.2 | GO:0042584 | chromaffin granule membrane(GO:0042584) |
| 0.0 | 0.3 | GO:0016600 | flotillin complex(GO:0016600) |
| 0.0 | 0.4 | GO:0034663 | endoplasmic reticulum chaperone complex(GO:0034663) |
| 0.0 | 0.4 | GO:1990023 | mitotic spindle midzone(GO:1990023) |
| 0.0 | 0.6 | GO:0005838 | proteasome regulatory particle(GO:0005838) |
| 0.0 | 0.5 | GO:0032585 | multivesicular body membrane(GO:0032585) |
| 0.0 | 0.5 | GO:0042622 | photoreceptor outer segment membrane(GO:0042622) |
| 0.0 | 0.3 | GO:0097038 | perinuclear endoplasmic reticulum(GO:0097038) |
| 0.0 | 0.6 | GO:0032982 | myosin filament(GO:0032982) |
| 0.0 | 0.4 | GO:0032433 | filopodium tip(GO:0032433) |
| 0.0 | 0.9 | GO:0034364 | high-density lipoprotein particle(GO:0034364) |
| 0.0 | 0.1 | GO:0071664 | beta-catenin-TCF7L2 complex(GO:0070369) catenin-TCF7L2 complex(GO:0071664) |
| 0.0 | 1.7 | GO:0044439 | peroxisomal membrane(GO:0005778) microbody membrane(GO:0031903) microbody part(GO:0044438) peroxisomal part(GO:0044439) |
| 0.0 | 1.5 | GO:0031526 | brush border membrane(GO:0031526) |
| 0.0 | 0.6 | GO:0071782 | endoplasmic reticulum tubular network(GO:0071782) |
| 0.0 | 0.0 | GO:0097414 | glial cytoplasmic inclusion(GO:0097409) classical Lewy body(GO:0097414) Lewy neurite(GO:0097462) Lewy body corona(GO:1990038) |
| 0.0 | 0.6 | GO:0030673 | axolemma(GO:0030673) |
| 0.0 | 0.9 | GO:0045271 | mitochondrial respiratory chain complex I(GO:0005747) NADH dehydrogenase complex(GO:0030964) respiratory chain complex I(GO:0045271) |
| 0.0 | 0.4 | GO:0000930 | gamma-tubulin complex(GO:0000930) |
| 0.0 | 5.2 | GO:0005788 | endoplasmic reticulum lumen(GO:0005788) |
| 0.0 | 7.9 | GO:0005759 | mitochondrial matrix(GO:0005759) |
| 0.0 | 5.9 | GO:0016324 | apical plasma membrane(GO:0016324) |
| 0.0 | 0.2 | GO:0032426 | stereocilium tip(GO:0032426) |
| 0.0 | 0.6 | GO:0048786 | presynaptic active zone(GO:0048786) |
| 0.0 | 0.0 | GO:0033150 | cytoskeletal calyx(GO:0033150) |
| 0.0 | 0.7 | GO:0002102 | podosome(GO:0002102) |
Gene overrepresentation in molecular function category:
| Log-likelihood per target | Total log-likelihood | Term | Description |
|---|---|---|---|
| 1.6 | 4.7 | GO:0080130 | L-phenylalanine:2-oxoglutarate aminotransferase activity(GO:0080130) |
| 1.4 | 4.1 | GO:0004411 | homogentisate 1,2-dioxygenase activity(GO:0004411) |
| 1.2 | 3.6 | GO:1904854 | proteasome core complex binding(GO:1904854) |
| 0.8 | 3.9 | GO:0034875 | oxidoreductase activity, acting on CH or CH2 groups, quinone or similar compound as acceptor(GO:0033695) caffeine oxidase activity(GO:0034875) |
| 0.7 | 4.4 | GO:0060230 | lipoprotein lipase activator activity(GO:0060230) |
| 0.7 | 2.8 | GO:0019150 | D-ribulokinase activity(GO:0019150) |
| 0.7 | 4.0 | GO:1902122 | chenodeoxycholic acid binding(GO:1902122) |
| 0.6 | 1.9 | GO:0004060 | arylamine N-acetyltransferase activity(GO:0004060) |
| 0.6 | 1.8 | GO:0052816 | medium-chain acyl-CoA hydrolase activity(GO:0052815) long-chain acyl-CoA hydrolase activity(GO:0052816) |
| 0.5 | 2.2 | GO:1902271 | D3 vitamins binding(GO:1902271) |
| 0.5 | 3.4 | GO:0030492 | hemoglobin binding(GO:0030492) |
| 0.5 | 3.7 | GO:0016403 | dimethylargininase activity(GO:0016403) |
| 0.4 | 2.2 | GO:0016623 | oxidoreductase activity, acting on the aldehyde or oxo group of donors, oxygen as acceptor(GO:0016623) |
| 0.4 | 1.8 | GO:0003858 | 3-hydroxybutyrate dehydrogenase activity(GO:0003858) |
| 0.4 | 2.5 | GO:0102345 | 3-hydroxy-behenoyl-CoA dehydratase activity(GO:0102344) 3-hydroxy-lignoceroyl-CoA dehydratase activity(GO:0102345) |
| 0.3 | 2.7 | GO:0050816 | phosphoserine binding(GO:0050815) phosphothreonine binding(GO:0050816) |
| 0.3 | 2.6 | GO:0004468 | lysine N-acetyltransferase activity, acting on acetyl phosphate as donor(GO:0004468) |
| 0.3 | 1.0 | GO:0008940 | nitrate reductase activity(GO:0008940) molybdopterin adenylyltransferase activity(GO:0061598) molybdopterin molybdotransferase activity(GO:0061599) |
| 0.3 | 1.0 | GO:0015218 | pyrimidine nucleotide transmembrane transporter activity(GO:0015218) |
| 0.3 | 1.2 | GO:0060001 | minus-end directed microfilament motor activity(GO:0060001) |
| 0.3 | 2.8 | GO:0001042 | RNA polymerase I core binding(GO:0001042) |
| 0.3 | 1.1 | GO:0072320 | volume-sensitive chloride channel activity(GO:0072320) |
| 0.2 | 1.0 | GO:0061714 | folic acid receptor activity(GO:0061714) |
| 0.2 | 2.4 | GO:0005332 | gamma-aminobutyric acid:sodium symporter activity(GO:0005332) |
| 0.2 | 0.9 | GO:0008177 | succinate dehydrogenase (ubiquinone) activity(GO:0008177) 3 iron, 4 sulfur cluster binding(GO:0051538) |
| 0.2 | 8.6 | GO:0004806 | triglyceride lipase activity(GO:0004806) |
| 0.2 | 1.1 | GO:0035529 | NADH pyrophosphatase activity(GO:0035529) |
| 0.2 | 1.0 | GO:0004447 | iodide peroxidase activity(GO:0004447) |
| 0.2 | 0.8 | GO:0005042 | netrin receptor activity(GO:0005042) |
| 0.2 | 0.6 | GO:0070538 | oleic acid binding(GO:0070538) |
| 0.2 | 0.7 | GO:0004001 | adenosine kinase activity(GO:0004001) |
| 0.2 | 1.1 | GO:0008273 | calcium, potassium:sodium antiporter activity(GO:0008273) |
| 0.2 | 4.1 | GO:0008191 | metalloendopeptidase inhibitor activity(GO:0008191) |
| 0.1 | 1.8 | GO:0015272 | ATP-activated inward rectifier potassium channel activity(GO:0015272) |
| 0.1 | 0.4 | GO:0043849 | Ras palmitoyltransferase activity(GO:0043849) |
| 0.1 | 2.1 | GO:0015143 | urate transmembrane transporter activity(GO:0015143) salt transmembrane transporter activity(GO:1901702) |
| 0.1 | 1.9 | GO:0005132 | type I interferon receptor binding(GO:0005132) |
| 0.1 | 2.1 | GO:0045504 | dynein heavy chain binding(GO:0045504) |
| 0.1 | 0.7 | GO:0004357 | glutamate-cysteine ligase activity(GO:0004357) |
| 0.1 | 1.2 | GO:0015184 | L-cystine transmembrane transporter activity(GO:0015184) |
| 0.1 | 4.4 | GO:0048018 | receptor agonist activity(GO:0048018) |
| 0.1 | 0.5 | GO:0008798 | beta-aspartyl-peptidase activity(GO:0008798) |
| 0.1 | 0.5 | GO:0004315 | 3-oxoacyl-[acyl-carrier-protein] synthase activity(GO:0004315) |
| 0.1 | 0.8 | GO:0102008 | cytosolic dipeptidase activity(GO:0102008) |
| 0.1 | 2.0 | GO:0015321 | sodium-dependent phosphate transmembrane transporter activity(GO:0015321) |
| 0.1 | 0.7 | GO:0004826 | phenylalanine-tRNA ligase activity(GO:0004826) |
| 0.1 | 3.7 | GO:0045295 | gamma-catenin binding(GO:0045295) |
| 0.1 | 0.5 | GO:0004487 | methylenetetrahydrofolate dehydrogenase (NAD+) activity(GO:0004487) |
| 0.1 | 2.8 | GO:0015125 | bile acid transmembrane transporter activity(GO:0015125) |
| 0.1 | 2.4 | GO:0070492 | peptidoglycan binding(GO:0042834) oligosaccharide binding(GO:0070492) |
| 0.1 | 0.3 | GO:0043682 | copper-exporting ATPase activity(GO:0004008) phosphoglycerate kinase activity(GO:0004618) copper-transporting ATPase activity(GO:0043682) |
| 0.1 | 3.3 | GO:0043395 | heparan sulfate proteoglycan binding(GO:0043395) |
| 0.1 | 1.0 | GO:0008379 | thioredoxin peroxidase activity(GO:0008379) |
| 0.1 | 0.4 | GO:1904455 | ubiquitin-specific protease activity involved in negative regulation of ERAD pathway(GO:1904455) |
| 0.1 | 0.5 | GO:0042015 | interleukin-20 binding(GO:0042015) |
| 0.1 | 1.0 | GO:0086083 | cell adhesive protein binding involved in bundle of His cell-Purkinje myocyte communication(GO:0086083) |
| 0.1 | 0.5 | GO:0033823 | procollagen-lysine 5-dioxygenase activity(GO:0008475) procollagen glucosyltransferase activity(GO:0033823) |
| 0.1 | 1.3 | GO:0035005 | 1-phosphatidylinositol-4-phosphate 3-kinase activity(GO:0035005) |
| 0.1 | 3.7 | GO:0004181 | metallocarboxypeptidase activity(GO:0004181) |
| 0.1 | 1.8 | GO:0042975 | peroxisome proliferator activated receptor binding(GO:0042975) |
| 0.1 | 0.2 | GO:0005137 | interleukin-5 receptor binding(GO:0005137) |
| 0.1 | 0.7 | GO:0008454 | alpha-1,3-mannosylglycoprotein 4-beta-N-acetylglucosaminyltransferase activity(GO:0008454) |
| 0.1 | 0.5 | GO:0003998 | acylphosphatase activity(GO:0003998) |
| 0.1 | 0.5 | GO:0045174 | glutathione dehydrogenase (ascorbate) activity(GO:0045174) methylarsonate reductase activity(GO:0050610) |
| 0.1 | 3.8 | GO:0008093 | cytoskeletal adaptor activity(GO:0008093) |
| 0.1 | 0.2 | GO:0008441 | 3'(2'),5'-bisphosphate nucleotidase activity(GO:0008441) |
| 0.1 | 0.6 | GO:0017018 | myosin phosphatase activity(GO:0017018) |
| 0.1 | 2.3 | GO:0005242 | inward rectifier potassium channel activity(GO:0005242) |
| 0.1 | 0.4 | GO:0004105 | choline-phosphate cytidylyltransferase activity(GO:0004105) |
| 0.1 | 1.4 | GO:1904264 | ubiquitin protein ligase activity involved in ERAD pathway(GO:1904264) |
| 0.1 | 1.6 | GO:0015095 | magnesium ion transmembrane transporter activity(GO:0015095) |
| 0.1 | 11.0 | GO:0051087 | chaperone binding(GO:0051087) |
| 0.1 | 1.4 | GO:0005344 | oxygen transporter activity(GO:0005344) |
| 0.1 | 0.8 | GO:0044388 | small protein activating enzyme binding(GO:0044388) |
| 0.1 | 0.3 | GO:0035514 | DNA demethylase activity(GO:0035514) |
| 0.1 | 0.9 | GO:0004630 | phospholipase D activity(GO:0004630) |
| 0.1 | 0.9 | GO:0008474 | palmitoyl-(protein) hydrolase activity(GO:0008474) palmitoyl hydrolase activity(GO:0098599) |
| 0.1 | 0.2 | GO:0046848 | hydroxyapatite binding(GO:0046848) |
| 0.1 | 0.3 | GO:0016531 | copper chaperone activity(GO:0016531) |
| 0.1 | 1.4 | GO:0008430 | selenium binding(GO:0008430) |
| 0.1 | 2.6 | GO:1905030 | voltage-gated sodium channel activity(GO:0005248) voltage-gated ion channel activity involved in regulation of postsynaptic membrane potential(GO:1905030) |
| 0.1 | 2.3 | GO:0004029 | aldehyde dehydrogenase (NAD) activity(GO:0004029) |
| 0.1 | 0.6 | GO:0098821 | BMP receptor activity(GO:0098821) |
| 0.1 | 1.2 | GO:0008391 | arachidonic acid monooxygenase activity(GO:0008391) arachidonic acid epoxygenase activity(GO:0008392) |
| 0.1 | 0.5 | GO:0004704 | NF-kappaB-inducing kinase activity(GO:0004704) |
| 0.1 | 0.8 | GO:0016174 | NAD(P)H oxidase activity(GO:0016174) |
| 0.1 | 2.0 | GO:0002162 | dystroglycan binding(GO:0002162) |
| 0.1 | 2.5 | GO:0030506 | ankyrin binding(GO:0030506) |
| 0.1 | 0.5 | GO:0030942 | endoplasmic reticulum signal peptide binding(GO:0030942) |
| 0.1 | 1.4 | GO:0070008 | serine-type exopeptidase activity(GO:0070008) |
| 0.1 | 2.6 | GO:0080025 | phosphatidylinositol-3,5-bisphosphate binding(GO:0080025) |
| 0.1 | 2.5 | GO:0015269 | calcium-activated potassium channel activity(GO:0015269) |
| 0.1 | 1.1 | GO:1900750 | glutathione binding(GO:0043295) oligopeptide binding(GO:1900750) |
| 0.1 | 0.3 | GO:0004775 | succinate-CoA ligase (ADP-forming) activity(GO:0004775) |
| 0.0 | 0.6 | GO:0090599 | alpha-glucosidase activity(GO:0090599) |
| 0.0 | 0.2 | GO:0071885 | N-terminal protein N-methyltransferase activity(GO:0071885) |
| 0.0 | 0.4 | GO:0015235 | cobalamin transporter activity(GO:0015235) |
| 0.0 | 0.6 | GO:0008607 | phosphorylase kinase regulator activity(GO:0008607) |
| 0.0 | 0.5 | GO:0004687 | myosin light chain kinase activity(GO:0004687) |
| 0.0 | 1.2 | GO:0004143 | diacylglycerol kinase activity(GO:0004143) |
| 0.0 | 1.4 | GO:0004190 | aspartic-type endopeptidase activity(GO:0004190) |
| 0.0 | 0.1 | GO:0019808 | polyamine binding(GO:0019808) |
| 0.0 | 1.0 | GO:0004062 | aryl sulfotransferase activity(GO:0004062) |
| 0.0 | 0.5 | GO:0005221 | intracellular cyclic nucleotide activated cation channel activity(GO:0005221) cyclic nucleotide-gated ion channel activity(GO:0043855) |
| 0.0 | 0.2 | GO:0015111 | iodide transmembrane transporter activity(GO:0015111) |
| 0.0 | 1.1 | GO:0043125 | ErbB-3 class receptor binding(GO:0043125) |
| 0.0 | 0.4 | GO:0005025 | transforming growth factor beta receptor activity, type I(GO:0005025) |
| 0.0 | 0.4 | GO:0050682 | AF-2 domain binding(GO:0050682) |
| 0.0 | 2.0 | GO:0015020 | glucuronosyltransferase activity(GO:0015020) |
| 0.0 | 0.2 | GO:0001594 | trace-amine receptor activity(GO:0001594) |
| 0.0 | 0.4 | GO:0003831 | beta-N-acetylglucosaminylglycopeptide beta-1,4-galactosyltransferase activity(GO:0003831) |
| 0.0 | 0.5 | GO:0001591 | dopamine neurotransmitter receptor activity, coupled via Gi/Go(GO:0001591) |
| 0.0 | 0.3 | GO:0016402 | pristanoyl-CoA oxidase activity(GO:0016402) |
| 0.0 | 0.4 | GO:0060002 | plus-end directed microfilament motor activity(GO:0060002) |
| 0.0 | 1.0 | GO:0097602 | cullin family protein binding(GO:0097602) |
| 0.0 | 0.3 | GO:0052794 | exo-alpha-(2->3)-sialidase activity(GO:0052794) exo-alpha-(2->6)-sialidase activity(GO:0052795) exo-alpha-(2->8)-sialidase activity(GO:0052796) |
| 0.0 | 0.5 | GO:0032051 | clathrin light chain binding(GO:0032051) |
| 0.0 | 0.6 | GO:0016846 | carbon-sulfur lyase activity(GO:0016846) |
| 0.0 | 0.7 | GO:0005247 | voltage-gated chloride channel activity(GO:0005247) |
| 0.0 | 0.6 | GO:0019871 | sodium channel inhibitor activity(GO:0019871) |
| 0.0 | 0.4 | GO:0016909 | JUN kinase activity(GO:0004705) SAP kinase activity(GO:0016909) |
| 0.0 | 0.2 | GO:0005502 | 11-cis retinal binding(GO:0005502) |
| 0.0 | 0.9 | GO:0051537 | 2 iron, 2 sulfur cluster binding(GO:0051537) |
| 0.0 | 0.8 | GO:0016832 | aldehyde-lyase activity(GO:0016832) |
| 0.0 | 0.2 | GO:0004376 | glycolipid mannosyltransferase activity(GO:0004376) |
| 0.0 | 0.3 | GO:0070679 | inositol 1,4,5 trisphosphate binding(GO:0070679) |
| 0.0 | 0.4 | GO:0004972 | NMDA glutamate receptor activity(GO:0004972) |
| 0.0 | 1.0 | GO:0005184 | neuropeptide hormone activity(GO:0005184) |
| 0.0 | 0.6 | GO:0004993 | G-protein coupled serotonin receptor activity(GO:0004993) |
| 0.0 | 0.4 | GO:0022821 | potassium ion antiporter activity(GO:0022821) |
| 0.0 | 0.2 | GO:0015450 | P-P-bond-hydrolysis-driven protein transmembrane transporter activity(GO:0015450) |
| 0.0 | 0.9 | GO:0005041 | low-density lipoprotein receptor activity(GO:0005041) |
| 0.0 | 0.4 | GO:0016423 | tRNA (guanine) methyltransferase activity(GO:0016423) |
| 0.0 | 0.6 | GO:0000062 | fatty-acyl-CoA binding(GO:0000062) |
| 0.0 | 3.5 | GO:0004867 | serine-type endopeptidase inhibitor activity(GO:0004867) |
| 0.0 | 0.5 | GO:0001222 | transcription corepressor binding(GO:0001222) |
| 0.0 | 0.3 | GO:0035251 | UDP-glucosyltransferase activity(GO:0035251) |
| 0.0 | 1.2 | GO:0017075 | syntaxin-1 binding(GO:0017075) |
| 0.0 | 0.5 | GO:0017128 | phospholipid scramblase activity(GO:0017128) |
| 0.0 | 0.4 | GO:0061578 | Lys63-specific deubiquitinase activity(GO:0061578) |
| 0.0 | 0.7 | GO:0004364 | glutathione transferase activity(GO:0004364) |
| 0.0 | 0.2 | GO:0030280 | structural constituent of epidermis(GO:0030280) |
| 0.0 | 0.5 | GO:0004862 | cAMP-dependent protein kinase inhibitor activity(GO:0004862) |
| 0.0 | 0.6 | GO:0008190 | eukaryotic initiation factor 4E binding(GO:0008190) |
| 0.0 | 0.4 | GO:0015187 | glycine transmembrane transporter activity(GO:0015187) |
| 0.0 | 0.1 | GO:0031626 | beta-endorphin binding(GO:0031626) |
| 0.0 | 0.3 | GO:0022851 | GABA-gated chloride ion channel activity(GO:0022851) |
| 0.0 | 0.6 | GO:0000339 | RNA cap binding(GO:0000339) |
| 0.0 | 6.1 | GO:0004984 | olfactory receptor activity(GO:0004984) |
| 0.0 | 0.3 | GO:0036312 | phosphatidylinositol 3-kinase regulatory subunit binding(GO:0036312) |
| 0.0 | 0.1 | GO:0061649 | ubiquitinated histone binding(GO:0061649) |
| 0.0 | 0.5 | GO:0032266 | phosphatidylinositol-3-phosphate binding(GO:0032266) |
| 0.0 | 0.2 | GO:0003810 | protein-glutamine gamma-glutamyltransferase activity(GO:0003810) |
| 0.0 | 0.1 | GO:0008240 | tripeptidyl-peptidase activity(GO:0008240) |
| 0.0 | 2.4 | GO:0051082 | unfolded protein binding(GO:0051082) |
| 0.0 | 1.6 | GO:0019003 | GDP binding(GO:0019003) |
| 0.0 | 0.2 | GO:0001871 | pattern binding(GO:0001871) polysaccharide binding(GO:0030247) |
| 0.0 | 0.2 | GO:0008381 | mechanically-gated ion channel activity(GO:0008381) mechanically gated channel activity(GO:0022833) |
| 0.0 | 0.4 | GO:0000030 | mannosyltransferase activity(GO:0000030) |
| 0.0 | 0.2 | GO:1990247 | N6-methyladenosine-containing RNA binding(GO:1990247) |
| 0.0 | 0.3 | GO:0003680 | AT DNA binding(GO:0003680) |
| 0.0 | 0.9 | GO:0008137 | NADH dehydrogenase (ubiquinone) activity(GO:0008137) NADH dehydrogenase (quinone) activity(GO:0050136) |
| 0.0 | 0.2 | GO:0031697 | beta-1 adrenergic receptor binding(GO:0031697) |
| 0.0 | 1.9 | GO:0003777 | microtubule motor activity(GO:0003777) |
| 0.0 | 0.3 | GO:0042813 | Wnt-activated receptor activity(GO:0042813) |
| 0.0 | 0.3 | GO:0045028 | G-protein coupled nucleotide receptor activity(GO:0001608) G-protein coupled purinergic nucleotide receptor activity(GO:0045028) |
| 0.0 | 0.1 | GO:0051996 | farnesyl-diphosphate farnesyltransferase activity(GO:0004310) squalene synthase activity(GO:0051996) |
| 0.0 | 1.5 | GO:0098531 | RNA polymerase II transcription factor activity, ligand-activated sequence-specific DNA binding(GO:0004879) transcription factor activity, direct ligand regulated sequence-specific DNA binding(GO:0098531) |
| 0.0 | 0.3 | GO:0051959 | dynein light intermediate chain binding(GO:0051959) |
| 0.0 | 1.0 | GO:0005044 | scavenger receptor activity(GO:0005044) |
| 0.0 | 0.3 | GO:0051430 | corticotropin-releasing hormone receptor 1 binding(GO:0051430) |
| 0.0 | 0.5 | GO:0034237 | protein kinase A regulatory subunit binding(GO:0034237) |
| 0.0 | 0.1 | GO:0004983 | neuropeptide Y receptor activity(GO:0004983) |
| 0.0 | 0.1 | GO:0003720 | telomerase activity(GO:0003720) RNA-directed DNA polymerase activity(GO:0003964) |
| 0.0 | 0.1 | GO:0036402 | proteasome-activating ATPase activity(GO:0036402) |
| 0.0 | 0.2 | GO:0046703 | natural killer cell lectin-like receptor binding(GO:0046703) |
| 0.0 | 0.3 | GO:0097109 | neuroligin family protein binding(GO:0097109) |
Gene overrepresentation in curated gene sets: canonical pathways category:
| Log-likelihood per target | Total log-likelihood | Term | Description |
|---|---|---|---|
| 0.2 | 15.6 | PID UPA UPAR PATHWAY | Urokinase-type plasminogen activator (uPA) and uPAR-mediated signaling |
| 0.1 | 3.4 | PID ERBB NETWORK PATHWAY | ErbB receptor signaling network |
| 0.1 | 6.5 | PID HNF3B PATHWAY | FOXA2 and FOXA3 transcription factor networks |
| 0.0 | 3.1 | PID NCADHERIN PATHWAY | N-cadherin signaling events |
| 0.0 | 2.8 | PID RXR VDR PATHWAY | RXR and RAR heterodimerization with other nuclear receptor |
| 0.0 | 12.8 | NABA ECM REGULATORS | Genes encoding enzymes and their regulators involved in the remodeling of the extracellular matrix |
| 0.0 | 0.7 | PID BETA CATENIN DEG PATHWAY | Degradation of beta catenin |
| 0.0 | 2.7 | PID PS1 PATHWAY | Presenilin action in Notch and Wnt signaling |
| 0.0 | 1.5 | PID HDAC CLASSIII PATHWAY | Signaling events mediated by HDAC Class III |
| 0.0 | 0.8 | PID RANBP2 PATHWAY | Sumoylation by RanBP2 regulates transcriptional repression |
| 0.0 | 1.0 | PID CONE PATHWAY | Visual signal transduction: Cones |
| 0.0 | 1.0 | ST B CELL ANTIGEN RECEPTOR | B Cell Antigen Receptor |
| 0.0 | 1.2 | SA PTEN PATHWAY | PTEN is a tumor suppressor that dephosphorylates the lipid messenger phosphatidylinositol triphosphate. |
| 0.0 | 1.7 | ST DIFFERENTIATION PATHWAY IN PC12 CELLS | Differentiation Pathway in PC12 Cells; this is a specific case of PAC1 Receptor Pathway. |
| 0.0 | 1.0 | PID BMP PATHWAY | BMP receptor signaling |
| 0.0 | 1.5 | PID NETRIN PATHWAY | Netrin-mediated signaling events |
| 0.0 | 0.5 | PID RHODOPSIN PATHWAY | Visual signal transduction: Rods |
| 0.0 | 6.0 | NABA ECM AFFILIATED | Genes encoding proteins affiliated structurally or functionally to extracellular matrix proteins |
| 0.0 | 0.6 | ST WNT CA2 CYCLIC GMP PATHWAY | Wnt/Ca2+/cyclic GMP signaling. |
| 0.0 | 0.3 | PID PI3K PLC TRK PATHWAY | Trk receptor signaling mediated by PI3K and PLC-gamma |
| 0.0 | 0.3 | PID INSULIN GLUCOSE PATHWAY | Insulin-mediated glucose transport |
| 0.0 | 0.2 | PID IL5 PATHWAY | IL5-mediated signaling events |
| 0.0 | 1.0 | PID ERBB1 INTERNALIZATION PATHWAY | Internalization of ErbB1 |
| 0.0 | 0.9 | PID LKB1 PATHWAY | LKB1 signaling events |
| 0.0 | 2.0 | PID ERBB1 DOWNSTREAM PATHWAY | ErbB1 downstream signaling |
| 0.0 | 1.3 | PID CASPASE PATHWAY | Caspase cascade in apoptosis |
| 0.0 | 1.5 | PID CMYB PATHWAY | C-MYB transcription factor network |
Gene overrepresentation in curated gene sets: REACTOME pathways category:
| Log-likelihood per target | Total log-likelihood | Term | Description |
|---|---|---|---|
| 0.6 | 11.1 | REACTOME COMMON PATHWAY | Genes involved in Common Pathway |
| 0.4 | 4.8 | REACTOME GAMMA CARBOXYLATION TRANSPORT AND AMINO TERMINAL CLEAVAGE OF PROTEINS | Genes involved in Gamma-carboxylation, transport, and amino-terminal cleavage of proteins |
| 0.3 | 5.1 | REACTOME XENOBIOTICS | Genes involved in Xenobiotics |
| 0.3 | 4.6 | REACTOME RECYCLING OF BILE ACIDS AND SALTS | Genes involved in Recycling of bile acids and salts |
| 0.1 | 3.6 | REACTOME REGULATION OF INSULIN LIKE GROWTH FACTOR IGF ACTIVITY BY INSULIN LIKE GROWTH FACTOR BINDING PROTEINS IGFBPS | Genes involved in Regulation of Insulin-like Growth Factor (IGF) Activity by Insulin-like Growth Factor Binding Proteins (IGFBPs) |
| 0.1 | 2.6 | REACTOME CHYLOMICRON MEDIATED LIPID TRANSPORT | Genes involved in Chylomicron-mediated lipid transport |
| 0.1 | 0.7 | REACTOME CYTOSOLIC TRNA AMINOACYLATION | Genes involved in Cytosolic tRNA aminoacylation |
| 0.1 | 3.7 | REACTOME GLUTATHIONE CONJUGATION | Genes involved in Glutathione conjugation |
| 0.1 | 4.4 | REACTOME INTERACTION BETWEEN L1 AND ANKYRINS | Genes involved in Interaction between L1 and Ankyrins |
| 0.1 | 3.4 | REACTOME DOWNREGULATION OF ERBB2 ERBB3 SIGNALING | Genes involved in Downregulation of ERBB2:ERBB3 signaling |
| 0.1 | 2.0 | REACTOME GLUCURONIDATION | Genes involved in Glucuronidation |
| 0.1 | 0.7 | REACTOME SCF BETA TRCP MEDIATED DEGRADATION OF EMI1 | Genes involved in SCF-beta-TrCP mediated degradation of Emi1 |
| 0.1 | 0.8 | REACTOME ROLE OF SECOND MESSENGERS IN NETRIN1 SIGNALING | Genes involved in Role of second messengers in netrin-1 signaling |
| 0.1 | 2.5 | REACTOME REGULATION OF GENE EXPRESSION IN BETA CELLS | Genes involved in Regulation of gene expression in beta cells |
| 0.1 | 0.8 | REACTOME REGULATION OF IFNG SIGNALING | Genes involved in Regulation of IFNG signaling |
| 0.1 | 1.9 | REACTOME REGULATION OF IFNA SIGNALING | Genes involved in Regulation of IFNA signaling |
| 0.1 | 0.8 | REACTOME TRYPTOPHAN CATABOLISM | Genes involved in Tryptophan catabolism |
| 0.1 | 1.4 | REACTOME REGULATION OF COMPLEMENT CASCADE | Genes involved in Regulation of Complement cascade |
| 0.1 | 1.3 | REACTOME AMINE DERIVED HORMONES | Genes involved in Amine-derived hormones |
| 0.1 | 1.6 | REACTOME SYNTHESIS OF PIPS AT THE GOLGI MEMBRANE | Genes involved in Synthesis of PIPs at the Golgi membrane |
| 0.0 | 2.2 | REACTOME STEROID HORMONES | Genes involved in Steroid hormones |
| 0.0 | 2.5 | REACTOME CGMP EFFECTS | Genes involved in cGMP effects |
| 0.0 | 1.2 | REACTOME CITRIC ACID CYCLE TCA CYCLE | Genes involved in Citric acid cycle (TCA cycle) |
| 0.0 | 1.3 | REACTOME CYTOSOLIC SULFONATION OF SMALL MOLECULES | Genes involved in Cytosolic sulfonation of small molecules |
| 0.0 | 3.2 | REACTOME INWARDLY RECTIFYING K CHANNELS | Genes involved in Inwardly rectifying K+ channels |
| 0.0 | 12.0 | REACTOME METABOLISM OF AMINO ACIDS AND DERIVATIVES | Genes involved in Metabolism of amino acids and derivatives |
| 0.0 | 2.5 | REACTOME ADHERENS JUNCTIONS INTERACTIONS | Genes involved in Adherens junctions interactions |
| 0.0 | 2.0 | REACTOME CIRCADIAN REPRESSION OF EXPRESSION BY REV ERBA | Genes involved in Circadian Repression of Expression by REV-ERBA |
| 0.0 | 1.2 | REACTOME GAP JUNCTION DEGRADATION | Genes involved in Gap junction degradation |
| 0.0 | 1.3 | REACTOME CASPASE MEDIATED CLEAVAGE OF CYTOSKELETAL PROTEINS | Genes involved in Caspase-mediated cleavage of cytoskeletal proteins |
| 0.0 | 0.6 | REACTOME SYNTHESIS OF BILE ACIDS AND BILE SALTS VIA 7ALPHA HYDROXYCHOLESTEROL | Genes involved in Synthesis of bile acids and bile salts via 7alpha-hydroxycholesterol |
| 0.0 | 0.7 | REACTOME PURINE SALVAGE | Genes involved in Purine salvage |
| 0.0 | 0.3 | REACTOME TETRAHYDROBIOPTERIN BH4 SYNTHESIS RECYCLING SALVAGE AND REGULATION | Genes involved in Tetrahydrobiopterin (BH4) synthesis, recycling, salvage and regulation |
| 0.0 | 3.1 | REACTOME CLASS B 2 SECRETIN FAMILY RECEPTORS | Genes involved in Class B/2 (Secretin family receptors) |
| 0.0 | 0.7 | REACTOME N GLYCAN ANTENNAE ELONGATION | Genes involved in N-Glycan antennae elongation |
| 0.0 | 0.6 | REACTOME GAP JUNCTION ASSEMBLY | Genes involved in Gap junction assembly |
| 0.0 | 0.6 | REACTOME IL 7 SIGNALING | Genes involved in Interleukin-7 signaling |
| 0.0 | 1.1 | REACTOME EFFECTS OF PIP2 HYDROLYSIS | Genes involved in Effects of PIP2 hydrolysis |
| 0.0 | 0.3 | REACTOME ROLE OF DCC IN REGULATING APOPTOSIS | Genes involved in Role of DCC in regulating apoptosis |
| 0.0 | 1.0 | REACTOME CELL CELL JUNCTION ORGANIZATION | Genes involved in Cell-cell junction organization |
| 0.0 | 5.6 | REACTOME OLFACTORY SIGNALING PATHWAY | Genes involved in Olfactory Signaling Pathway |
| 0.0 | 2.4 | REACTOME ANTIVIRAL MECHANISM BY IFN STIMULATED GENES | Genes involved in Antiviral mechanism by IFN-stimulated genes |
| 0.0 | 0.6 | REACTOME GLYCOGEN BREAKDOWN GLYCOGENOLYSIS | Genes involved in Glycogen breakdown (glycogenolysis) |
| 0.0 | 1.2 | REACTOME AMINO ACID TRANSPORT ACROSS THE PLASMA MEMBRANE | Genes involved in Amino acid transport across the plasma membrane |
| 0.0 | 1.9 | REACTOME TRANSPORT OF INORGANIC CATIONS ANIONS AND AMINO ACIDS OLIGOPEPTIDES | Genes involved in Transport of inorganic cations/anions and amino acids/oligopeptides |
| 0.0 | 0.5 | REACTOME RAS ACTIVATION UOPN CA2 INFUX THROUGH NMDA RECEPTOR | Genes involved in Ras activation uopn Ca2+ infux through NMDA receptor |
| 0.0 | 2.2 | REACTOME RESPONSE TO ELEVATED PLATELET CYTOSOLIC CA2 | Genes involved in Response to elevated platelet cytosolic Ca2+ |
| 0.0 | 0.2 | REACTOME OPSINS | Genes involved in Opsins |
| 0.0 | 0.2 | REACTOME ER PHAGOSOME PATHWAY | Genes involved in ER-Phagosome pathway |
| 0.0 | 1.0 | REACTOME METABOLISM OF VITAMINS AND COFACTORS | Genes involved in Metabolism of vitamins and cofactors |
| 0.0 | 0.4 | REACTOME JNK C JUN KINASES PHOSPHORYLATION AND ACTIVATION MEDIATED BY ACTIVATED HUMAN TAK1 | Genes involved in JNK (c-Jun kinases) phosphorylation and activation mediated by activated human TAK1 |