Project
Illumina Body Map 2 (GSE30611)
Navigation
Downloads
Results for CDX2
Z-value: 0.61
Motif logo
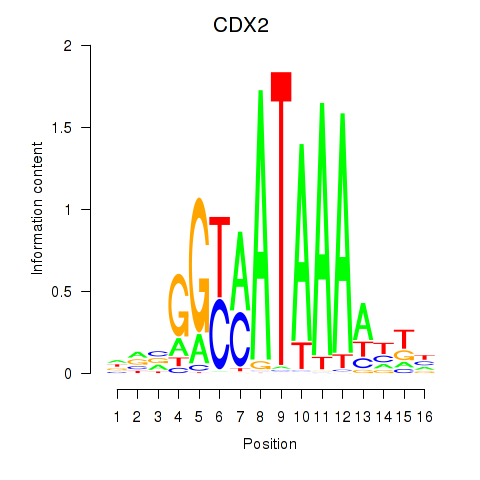
Transcription factors associated with CDX2
| Gene Symbol | Gene ID | Gene Info |
|---|---|---|
|
CDX2
|
ENSG00000165556.10 | caudal type homeobox 2 |
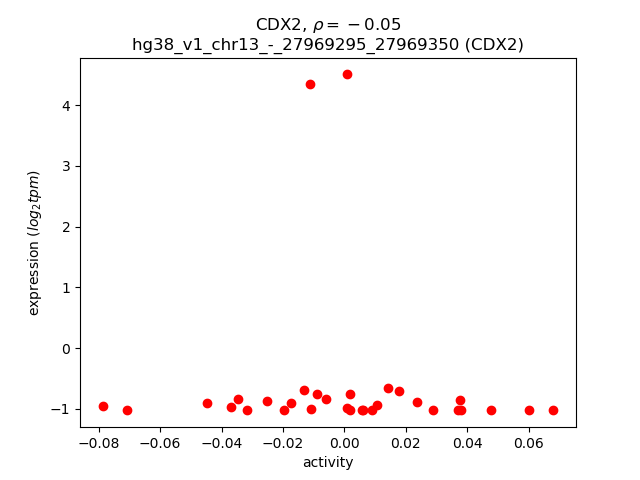
Activity-expression correlation:
| Gene | Promoter | Pearson corr. coef. | P-value | Plot |
|---|---|---|---|---|
| CDX2 | hg38_v1_chr13_-_27969295_27969350 | -0.05 | 7.9e-01 | Click! |
Activity profile of CDX2 motif
Sorted Z-values of CDX2 motif
| Promoter | Log-likelihood | Transcript | Gene | Gene Info |
|---|---|---|---|---|
| chr4_-_71784046 | 2.23 |
ENST00000513476.5
ENST00000273951.13 |
GC
|
GC vitamin D binding protein |
| chr16_+_66579448 | 1.98 |
ENST00000379486.6
ENST00000268595.3 |
CMTM2
|
CKLF like MARVEL transmembrane domain containing 2 |
| chr16_+_72056153 | 1.67 |
ENST00000576168.6
ENST00000567185.7 ENST00000567612.2 |
HP
|
haptoglobin |
| chr9_-_101442403 | 1.60 |
ENST00000648758.1
|
ALDOB
|
aldolase, fructose-bisphosphate B |
| chr4_+_154563003 | 1.43 |
ENST00000302068.9
ENST00000509493.1 |
FGB
|
fibrinogen beta chain |
| chr7_+_80646305 | 1.39 |
ENST00000426978.5
ENST00000432207.5 |
CD36
|
CD36 molecule |
| chr18_+_3252267 | 1.34 |
ENST00000536605.1
ENST00000580887.5 |
MYL12A
|
myosin light chain 12A |
| chr7_+_80646436 | 1.28 |
ENST00000419819.2
|
CD36
|
CD36 molecule |
| chr7_+_80646347 | 1.15 |
ENST00000413265.5
|
CD36
|
CD36 molecule |
| chr22_+_32059165 | 1.06 |
ENST00000543737.2
|
SLC5A1
|
solute carrier family 5 member 1 |
| chr1_+_154429315 | 1.04 |
ENST00000476006.5
|
IL6R
|
interleukin 6 receptor |
| chr7_+_129144691 | 0.99 |
ENST00000486685.3
|
TSPAN33
|
tetraspanin 33 |
| chr20_-_7940444 | 0.94 |
ENST00000378789.4
|
HAO1
|
hydroxyacid oxidase 1 |
| chr1_+_192158448 | 0.93 |
ENST00000367460.4
|
RGS18
|
regulator of G protein signaling 18 |
| chr18_+_3252208 | 0.91 |
ENST00000578562.6
|
MYL12A
|
myosin light chain 12A |
| chr3_+_125969172 | 0.90 |
ENST00000514116.6
ENST00000513830.5 |
ROPN1B
|
rhophilin associated tail protein 1B |
| chr17_+_47209338 | 0.89 |
ENST00000393450.5
|
MYL4
|
myosin light chain 4 |
| chr17_+_59940908 | 0.87 |
ENST00000591035.1
|
ENSG00000267318.1
|
novel protein |
| chr1_+_74235377 | 0.86 |
ENST00000326637.8
|
TNNI3K
|
TNNI3 interacting kinase |
| chr19_+_926001 | 0.84 |
ENST00000263620.8
|
ARID3A
|
AT-rich interaction domain 3A |
| chr11_+_111245725 | 0.82 |
ENST00000280325.7
|
C11orf53
|
chromosome 11 open reading frame 53 |
| chr6_+_25754699 | 0.82 |
ENST00000439485.6
ENST00000377905.9 |
SLC17A4
|
solute carrier family 17 member 4 |
| chr11_-_93537903 | 0.79 |
ENST00000527149.5
|
SMCO4
|
single-pass membrane protein with coiled-coil domains 4 |
| chr3_-_123991352 | 0.79 |
ENST00000184183.8
|
ROPN1
|
rhophilin associated tail protein 1 |
| chr2_-_210303608 | 0.76 |
ENST00000341685.8
|
MYL1
|
myosin light chain 1 |
| chr17_-_48613468 | 0.76 |
ENST00000498634.2
|
HOXB8
|
homeobox B8 |
| chr1_+_151766655 | 0.76 |
ENST00000400999.7
|
OAZ3
|
ornithine decarboxylase antizyme 3 |
| chr19_+_47994625 | 0.75 |
ENST00000339841.7
|
ELSPBP1
|
epididymal sperm binding protein 1 |
| chr19_+_47994696 | 0.74 |
ENST00000596043.5
ENST00000597519.5 |
ELSPBP1
|
epididymal sperm binding protein 1 |
| chr12_+_54284258 | 0.73 |
ENST00000677666.1
|
HNRNPA1
|
heterogeneous nuclear ribonucleoprotein A1 |
| chr16_+_68085861 | 0.71 |
ENST00000570212.5
ENST00000562926.5 |
NFATC3
|
nuclear factor of activated T cells 3 |
| chrX_-_15600953 | 0.71 |
ENST00000679212.1
ENST00000679278.1 ENST00000678046.1 ENST00000252519.8 |
ACE2
|
angiotensin I converting enzyme 2 |
| chr3_+_63967738 | 0.67 |
ENST00000484332.1
|
ATXN7
|
ataxin 7 |
| chr3_-_123992046 | 0.67 |
ENST00000467907.5
ENST00000459660.5 ENST00000495093.1 ENST00000460743.5 ENST00000405845.7 ENST00000484329.1 ENST00000479867.1 ENST00000496145.5 |
ROPN1
|
rhophilin associated tail protein 1 |
| chr6_+_111087495 | 0.66 |
ENST00000612036.4
ENST00000368851.10 |
SLC16A10
|
solute carrier family 16 member 10 |
| chrX_+_106693751 | 0.66 |
ENST00000418562.5
|
RNF128
|
ring finger protein 128 |
| chr15_-_55249029 | 0.66 |
ENST00000566877.5
|
RAB27A
|
RAB27A, member RAS oncogene family |
| chr17_+_47209375 | 0.65 |
ENST00000572303.1
|
MYL4
|
myosin light chain 4 |
| chr13_+_108269880 | 0.64 |
ENST00000542136.1
|
TNFSF13B
|
TNF superfamily member 13b |
| chr19_+_14031746 | 0.63 |
ENST00000263379.4
|
IL27RA
|
interleukin 27 receptor subunit alpha |
| chr20_+_44355692 | 0.62 |
ENST00000316673.8
ENST00000609795.5 ENST00000457232.5 ENST00000609262.5 |
HNF4A
|
hepatocyte nuclear factor 4 alpha |
| chr1_+_241532121 | 0.61 |
ENST00000366558.7
|
KMO
|
kynurenine 3-monooxygenase |
| chr12_-_112006024 | 0.61 |
ENST00000550800.6
ENST00000550037.5 ENST00000549425.5 |
TMEM116
|
transmembrane protein 116 |
| chr7_-_130441136 | 0.61 |
ENST00000675596.1
ENST00000676312.1 |
CEP41
|
centrosomal protein 41 |
| chr17_-_40799939 | 0.61 |
ENST00000306658.8
|
KRT28
|
keratin 28 |
| chr12_+_45292674 | 0.60 |
ENST00000679426.1
ENST00000441606.2 |
ANO6
|
anoctamin 6 |
| chrM_+_10464 | 0.59 |
ENST00000361335.1
|
MT-ND4L
|
mitochondrially encoded NADH:ubiquinone oxidoreductase core subunit 4L |
| chr14_+_21825453 | 0.59 |
ENST00000390432.2
|
TRAV10
|
T cell receptor alpha variable 10 |
| chr10_+_92691813 | 0.59 |
ENST00000472590.6
|
HHEX
|
hematopoietically expressed homeobox |
| chr3_+_125969214 | 0.56 |
ENST00000508088.1
|
ROPN1B
|
rhophilin associated tail protein 1B |
| chr17_-_41489907 | 0.56 |
ENST00000328119.11
|
KRT36
|
keratin 36 |
| chr12_-_112005963 | 0.56 |
ENST00000550233.1
|
TMEM116
|
transmembrane protein 116 |
| chr1_+_51102238 | 0.56 |
ENST00000467127.5
|
C1orf185
|
chromosome 1 open reading frame 185 |
| chr3_+_125969152 | 0.56 |
ENST00000251776.8
ENST00000504401.1 |
ROPN1B
|
rhophilin associated tail protein 1B |
| chr3_+_172039556 | 0.55 |
ENST00000415807.7
ENST00000421757.5 |
FNDC3B
|
fibronectin type III domain containing 3B |
| chr9_-_130939205 | 0.54 |
ENST00000372338.9
|
FIBCD1
|
fibrinogen C domain containing 1 |
| chr3_-_51779187 | 0.54 |
ENST00000398780.5
ENST00000668964.1 ENST00000667863.2 ENST00000647442.1 |
IQCF6
|
IQ motif containing F6 |
| chr1_+_51102221 | 0.54 |
ENST00000648827.1
ENST00000371759.7 |
C1orf185
|
chromosome 1 open reading frame 185 |
| chr4_+_168711416 | 0.54 |
ENST00000649826.1
|
PALLD
|
palladin, cytoskeletal associated protein |
| chr2_+_149118169 | 0.54 |
ENST00000450639.5
|
LYPD6B
|
LY6/PLAUR domain containing 6B |
| chr3_-_172523423 | 0.53 |
ENST00000241261.7
|
TNFSF10
|
TNF superfamily member 10 |
| chr12_-_52434363 | 0.53 |
ENST00000252245.6
|
KRT75
|
keratin 75 |
| chr4_-_39977836 | 0.53 |
ENST00000303538.13
ENST00000503396.5 |
PDS5A
|
PDS5 cohesin associated factor A |
| chr6_+_89081787 | 0.53 |
ENST00000354922.3
|
PNRC1
|
proline rich nuclear receptor coactivator 1 |
| chr14_-_60486021 | 0.53 |
ENST00000555476.5
ENST00000321731.8 |
C14orf39
|
chromosome 14 open reading frame 39 |
| chr7_-_80512041 | 0.52 |
ENST00000398291.4
|
GNAT3
|
G protein subunit alpha transducin 3 |
| chr4_+_70397931 | 0.52 |
ENST00000399575.7
|
OPRPN
|
opiorphin prepropeptide |
| chr12_+_1691011 | 0.52 |
ENST00000357103.5
|
ADIPOR2
|
adiponectin receptor 2 |
| chr8_-_20183127 | 0.51 |
ENST00000276373.10
ENST00000519026.5 ENST00000440926.3 ENST00000437980.3 |
SLC18A1
|
solute carrier family 18 member A1 |
| chr7_+_142111739 | 0.51 |
ENST00000550469.6
ENST00000477922.3 |
MGAM2
|
maltase-glucoamylase 2 (putative) |
| chr17_-_48728705 | 0.49 |
ENST00000290295.8
|
HOXB13
|
homeobox B13 |
| chr3_-_46812558 | 0.49 |
ENST00000641183.1
ENST00000460241.2 |
ENSG00000284672.1
ENSG00000206549.13
|
novel transcript novel protein identical to PRSS50 |
| chr3_-_172523460 | 0.49 |
ENST00000420541.6
|
TNFSF10
|
TNF superfamily member 10 |
| chr20_-_31406207 | 0.48 |
ENST00000376314.3
|
DEFB121
|
defensin beta 121 |
| chr1_-_53889766 | 0.48 |
ENST00000371399.5
ENST00000072644.7 |
YIPF1
|
Yip1 domain family member 1 |
| chr12_+_14408482 | 0.48 |
ENST00000541056.1
|
ATF7IP
|
activating transcription factor 7 interacting protein |
| chr10_+_102226293 | 0.48 |
ENST00000370005.4
|
ELOVL3
|
ELOVL fatty acid elongase 3 |
| chr7_-_143408848 | 0.47 |
ENST00000275815.4
|
EPHA1
|
EPH receptor A1 |
| chr2_-_169031317 | 0.47 |
ENST00000650372.1
|
ABCB11
|
ATP binding cassette subfamily B member 11 |
| chr16_-_66873233 | 0.47 |
ENST00000561579.6
|
NAE1
|
NEDD8 activating enzyme E1 subunit 1 |
| chr2_-_51032151 | 0.46 |
ENST00000628515.2
|
NRXN1
|
neurexin 1 |
| chr14_-_56805648 | 0.44 |
ENST00000554788.5
ENST00000554845.1 ENST00000408990.8 |
OTX2
|
orthodenticle homeobox 2 |
| chr6_+_143450797 | 0.44 |
ENST00000367591.5
ENST00000367592.5 |
PEX3
|
peroxisomal biogenesis factor 3 |
| chr3_-_18438678 | 0.43 |
ENST00000414509.5
|
SATB1
|
SATB homeobox 1 |
| chr17_-_29761415 | 0.43 |
ENST00000649863.1
|
SSH2
|
slingshot protein phosphatase 2 |
| chr9_-_83956677 | 0.43 |
ENST00000376344.8
|
C9orf64
|
chromosome 9 open reading frame 64 |
| chr3_-_185821092 | 0.42 |
ENST00000421047.3
|
IGF2BP2
|
insulin like growth factor 2 mRNA binding protein 2 |
| chr11_+_60378494 | 0.42 |
ENST00000534016.5
|
MS4A7
|
membrane spanning 4-domains A7 |
| chr7_+_130344810 | 0.42 |
ENST00000497503.5
ENST00000463587.5 ENST00000461828.5 ENST00000474905.6 ENST00000494311.1 ENST00000466363.6 |
CPA5
|
carboxypeptidase A5 |
| chr11_+_60280531 | 0.39 |
ENST00000532114.6
|
MS4A4A
|
membrane spanning 4-domains A4A |
| chr10_-_127892930 | 0.39 |
ENST00000368671.4
|
CLRN3
|
clarin 3 |
| chr15_+_40594001 | 0.38 |
ENST00000346991.9
ENST00000528975.5 |
KNL1
|
kinetochore scaffold 1 |
| chr16_-_21652598 | 0.38 |
ENST00000569602.1
ENST00000268389.6 |
IGSF6
|
immunoglobulin superfamily member 6 |
| chr16_-_1884231 | 0.36 |
ENST00000563416.3
ENST00000633813.1 ENST00000470044.5 |
LINC00254
MEIOB
|
long intergenic non-protein coding RNA 254 meiosis specific with OB-fold |
| chr3_-_18438767 | 0.36 |
ENST00000454909.6
|
SATB1
|
SATB homeobox 1 |
| chr6_-_166168645 | 0.36 |
ENST00000461348.2
|
TBXT
|
T-box transcription factor T |
| chr4_-_139301204 | 0.36 |
ENST00000505036.5
ENST00000539002.5 ENST00000544855.5 |
NDUFC1
|
NADH:ubiquinone oxidoreductase subunit C1 |
| chr8_+_75539862 | 0.36 |
ENST00000396423.4
|
HNF4G
|
hepatocyte nuclear factor 4 gamma |
| chr4_+_186227501 | 0.36 |
ENST00000446598.6
ENST00000264690.11 ENST00000513864.2 |
KLKB1
|
kallikrein B1 |
| chr12_+_32534287 | 0.35 |
ENST00000525053.6
|
FGD4
|
FYVE, RhoGEF and PH domain containing 4 |
| chr11_+_60378475 | 0.35 |
ENST00000358246.5
|
MS4A7
|
membrane spanning 4-domains A7 |
| chr6_-_166168612 | 0.35 |
ENST00000296946.6
|
TBXT
|
T-box transcription factor T |
| chr16_+_56748206 | 0.35 |
ENST00000566678.1
|
NUP93
|
nucleoporin 93 |
| chr3_+_57890011 | 0.35 |
ENST00000494088.6
ENST00000438794.5 |
SLMAP
|
sarcolemma associated protein |
| chrX_+_106693838 | 0.35 |
ENST00000324342.7
|
RNF128
|
ring finger protein 128 |
| chr20_+_31514410 | 0.35 |
ENST00000335574.10
ENST00000340852.9 ENST00000398174.9 ENST00000466766.2 ENST00000498035.5 ENST00000344042.5 |
HM13
|
histocompatibility minor 13 |
| chr10_+_46286997 | 0.34 |
ENST00000620264.5
|
ANTXRL
|
ANTXR like |
| chr20_+_4721901 | 0.34 |
ENST00000305817.3
|
PRND
|
prion like protein doppel |
| chr4_+_70518583 | 0.34 |
ENST00000504451.1
|
AMTN
|
amelotin |
| chr12_-_112005999 | 0.34 |
ENST00000546962.5
|
TMEM116
|
transmembrane protein 116 |
| chr8_-_20183090 | 0.34 |
ENST00000265808.11
ENST00000522513.5 |
SLC18A1
|
solute carrier family 18 member A1 |
| chr8_+_75539893 | 0.34 |
ENST00000674002.1
|
HNF4G
|
hepatocyte nuclear factor 4 gamma |
| chr3_-_108953870 | 0.34 |
ENST00000261047.8
|
GUCA1C
|
guanylate cyclase activator 1C |
| chr9_+_131190119 | 0.33 |
ENST00000483497.6
|
NUP214
|
nucleoporin 214 |
| chr6_-_27814757 | 0.33 |
ENST00000333151.5
|
H2AC14
|
H2A clustered histone 14 |
| chr1_+_26472405 | 0.33 |
ENST00000361427.6
|
HMGN2
|
high mobility group nucleosomal binding domain 2 |
| chr7_+_64249118 | 0.33 |
ENST00000255746.7
|
ZNF679
|
zinc finger protein 679 |
| chr5_-_36001006 | 0.33 |
ENST00000625798.2
|
UGT3A1
|
UDP glycosyltransferase family 3 member A1 |
| chr9_+_120792403 | 0.33 |
ENST00000464488.3
|
B3GALT9
|
beta-1,3-galactosyltransferase 9 |
| chr11_+_60280577 | 0.32 |
ENST00000679988.1
|
MS4A4A
|
membrane spanning 4-domains A4A |
| chr1_+_178725147 | 0.31 |
ENST00000367634.6
|
RALGPS2
|
Ral GEF with PH domain and SH3 binding motif 2 |
| chr6_-_22302797 | 0.31 |
ENST00000651757.1
|
PRL
|
prolactin |
| chr4_+_70518563 | 0.31 |
ENST00000339336.9
|
AMTN
|
amelotin |
| chr9_+_97412062 | 0.31 |
ENST00000355295.5
|
TDRD7
|
tudor domain containing 7 |
| chr6_+_133953210 | 0.30 |
ENST00000367869.1
ENST00000237264.9 ENST00000674115.1 |
TBPL1
ENSG00000288529.1
|
TATA-box binding protein like 1 novel protein |
| chr6_-_166168700 | 0.30 |
ENST00000366871.7
|
TBXT
|
T-box transcription factor T |
| chr6_+_104940866 | 0.30 |
ENST00000637759.1
|
LIN28B
|
lin-28 homolog B |
| chr13_+_108269629 | 0.30 |
ENST00000430559.5
ENST00000375887.9 |
TNFSF13B
|
TNF superfamily member 13b |
| chr4_+_145680146 | 0.30 |
ENST00000438731.7
|
C4orf51
|
chromosome 4 open reading frame 51 |
| chr1_+_26472459 | 0.30 |
ENST00000619352.4
|
HMGN2
|
high mobility group nucleosomal binding domain 2 |
| chr5_+_148221641 | 0.29 |
ENST00000638059.1
|
MARCOL
|
MARCO like |
| chr4_-_77076288 | 0.29 |
ENST00000507788.2
|
CCNI
|
cyclin I |
| chr1_-_237004440 | 0.29 |
ENST00000464121.3
|
MT1HL1
|
metallothionein 1H like 1 |
| chr11_+_112176364 | 0.29 |
ENST00000526088.5
ENST00000532593.5 ENST00000531169.5 |
BCO2
|
beta-carotene oxygenase 2 |
| chr12_-_10810168 | 0.29 |
ENST00000240691.4
|
TAS2R9
|
taste 2 receptor member 9 |
| chrX_-_15601077 | 0.27 |
ENST00000680121.1
|
ACE2
|
angiotensin I converting enzyme 2 |
| chr3_-_108953762 | 0.26 |
ENST00000393963.7
ENST00000471108.1 |
GUCA1C
|
guanylate cyclase activator 1C |
| chr7_+_70766172 | 0.26 |
ENST00000644949.1
|
AUTS2
|
activator of transcription and developmental regulator AUTS2 |
| chr11_-_5783355 | 0.26 |
ENST00000641181.1
|
OR52N5
|
olfactory receptor family 52 subfamily N member 5 |
| chr17_-_29761390 | 0.26 |
ENST00000324677.12
|
SSH2
|
slingshot protein phosphatase 2 |
| chr6_-_22302826 | 0.26 |
ENST00000651245.1
|
PRL
|
prolactin |
| chr2_+_37950432 | 0.25 |
ENST00000407257.5
ENST00000417700.6 ENST00000234195.7 ENST00000442857.5 |
RMDN2
|
regulator of microtubule dynamics 2 |
| chr4_-_155866277 | 0.25 |
ENST00000537611.3
|
ASIC5
|
acid sensing ion channel subunit family member 5 |
| chr1_-_28058087 | 0.25 |
ENST00000373864.5
|
EYA3
|
EYA transcriptional coactivator and phosphatase 3 |
| chr7_-_47539591 | 0.25 |
ENST00000442536.6
ENST00000458317.6 |
TNS3
|
tensin 3 |
| chr11_-_118342691 | 0.25 |
ENST00000300692.9
|
CD3D
|
CD3d molecule |
| chr5_+_72848161 | 0.24 |
ENST00000506351.6
|
TNPO1
|
transportin 1 |
| chr7_-_93148345 | 0.24 |
ENST00000437805.5
ENST00000446959.5 ENST00000439952.5 ENST00000414791.5 ENST00000446033.1 ENST00000411955.5 ENST00000318238.9 |
SAMD9L
|
sterile alpha motif domain containing 9 like |
| chrX_-_13319952 | 0.24 |
ENST00000622204.1
ENST00000380622.5 |
ATXN3L
|
ataxin 3 like |
| chr19_+_20923222 | 0.24 |
ENST00000597314.5
ENST00000328178.13 ENST00000601924.5 |
ZNF85
|
zinc finger protein 85 |
| chr7_-_144410227 | 0.24 |
ENST00000467773.1
ENST00000483238.5 |
NOBOX
|
NOBOX oogenesis homeobox |
| chr1_+_53014926 | 0.23 |
ENST00000430330.6
ENST00000408941.7 ENST00000478274.6 ENST00000484100.5 ENST00000435345.6 ENST00000488965.1 |
SCP2
|
sterol carrier protein 2 |
| chr19_-_45424364 | 0.23 |
ENST00000589165.5
|
ERCC1
|
ERCC excision repair 1, endonuclease non-catalytic subunit |
| chr10_+_46286345 | 0.23 |
ENST00000619553.4
|
ANTXRL
|
ANTXR like |
| chr14_+_19930917 | 0.23 |
ENST00000641172.1
ENST00000641429.1 |
OR4K1
|
olfactory receptor family 4 subfamily K member 1 |
| chr2_+_218782138 | 0.23 |
ENST00000258415.9
|
CYP27A1
|
cytochrome P450 family 27 subfamily A member 1 |
| chr19_+_48393657 | 0.23 |
ENST00000263269.4
|
GRIN2D
|
glutamate ionotropic receptor NMDA type subunit 2D |
| chr5_-_148654130 | 0.23 |
ENST00000360693.7
|
HTR4
|
5-hydroxytryptamine receptor 4 |
| chr6_-_138512493 | 0.23 |
ENST00000533765.1
|
NHSL1
|
NHS like 1 |
| chrM_+_10055 | 0.22 |
ENST00000361227.2
|
MT-ND3
|
mitochondrially encoded NADH:ubiquinone oxidoreductase core subunit 3 |
| chr3_-_13022546 | 0.22 |
ENST00000646269.1
|
IQSEC1
|
IQ motif and Sec7 domain ArfGEF 1 |
| chr3_+_112990956 | 0.21 |
ENST00000383678.8
ENST00000383677.7 ENST00000619116.4 |
GTPBP8
|
GTP binding protein 8 (putative) |
| chr1_+_248038172 | 0.20 |
ENST00000366479.4
|
OR2L2
|
olfactory receptor family 2 subfamily L member 2 |
| chr1_+_12464912 | 0.20 |
ENST00000543766.2
|
VPS13D
|
vacuolar protein sorting 13 homolog D |
| chr4_-_68670648 | 0.19 |
ENST00000338206.6
|
UGT2B15
|
UDP glucuronosyltransferase family 2 member B15 |
| chr10_-_113854368 | 0.19 |
ENST00000369305.1
|
DCLRE1A
|
DNA cross-link repair 1A |
| chr6_+_143126183 | 0.19 |
ENST00000458219.1
|
AIG1
|
androgen induced 1 |
| chr1_+_65419 | 0.19 |
ENST00000641515.2
|
OR4F5
|
olfactory receptor family 4 subfamily F member 5 |
| chr3_-_9880250 | 0.18 |
ENST00000423850.5
ENST00000336832.7 ENST00000675828.1 ENST00000618572.4 ENST00000455015.6 |
CIDEC
|
cell death inducing DFFA like effector c |
| chr5_+_122129597 | 0.18 |
ENST00000514925.1
|
ENSG00000250803.6
|
novel zinc finger protein |
| chr11_+_22666604 | 0.17 |
ENST00000454584.6
|
GAS2
|
growth arrest specific 2 |
| chr14_+_56117702 | 0.17 |
ENST00000559044.5
|
PELI2
|
pellino E3 ubiquitin protein ligase family member 2 |
| chr4_-_76023489 | 0.17 |
ENST00000306602.3
|
CXCL10
|
C-X-C motif chemokine ligand 10 |
| chr6_+_47698538 | 0.17 |
ENST00000327753.7
|
ADGRF4
|
adhesion G protein-coupled receptor F4 |
| chr14_+_51989609 | 0.17 |
ENST00000556760.5
|
RTRAF
|
RNA transcription, translation and transport factor |
| chr6_+_47698574 | 0.17 |
ENST00000283303.3
|
ADGRF4
|
adhesion G protein-coupled receptor F4 |
| chr12_-_76486061 | 0.17 |
ENST00000548341.5
|
OSBPL8
|
oxysterol binding protein like 8 |
| chr2_-_240821363 | 0.16 |
ENST00000675940.1
|
KIF1A
|
kinesin family member 1A |
| chr20_+_2295994 | 0.16 |
ENST00000381458.6
|
TGM3
|
transglutaminase 3 |
| chr8_+_7768977 | 0.16 |
ENST00000533716.2
|
FAM90A10P
|
family with sequence similarity 90 member A10, pseudogene |
| chr2_+_32165841 | 0.16 |
ENST00000357055.7
ENST00000435660.5 ENST00000440718.5 ENST00000379343.6 ENST00000282587.9 ENST00000406369.2 |
SLC30A6
|
solute carrier family 30 member 6 |
| chr12_-_21774688 | 0.16 |
ENST00000240662.3
|
KCNJ8
|
potassium inwardly rectifying channel subfamily J member 8 |
| chr1_+_220094086 | 0.16 |
ENST00000366922.3
|
IARS2
|
isoleucyl-tRNA synthetase 2, mitochondrial |
| chr8_+_7730739 | 0.16 |
ENST00000648174.1
|
FAM90A16P
|
family with sequence similarity 90 member A16, pseudogene |
| chr7_+_64207090 | 0.15 |
ENST00000429565.4
|
ZNF735
|
zinc finger protein 735 |
| chr1_+_151762899 | 0.15 |
ENST00000635322.1
ENST00000321531.10 |
OAZ3
|
ornithine decarboxylase antizyme 3 |
| chr4_-_168318770 | 0.15 |
ENST00000680771.1
ENST00000514995.2 |
DDX60
|
DExD/H-box helicase 60 |
| chr11_+_63838902 | 0.15 |
ENST00000377810.8
|
MARK2
|
microtubule affinity regulating kinase 2 |
| chr17_-_82840010 | 0.15 |
ENST00000269394.4
ENST00000572562.1 |
ZNF750
|
zinc finger protein 750 |
| chr10_+_19048788 | 0.15 |
ENST00000454679.7
|
MALRD1
|
MAM and LDL receptor class A domain containing 1 |
| chr16_+_4474690 | 0.14 |
ENST00000575051.5
ENST00000406590.6 |
HMOX2
|
heme oxygenase 2 |
| chr6_+_27815010 | 0.14 |
ENST00000621112.2
|
H2BC14
|
H2B clustered histone 14 |
| chr1_+_34176900 | 0.14 |
ENST00000488417.2
|
C1orf94
|
chromosome 1 open reading frame 94 |
| chr3_+_148827800 | 0.14 |
ENST00000282957.9
ENST00000468341.1 |
CPB1
|
carboxypeptidase B1 |
| chr4_+_70383123 | 0.14 |
ENST00000304915.8
|
SMR3B
|
submaxillary gland androgen regulated protein 3B |
| chr4_-_163613505 | 0.14 |
ENST00000339875.9
|
MARCHF1
|
membrane associated ring-CH-type finger 1 |
| chr10_+_113854610 | 0.14 |
ENST00000369301.3
|
NHLRC2
|
NHL repeat containing 2 |
| chr8_+_12104389 | 0.13 |
ENST00000400085.7
|
ZNF705D
|
zinc finger protein 705D |
| chr10_+_84173793 | 0.13 |
ENST00000372126.4
|
C10orf99
|
chromosome 10 open reading frame 99 |
| chr9_-_83063135 | 0.13 |
ENST00000376447.4
|
RASEF
|
RAS and EF-hand domain containing |
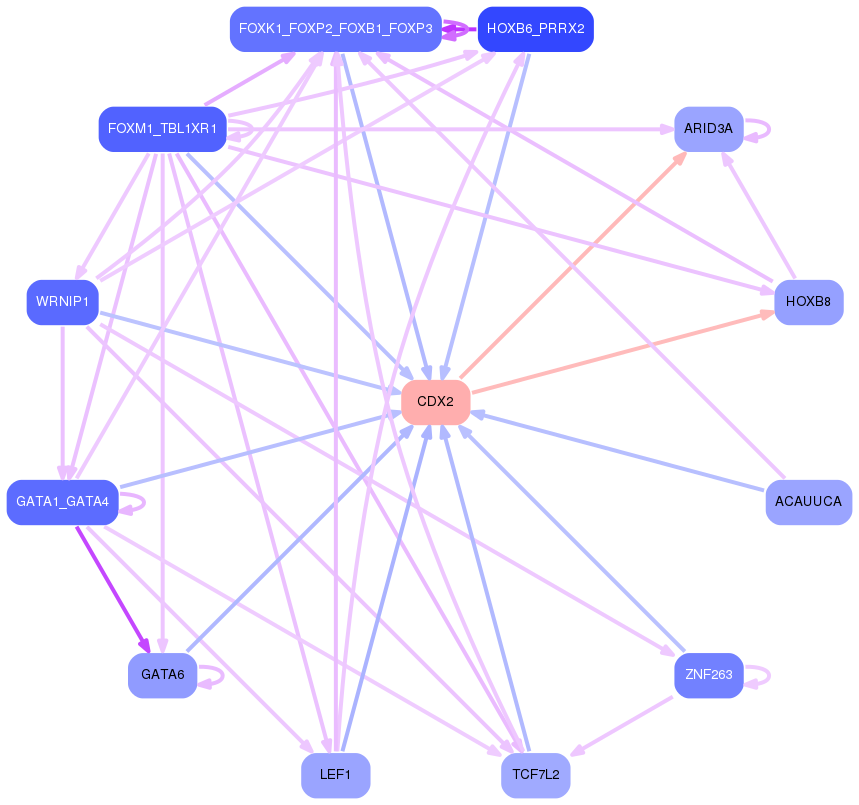
Network of associatons between targets according to the STRING database.

First level regulatory network of CDX2
Gene Ontology Analysis
Gene overrepresentation in biological process category:
| Log-likelihood per target | Total log-likelihood | Term | Description |
|---|---|---|---|
| 0.6 | 1.7 | GO:2000296 | negative regulation of hydrogen peroxide catabolic process(GO:2000296) |
| 0.3 | 0.9 | GO:0015847 | putrescine transport(GO:0015847) |
| 0.3 | 3.8 | GO:2000332 | response to linoleic acid(GO:0070543) blood microparticle formation(GO:0072564) regulation of blood microparticle formation(GO:2000332) positive regulation of blood microparticle formation(GO:2000334) |
| 0.2 | 0.9 | GO:0002636 | positive regulation of germinal center formation(GO:0002636) |
| 0.2 | 0.6 | GO:0070175 | positive regulation of enamel mineralization(GO:0070175) |
| 0.2 | 1.0 | GO:0002384 | hepatic immune response(GO:0002384) |
| 0.2 | 0.6 | GO:0061011 | hepatic duct development(GO:0061011) |
| 0.2 | 1.0 | GO:0003051 | angiotensin-mediated drinking behavior(GO:0003051) |
| 0.2 | 1.6 | GO:0006001 | fructose catabolic process(GO:0006001) fructose catabolic process to hydroxyacetone phosphate and glyceraldehyde-3-phosphate(GO:0061624) |
| 0.2 | 1.1 | GO:0001951 | intestinal D-glucose absorption(GO:0001951) |
| 0.2 | 0.6 | GO:0097045 | phosphatidylserine exposure on blood platelet(GO:0097045) |
| 0.1 | 0.7 | GO:0019805 | quinolinate biosynthetic process(GO:0019805) |
| 0.1 | 0.8 | GO:0015842 | aminergic neurotransmitter loading into synaptic vesicle(GO:0015842) |
| 0.1 | 0.5 | GO:0060743 | epithelial cell maturation involved in prostate gland development(GO:0060743) |
| 0.1 | 0.9 | GO:0009441 | glycolate metabolic process(GO:0009441) |
| 0.1 | 0.3 | GO:1904211 | membrane protein proteolysis involved in retrograde protein transport, ER to cytosol(GO:1904211) |
| 0.1 | 0.7 | GO:1903936 | cellular response to sodium arsenite(GO:1903936) |
| 0.1 | 1.4 | GO:0043152 | induction of bacterial agglutination(GO:0043152) |
| 0.1 | 0.3 | GO:0016122 | tetraterpenoid metabolic process(GO:0016108) carotenoid metabolic process(GO:0016116) carotene catabolic process(GO:0016121) xanthophyll metabolic process(GO:0016122) terpene catabolic process(GO:0046247) |
| 0.1 | 0.7 | GO:1903435 | positive regulation of constitutive secretory pathway(GO:1903435) |
| 0.1 | 0.4 | GO:0051919 | activation of plasma proteins involved in acute inflammatory response(GO:0002541) positive regulation of fibrinolysis(GO:0051919) |
| 0.1 | 0.3 | GO:1905150 | regulation of voltage-gated sodium channel activity(GO:1905150) |
| 0.1 | 0.5 | GO:0015722 | canalicular bile acid transport(GO:0015722) |
| 0.1 | 0.5 | GO:0050916 | sensory perception of sweet taste(GO:0050916) |
| 0.1 | 2.2 | GO:0042359 | vitamin D metabolic process(GO:0042359) |
| 0.1 | 2.0 | GO:0007342 | fusion of sperm to egg plasma membrane(GO:0007342) |
| 0.1 | 1.0 | GO:1904352 | positive regulation of protein catabolic process in the vacuole(GO:1904352) |
| 0.1 | 0.3 | GO:0010587 | miRNA catabolic process(GO:0010587) |
| 0.1 | 0.7 | GO:0015801 | aromatic amino acid transport(GO:0015801) |
| 0.1 | 0.7 | GO:0043569 | negative regulation of insulin-like growth factor receptor signaling pathway(GO:0043569) |
| 0.1 | 0.4 | GO:0016557 | peroxisome membrane biogenesis(GO:0016557) |
| 0.1 | 0.6 | GO:2000189 | positive regulation of cholesterol homeostasis(GO:2000189) |
| 0.0 | 0.5 | GO:0031087 | deadenylation-independent decapping of nuclear-transcribed mRNA(GO:0031087) |
| 0.0 | 0.5 | GO:0033211 | adiponectin-activated signaling pathway(GO:0033211) |
| 0.0 | 0.3 | GO:0032485 | Ral protein signal transduction(GO:0032484) regulation of Ral protein signal transduction(GO:0032485) |
| 0.0 | 1.5 | GO:0048240 | sperm capacitation(GO:0048240) |
| 0.0 | 0.5 | GO:0033314 | mitotic DNA replication checkpoint(GO:0033314) |
| 0.0 | 0.2 | GO:1900245 | positive regulation of MDA-5 signaling pathway(GO:1900245) |
| 0.0 | 0.5 | GO:0018095 | protein polyglutamylation(GO:0018095) |
| 0.0 | 0.6 | GO:0002829 | negative regulation of type 2 immune response(GO:0002829) |
| 0.0 | 0.9 | GO:0086069 | bundle of His cell to Purkinje myocyte communication(GO:0086069) |
| 0.0 | 0.3 | GO:0090521 | glomerular visceral epithelial cell migration(GO:0090521) |
| 0.0 | 0.8 | GO:0043374 | CD8-positive, alpha-beta T cell differentiation(GO:0043374) |
| 0.0 | 0.5 | GO:0034625 | fatty acid elongation, saturated fatty acid(GO:0019367) fatty acid elongation, unsaturated fatty acid(GO:0019368) fatty acid elongation, monounsaturated fatty acid(GO:0034625) fatty acid elongation, polyunsaturated fatty acid(GO:0034626) |
| 0.0 | 0.2 | GO:0032383 | regulation of intracellular lipid transport(GO:0032377) regulation of intracellular sterol transport(GO:0032380) regulation of intracellular cholesterol transport(GO:0032383) |
| 0.0 | 0.2 | GO:0000720 | pyrimidine dimer repair by nucleotide-excision repair(GO:0000720) |
| 0.0 | 0.2 | GO:0043163 | cell envelope organization(GO:0043163) external encapsulating structure organization(GO:0045229) |
| 0.0 | 0.6 | GO:0031284 | positive regulation of guanylate cyclase activity(GO:0031284) |
| 0.0 | 0.1 | GO:0006788 | heme oxidation(GO:0006788) |
| 0.0 | 0.3 | GO:0009212 | dTTP biosynthetic process(GO:0006235) pyrimidine deoxyribonucleoside triphosphate biosynthetic process(GO:0009212) |
| 0.0 | 0.7 | GO:1902894 | negative regulation of pri-miRNA transcription from RNA polymerase II promoter(GO:1902894) |
| 0.0 | 0.8 | GO:0035435 | phosphate ion transmembrane transport(GO:0035435) |
| 0.0 | 0.1 | GO:0072560 | regulation of transcription from RNA polymerase II promoter involved in ventral spinal cord interneuron specification(GO:0021913) type B pancreatic cell maturation(GO:0072560) |
| 0.0 | 0.8 | GO:0021516 | dorsal spinal cord development(GO:0021516) |
| 0.0 | 0.4 | GO:2000543 | positive regulation of gastrulation(GO:2000543) |
| 0.0 | 1.3 | GO:0002026 | regulation of the force of heart contraction(GO:0002026) |
| 0.0 | 0.1 | GO:0014826 | vein smooth muscle contraction(GO:0014826) |
| 0.0 | 0.4 | GO:0007144 | female meiosis I(GO:0007144) |
| 0.0 | 0.6 | GO:0097296 | activation of cysteine-type endopeptidase activity involved in apoptotic signaling pathway(GO:0097296) |
| 0.0 | 0.2 | GO:0070940 | dephosphorylation of RNA polymerase II C-terminal domain(GO:0070940) |
| 0.0 | 0.6 | GO:0060397 | JAK-STAT cascade involved in growth hormone signaling pathway(GO:0060397) |
| 0.0 | 0.3 | GO:0098582 | innate vocalization behavior(GO:0098582) |
| 0.0 | 0.3 | GO:0045059 | positive thymic T cell selection(GO:0045059) |
| 0.0 | 0.4 | GO:0034501 | protein localization to kinetochore(GO:0034501) |
| 0.0 | 0.1 | GO:0001777 | T cell homeostatic proliferation(GO:0001777) regulation of T cell homeostatic proliferation(GO:0046013) |
| 0.0 | 0.1 | GO:1904017 | cellular response to Thyroglobulin triiodothyronine(GO:1904017) |
| 0.0 | 0.5 | GO:0007064 | mitotic sister chromatid cohesion(GO:0007064) |
| 0.0 | 0.2 | GO:0008063 | Toll signaling pathway(GO:0008063) |
| 0.0 | 0.1 | GO:0070858 | negative regulation of bile acid biosynthetic process(GO:0070858) negative regulation of bile acid metabolic process(GO:1904252) |
| 0.0 | 1.2 | GO:0006120 | mitochondrial electron transport, NADH to ubiquinone(GO:0006120) |
| 0.0 | 0.5 | GO:0045898 | regulation of RNA polymerase II transcriptional preinitiation complex assembly(GO:0045898) |
| 0.0 | 0.2 | GO:0097475 | motor neuron migration(GO:0097475) |
| 0.0 | 0.1 | GO:1901857 | positive regulation of cellular respiration(GO:1901857) |
| 0.0 | 0.3 | GO:0016576 | histone dephosphorylation(GO:0016576) |
| 0.0 | 0.1 | GO:2001180 | negative regulation of interleukin-10 secretion(GO:2001180) |
| 0.0 | 0.2 | GO:0090204 | protein localization to nuclear pore(GO:0090204) |
| 0.0 | 0.2 | GO:0031848 | protection from non-homologous end joining at telomere(GO:0031848) |
| 0.0 | 0.2 | GO:0035520 | monoubiquitinated protein deubiquitination(GO:0035520) |
| 0.0 | 0.2 | GO:0010819 | regulation of T cell chemotaxis(GO:0010819) |
| 0.0 | 0.1 | GO:1903377 | negative regulation of oxidative stress-induced neuron intrinsic apoptotic signaling pathway(GO:1903377) |
| 0.0 | 0.1 | GO:0001692 | histamine metabolic process(GO:0001692) |
| 0.0 | 0.0 | GO:0046005 | positive regulation of circadian sleep/wake cycle, REM sleep(GO:0046005) |
| 0.0 | 2.7 | GO:0048013 | ephrin receptor signaling pathway(GO:0048013) |
| 0.0 | 0.7 | GO:0051930 | regulation of sensory perception of pain(GO:0051930) regulation of sensory perception(GO:0051931) |
| 0.0 | 0.1 | GO:0086024 | adrenergic receptor signaling pathway involved in positive regulation of heart rate(GO:0086024) |
| 0.0 | 0.2 | GO:1990573 | potassium ion import across plasma membrane(GO:1990573) |
| 0.0 | 0.1 | GO:0002018 | renin-angiotensin regulation of aldosterone production(GO:0002018) |
| 0.0 | 0.7 | GO:0010591 | regulation of lamellipodium assembly(GO:0010591) |
| 0.0 | 0.1 | GO:0001880 | Mullerian duct regression(GO:0001880) |
| 0.0 | 1.7 | GO:0070268 | cornification(GO:0070268) |
| 0.0 | 0.3 | GO:0032098 | regulation of appetite(GO:0032098) |
Gene overrepresentation in cellular component category:
| Log-likelihood per target | Total log-likelihood | Term | Description |
|---|---|---|---|
| 0.4 | 1.7 | GO:0031838 | haptoglobin-hemoglobin complex(GO:0031838) |
| 0.2 | 1.0 | GO:0005896 | interleukin-6 receptor complex(GO:0005896) |
| 0.1 | 1.4 | GO:0005577 | fibrinogen complex(GO:0005577) |
| 0.1 | 3.8 | GO:0031092 | platelet alpha granule membrane(GO:0031092) |
| 0.1 | 0.8 | GO:0070081 | clathrin-sculpted monoamine transport vesicle(GO:0070081) clathrin-sculpted monoamine transport vesicle membrane(GO:0070083) |
| 0.1 | 0.3 | GO:0071458 | integral component of cytoplasmic side of endoplasmic reticulum membrane(GO:0071458) |
| 0.1 | 0.3 | GO:1990876 | cytoplasmic side of nuclear pore(GO:1990876) |
| 0.0 | 0.3 | GO:0043541 | UDP-N-acetylglucosamine transferase complex(GO:0043541) |
| 0.0 | 0.7 | GO:0033093 | Weibel-Palade body(GO:0033093) |
| 0.0 | 1.6 | GO:0034451 | centriolar satellite(GO:0034451) |
| 0.0 | 0.5 | GO:0046581 | intercellular canaliculus(GO:0046581) |
| 0.0 | 0.2 | GO:0000110 | nucleotide-excision repair factor 1 complex(GO:0000110) |
| 0.0 | 0.3 | GO:0042105 | alpha-beta T cell receptor complex(GO:0042105) |
| 0.0 | 0.3 | GO:0005672 | transcription factor TFIIA complex(GO:0005672) |
| 0.0 | 0.1 | GO:0033186 | CAF-1 complex(GO:0033186) |
| 0.0 | 1.2 | GO:0005747 | mitochondrial respiratory chain complex I(GO:0005747) NADH dehydrogenase complex(GO:0030964) respiratory chain complex I(GO:0045271) |
| 0.0 | 2.6 | GO:0016459 | myosin complex(GO:0016459) |
| 0.0 | 0.3 | GO:0033391 | chromatoid body(GO:0033391) |
| 0.0 | 0.6 | GO:0097381 | photoreceptor disc membrane(GO:0097381) |
| 0.0 | 1.2 | GO:0031907 | peroxisomal matrix(GO:0005782) microbody lumen(GO:0031907) |
| 0.0 | 0.4 | GO:0005779 | integral component of peroxisomal membrane(GO:0005779) intrinsic component of peroxisomal membrane(GO:0031231) |
| 0.0 | 0.2 | GO:0008282 | ATP-sensitive potassium channel complex(GO:0008282) |
| 0.0 | 0.1 | GO:1990111 | spermatoproteasome complex(GO:1990111) |
| 0.0 | 0.8 | GO:0005720 | nuclear heterochromatin(GO:0005720) |
| 0.0 | 3.1 | GO:0072562 | blood microparticle(GO:0072562) |
Gene overrepresentation in molecular function category:
| Log-likelihood per target | Total log-likelihood | Term | Description |
|---|---|---|---|
| 0.6 | 2.2 | GO:1902271 | D3 vitamins binding(GO:1902271) |
| 0.4 | 1.6 | GO:0061609 | fructose-1-phosphate aldolase activity(GO:0061609) |
| 0.3 | 3.8 | GO:0070892 | lipoteichoic acid receptor activity(GO:0070892) |
| 0.3 | 0.9 | GO:0052854 | (S)-2-hydroxy-acid oxidase activity(GO:0003973) very-long-chain-(S)-2-hydroxy-acid oxidase activity(GO:0052852) long-chain-(S)-2-hydroxy-long-chain-acid oxidase activity(GO:0052853) medium-chain-(S)-2-hydroxy-acid oxidase activity(GO:0052854) |
| 0.3 | 0.9 | GO:0015203 | polyamine transmembrane transporter activity(GO:0015203) putrescine transmembrane transporter activity(GO:0015489) |
| 0.3 | 1.0 | GO:0070119 | ciliary neurotrophic factor binding(GO:0070119) |
| 0.3 | 1.5 | GO:0032038 | myosin II heavy chain binding(GO:0032038) |
| 0.2 | 1.7 | GO:0030492 | hemoglobin binding(GO:0030492) |
| 0.2 | 0.8 | GO:0015222 | serotonin transmembrane transporter activity(GO:0015222) |
| 0.2 | 0.7 | GO:0061752 | telomeric repeat-containing RNA binding(GO:0061752) |
| 0.2 | 0.5 | GO:0004339 | glucan 1,4-alpha-glucosidase activity(GO:0004339) |
| 0.2 | 1.0 | GO:0008241 | peptidyl-dipeptidase activity(GO:0008241) |
| 0.2 | 0.7 | GO:0015173 | aromatic amino acid transmembrane transporter activity(GO:0015173) |
| 0.2 | 0.5 | GO:0015432 | bile acid-exporting ATPase activity(GO:0015432) |
| 0.2 | 0.5 | GO:0019781 | NEDD8 activating enzyme activity(GO:0019781) |
| 0.1 | 0.6 | GO:0005148 | prolactin receptor binding(GO:0005148) |
| 0.1 | 0.5 | GO:0055100 | adiponectin binding(GO:0055100) |
| 0.1 | 0.9 | GO:0031013 | troponin I binding(GO:0031013) |
| 0.1 | 0.2 | GO:0070538 | oleic acid binding(GO:0070538) |
| 0.1 | 0.6 | GO:0008048 | calcium sensitive guanylate cyclase activator activity(GO:0008048) |
| 0.1 | 0.6 | GO:0030368 | interleukin-17 receptor activity(GO:0030368) |
| 0.1 | 0.7 | GO:0016174 | NAD(P)H oxidase activity(GO:0016174) |
| 0.1 | 0.3 | GO:0044736 | acid-sensing ion channel activity(GO:0044736) |
| 0.0 | 0.3 | GO:0042500 | aspartic endopeptidase activity, intramembrane cleaving(GO:0042500) |
| 0.0 | 0.6 | GO:0030280 | structural constituent of epidermis(GO:0030280) |
| 0.0 | 0.8 | GO:0005436 | sodium:phosphate symporter activity(GO:0005436) |
| 0.0 | 0.4 | GO:0008310 | single-stranded DNA 3'-5' exodeoxyribonuclease activity(GO:0008310) |
| 0.0 | 0.5 | GO:0005005 | transmembrane-ephrin receptor activity(GO:0005005) |
| 0.0 | 2.0 | GO:0005164 | tumor necrosis factor receptor binding(GO:0005164) |
| 0.0 | 0.5 | GO:0009922 | fatty acid elongase activity(GO:0009922) 3-oxo-arachidoyl-CoA synthase activity(GO:0102336) 3-oxo-cerotoyl-CoA synthase activity(GO:0102337) 3-oxo-lignoceronyl-CoA synthase activity(GO:0102338) |
| 0.0 | 0.2 | GO:0048248 | CXCR3 chemokine receptor binding(GO:0048248) |
| 0.0 | 2.0 | GO:0030159 | receptor signaling complex scaffold activity(GO:0030159) |
| 0.0 | 1.0 | GO:0008190 | eukaryotic initiation factor 4E binding(GO:0008190) |
| 0.0 | 0.3 | GO:0001594 | trace-amine receptor activity(GO:0001594) |
| 0.0 | 0.1 | GO:0004392 | heme oxygenase (decyclizing) activity(GO:0004392) |
| 0.0 | 0.5 | GO:0008061 | chitin binding(GO:0008061) |
| 0.0 | 0.2 | GO:1990599 | 3' overhang single-stranded DNA endodeoxyribonuclease activity(GO:1990599) |
| 0.0 | 0.2 | GO:0017098 | sulfonylurea receptor binding(GO:0017098) |
| 0.0 | 0.1 | GO:0032089 | NACHT domain binding(GO:0032089) |
| 0.0 | 0.6 | GO:0017128 | voltage-gated chloride channel activity(GO:0005247) phospholipid scramblase activity(GO:0017128) |
| 0.0 | 0.7 | GO:0017056 | structural constituent of nuclear pore(GO:0017056) |
| 0.0 | 0.2 | GO:0035312 | 5'-3' exodeoxyribonuclease activity(GO:0035312) |
| 0.0 | 1.2 | GO:0008137 | NADH dehydrogenase (ubiquinone) activity(GO:0008137) NADH dehydrogenase (quinone) activity(GO:0050136) |
| 0.0 | 0.4 | GO:0033038 | bitter taste receptor activity(GO:0033038) |
| 0.0 | 0.2 | GO:0005412 | glucose:sodium symporter activity(GO:0005412) |
| 0.0 | 0.2 | GO:0004972 | NMDA glutamate receptor activity(GO:0004972) |
| 0.0 | 0.6 | GO:0004181 | metallocarboxypeptidase activity(GO:0004181) |
| 0.0 | 0.1 | GO:0031708 | endothelin B receptor binding(GO:0031708) |
| 0.0 | 0.2 | GO:0003810 | protein-glutamine gamma-glutamyltransferase activity(GO:0003810) |
| 0.0 | 0.2 | GO:0002161 | aminoacyl-tRNA editing activity(GO:0002161) |
| 0.0 | 0.1 | GO:0043515 | kinetochore binding(GO:0043515) |
| 0.0 | 0.1 | GO:0030375 | thyroid hormone receptor activator activity(GO:0010861) thyroid hormone receptor coactivator activity(GO:0030375) |
| 0.0 | 0.1 | GO:0043208 | glycosphingolipid binding(GO:0043208) |
| 0.0 | 0.4 | GO:0008139 | nuclear localization sequence binding(GO:0008139) |
| 0.0 | 0.1 | GO:1990050 | phosphatidic acid transporter activity(GO:1990050) |
| 0.0 | 0.6 | GO:0031492 | nucleosomal DNA binding(GO:0031492) |
Gene overrepresentation in curated gene sets: canonical pathways category:
| Log-likelihood per target | Total log-likelihood | Term | Description |
|---|---|---|---|
| 0.0 | 1.0 | ST STAT3 PATHWAY | STAT3 Pathway |
| 0.0 | 2.2 | PID HNF3B PATHWAY | FOXA2 and FOXA3 transcription factor networks |
| 0.0 | 1.4 | PID INTEGRIN2 PATHWAY | Beta2 integrin cell surface interactions |
| 0.0 | 0.7 | PID IL27 PATHWAY | IL27-mediated signaling events |
| 0.0 | 0.6 | PID CONE PATHWAY | Visual signal transduction: Cones |
| 0.0 | 1.0 | PID TRAIL PATHWAY | TRAIL signaling pathway |
| 0.0 | 1.5 | PID NFAT TFPATHWAY | Calcineurin-regulated NFAT-dependent transcription in lymphocytes |
Gene overrepresentation in curated gene sets: REACTOME pathways category:
| Log-likelihood per target | Total log-likelihood | Term | Description |
|---|---|---|---|
| 0.1 | 0.9 | REACTOME REGULATION OF ORNITHINE DECARBOXYLASE ODC | Genes involved in Regulation of ornithine decarboxylase (ODC) |
| 0.1 | 1.4 | REACTOME COMMON PATHWAY | Genes involved in Common Pathway |
| 0.1 | 0.7 | REACTOME TRYPTOPHAN CATABOLISM | Genes involved in Tryptophan catabolism |
| 0.1 | 1.0 | REACTOME IL 6 SIGNALING | Genes involved in Interleukin-6 signaling |
| 0.0 | 2.2 | REACTOME STEROID HORMONES | Genes involved in Steroid hormones |
| 0.0 | 0.9 | REACTOME SYNTHESIS OF BILE ACIDS AND BILE SALTS VIA 7ALPHA HYDROXYCHOLESTEROL | Genes involved in Synthesis of bile acids and bile salts via 7alpha-hydroxycholesterol |
| 0.0 | 4.0 | REACTOME ANTIGEN PROCESSING CROSS PRESENTATION | Genes involved in Antigen processing-Cross presentation |
| 0.0 | 2.3 | REACTOME STRIATED MUSCLE CONTRACTION | Genes involved in Striated Muscle Contraction |
| 0.0 | 1.0 | REACTOME EXTRINSIC PATHWAY FOR APOPTOSIS | Genes involved in Extrinsic Pathway for Apoptosis |
| 0.0 | 0.8 | REACTOME NA CL DEPENDENT NEUROTRANSMITTER TRANSPORTERS | Genes involved in Na+/Cl- dependent neurotransmitter transporters |
| 0.0 | 1.6 | REACTOME GLYCOLYSIS | Genes involved in Glycolysis |
| 0.0 | 0.7 | REACTOME INSULIN SYNTHESIS AND PROCESSING | Genes involved in Insulin Synthesis and Processing |
| 0.0 | 0.3 | REACTOME SEROTONIN RECEPTORS | Genes involved in Serotonin receptors |
| 0.0 | 0.6 | REACTOME PROLACTIN RECEPTOR SIGNALING | Genes involved in Prolactin receptor signaling |
| 0.0 | 0.4 | REACTOME ABCA TRANSPORTERS IN LIPID HOMEOSTASIS | Genes involved in ABCA transporters in lipid homeostasis |
| 0.0 | 0.4 | REACTOME DESTABILIZATION OF MRNA BY TRISTETRAPROLIN TTP | Genes involved in Destabilization of mRNA by Tristetraprolin (TTP) |
| 0.0 | 0.3 | REACTOME TRANSLOCATION OF ZAP 70 TO IMMUNOLOGICAL SYNAPSE | Genes involved in Translocation of ZAP-70 to Immunological synapse |
| 0.0 | 0.7 | REACTOME REGULATION OF GLUCOKINASE BY GLUCOKINASE REGULATORY PROTEIN | Genes involved in Regulation of Glucokinase by Glucokinase Regulatory Protein |
| 0.0 | 0.4 | REACTOME INTRINSIC PATHWAY | Genes involved in Intrinsic Pathway |
| 0.0 | 0.5 | REACTOME CIRCADIAN REPRESSION OF EXPRESSION BY REV ERBA | Genes involved in Circadian Repression of Expression by REV-ERBA |
| 0.0 | 0.7 | REACTOME AMINO ACID TRANSPORT ACROSS THE PLASMA MEMBRANE | Genes involved in Amino acid transport across the plasma membrane |
| 0.0 | 0.2 | REACTOME IRAK1 RECRUITS IKK COMPLEX | Genes involved in IRAK1 recruits IKK complex |
| 0.0 | 0.5 | REACTOME REGULATION OF GENE EXPRESSION IN BETA CELLS | Genes involved in Regulation of gene expression in beta cells |