Project
Illumina Body Map 2 (GSE30611)
Navigation
Downloads
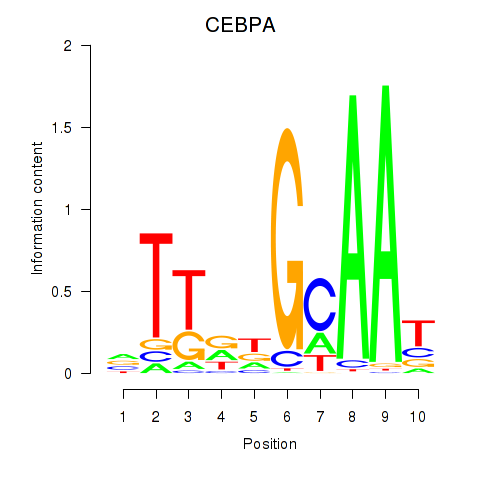
Results for CEBPA
Z-value: 3.16
Motif logo
Transcription factors associated with CEBPA
| Gene Symbol | Gene ID | Gene Info |
|---|---|---|
|
CEBPA
|
ENSG00000245848.3 | CCAAT enhancer binding protein alpha |
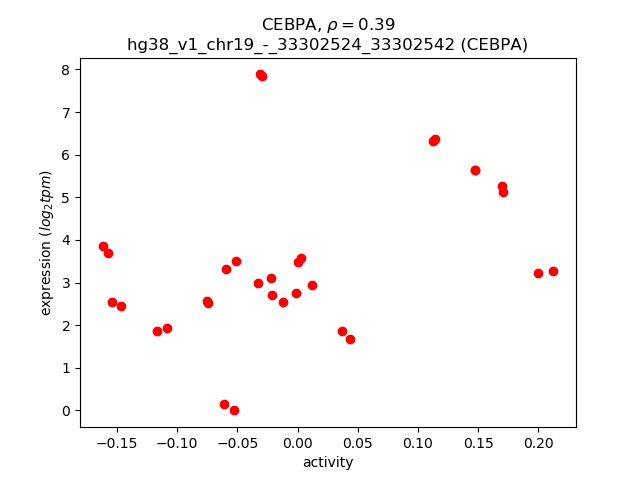
Activity-expression correlation:
| Gene | Promoter | Pearson corr. coef. | P-value | Plot |
|---|---|---|---|---|
| CEBPA | hg38_v1_chr19_-_33302524_33302542 | 0.39 | 2.6e-02 | Click! |
Activity profile of CEBPA motif
Sorted Z-values of CEBPA motif
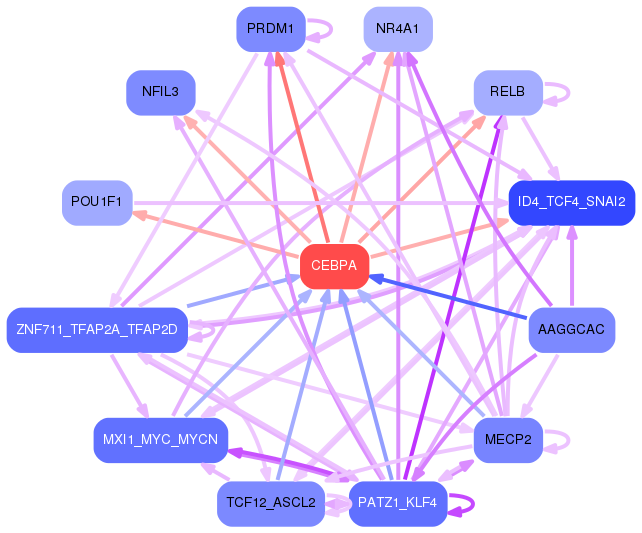
Network of associatons between targets according to the STRING database.

First level regulatory network of CEBPA
Gene Ontology Analysis
Gene overrepresentation in biological process category:
| Log-likelihood per target | Total log-likelihood | Term | Description |
|---|---|---|---|
| 4.1 | 12.2 | GO:2000296 | negative regulation of hydrogen peroxide catabolic process(GO:2000296) |
| 3.8 | 11.4 | GO:0035915 | pore formation in membrane of other organism(GO:0035915) |
| 3.3 | 16.4 | GO:2000471 | regulation of hematopoietic stem cell migration(GO:2000471) positive regulation of hematopoietic stem cell migration(GO:2000473) |
| 3.0 | 11.9 | GO:0090119 | vesicle-mediated cholesterol transport(GO:0090119) |
| 2.7 | 13.5 | GO:0015891 | iron chelate transport(GO:0015688) siderophore transport(GO:0015891) |
| 2.6 | 7.9 | GO:0060392 | negative regulation of SMAD protein import into nucleus(GO:0060392) |
| 2.2 | 6.7 | GO:1903015 | regulation of exo-alpha-sialidase activity(GO:1903015) |
| 2.2 | 6.5 | GO:0010932 | macrophage tolerance induction(GO:0010931) regulation of macrophage tolerance induction(GO:0010932) positive regulation of macrophage tolerance induction(GO:0010933) |
| 2.0 | 6.1 | GO:0050717 | positive regulation of interleukin-1 alpha secretion(GO:0050717) |
| 1.9 | 9.6 | GO:0045356 | positive regulation of interferon-alpha biosynthetic process(GO:0045356) |
| 1.7 | 8.6 | GO:0033031 | positive regulation of neutrophil apoptotic process(GO:0033031) |
| 1.7 | 11.8 | GO:0019557 | histidine catabolic process to glutamate and formamide(GO:0019556) histidine catabolic process to glutamate and formate(GO:0019557) formamide metabolic process(GO:0043606) |
| 1.7 | 5.0 | GO:0061402 | positive regulation of transcription from RNA polymerase II promoter in response to acidic pH(GO:0061402) |
| 1.6 | 14.6 | GO:0051552 | flavone metabolic process(GO:0051552) |
| 1.6 | 4.8 | GO:0019442 | tryptophan catabolic process to acetyl-CoA(GO:0019442) |
| 1.5 | 7.7 | GO:0008588 | release of cytoplasmic sequestered NF-kappaB(GO:0008588) |
| 1.5 | 15.3 | GO:0006572 | tyrosine catabolic process(GO:0006572) |
| 1.5 | 4.6 | GO:0035425 | autocrine signaling(GO:0035425) |
| 1.5 | 5.9 | GO:0000738 | DNA catabolic process, exonucleolytic(GO:0000738) |
| 1.4 | 5.8 | GO:2000910 | negative regulation of cholesterol import(GO:0060621) negative regulation of sterol import(GO:2000910) |
| 1.4 | 5.7 | GO:0002636 | positive regulation of germinal center formation(GO:0002636) |
| 1.4 | 12.5 | GO:0030450 | regulation of complement activation, classical pathway(GO:0030450) negative regulation of complement activation, classical pathway(GO:0045959) |
| 1.4 | 4.2 | GO:0031394 | positive regulation of prostaglandin biosynthetic process(GO:0031394) positive regulation of fibroblast growth factor production(GO:0090271) positive regulation of unsaturated fatty acid biosynthetic process(GO:2001280) |
| 1.4 | 20.7 | GO:0002227 | innate immune response in mucosa(GO:0002227) |
| 1.3 | 10.6 | GO:0071725 | toll-like receptor TLR1:TLR2 signaling pathway(GO:0038123) response to triacyl bacterial lipopeptide(GO:0071725) cellular response to triacyl bacterial lipopeptide(GO:0071727) |
| 1.3 | 13.1 | GO:0000821 | regulation of arginine metabolic process(GO:0000821) |
| 1.3 | 7.8 | GO:0032571 | response to vitamin K(GO:0032571) |
| 1.3 | 3.9 | GO:0042270 | protection from natural killer cell mediated cytotoxicity(GO:0042270) |
| 1.2 | 4.9 | GO:0003330 | regulation of extracellular matrix constituent secretion(GO:0003330) positive regulation of extracellular matrix constituent secretion(GO:0003331) |
| 1.2 | 7.1 | GO:0019732 | antifungal humoral response(GO:0019732) |
| 1.2 | 20.0 | GO:0016998 | cell wall macromolecule catabolic process(GO:0016998) |
| 1.2 | 3.5 | GO:0032730 | positive regulation of interleukin-1 alpha production(GO:0032730) |
| 1.2 | 17.5 | GO:0034370 | triglyceride-rich lipoprotein particle remodeling(GO:0034370) |
| 1.2 | 3.5 | GO:1990654 | sebum secreting cell proliferation(GO:1990654) |
| 1.1 | 5.6 | GO:0003245 | cardiac muscle tissue growth involved in heart morphogenesis(GO:0003245) |
| 1.1 | 3.4 | GO:0042231 | interleukin-13 biosynthetic process(GO:0042231) |
| 1.1 | 4.4 | GO:0044537 | regulation of circulating fibrinogen levels(GO:0044537) |
| 1.0 | 3.1 | GO:0071650 | regulation of interleukin-18 production(GO:0032661) negative regulation of interleukin-18 production(GO:0032701) negative regulation of cytokine activity(GO:0060302) negative regulation of chemokine (C-C motif) ligand 5 production(GO:0071650) |
| 1.0 | 5.1 | GO:1904823 | pyrimidine nucleobase transport(GO:0015855) purine nucleobase transmembrane transport(GO:1904823) |
| 1.0 | 14.8 | GO:2000427 | positive regulation of apoptotic cell clearance(GO:2000427) |
| 1.0 | 5.9 | GO:0038112 | interleukin-8-mediated signaling pathway(GO:0038112) |
| 0.9 | 2.8 | GO:0060559 | positive regulation of vitamin metabolic process(GO:0046136) positive regulation of vitamin D biosynthetic process(GO:0060557) positive regulation of calcidiol 1-monooxygenase activity(GO:0060559) |
| 0.9 | 15.6 | GO:0006957 | complement activation, alternative pathway(GO:0006957) |
| 0.9 | 8.2 | GO:0019264 | glycine biosynthetic process from serine(GO:0019264) |
| 0.8 | 5.9 | GO:1900041 | negative regulation of interleukin-2 secretion(GO:1900041) |
| 0.8 | 2.5 | GO:0002432 | granuloma formation(GO:0002432) |
| 0.8 | 4.9 | GO:2000503 | positive regulation of natural killer cell chemotaxis(GO:2000503) |
| 0.8 | 24.8 | GO:0031639 | plasminogen activation(GO:0031639) |
| 0.8 | 4.8 | GO:1903238 | positive regulation of leukocyte tethering or rolling(GO:1903238) |
| 0.8 | 3.1 | GO:0002399 | MHC class II protein complex assembly(GO:0002399) |
| 0.8 | 3.1 | GO:0032650 | regulation of interleukin-1 alpha production(GO:0032650) |
| 0.8 | 63.3 | GO:0006953 | acute-phase response(GO:0006953) |
| 0.8 | 6.8 | GO:0002480 | antigen processing and presentation of exogenous peptide antigen via MHC class I, TAP-independent(GO:0002480) |
| 0.7 | 12.6 | GO:0006030 | chitin metabolic process(GO:0006030) chitin catabolic process(GO:0006032) |
| 0.7 | 2.9 | GO:1904017 | cellular response to Thyroglobulin triiodothyronine(GO:1904017) |
| 0.7 | 5.8 | GO:0010898 | positive regulation of triglyceride catabolic process(GO:0010898) |
| 0.7 | 2.1 | GO:0045410 | positive regulation of interleukin-6 biosynthetic process(GO:0045410) |
| 0.7 | 7.6 | GO:2000535 | regulation of entry of bacterium into host cell(GO:2000535) |
| 0.7 | 1.4 | GO:0046110 | xanthine metabolic process(GO:0046110) |
| 0.7 | 7.9 | GO:0033211 | adiponectin-activated signaling pathway(GO:0033211) |
| 0.6 | 3.0 | GO:0070269 | pyroptosis(GO:0070269) |
| 0.6 | 3.6 | GO:2001107 | negative regulation of establishment of T cell polarity(GO:1903904) negative regulation of Rho guanyl-nucleotide exchange factor activity(GO:2001107) |
| 0.6 | 9.8 | GO:0015939 | pantothenate metabolic process(GO:0015939) |
| 0.6 | 1.7 | GO:2000523 | regulation of T cell costimulation(GO:2000523) positive regulation of T cell costimulation(GO:2000525) |
| 0.5 | 2.1 | GO:2000255 | negative regulation of male germ cell proliferation(GO:2000255) |
| 0.5 | 1.6 | GO:0006711 | estrogen catabolic process(GO:0006711) |
| 0.5 | 2.5 | GO:0097029 | mature conventional dendritic cell differentiation(GO:0097029) |
| 0.5 | 4.5 | GO:0097503 | sialylation(GO:0097503) |
| 0.5 | 2.0 | GO:0032621 | interleukin-18 production(GO:0032621) |
| 0.5 | 1.5 | GO:0050955 | thermoception(GO:0050955) |
| 0.5 | 1.5 | GO:1902616 | acyl carnitine transport(GO:0006844) acyl carnitine transmembrane transport(GO:1902616) |
| 0.5 | 1.0 | GO:0001781 | neutrophil apoptotic process(GO:0001781) regulation of neutrophil apoptotic process(GO:0033029) |
| 0.5 | 7.5 | GO:0002291 | T cell activation via T cell receptor contact with antigen bound to MHC molecule on antigen presenting cell(GO:0002291) |
| 0.5 | 3.2 | GO:0060332 | positive regulation of response to interferon-gamma(GO:0060332) positive regulation of interferon-gamma-mediated signaling pathway(GO:0060335) |
| 0.5 | 1.8 | GO:0060133 | somatotropin secreting cell development(GO:0060133) |
| 0.4 | 3.6 | GO:0060244 | negative regulation of cell proliferation involved in contact inhibition(GO:0060244) |
| 0.4 | 2.6 | GO:0035624 | receptor transactivation(GO:0035624) |
| 0.4 | 3.8 | GO:1903265 | positive regulation of tumor necrosis factor-mediated signaling pathway(GO:1903265) |
| 0.4 | 1.7 | GO:0022614 | membrane to membrane docking(GO:0022614) |
| 0.4 | 2.9 | GO:1904694 | negative regulation of vascular smooth muscle contraction(GO:1904694) |
| 0.4 | 6.5 | GO:0015889 | cobalamin transport(GO:0015889) |
| 0.4 | 4.7 | GO:0006787 | porphyrin-containing compound catabolic process(GO:0006787) tetrapyrrole catabolic process(GO:0033015) heme catabolic process(GO:0042167) pigment catabolic process(GO:0046149) |
| 0.4 | 1.9 | GO:2001184 | positive regulation of interleukin-12 secretion(GO:2001184) |
| 0.4 | 7.7 | GO:0046185 | aldehyde catabolic process(GO:0046185) |
| 0.4 | 10.7 | GO:0042730 | fibrinolysis(GO:0042730) |
| 0.4 | 2.2 | GO:0060370 | susceptibility to T cell mediated cytotoxicity(GO:0060370) |
| 0.4 | 1.1 | GO:0003218 | cardiac left ventricle formation(GO:0003218) |
| 0.4 | 0.7 | GO:0045349 | interferon-alpha biosynthetic process(GO:0045349) regulation of interferon-alpha biosynthetic process(GO:0045354) negative regulation of interferon-alpha biosynthetic process(GO:0045355) |
| 0.4 | 3.9 | GO:0043152 | induction of bacterial agglutination(GO:0043152) |
| 0.3 | 6.6 | GO:0007597 | blood coagulation, intrinsic pathway(GO:0007597) |
| 0.3 | 2.1 | GO:0046440 | L-lysine catabolic process to acetyl-CoA(GO:0019474) L-lysine catabolic process(GO:0019477) L-lysine metabolic process(GO:0046440) |
| 0.3 | 5.1 | GO:0042738 | exogenous drug catabolic process(GO:0042738) |
| 0.3 | 3.1 | GO:0042905 | 9-cis-retinoic acid biosynthetic process(GO:0042904) 9-cis-retinoic acid metabolic process(GO:0042905) |
| 0.3 | 9.3 | GO:0019731 | antibacterial humoral response(GO:0019731) |
| 0.3 | 1.0 | GO:0071460 | cellular response to cell-matrix adhesion(GO:0071460) |
| 0.3 | 21.9 | GO:0002548 | monocyte chemotaxis(GO:0002548) |
| 0.3 | 0.9 | GO:0097272 | ammonia homeostasis(GO:0097272) |
| 0.3 | 7.6 | GO:0032486 | Rap protein signal transduction(GO:0032486) |
| 0.3 | 1.5 | GO:0010752 | regulation of cGMP-mediated signaling(GO:0010752) regulation of B cell chemotaxis(GO:2000537) positive regulation of B cell chemotaxis(GO:2000538) |
| 0.3 | 1.1 | GO:0016259 | selenocysteine metabolic process(GO:0016259) |
| 0.3 | 6.5 | GO:1902083 | negative regulation of peptidyl-cysteine S-nitrosylation(GO:1902083) |
| 0.3 | 11.8 | GO:0030511 | positive regulation of transforming growth factor beta receptor signaling pathway(GO:0030511) positive regulation of cellular response to transforming growth factor beta stimulus(GO:1903846) |
| 0.3 | 1.1 | GO:0044501 | modulation of signal transduction in other organism(GO:0044501) modulation by symbiont of host signal transduction pathway(GO:0052027) modulation of signal transduction in other organism involved in symbiotic interaction(GO:0052250) modulation by symbiont of host I-kappaB kinase/NF-kappaB cascade(GO:0085032) |
| 0.3 | 1.9 | GO:0046485 | ether lipid metabolic process(GO:0046485) |
| 0.3 | 7.9 | GO:0015671 | oxygen transport(GO:0015671) |
| 0.3 | 3.3 | GO:1902857 | positive regulation of nonmotile primary cilium assembly(GO:1902857) |
| 0.2 | 3.4 | GO:0043950 | positive regulation of cAMP-mediated signaling(GO:0043950) |
| 0.2 | 23.8 | GO:0018279 | protein N-linked glycosylation via asparagine(GO:0018279) |
| 0.2 | 0.4 | GO:1902358 | sulfate transmembrane transport(GO:1902358) |
| 0.2 | 18.9 | GO:0035987 | endodermal cell differentiation(GO:0035987) |
| 0.2 | 2.1 | GO:0070995 | NADPH oxidation(GO:0070995) |
| 0.2 | 0.9 | GO:0021538 | epithalamus development(GO:0021538) habenula development(GO:0021986) |
| 0.2 | 5.3 | GO:0034656 | nucleobase-containing small molecule catabolic process(GO:0034656) |
| 0.2 | 7.5 | GO:0030214 | hyaluronan catabolic process(GO:0030214) |
| 0.2 | 2.5 | GO:0097011 | cellular response to granulocyte macrophage colony-stimulating factor stimulus(GO:0097011) response to granulocyte macrophage colony-stimulating factor(GO:0097012) |
| 0.2 | 1.2 | GO:0060010 | Sertoli cell fate commitment(GO:0060010) |
| 0.2 | 0.4 | GO:0038156 | interleukin-3-mediated signaling pathway(GO:0038156) |
| 0.2 | 4.2 | GO:0006703 | estrogen biosynthetic process(GO:0006703) |
| 0.2 | 1.6 | GO:0006741 | NADP biosynthetic process(GO:0006741) |
| 0.2 | 6.9 | GO:0097186 | amelogenesis(GO:0097186) |
| 0.2 | 2.3 | GO:0071220 | toll-like receptor TLR6:TLR2 signaling pathway(GO:0038124) response to bacterial lipopeptide(GO:0070339) cellular response to bacterial lipoprotein(GO:0071220) cellular response to bacterial lipopeptide(GO:0071221) response to diacyl bacterial lipopeptide(GO:0071724) cellular response to diacyl bacterial lipopeptide(GO:0071726) |
| 0.2 | 1.7 | GO:0006065 | UDP-glucuronate biosynthetic process(GO:0006065) |
| 0.2 | 4.4 | GO:0090050 | positive regulation of cell migration involved in sprouting angiogenesis(GO:0090050) |
| 0.2 | 0.7 | GO:0046121 | deoxyribonucleoside catabolic process(GO:0046121) |
| 0.2 | 2.4 | GO:0006828 | manganese ion transport(GO:0006828) |
| 0.2 | 2.6 | GO:0010818 | T cell chemotaxis(GO:0010818) |
| 0.2 | 4.4 | GO:1901741 | positive regulation of myoblast fusion(GO:1901741) |
| 0.2 | 0.7 | GO:1902161 | positive regulation of cyclic nucleotide-gated ion channel activity(GO:1902161) regulation of voltage-gated chloride channel activity(GO:1902941) positive regulation of voltage-gated chloride channel activity(GO:1902943) |
| 0.2 | 5.4 | GO:0034389 | lipid particle organization(GO:0034389) |
| 0.2 | 0.5 | GO:0072344 | rescue of stalled ribosome(GO:0072344) |
| 0.2 | 0.5 | GO:1903371 | regulation of endoplasmic reticulum tubular network organization(GO:1903371) |
| 0.2 | 0.3 | GO:0046271 | phenylpropanoid catabolic process(GO:0046271) |
| 0.2 | 0.8 | GO:0097026 | dendritic cell dendrite assembly(GO:0097026) |
| 0.2 | 1.7 | GO:0043435 | response to corticotropin-releasing hormone(GO:0043435) cellular response to corticotropin-releasing hormone stimulus(GO:0071376) |
| 0.2 | 1.3 | GO:0046952 | ketone body catabolic process(GO:0046952) |
| 0.2 | 3.2 | GO:0034755 | iron ion transmembrane transport(GO:0034755) |
| 0.2 | 2.4 | GO:0015986 | energy coupled proton transport, down electrochemical gradient(GO:0015985) ATP synthesis coupled proton transport(GO:0015986) |
| 0.2 | 0.5 | GO:1903676 | regulation of cap-dependent translational initiation(GO:1903674) positive regulation of cap-dependent translational initiation(GO:1903676) |
| 0.2 | 0.8 | GO:0051001 | negative regulation of nitric-oxide synthase activity(GO:0051001) |
| 0.2 | 7.3 | GO:0043252 | sodium-independent organic anion transport(GO:0043252) |
| 0.1 | 1.0 | GO:0050916 | sensory perception of sweet taste(GO:0050916) |
| 0.1 | 5.5 | GO:0016338 | calcium-independent cell-cell adhesion via plasma membrane cell-adhesion molecules(GO:0016338) |
| 0.1 | 2.7 | GO:1900029 | positive regulation of ruffle assembly(GO:1900029) |
| 0.1 | 3.4 | GO:0035589 | G-protein coupled purinergic nucleotide receptor signaling pathway(GO:0035589) |
| 0.1 | 0.4 | GO:0002588 | positive regulation of antigen processing and presentation of peptide or polysaccharide antigen via MHC class II(GO:0002582) positive regulation of antigen processing and presentation of peptide antigen(GO:0002585) positive regulation of antigen processing and presentation of peptide antigen via MHC class II(GO:0002588) |
| 0.1 | 1.5 | GO:0006686 | sphingomyelin biosynthetic process(GO:0006686) |
| 0.1 | 2.7 | GO:0090292 | nuclear matrix anchoring at nuclear membrane(GO:0090292) |
| 0.1 | 0.9 | GO:0032377 | regulation of intracellular lipid transport(GO:0032377) regulation of intracellular sterol transport(GO:0032380) regulation of intracellular cholesterol transport(GO:0032383) |
| 0.1 | 0.7 | GO:0038043 | interleukin-5-mediated signaling pathway(GO:0038043) |
| 0.1 | 2.3 | GO:1903071 | positive regulation of ER-associated ubiquitin-dependent protein catabolic process(GO:1903071) |
| 0.1 | 0.4 | GO:0008057 | eye pigment granule organization(GO:0008057) |
| 0.1 | 0.7 | GO:0090206 | negative regulation of cholesterol biosynthetic process(GO:0045541) negative regulation of cholesterol metabolic process(GO:0090206) |
| 0.1 | 1.6 | GO:0071372 | cellular response to follicle-stimulating hormone stimulus(GO:0071372) |
| 0.1 | 0.8 | GO:0030950 | establishment or maintenance of actin cytoskeleton polarity(GO:0030950) |
| 0.1 | 0.3 | GO:2001311 | lysobisphosphatidic acid metabolic process(GO:2001311) |
| 0.1 | 0.8 | GO:0031627 | telomeric loop formation(GO:0031627) |
| 0.1 | 1.8 | GO:0044387 | negative regulation of protein kinase activity by regulation of protein phosphorylation(GO:0044387) |
| 0.1 | 0.3 | GO:0036166 | phenotypic switching(GO:0036166) regulation of phenotypic switching by transcription from RNA polymerase II promoter(GO:0100057) regulation of phenotypic switching(GO:1900239) regulation of hydrogen sulfide biosynthetic process(GO:1904826) positive regulation of hydrogen sulfide biosynthetic process(GO:1904828) |
| 0.1 | 0.5 | GO:0001994 | norepinephrine-epinephrine vasoconstriction involved in regulation of systemic arterial blood pressure(GO:0001994) |
| 0.1 | 0.3 | GO:0009720 | detection of hormone stimulus(GO:0009720) response to high density lipoprotein particle(GO:0055099) |
| 0.1 | 3.6 | GO:0006825 | copper ion transport(GO:0006825) |
| 0.1 | 1.2 | GO:0032264 | IMP salvage(GO:0032264) |
| 0.1 | 0.4 | GO:0015742 | alpha-ketoglutarate transport(GO:0015742) |
| 0.1 | 0.6 | GO:0030473 | nucleokinesis involved in cell motility in cerebral cortex radial glia guided migration(GO:0021817) nuclear migration along microtubule(GO:0030473) nuclear migration along microfilament(GO:0031022) |
| 0.1 | 1.1 | GO:0048003 | antigen processing and presentation of lipid antigen via MHC class Ib(GO:0048003) antigen processing and presentation, exogenous lipid antigen via MHC class Ib(GO:0048007) |
| 0.1 | 0.7 | GO:1903936 | cellular response to sodium arsenite(GO:1903936) |
| 0.1 | 3.4 | GO:0042347 | negative regulation of NF-kappaB import into nucleus(GO:0042347) |
| 0.1 | 0.4 | GO:0009224 | CMP salvage(GO:0006238) CMP biosynthetic process(GO:0009224) CMP metabolic process(GO:0046035) |
| 0.1 | 4.9 | GO:2000257 | regulation of complement activation(GO:0030449) regulation of protein activation cascade(GO:2000257) |
| 0.1 | 1.2 | GO:0015693 | magnesium ion transport(GO:0015693) |
| 0.1 | 1.8 | GO:0030210 | heparin metabolic process(GO:0030202) heparin biosynthetic process(GO:0030210) |
| 0.1 | 1.8 | GO:0006069 | ethanol oxidation(GO:0006069) |
| 0.1 | 1.6 | GO:0032688 | negative regulation of interferon-beta production(GO:0032688) |
| 0.1 | 20.5 | GO:0038094 | Fc-gamma receptor signaling pathway(GO:0038094) |
| 0.1 | 0.9 | GO:0002329 | pre-B cell differentiation(GO:0002329) |
| 0.1 | 2.2 | GO:0006853 | carnitine shuttle(GO:0006853) |
| 0.1 | 0.3 | GO:0032439 | endosome localization(GO:0032439) |
| 0.1 | 4.0 | GO:0032461 | positive regulation of protein oligomerization(GO:0032461) |
| 0.1 | 1.8 | GO:0043383 | negative T cell selection(GO:0043383) |
| 0.1 | 1.4 | GO:0051601 | exocyst localization(GO:0051601) |
| 0.1 | 1.3 | GO:0045721 | negative regulation of gluconeogenesis(GO:0045721) |
| 0.1 | 2.9 | GO:0042269 | regulation of natural killer cell mediated cytotoxicity(GO:0042269) |
| 0.1 | 0.9 | GO:0043249 | erythrocyte maturation(GO:0043249) |
| 0.1 | 0.6 | GO:0045950 | negative regulation of mitotic recombination(GO:0045950) |
| 0.1 | 58.8 | GO:0002283 | neutrophil activation involved in immune response(GO:0002283) neutrophil degranulation(GO:0043312) |
| 0.1 | 0.9 | GO:0001865 | NK T cell differentiation(GO:0001865) |
| 0.1 | 1.9 | GO:0050832 | defense response to fungus(GO:0050832) |
| 0.1 | 1.7 | GO:0040015 | negative regulation of multicellular organism growth(GO:0040015) |
| 0.1 | 3.5 | GO:0070670 | response to interleukin-4(GO:0070670) cellular response to interleukin-4(GO:0071353) |
| 0.1 | 3.1 | GO:0007339 | binding of sperm to zona pellucida(GO:0007339) |
| 0.1 | 0.6 | GO:2000124 | regulation of endocannabinoid signaling pathway(GO:2000124) |
| 0.1 | 1.2 | GO:0043374 | CD8-positive, alpha-beta T cell differentiation(GO:0043374) |
| 0.1 | 2.8 | GO:0006958 | complement activation, classical pathway(GO:0006958) |
| 0.1 | 0.6 | GO:0036343 | psychomotor behavior(GO:0036343) motor behavior(GO:0061744) |
| 0.1 | 1.1 | GO:0090110 | cargo loading into COPII-coated vesicle(GO:0090110) |
| 0.1 | 0.6 | GO:0035897 | proteolysis in other organism(GO:0035897) |
| 0.1 | 0.7 | GO:1900246 | positive regulation of RIG-I signaling pathway(GO:1900246) |
| 0.1 | 0.7 | GO:0060235 | lens induction in camera-type eye(GO:0060235) |
| 0.1 | 1.1 | GO:0003376 | sphingosine-1-phosphate signaling pathway(GO:0003376) |
| 0.1 | 1.4 | GO:0006491 | N-glycan processing(GO:0006491) |
| 0.1 | 0.6 | GO:0006627 | protein processing involved in protein targeting to mitochondrion(GO:0006627) |
| 0.1 | 1.1 | GO:0002087 | regulation of respiratory gaseous exchange by neurological system process(GO:0002087) |
| 0.1 | 4.5 | GO:0031294 | lymphocyte costimulation(GO:0031294) T cell costimulation(GO:0031295) |
| 0.1 | 0.2 | GO:0015910 | peroxisomal long-chain fatty acid import(GO:0015910) |
| 0.0 | 2.1 | GO:0007158 | neuron cell-cell adhesion(GO:0007158) |
| 0.0 | 0.3 | GO:0002071 | glandular epithelial cell maturation(GO:0002071) |
| 0.0 | 0.3 | GO:0006432 | phenylalanyl-tRNA aminoacylation(GO:0006432) |
| 0.0 | 0.5 | GO:0031087 | deadenylation-independent decapping of nuclear-transcribed mRNA(GO:0031087) |
| 0.0 | 1.6 | GO:1902236 | negative regulation of endoplasmic reticulum stress-induced intrinsic apoptotic signaling pathway(GO:1902236) |
| 0.0 | 0.8 | GO:1901256 | interleukin-21 production(GO:0032625) macrophage colony-stimulating factor production(GO:0036301) interleukin-21 secretion(GO:0072619) regulation of macrophage colony-stimulating factor production(GO:1901256) |
| 0.0 | 1.5 | GO:0000717 | nucleotide-excision repair, DNA duplex unwinding(GO:0000717) |
| 0.0 | 0.2 | GO:0070973 | protein localization to endoplasmic reticulum exit site(GO:0070973) |
| 0.0 | 1.3 | GO:0015991 | ATP hydrolysis coupled proton transport(GO:0015991) |
| 0.0 | 3.7 | GO:0006968 | cellular defense response(GO:0006968) |
| 0.0 | 2.6 | GO:0046686 | response to cadmium ion(GO:0046686) |
| 0.0 | 1.8 | GO:0006337 | nucleosome disassembly(GO:0006337) |
| 0.0 | 1.2 | GO:0042744 | hydrogen peroxide catabolic process(GO:0042744) |
| 0.0 | 1.7 | GO:0035428 | hexose transmembrane transport(GO:0035428) glucose transmembrane transport(GO:1904659) |
| 0.0 | 1.0 | GO:0000028 | ribosomal small subunit assembly(GO:0000028) |
| 0.0 | 2.7 | GO:0035666 | TRIF-dependent toll-like receptor signaling pathway(GO:0035666) |
| 0.0 | 0.7 | GO:0002360 | T cell lineage commitment(GO:0002360) |
| 0.0 | 0.3 | GO:0061143 | alveolar primary septum development(GO:0061143) |
| 0.0 | 0.7 | GO:0045974 | miRNA mediated inhibition of translation(GO:0035278) negative regulation of translation, ncRNA-mediated(GO:0040033) regulation of translation, ncRNA-mediated(GO:0045974) |
| 0.0 | 0.7 | GO:0060334 | regulation of interferon-gamma-mediated signaling pathway(GO:0060334) |
| 0.0 | 0.2 | GO:0061364 | apoptotic process involved in luteolysis(GO:0061364) |
| 0.0 | 1.7 | GO:1900078 | positive regulation of cellular response to insulin stimulus(GO:1900078) |
| 0.0 | 0.7 | GO:0035518 | histone H2A monoubiquitination(GO:0035518) |
| 0.0 | 2.2 | GO:0001836 | release of cytochrome c from mitochondria(GO:0001836) |
| 0.0 | 0.1 | GO:0031247 | actin rod assembly(GO:0031247) |
| 0.0 | 5.2 | GO:0002377 | immunoglobulin production(GO:0002377) |
| 0.0 | 2.0 | GO:0007585 | respiratory gaseous exchange(GO:0007585) |
| 0.0 | 13.6 | GO:0006898 | receptor-mediated endocytosis(GO:0006898) |
| 0.0 | 2.5 | GO:0015701 | bicarbonate transport(GO:0015701) |
| 0.0 | 0.2 | GO:2000391 | regulation of neutrophil extravasation(GO:2000389) positive regulation of neutrophil extravasation(GO:2000391) |
| 0.0 | 0.9 | GO:1902284 | axon extension involved in axon guidance(GO:0048846) neuron projection extension involved in neuron projection guidance(GO:1902284) |
| 0.0 | 0.4 | GO:0032790 | ribosome disassembly(GO:0032790) |
| 0.0 | 1.2 | GO:0016578 | histone deubiquitination(GO:0016578) |
| 0.0 | 0.7 | GO:0007638 | mechanosensory behavior(GO:0007638) |
| 0.0 | 0.5 | GO:0043508 | negative regulation of JUN kinase activity(GO:0043508) |
| 0.0 | 0.3 | GO:0090656 | t-circle formation(GO:0090656) |
| 0.0 | 1.8 | GO:0000289 | nuclear-transcribed mRNA poly(A) tail shortening(GO:0000289) |
| 0.0 | 0.1 | GO:0071038 | exonucleolytic trimming involved in rRNA processing(GO:0000459) exonucleolytic trimming to generate mature 3'-end of 5.8S rRNA from tricistronic rRNA transcript (SSU-rRNA, 5.8S rRNA, LSU-rRNA)(GO:0000467) CUT catabolic process(GO:0071034) nuclear polyadenylation-dependent tRNA catabolic process(GO:0071038) CUT metabolic process(GO:0071043) polyadenylation-dependent snoRNA 3'-end processing(GO:0071051) |
| 0.0 | 0.1 | GO:0035166 | post-embryonic hemopoiesis(GO:0035166) |
| 0.0 | 0.6 | GO:0051639 | actin filament network formation(GO:0051639) |
| 0.0 | 7.9 | GO:0006897 | endocytosis(GO:0006897) |
| 0.0 | 0.9 | GO:0016574 | histone ubiquitination(GO:0016574) |
| 0.0 | 0.2 | GO:0042226 | interleukin-6 biosynthetic process(GO:0042226) |
| 0.0 | 0.6 | GO:0060445 | branching involved in salivary gland morphogenesis(GO:0060445) |
| 0.0 | 0.6 | GO:0035902 | response to immobilization stress(GO:0035902) |
| 0.0 | 0.4 | GO:0044364 | killing of cells of other organism(GO:0031640) disruption of cells of other organism(GO:0044364) |
| 0.0 | 2.6 | GO:0006614 | SRP-dependent cotranslational protein targeting to membrane(GO:0006614) |
| 0.0 | 2.0 | GO:0070301 | cellular response to hydrogen peroxide(GO:0070301) |
| 0.0 | 2.7 | GO:0090630 | activation of GTPase activity(GO:0090630) |
| 0.0 | 1.6 | GO:0030819 | positive regulation of cAMP biosynthetic process(GO:0030819) |
| 0.0 | 1.0 | GO:2000816 | negative regulation of mitotic sister chromatid separation(GO:2000816) |
| 0.0 | 1.2 | GO:0002763 | positive regulation of myeloid leukocyte differentiation(GO:0002763) |
| 0.0 | 1.4 | GO:0007588 | excretion(GO:0007588) |
| 0.0 | 0.4 | GO:0003334 | keratinocyte development(GO:0003334) |
| 0.0 | 0.4 | GO:0007171 | activation of transmembrane receptor protein tyrosine kinase activity(GO:0007171) |
| 0.0 | 0.7 | GO:0042035 | regulation of cytokine biosynthetic process(GO:0042035) |
| 0.0 | 0.2 | GO:0034626 | fatty acid elongation, saturated fatty acid(GO:0019367) fatty acid elongation, unsaturated fatty acid(GO:0019368) fatty acid elongation, monounsaturated fatty acid(GO:0034625) fatty acid elongation, polyunsaturated fatty acid(GO:0034626) |
| 0.0 | 0.7 | GO:0006270 | DNA replication initiation(GO:0006270) |
| 0.0 | 0.2 | GO:0051457 | maintenance of protein location in nucleus(GO:0051457) |
| 0.0 | 0.3 | GO:0015721 | bile acid and bile salt transport(GO:0015721) |
| 0.0 | 1.1 | GO:0070126 | mitochondrial translational termination(GO:0070126) |
Gene overrepresentation in cellular component category:
| Log-likelihood per target | Total log-likelihood | Term | Description |
|---|---|---|---|
| 3.0 | 12.2 | GO:0031838 | haptoglobin-hemoglobin complex(GO:0031838) |
| 2.2 | 12.9 | GO:0072557 | IPAF inflammasome complex(GO:0072557) |
| 1.8 | 23.1 | GO:0005577 | fibrinogen complex(GO:0005577) |
| 1.8 | 14.2 | GO:0034363 | intermediate-density lipoprotein particle(GO:0034363) |
| 1.2 | 6.1 | GO:1990742 | microvesicle(GO:1990742) |
| 1.1 | 52.3 | GO:0034364 | high-density lipoprotein particle(GO:0034364) |
| 1.1 | 112.8 | GO:0035580 | specific granule lumen(GO:0035580) |
| 0.9 | 10.6 | GO:0046696 | lipopolysaccharide receptor complex(GO:0046696) |
| 0.6 | 6.5 | GO:0042612 | MHC class I protein complex(GO:0042612) |
| 0.6 | 8.2 | GO:0070552 | BRISC complex(GO:0070552) |
| 0.6 | 7.9 | GO:0005833 | hemoglobin complex(GO:0005833) |
| 0.6 | 1.7 | GO:0071065 | alpha9-beta1 integrin-vascular cell adhesion molecule-1 complex(GO:0071065) |
| 0.5 | 4.9 | GO:0005579 | membrane attack complex(GO:0005579) |
| 0.5 | 4.2 | GO:0034688 | integrin alphaM-beta2 complex(GO:0034688) |
| 0.5 | 6.4 | GO:0097208 | alveolar lamellar body(GO:0097208) multivesicular body lumen(GO:0097486) |
| 0.4 | 1.2 | GO:0097679 | other organism cytoplasm(GO:0097679) |
| 0.4 | 2.4 | GO:0005896 | interleukin-6 receptor complex(GO:0005896) |
| 0.4 | 70.6 | GO:0035579 | specific granule membrane(GO:0035579) |
| 0.4 | 2.9 | GO:1990037 | Lewy body core(GO:1990037) |
| 0.3 | 2.0 | GO:0072559 | NLRP3 inflammasome complex(GO:0072559) |
| 0.3 | 6.6 | GO:0071682 | endocytic vesicle lumen(GO:0071682) |
| 0.3 | 3.4 | GO:0098559 | cytoplasmic side of early endosome membrane(GO:0098559) cytoplasmic side of late endosome membrane(GO:0098560) |
| 0.3 | 9.6 | GO:0036020 | endolysosome membrane(GO:0036020) |
| 0.3 | 3.6 | GO:0060171 | stereocilium membrane(GO:0060171) |
| 0.3 | 8.4 | GO:0042101 | T cell receptor complex(GO:0042101) |
| 0.3 | 39.6 | GO:0035578 | azurophil granule lumen(GO:0035578) |
| 0.3 | 3.1 | GO:1990712 | HFE-transferrin receptor complex(GO:1990712) |
| 0.2 | 2.4 | GO:0000220 | vacuolar proton-transporting V-type ATPase, V0 domain(GO:0000220) |
| 0.2 | 1.5 | GO:0071942 | XPC complex(GO:0071942) |
| 0.2 | 13.4 | GO:0001533 | cornified envelope(GO:0001533) |
| 0.2 | 36.6 | GO:0072562 | blood microparticle(GO:0072562) |
| 0.2 | 3.1 | GO:0042611 | MHC protein complex(GO:0042611) |
| 0.1 | 1.8 | GO:0000015 | phosphopyruvate hydratase complex(GO:0000015) |
| 0.1 | 1.3 | GO:0033179 | proton-transporting V-type ATPase, V0 domain(GO:0033179) |
| 0.1 | 0.7 | GO:0031205 | endoplasmic reticulum Sec complex(GO:0031205) |
| 0.1 | 5.9 | GO:0042629 | mast cell granule(GO:0042629) |
| 0.1 | 7.6 | GO:0070821 | tertiary granule membrane(GO:0070821) |
| 0.1 | 1.6 | GO:0033256 | I-kappaB/NF-kappaB complex(GO:0033256) |
| 0.1 | 3.3 | GO:0034992 | microtubule organizing center attachment site(GO:0034992) LINC complex(GO:0034993) |
| 0.1 | 2.5 | GO:0005885 | Arp2/3 protein complex(GO:0005885) |
| 0.1 | 9.6 | GO:0030134 | ER to Golgi transport vesicle(GO:0030134) |
| 0.1 | 2.1 | GO:0036056 | filtration diaphragm(GO:0036056) slit diaphragm(GO:0036057) |
| 0.1 | 1.5 | GO:0017146 | NMDA selective glutamate receptor complex(GO:0017146) |
| 0.1 | 1.3 | GO:0005587 | collagen type IV trimer(GO:0005587) |
| 0.1 | 2.0 | GO:0035102 | PRC1 complex(GO:0035102) |
| 0.1 | 2.1 | GO:0016281 | eukaryotic translation initiation factor 4F complex(GO:0016281) |
| 0.1 | 5.7 | GO:0032420 | stereocilium(GO:0032420) |
| 0.1 | 3.3 | GO:0032391 | photoreceptor connecting cilium(GO:0032391) |
| 0.1 | 1.9 | GO:0001931 | uropod(GO:0001931) cell trailing edge(GO:0031254) |
| 0.1 | 27.2 | GO:0009897 | external side of plasma membrane(GO:0009897) |
| 0.1 | 1.3 | GO:0098576 | lumenal side of membrane(GO:0098576) |
| 0.1 | 0.4 | GO:0045179 | apical cortex(GO:0045179) |
| 0.1 | 13.9 | GO:0005788 | endoplasmic reticulum lumen(GO:0005788) |
| 0.1 | 4.6 | GO:0035577 | azurophil granule membrane(GO:0035577) |
| 0.1 | 0.1 | GO:0005602 | complement component C1 complex(GO:0005602) |
| 0.1 | 9.1 | GO:0044439 | microbody part(GO:0044438) peroxisomal part(GO:0044439) |
| 0.1 | 5.2 | GO:0005811 | lipid particle(GO:0005811) |
| 0.1 | 1.0 | GO:0070971 | endoplasmic reticulum exit site(GO:0070971) |
| 0.0 | 9.5 | GO:0031225 | anchored component of membrane(GO:0031225) |
| 0.0 | 2.2 | GO:0016514 | SWI/SNF complex(GO:0016514) |
| 0.0 | 19.7 | GO:0016323 | basolateral plasma membrane(GO:0016323) |
| 0.0 | 1.4 | GO:0000145 | exocyst(GO:0000145) |
| 0.0 | 0.6 | GO:0005916 | fascia adherens(GO:0005916) |
| 0.0 | 3.2 | GO:0005834 | heterotrimeric G-protein complex(GO:0005834) |
| 0.0 | 0.6 | GO:0005750 | mitochondrial respiratory chain complex III(GO:0005750) respiratory chain complex III(GO:0045275) |
| 0.0 | 0.9 | GO:0070938 | contractile ring(GO:0070938) |
| 0.0 | 7.8 | GO:0005884 | actin filament(GO:0005884) |
| 0.0 | 3.8 | GO:0043195 | terminal bouton(GO:0043195) |
| 0.0 | 9.0 | GO:0034774 | secretory granule lumen(GO:0034774) |
| 0.0 | 2.0 | GO:0022627 | cytosolic small ribosomal subunit(GO:0022627) |
| 0.0 | 3.3 | GO:0005871 | kinesin complex(GO:0005871) |
| 0.0 | 53.5 | GO:0005615 | extracellular space(GO:0005615) |
| 0.0 | 0.8 | GO:0031932 | TORC2 complex(GO:0031932) |
| 0.0 | 4.9 | GO:0000932 | cytoplasmic mRNA processing body(GO:0000932) |
| 0.0 | 0.5 | GO:0017119 | Golgi transport complex(GO:0017119) |
| 0.0 | 4.1 | GO:0000118 | histone deacetylase complex(GO:0000118) |
| 0.0 | 1.5 | GO:0030173 | integral component of Golgi membrane(GO:0030173) |
| 0.0 | 0.5 | GO:1904813 | ficolin-1-rich granule(GO:0101002) ficolin-1-rich granule lumen(GO:1904813) |
| 0.0 | 0.4 | GO:0070775 | H3 histone acetyltransferase complex(GO:0070775) MOZ/MORF histone acetyltransferase complex(GO:0070776) |
| 0.0 | 1.7 | GO:0015030 | Cajal body(GO:0015030) |
| 0.0 | 4.8 | GO:0001650 | fibrillar center(GO:0001650) |
| 0.0 | 1.7 | GO:0022625 | cytosolic large ribosomal subunit(GO:0022625) |
| 0.0 | 1.1 | GO:0000315 | organellar large ribosomal subunit(GO:0000315) mitochondrial large ribosomal subunit(GO:0005762) |
| 0.0 | 2.5 | GO:0032587 | ruffle membrane(GO:0032587) |
| 0.0 | 3.0 | GO:0005578 | proteinaceous extracellular matrix(GO:0005578) |
| 0.0 | 0.3 | GO:0097038 | perinuclear endoplasmic reticulum(GO:0097038) |
| 0.0 | 0.1 | GO:0017109 | glutamate-cysteine ligase complex(GO:0017109) |
| 0.0 | 0.3 | GO:0005662 | DNA replication factor A complex(GO:0005662) |
| 0.0 | 0.7 | GO:0031519 | PcG protein complex(GO:0031519) |
| 0.0 | 1.2 | GO:0032580 | Golgi cisterna membrane(GO:0032580) |
Gene overrepresentation in molecular function category:
| Log-likelihood per target | Total log-likelihood | Term | Description |
|---|---|---|---|
| 5.1 | 15.3 | GO:0004411 | homogentisate 1,2-dioxygenase activity(GO:0004411) |
| 3.5 | 13.9 | GO:0033265 | choline binding(GO:0033265) |
| 2.7 | 10.9 | GO:0017159 | pantetheine hydrolase activity(GO:0017159) |
| 2.7 | 19.0 | GO:0030492 | hemoglobin binding(GO:0030492) |
| 2.4 | 9.7 | GO:0031731 | CCR6 chemokine receptor binding(GO:0031731) |
| 2.4 | 11.9 | GO:0047374 | methylumbelliferyl-acetate deacetylase activity(GO:0047374) |
| 2.3 | 18.1 | GO:0004873 | asialoglycoprotein receptor activity(GO:0004873) |
| 2.0 | 5.9 | GO:0008859 | exoribonuclease II activity(GO:0008859) |
| 1.9 | 5.7 | GO:0017129 | triglyceride binding(GO:0017129) |
| 1.7 | 11.8 | GO:0016841 | ammonia-lyase activity(GO:0016841) |
| 1.7 | 5.0 | GO:0004613 | phosphoenolpyruvate carboxykinase activity(GO:0004611) phosphoenolpyruvate carboxykinase (GTP) activity(GO:0004613) |
| 1.5 | 11.8 | GO:0035473 | lipase binding(GO:0035473) |
| 1.5 | 1.5 | GO:0015227 | acyl carnitine transmembrane transporter activity(GO:0015227) |
| 1.2 | 4.9 | GO:0004698 | calcium-dependent protein kinase C activity(GO:0004698) |
| 1.2 | 9.8 | GO:0016019 | peptidoglycan receptor activity(GO:0016019) |
| 1.2 | 8.2 | GO:0019862 | IgA binding(GO:0019862) |
| 1.2 | 4.7 | GO:0004074 | biliverdin reductase activity(GO:0004074) |
| 1.2 | 5.8 | GO:0070653 | high-density lipoprotein particle receptor binding(GO:0070653) |
| 1.1 | 20.0 | GO:0003796 | lysozyme activity(GO:0003796) |
| 1.1 | 4.3 | GO:0031727 | CCR2 chemokine receptor binding(GO:0031727) |
| 1.0 | 3.1 | GO:0004998 | transferrin receptor activity(GO:0004998) |
| 1.0 | 5.1 | GO:0005350 | pyrimidine nucleobase transmembrane transporter activity(GO:0005350) |
| 1.0 | 5.9 | GO:0004918 | interleukin-8 receptor activity(GO:0004918) |
| 1.0 | 4.8 | GO:0016822 | hydrolase activity, acting on acid carbon-carbon bonds(GO:0016822) hydrolase activity, acting on acid carbon-carbon bonds, in ketonic substances(GO:0016823) |
| 0.9 | 8.2 | GO:0004372 | glycine hydroxymethyltransferase activity(GO:0004372) threonine aldolase activity(GO:0004793) L-allo-threonine aldolase activity(GO:0008732) |
| 0.8 | 4.2 | GO:0004666 | prostaglandin-endoperoxide synthase activity(GO:0004666) arachidonate 15-lipoxygenase activity(GO:0050473) |
| 0.8 | 2.4 | GO:0004060 | arylamine N-acetyltransferase activity(GO:0004060) |
| 0.8 | 12.6 | GO:0004568 | chitinase activity(GO:0004568) |
| 0.8 | 3.9 | GO:0047006 | 17-alpha,20-alpha-dihydroxypregn-4-en-3-one dehydrogenase activity(GO:0047006) |
| 0.7 | 38.7 | GO:0042056 | chemoattractant activity(GO:0042056) |
| 0.6 | 3.9 | GO:0004522 | ribonuclease A activity(GO:0004522) |
| 0.6 | 3.1 | GO:0004910 | interleukin-1, Type II, blocking receptor activity(GO:0004910) |
| 0.6 | 2.4 | GO:0070119 | ciliary neurotrophic factor binding(GO:0070119) |
| 0.6 | 4.7 | GO:0001849 | complement component C1q binding(GO:0001849) |
| 0.6 | 5.8 | GO:0003835 | beta-galactoside alpha-2,6-sialyltransferase activity(GO:0003835) |
| 0.6 | 1.7 | GO:0015143 | urate transmembrane transporter activity(GO:0015143) salt transmembrane transporter activity(GO:1901702) |
| 0.5 | 13.1 | GO:0015174 | basic amino acid transmembrane transporter activity(GO:0015174) |
| 0.5 | 7.1 | GO:0030280 | structural constituent of epidermis(GO:0030280) |
| 0.5 | 9.9 | GO:0050700 | CARD domain binding(GO:0050700) |
| 0.5 | 8.3 | GO:0050786 | RAGE receptor binding(GO:0050786) |
| 0.5 | 7.6 | GO:0045236 | CXCR chemokine receptor binding(GO:0045236) |
| 0.5 | 1.5 | GO:0004421 | hydroxymethylglutaryl-CoA synthase activity(GO:0004421) |
| 0.5 | 4.5 | GO:0003828 | alpha-N-acetylneuraminate alpha-2,8-sialyltransferase activity(GO:0003828) |
| 0.5 | 5.0 | GO:0016724 | ferroxidase activity(GO:0004322) oxidoreductase activity, oxidizing metal ions, oxygen as acceptor(GO:0016724) |
| 0.5 | 2.9 | GO:0010861 | thyroid hormone receptor activator activity(GO:0010861) thyroid hormone receptor coactivator activity(GO:0030375) |
| 0.5 | 6.5 | GO:0031419 | cobalamin binding(GO:0031419) |
| 0.5 | 7.7 | GO:0004028 | 3-chloroallyl aldehyde dehydrogenase activity(GO:0004028) |
| 0.4 | 2.1 | GO:0016647 | oxidoreductase activity, acting on the CH-NH group of donors, oxygen as acceptor(GO:0016647) |
| 0.4 | 7.9 | GO:0005344 | oxygen transporter activity(GO:0005344) |
| 0.4 | 1.9 | GO:0004348 | glucosylceramidase activity(GO:0004348) |
| 0.4 | 4.2 | GO:0030369 | ICAM-3 receptor activity(GO:0030369) |
| 0.4 | 6.2 | GO:0019957 | C-C chemokine binding(GO:0019957) |
| 0.4 | 2.1 | GO:0072345 | NAADP-sensitive calcium-release channel activity(GO:0072345) |
| 0.3 | 15.8 | GO:0001972 | retinoic acid binding(GO:0001972) |
| 0.3 | 18.0 | GO:0005164 | tumor necrosis factor receptor binding(GO:0005164) |
| 0.3 | 1.3 | GO:0003858 | 3-hydroxybutyrate dehydrogenase activity(GO:0003858) |
| 0.3 | 7.5 | GO:0005522 | profilin binding(GO:0005522) |
| 0.3 | 13.7 | GO:0005001 | transmembrane receptor protein tyrosine phosphatase activity(GO:0005001) transmembrane receptor protein phosphatase activity(GO:0019198) |
| 0.3 | 9.0 | GO:0102391 | decanoate--CoA ligase activity(GO:0102391) |
| 0.3 | 2.1 | GO:0004499 | N,N-dimethylaniline monooxygenase activity(GO:0004499) |
| 0.3 | 0.9 | GO:0070538 | oleic acid binding(GO:0070538) |
| 0.3 | 3.1 | GO:0001758 | retinal dehydrogenase activity(GO:0001758) |
| 0.3 | 5.6 | GO:0038036 | sphingosine-1-phosphate receptor activity(GO:0038036) |
| 0.3 | 1.5 | GO:0043423 | 3-phosphoinositide-dependent protein kinase binding(GO:0043423) |
| 0.3 | 2.2 | GO:0008454 | alpha-1,3-mannosylglycoprotein 4-beta-N-acetylglucosaminyltransferase activity(GO:0008454) |
| 0.3 | 1.6 | GO:0047894 | flavonol 3-sulfotransferase activity(GO:0047894) |
| 0.3 | 1.5 | GO:0047493 | sphingomyelin synthase activity(GO:0033188) ceramide cholinephosphotransferase activity(GO:0047493) |
| 0.2 | 5.1 | GO:0008391 | arachidonic acid monooxygenase activity(GO:0008391) arachidonic acid epoxygenase activity(GO:0008392) |
| 0.2 | 2.1 | GO:0008379 | thioredoxin peroxidase activity(GO:0008379) |
| 0.2 | 5.3 | GO:0017110 | nucleoside-diphosphatase activity(GO:0017110) |
| 0.2 | 1.4 | GO:0043546 | molybdopterin cofactor binding(GO:0043546) |
| 0.2 | 4.1 | GO:0030881 | beta-2-microglobulin binding(GO:0030881) |
| 0.2 | 3.6 | GO:0001075 | transcription factor activity, RNA polymerase II core promoter sequence-specific binding involved in preinitiation complex assembly(GO:0001075) |
| 0.2 | 7.6 | GO:0008009 | chemokine activity(GO:0008009) |
| 0.2 | 2.2 | GO:0042834 | peptidoglycan binding(GO:0042834) |
| 0.2 | 0.7 | GO:0005139 | interleukin-7 receptor binding(GO:0005139) |
| 0.2 | 1.1 | GO:0023024 | MHC class I protein complex binding(GO:0023024) |
| 0.2 | 0.4 | GO:0004912 | interleukin-3 receptor activity(GO:0004912) |
| 0.2 | 1.8 | GO:0004024 | alcohol dehydrogenase activity, zinc-dependent(GO:0004024) |
| 0.2 | 2.3 | GO:0070892 | lipoteichoic acid receptor activity(GO:0070892) |
| 0.2 | 1.7 | GO:0008269 | JAK pathway signal transduction adaptor activity(GO:0008269) |
| 0.2 | 1.9 | GO:0016714 | oxidoreductase activity, acting on paired donors, with incorporation or reduction of molecular oxygen, reduced pteridine as one donor, and incorporation of one atom of oxygen(GO:0016714) |
| 0.2 | 14.6 | GO:0005160 | transforming growth factor beta receptor binding(GO:0005160) |
| 0.2 | 2.4 | GO:0015279 | store-operated calcium channel activity(GO:0015279) |
| 0.2 | 0.6 | GO:0036326 | VEGF-A-activated receptor activity(GO:0036326) VEGF-B-activated receptor activity(GO:0036327) placental growth factor-activated receptor activity(GO:0036332) |
| 0.2 | 6.6 | GO:0042605 | peptide antigen binding(GO:0042605) |
| 0.2 | 0.7 | GO:0005260 | channel-conductance-controlling ATPase activity(GO:0005260) |
| 0.2 | 2.7 | GO:0000774 | adenyl-nucleotide exchange factor activity(GO:0000774) |
| 0.2 | 0.7 | GO:0061752 | telomeric repeat-containing RNA binding(GO:0061752) |
| 0.2 | 1.8 | GO:0015016 | [heparan sulfate]-glucosamine N-sulfotransferase activity(GO:0015016) |
| 0.2 | 7.3 | GO:0015347 | sodium-independent organic anion transmembrane transporter activity(GO:0015347) |
| 0.2 | 1.1 | GO:0046624 | sphingolipid transporter activity(GO:0046624) |
| 0.2 | 5.7 | GO:0004806 | triglyceride lipase activity(GO:0004806) |
| 0.2 | 1.1 | GO:0008508 | bile acid:sodium symporter activity(GO:0008508) |
| 0.2 | 1.7 | GO:0008131 | primary amine oxidase activity(GO:0008131) |
| 0.1 | 1.8 | GO:0004634 | phosphopyruvate hydratase activity(GO:0004634) |
| 0.1 | 15.7 | GO:0004869 | cysteine-type endopeptidase inhibitor activity(GO:0004869) |
| 0.1 | 2.9 | GO:0051400 | BH domain binding(GO:0051400) |
| 0.1 | 3.5 | GO:0005041 | low-density lipoprotein receptor activity(GO:0005041) |
| 0.1 | 1.7 | GO:0015165 | pyrimidine nucleotide-sugar transmembrane transporter activity(GO:0015165) |
| 0.1 | 0.4 | GO:0015140 | malate transmembrane transporter activity(GO:0015140) |
| 0.1 | 6.4 | GO:0005540 | hyaluronic acid binding(GO:0005540) |
| 0.1 | 1.9 | GO:0051525 | NFAT protein binding(GO:0051525) |
| 0.1 | 3.0 | GO:0004955 | prostaglandin receptor activity(GO:0004955) |
| 0.1 | 0.5 | GO:0004937 | alpha1-adrenergic receptor activity(GO:0004937) |
| 0.1 | 1.8 | GO:0033192 | calmodulin-dependent protein phosphatase activity(GO:0033192) |
| 0.1 | 49.0 | GO:0004252 | serine-type endopeptidase activity(GO:0004252) |
| 0.1 | 0.7 | GO:0004914 | interleukin-5 receptor activity(GO:0004914) |
| 0.1 | 0.7 | GO:0004906 | interferon-gamma receptor activity(GO:0004906) |
| 0.1 | 3.4 | GO:0045028 | G-protein coupled nucleotide receptor activity(GO:0001608) G-protein coupled purinergic nucleotide receptor activity(GO:0045028) |
| 0.1 | 2.1 | GO:0001848 | complement binding(GO:0001848) |
| 0.1 | 0.7 | GO:0004977 | melanocortin receptor activity(GO:0004977) |
| 0.1 | 1.0 | GO:0005499 | vitamin D binding(GO:0005499) |
| 0.1 | 9.6 | GO:0030374 | ligand-dependent nuclear receptor transcription coactivator activity(GO:0030374) |
| 0.1 | 4.1 | GO:0031078 | histone deacetylase activity (H3-K14 specific)(GO:0031078) NAD-dependent histone deacetylase activity (H3-K14 specific)(GO:0032041) |
| 0.1 | 1.4 | GO:0015272 | ATP-activated inward rectifier potassium channel activity(GO:0015272) |
| 0.1 | 1.2 | GO:0047623 | AMP deaminase activity(GO:0003876) adenosine-phosphate deaminase activity(GO:0047623) |
| 0.1 | 3.2 | GO:0001871 | pattern binding(GO:0001871) polysaccharide binding(GO:0030247) |
| 0.1 | 0.3 | GO:0052642 | lysophosphatidic acid phosphatase activity(GO:0052642) |
| 0.1 | 2.3 | GO:0005149 | interleukin-1 receptor binding(GO:0005149) |
| 0.1 | 3.7 | GO:0044769 | ATPase activity, coupled to transmembrane movement of ions, rotational mechanism(GO:0044769) proton-transporting ATPase activity, rotational mechanism(GO:0046961) |
| 0.1 | 11.5 | GO:0019003 | GDP binding(GO:0019003) |
| 0.1 | 0.3 | GO:0034437 | glycoprotein transporter activity(GO:0034437) |
| 0.1 | 1.0 | GO:0008440 | inositol-1,4,5-trisphosphate 3-kinase activity(GO:0008440) |
| 0.1 | 2.9 | GO:0008510 | sodium:bicarbonate symporter activity(GO:0008510) |
| 0.1 | 1.8 | GO:0003688 | DNA replication origin binding(GO:0003688) |
| 0.1 | 2.9 | GO:0001087 | transcription factor activity, sequence-specific DNA binding, RNA polymerase recruiting(GO:0001011) transcription factor activity, TFIIB-class binding(GO:0001087) |
| 0.1 | 3.5 | GO:0004181 | metallocarboxypeptidase activity(GO:0004181) |
| 0.1 | 2.5 | GO:0035925 | mRNA 3'-UTR AU-rich region binding(GO:0035925) |
| 0.1 | 2.9 | GO:0001965 | G-protein alpha-subunit binding(GO:0001965) |
| 0.1 | 0.5 | GO:0071074 | eukaryotic initiation factor eIF2 binding(GO:0071074) |
| 0.1 | 15.5 | GO:0002020 | protease binding(GO:0002020) |
| 0.1 | 2.6 | GO:0016676 | cytochrome-c oxidase activity(GO:0004129) heme-copper terminal oxidase activity(GO:0015002) oxidoreductase activity, acting on a heme group of donors, oxygen as acceptor(GO:0016676) |
| 0.1 | 2.3 | GO:0019992 | diacylglycerol binding(GO:0019992) |
| 0.1 | 3.8 | GO:1990841 | promoter-specific chromatin binding(GO:1990841) |
| 0.1 | 4.0 | GO:0034987 | immunoglobulin receptor binding(GO:0034987) |
| 0.1 | 10.2 | GO:0003725 | double-stranded RNA binding(GO:0003725) |
| 0.1 | 4.3 | GO:0005507 | copper ion binding(GO:0005507) |
| 0.1 | 0.7 | GO:0039706 | co-receptor binding(GO:0039706) |
| 0.1 | 3.0 | GO:0005044 | scavenger receptor activity(GO:0005044) |
| 0.1 | 3.6 | GO:0071889 | 14-3-3 protein binding(GO:0071889) |
| 0.1 | 1.2 | GO:0015377 | cation:chloride symporter activity(GO:0015377) |
| 0.1 | 3.4 | GO:0050699 | WW domain binding(GO:0050699) |
| 0.1 | 2.8 | GO:0003950 | NAD+ ADP-ribosyltransferase activity(GO:0003950) |
| 0.1 | 6.8 | GO:0004867 | serine-type endopeptidase inhibitor activity(GO:0004867) |
| 0.1 | 7.4 | GO:0004896 | cytokine receptor activity(GO:0004896) |
| 0.1 | 1.2 | GO:0015095 | magnesium ion transmembrane transporter activity(GO:0015095) |
| 0.1 | 0.4 | GO:0010997 | anaphase-promoting complex binding(GO:0010997) |
| 0.0 | 0.3 | GO:0004301 | epoxide hydrolase activity(GO:0004301) |
| 0.0 | 1.8 | GO:0048027 | mRNA 5'-UTR binding(GO:0048027) |
| 0.0 | 0.3 | GO:0004826 | phenylalanine-tRNA ligase activity(GO:0004826) |
| 0.0 | 1.0 | GO:0043395 | heparan sulfate proteoglycan binding(GO:0043395) |
| 0.0 | 1.6 | GO:0003951 | NAD+ kinase activity(GO:0003951) |
| 0.0 | 1.0 | GO:0008656 | cysteine-type endopeptidase activator activity involved in apoptotic process(GO:0008656) |
| 0.0 | 1.1 | GO:0032183 | SUMO binding(GO:0032183) |
| 0.0 | 0.8 | GO:0004089 | carbonate dehydratase activity(GO:0004089) |
| 0.0 | 0.9 | GO:0042288 | MHC class I protein binding(GO:0042288) |
| 0.0 | 3.9 | GO:0003823 | antigen binding(GO:0003823) |
| 0.0 | 1.7 | GO:0005521 | lamin binding(GO:0005521) |
| 0.0 | 0.7 | GO:0016832 | aldehyde-lyase activity(GO:0016832) |
| 0.0 | 0.4 | GO:0043023 | ribosomal large subunit binding(GO:0043023) |
| 0.0 | 0.3 | GO:0022897 | peptide:proton symporter activity(GO:0015333) proton-dependent peptide secondary active transmembrane transporter activity(GO:0022897) |
| 0.0 | 0.8 | GO:0016500 | protein-hormone receptor activity(GO:0016500) |
| 0.0 | 0.5 | GO:0008097 | 5S rRNA binding(GO:0008097) |
| 0.0 | 1.5 | GO:0008157 | protein phosphatase 1 binding(GO:0008157) |
| 0.0 | 0.4 | GO:0004849 | uridine kinase activity(GO:0004849) |
| 0.0 | 2.1 | GO:0061631 | ubiquitin conjugating enzyme activity(GO:0061631) |
| 0.0 | 0.2 | GO:0005324 | long-chain fatty acid transporter activity(GO:0005324) |
| 0.0 | 1.1 | GO:0005544 | calcium-dependent phospholipid binding(GO:0005544) |
| 0.0 | 0.6 | GO:0047372 | acylglycerol lipase activity(GO:0047372) |
| 0.0 | 0.9 | GO:0035259 | glucocorticoid receptor binding(GO:0035259) |
| 0.0 | 3.2 | GO:0005546 | phosphatidylinositol-4,5-bisphosphate binding(GO:0005546) |
| 0.0 | 0.3 | GO:0035312 | 5'-3' exodeoxyribonuclease activity(GO:0035312) |
| 0.0 | 1.0 | GO:0030414 | peptidase inhibitor activity(GO:0030414) |
| 0.0 | 2.1 | GO:0005154 | epidermal growth factor receptor binding(GO:0005154) |
| 0.0 | 0.4 | GO:0015280 | ligand-gated sodium channel activity(GO:0015280) |
| 0.0 | 2.6 | GO:0098531 | RNA polymerase II transcription factor activity, ligand-activated sequence-specific DNA binding(GO:0004879) transcription factor activity, direct ligand regulated sequence-specific DNA binding(GO:0098531) |
| 0.0 | 2.5 | GO:0070851 | growth factor receptor binding(GO:0070851) |
| 0.0 | 1.1 | GO:0051019 | mitogen-activated protein kinase binding(GO:0051019) |
| 0.0 | 8.8 | GO:0030246 | carbohydrate binding(GO:0030246) |
| 0.0 | 2.6 | GO:0048365 | Rac GTPase binding(GO:0048365) |
| 0.0 | 29.7 | GO:0042803 | protein homodimerization activity(GO:0042803) |
| 0.0 | 0.2 | GO:0010857 | calcium-dependent protein serine/threonine kinase activity(GO:0009931) calcium-dependent protein kinase activity(GO:0010857) |
| 0.0 | 1.9 | GO:0004715 | non-membrane spanning protein tyrosine kinase activity(GO:0004715) |
| 0.0 | 0.3 | GO:0097617 | annealing helicase activity(GO:0036310) annealing activity(GO:0097617) |
| 0.0 | 0.3 | GO:0015248 | sterol transporter activity(GO:0015248) |
| 0.0 | 0.6 | GO:0004708 | MAP kinase kinase activity(GO:0004708) |
| 0.0 | 8.1 | GO:0008017 | microtubule binding(GO:0008017) |
| 0.0 | 3.1 | GO:0000149 | SNARE binding(GO:0000149) |
| 0.0 | 0.1 | GO:0004966 | galanin receptor activity(GO:0004966) |
| 0.0 | 0.7 | GO:0005385 | zinc ion transmembrane transporter activity(GO:0005385) |
| 0.0 | 1.5 | GO:0003684 | damaged DNA binding(GO:0003684) |
| 0.0 | 0.1 | GO:0046790 | virion binding(GO:0046790) |
| 0.0 | 4.4 | GO:0001664 | G-protein coupled receptor binding(GO:0001664) |
| 0.0 | 2.0 | GO:0005125 | cytokine activity(GO:0005125) |
| 0.0 | 0.6 | GO:0008188 | neuropeptide receptor activity(GO:0008188) |
| 0.0 | 0.2 | GO:0008046 | axon guidance receptor activity(GO:0008046) |
| 0.0 | 0.2 | GO:0102336 | fatty acid elongase activity(GO:0009922) 3-oxo-arachidoyl-CoA synthase activity(GO:0102336) 3-oxo-cerotoyl-CoA synthase activity(GO:0102337) 3-oxo-lignoceronyl-CoA synthase activity(GO:0102338) |
| 0.0 | 1.0 | GO:0001102 | RNA polymerase II activating transcription factor binding(GO:0001102) |
| 0.0 | 0.4 | GO:0004012 | phospholipid-translocating ATPase activity(GO:0004012) |
| 0.0 | 0.1 | GO:0004357 | glutamate-cysteine ligase activity(GO:0004357) |
| 0.0 | 0.7 | GO:0015485 | cholesterol binding(GO:0015485) |
| 0.0 | 0.3 | GO:0005527 | macrolide binding(GO:0005527) FK506 binding(GO:0005528) |
| 0.0 | 2.7 | GO:0017137 | Rab GTPase binding(GO:0017137) |
| 0.0 | 0.8 | GO:0050681 | androgen receptor binding(GO:0050681) |
| 0.0 | 1.4 | GO:0046906 | heme binding(GO:0020037) tetrapyrrole binding(GO:0046906) |
| 0.0 | 0.1 | GO:0008312 | 7S RNA binding(GO:0008312) |
| 0.0 | 2.3 | GO:0003735 | structural constituent of ribosome(GO:0003735) |
Gene overrepresentation in curated gene sets: canonical pathways category:
| Log-likelihood per target | Total log-likelihood | Term | Description |
|---|---|---|---|
| 0.6 | 39.7 | PID INTEGRIN2 PATHWAY | Beta2 integrin cell surface interactions |
| 0.4 | 19.3 | PID TOLL ENDOGENOUS PATHWAY | Endogenous TLR signaling |
| 0.4 | 11.9 | SA PROGRAMMED CELL DEATH | Programmed cell death, or apoptosis, eliminates damaged or unneeded cells. |
| 0.3 | 12.9 | PID ANTHRAX PATHWAY | Cellular roles of Anthrax toxin |
| 0.2 | 9.2 | PID S1P S1P1 PATHWAY | S1P1 pathway |
| 0.2 | 15.8 | PID CD40 PATHWAY | CD40/CD40L signaling |
| 0.2 | 7.0 | ST ADRENERGIC | Adrenergic Pathway |
| 0.2 | 15.1 | PID IL6 7 PATHWAY | IL6-mediated signaling events |
| 0.2 | 9.8 | PID IL1 PATHWAY | IL1-mediated signaling events |
| 0.2 | 5.5 | PID ERB GENOMIC PATHWAY | Validated nuclear estrogen receptor beta network |
| 0.2 | 9.8 | PID AMB2 NEUTROPHILS PATHWAY | amb2 Integrin signaling |
| 0.2 | 11.9 | PID IL12 2PATHWAY | IL12-mediated signaling events |
| 0.2 | 27.2 | PID CMYB PATHWAY | C-MYB transcription factor network |
| 0.2 | 2.6 | PID IL23 PATHWAY | IL23-mediated signaling events |
| 0.2 | 17.5 | PID CD8 TCR PATHWAY | TCR signaling in naïve CD8+ T cells |
| 0.1 | 8.6 | PID FCER1 PATHWAY | Fc-epsilon receptor I signaling in mast cells |
| 0.1 | 5.8 | ST GRANULE CELL SURVIVAL PATHWAY | Granule Cell Survival Pathway is a specific case of more general PAC1 Receptor Pathway. |
| 0.1 | 2.4 | PID EPO PATHWAY | EPO signaling pathway |
| 0.1 | 2.2 | PID NECTIN PATHWAY | Nectin adhesion pathway |
| 0.1 | 3.2 | PID IL2 1PATHWAY | IL2-mediated signaling events |
| 0.1 | 0.7 | PID IL5 PATHWAY | IL5-mediated signaling events |
| 0.1 | 7.8 | PID HNF3B PATHWAY | FOXA2 and FOXA3 transcription factor networks |
| 0.1 | 8.6 | PID AP1 PATHWAY | AP-1 transcription factor network |
| 0.1 | 2.9 | PID BCR 5PATHWAY | BCR signaling pathway |
| 0.1 | 2.6 | PID NFKAPPAB CANONICAL PATHWAY | Canonical NF-kappaB pathway |
| 0.1 | 2.7 | SA MMP CYTOKINE CONNECTION | Cytokines can induce activation of matrix metalloproteinases, which degrade extracellular matrix. |
| 0.1 | 3.8 | PID LIS1 PATHWAY | Lissencephaly gene (LIS1) in neuronal migration and development |
| 0.1 | 24.1 | NABA ECM AFFILIATED | Genes encoding proteins affiliated structurally or functionally to extracellular matrix proteins |
| 0.1 | 0.4 | PID IL3 PATHWAY | IL3-mediated signaling events |
| 0.1 | 34.0 | NABA SECRETED FACTORS | Genes encoding secreted soluble factors |
| 0.1 | 6.4 | PID ERA GENOMIC PATHWAY | Validated nuclear estrogen receptor alpha network |
| 0.1 | 3.4 | PID TXA2PATHWAY | Thromboxane A2 receptor signaling |
| 0.1 | 5.6 | PID HIF1 TFPATHWAY | HIF-1-alpha transcription factor network |
| 0.1 | 0.6 | PID S1P S1P3 PATHWAY | S1P3 pathway |
| 0.1 | 0.8 | PID CXCR3 PATHWAY | CXCR3-mediated signaling events |
| 0.0 | 1.2 | PID RETINOIC ACID PATHWAY | Retinoic acid receptors-mediated signaling |
| 0.0 | 2.4 | PID FOXO PATHWAY | FoxO family signaling |
| 0.0 | 5.8 | PID BETA CATENIN NUC PATHWAY | Regulation of nuclear beta catenin signaling and target gene transcription |
| 0.0 | 7.7 | PID P53 DOWNSTREAM PATHWAY | Direct p53 effectors |
| 0.0 | 6.1 | PID PDGFRB PATHWAY | PDGFR-beta signaling pathway |
| 0.0 | 15.6 | NABA MATRISOME ASSOCIATED | Ensemble of genes encoding ECM-associated proteins including ECM-affilaited proteins, ECM regulators and secreted factors |
| 0.0 | 2.5 | PID MTOR 4PATHWAY | mTOR signaling pathway |
| 0.0 | 0.7 | SA CASPASE CASCADE | Apoptosis is mediated by caspases, cysteine proteases arranged in a proteolytic cascade. |
| 0.0 | 0.9 | PID ANGIOPOIETIN RECEPTOR PATHWAY | Angiopoietin receptor Tie2-mediated signaling |
| 0.0 | 2.0 | PID HDAC CLASSII PATHWAY | Signaling events mediated by HDAC Class II |
| 0.0 | 1.0 | PID PRL SIGNALING EVENTS PATHWAY | Signaling events mediated by PRL |
| 0.0 | 0.7 | PID KIT PATHWAY | Signaling events mediated by Stem cell factor receptor (c-Kit) |
| 0.0 | 1.3 | PID RXR VDR PATHWAY | RXR and RAR heterodimerization with other nuclear receptor |
| 0.0 | 0.5 | PID PTP1B PATHWAY | Signaling events mediated by PTP1B |
| 0.0 | 0.6 | PID P38 MK2 PATHWAY | p38 signaling mediated by MAPKAP kinases |
| 0.0 | 1.4 | ST FAS SIGNALING PATHWAY | Fas Signaling Pathway |
| 0.0 | 1.2 | PID BMP PATHWAY | BMP receptor signaling |
| 0.0 | 0.6 | PID SYNDECAN 4 PATHWAY | Syndecan-4-mediated signaling events |
| 0.0 | 0.5 | PID LYSOPHOSPHOLIPID PATHWAY | LPA receptor mediated events |
| 0.0 | 0.8 | PID AURORA A PATHWAY | Aurora A signaling |
| 0.0 | 1.2 | PID TRKR PATHWAY | Neurotrophic factor-mediated Trk receptor signaling |
| 0.0 | 0.7 | ST WNT BETA CATENIN PATHWAY | Wnt/beta-catenin Pathway |
| 0.0 | 0.3 | PID NFAT 3PATHWAY | Role of Calcineurin-dependent NFAT signaling in lymphocytes |
| 0.0 | 0.4 | NABA BASEMENT MEMBRANES | Genes encoding structural components of basement membranes |
Gene overrepresentation in curated gene sets: REACTOME pathways category:
| Log-likelihood per target | Total log-likelihood | Term | Description |
|---|---|---|---|
| 1.9 | 35.4 | REACTOME COMMON PATHWAY | Genes involved in Common Pathway |
| 1.3 | 34.2 | REACTOME REGULATION OF COMPLEMENT CASCADE | Genes involved in Regulation of Complement cascade |
| 1.1 | 54.7 | REACTOME DEFENSINS | Genes involved in Defensins |
| 0.9 | 12.4 | REACTOME CREATION OF C4 AND C2 ACTIVATORS | Genes involved in Creation of C4 and C2 activators |
| 0.8 | 9.6 | REACTOME TRAF6 MEDIATED IRF7 ACTIVATION IN TLR7 8 OR 9 SIGNALING | Genes involved in TRAF6 mediated IRF7 activation in TLR7/8 or 9 signaling |
| 0.7 | 17.6 | REACTOME CHYLOMICRON MEDIATED LIPID TRANSPORT | Genes involved in Chylomicron-mediated lipid transport |
| 0.7 | 6.8 | REACTOME ENDOSOMAL VACUOLAR PATHWAY | Genes involved in Endosomal/Vacuolar pathway |
| 0.6 | 28.6 | REACTOME AMYLOIDS | Genes involved in Amyloids |
| 0.6 | 9.9 | REACTOME THE NLRP3 INFLAMMASOME | Genes involved in The NLRP3 inflammasome |
| 0.6 | 23.3 | REACTOME DEGRADATION OF THE EXTRACELLULAR MATRIX | Genes involved in Degradation of the extracellular matrix |
| 0.5 | 15.3 | REACTOME PHOSPHORYLATION OF CD3 AND TCR ZETA CHAINS | Genes involved in Phosphorylation of CD3 and TCR zeta chains |
| 0.5 | 10.7 | REACTOME IKK COMPLEX RECRUITMENT MEDIATED BY RIP1 | Genes involved in IKK complex recruitment mediated by RIP1 |
| 0.5 | 4.9 | REACTOME COMPLEMENT CASCADE | Genes involved in Complement cascade |
| 0.4 | 29.1 | REACTOME CHEMOKINE RECEPTORS BIND CHEMOKINES | Genes involved in Chemokine receptors bind chemokines |
| 0.4 | 8.3 | REACTOME RIP MEDIATED NFKB ACTIVATION VIA DAI | Genes involved in RIP-mediated NFkB activation via DAI |
| 0.3 | 4.8 | REACTOME TRYPTOPHAN CATABOLISM | Genes involved in Tryptophan catabolism |
| 0.3 | 6.0 | REACTOME HDL MEDIATED LIPID TRANSPORT | Genes involved in HDL-mediated lipid transport |
| 0.3 | 9.6 | REACTOME GLUCURONIDATION | Genes involved in Glucuronidation |
| 0.3 | 7.3 | REACTOME TRANSPORT OF ORGANIC ANIONS | Genes involved in Transport of organic anions |
| 0.3 | 7.5 | REACTOME HYALURONAN UPTAKE AND DEGRADATION | Genes involved in Hyaluronan uptake and degradation |
| 0.3 | 5.1 | REACTOME PASSIVE TRANSPORT BY AQUAPORINS | Genes involved in Passive Transport by Aquaporins |
| 0.3 | 8.0 | REACTOME ALPHA LINOLENIC ACID ALA METABOLISM | Genes involved in alpha-linolenic acid (ALA) metabolism |
| 0.3 | 6.6 | REACTOME INTRINSIC PATHWAY | Genes involved in Intrinsic Pathway |
| 0.3 | 5.1 | REACTOME XENOBIOTICS | Genes involved in Xenobiotics |
| 0.3 | 8.0 | REACTOME N GLYCAN ANTENNAE ELONGATION | Genes involved in N-Glycan antennae elongation |
| 0.3 | 5.0 | REACTOME ABACAVIR TRANSPORT AND METABOLISM | Genes involved in Abacavir transport and metabolism |
| 0.3 | 3.4 | REACTOME PROSTANOID LIGAND RECEPTORS | Genes involved in Prostanoid ligand receptors |
| 0.2 | 5.6 | REACTOME SIGNAL REGULATORY PROTEIN SIRP FAMILY INTERACTIONS | Genes involved in Signal regulatory protein (SIRP) family interactions |
| 0.2 | 2.6 | REACTOME ACTIVATED TAK1 MEDIATES P38 MAPK ACTIVATION | Genes involved in activated TAK1 mediates p38 MAPK activation |
| 0.2 | 2.5 | REACTOME RECYCLING OF BILE ACIDS AND SALTS | Genes involved in Recycling of bile acids and salts |
| 0.2 | 7.5 | REACTOME GRB2 SOS PROVIDES LINKAGE TO MAPK SIGNALING FOR INTERGRINS | Genes involved in GRB2:SOS provides linkage to MAPK signaling for Intergrins |
| 0.2 | 12.5 | REACTOME IL1 SIGNALING | Genes involved in Interleukin-1 signaling |
| 0.2 | 3.0 | REACTOME INFLAMMASOMES | Genes involved in Inflammasomes |
| 0.2 | 2.4 | REACTOME ROLE OF SECOND MESSENGERS IN NETRIN1 SIGNALING | Genes involved in Role of second messengers in netrin-1 signaling |
| 0.2 | 10.8 | REACTOME IRON UPTAKE AND TRANSPORT | Genes involved in Iron uptake and transport |
| 0.1 | 3.4 | REACTOME P2Y RECEPTORS | Genes involved in P2Y receptors |
| 0.1 | 9.0 | REACTOME BASIGIN INTERACTIONS | Genes involved in Basigin interactions |
| 0.1 | 6.6 | REACTOME YAP1 AND WWTR1 TAZ STIMULATED GENE EXPRESSION | Genes involved in YAP1- and WWTR1 (TAZ)-stimulated gene expression |
| 0.1 | 3.8 | REACTOME NOD1 2 SIGNALING PATHWAY | Genes involved in NOD1/2 Signaling Pathway |
| 0.1 | 2.4 | REACTOME IL 6 SIGNALING | Genes involved in Interleukin-6 signaling |
| 0.1 | 5.5 | REACTOME TIGHT JUNCTION INTERACTIONS | Genes involved in Tight junction interactions |
| 0.1 | 3.7 | REACTOME SYNTHESIS OF VERY LONG CHAIN FATTY ACYL COAS | Genes involved in Synthesis of very long-chain fatty acyl-CoAs |
| 0.1 | 1.8 | REACTOME ETHANOL OXIDATION | Genes involved in Ethanol oxidation |
| 0.1 | 6.5 | REACTOME PHASE1 FUNCTIONALIZATION OF COMPOUNDS | Genes involved in Phase 1 - Functionalization of compounds |
| 0.1 | 7.7 | REACTOME CELL SURFACE INTERACTIONS AT THE VASCULAR WALL | Genes involved in Cell surface interactions at the vascular wall |
| 0.1 | 7.4 | REACTOME COSTIMULATION BY THE CD28 FAMILY | Genes involved in Costimulation by the CD28 family |
| 0.1 | 19.7 | REACTOME G ALPHA I SIGNALLING EVENTS | Genes involved in G alpha (i) signalling events |
| 0.1 | 7.3 | REACTOME INTERFERON GAMMA SIGNALING | Genes involved in Interferon gamma signaling |
| 0.1 | 2.3 | REACTOME INTEGRIN ALPHAIIB BETA3 SIGNALING | Genes involved in Integrin alphaIIb beta3 signaling |
| 0.1 | 4.4 | REACTOME INTERFERON ALPHA BETA SIGNALING | Genes involved in Interferon alpha/beta signaling |
| 0.1 | 2.9 | REACTOME ACTIVATION OF GENES BY ATF4 | Genes involved in Activation of Genes by ATF4 |
| 0.1 | 3.8 | REACTOME PI3K EVENTS IN ERBB4 SIGNALING | Genes involved in PI3K events in ERBB4 signaling |
| 0.1 | 1.6 | REACTOME CYTOSOLIC SULFONATION OF SMALL MOLECULES | Genes involved in Cytosolic sulfonation of small molecules |
| 0.1 | 1.7 | REACTOME FACILITATIVE NA INDEPENDENT GLUCOSE TRANSPORTERS | Genes involved in Facilitative Na+-independent glucose transporters |
| 0.1 | 1.0 | REACTOME SCFSKP2 MEDIATED DEGRADATION OF P27 P21 | Genes involved in SCF(Skp2)-mediated degradation of p27/p21 |
| 0.1 | 8.7 | REACTOME PPARA ACTIVATES GENE EXPRESSION | Genes involved in PPARA Activates Gene Expression |
| 0.1 | 2.6 | REACTOME SIGNALING BY BMP | Genes involved in Signaling by BMP |
| 0.1 | 0.7 | REACTOME IL 7 SIGNALING | Genes involved in Interleukin-7 signaling |
| 0.1 | 3.4 | REACTOME SIGNALING BY ROBO RECEPTOR | Genes involved in Signaling by Robo receptor |
| 0.0 | 1.1 | REACTOME ANTIGEN PRESENTATION FOLDING ASSEMBLY AND PEPTIDE LOADING OF CLASS I MHC | Genes involved in Antigen Presentation: Folding, assembly and peptide loading of class I MHC |
| 0.0 | 0.8 | REACTOME REVERSIBLE HYDRATION OF CARBON DIOXIDE | Genes involved in Reversible Hydration of Carbon Dioxide |
| 0.0 | 2.7 | REACTOME SIGNALING BY ILS | Genes involved in Signaling by Interleukins |
| 0.0 | 1.2 | REACTOME PURINE SALVAGE | Genes involved in Purine salvage |
| 0.0 | 1.7 | REACTOME GROWTH HORMONE RECEPTOR SIGNALING | Genes involved in Growth hormone receptor signaling |
| 0.0 | 2.1 | REACTOME DEADENYLATION OF MRNA | Genes involved in Deadenylation of mRNA |
| 0.0 | 0.4 | REACTOME REGULATION OF WATER BALANCE BY RENAL AQUAPORINS | Genes involved in Regulation of Water Balance by Renal Aquaporins |
| 0.0 | 3.3 | REACTOME MEIOTIC SYNAPSIS | Genes involved in Meiotic Synapsis |
| 0.0 | 11.6 | REACTOME METABOLISM OF AMINO ACIDS AND DERIVATIVES | Genes involved in Metabolism of amino acids and derivatives |
| 0.0 | 1.5 | REACTOME FORMATION OF INCISION COMPLEX IN GG NER | Genes involved in Formation of incision complex in GG-NER |
| 0.0 | 6.4 | REACTOME FACTORS INVOLVED IN MEGAKARYOCYTE DEVELOPMENT AND PLATELET PRODUCTION | Genes involved in Factors involved in megakaryocyte development and platelet production |
| 0.0 | 1.2 | REACTOME TERMINATION OF O GLYCAN BIOSYNTHESIS | Genes involved in Termination of O-glycan biosynthesis |
| 0.0 | 2.9 | REACTOME IMMUNOREGULATORY INTERACTIONS BETWEEN A LYMPHOID AND A NON LYMPHOID CELL | Genes involved in Immunoregulatory interactions between a Lymphoid and a non-Lymphoid cell |
| 0.0 | 2.2 | REACTOME GLUCONEOGENESIS | Genes involved in Gluconeogenesis |
| 0.0 | 1.4 | REACTOME INWARDLY RECTIFYING K CHANNELS | Genes involved in Inwardly rectifying K+ channels |
| 0.0 | 0.7 | REACTOME METABOLISM OF PORPHYRINS | Genes involved in Metabolism of porphyrins |
| 0.0 | 0.2 | REACTOME SPRY REGULATION OF FGF SIGNALING | Genes involved in Spry regulation of FGF signaling |
| 0.0 | 0.4 | REACTOME BILE SALT AND ORGANIC ANION SLC TRANSPORTERS | Genes involved in Bile salt and organic anion SLC transporters |
| 0.0 | 0.4 | REACTOME LATENT INFECTION OF HOMO SAPIENS WITH MYCOBACTERIUM TUBERCULOSIS | Genes involved in Latent infection of Homo sapiens with Mycobacterium tuberculosis |
| 0.0 | 1.3 | REACTOME INTEGRIN CELL SURFACE INTERACTIONS | Genes involved in Integrin cell surface interactions |
| 0.0 | 0.8 | REACTOME ENOS ACTIVATION AND REGULATION | Genes involved in eNOS activation and regulation |
| 0.0 | 3.1 | REACTOME PEPTIDE CHAIN ELONGATION | Genes involved in Peptide chain elongation |
| 0.0 | 2.1 | REACTOME NUCLEAR RECEPTOR TRANSCRIPTION PATHWAY | Genes involved in Nuclear Receptor transcription pathway |
| 0.0 | 0.7 | REACTOME REGULATORY RNA PATHWAYS | Genes involved in Regulatory RNA pathways |
| 0.0 | 0.6 | REACTOME NEPHRIN INTERACTIONS | Genes involved in Nephrin interactions |
| 0.0 | 1.4 | REACTOME METABOLISM OF VITAMINS AND COFACTORS | Genes involved in Metabolism of vitamins and cofactors |
| 0.0 | 0.6 | REACTOME EFFECTS OF PIP2 HYDROLYSIS | Genes involved in Effects of PIP2 hydrolysis |
| 0.0 | 1.3 | REACTOME NOTCH1 INTRACELLULAR DOMAIN REGULATES TRANSCRIPTION | Genes involved in NOTCH1 Intracellular Domain Regulates Transcription |
| 0.0 | 0.4 | REACTOME OTHER SEMAPHORIN INTERACTIONS | Genes involved in Other semaphorin interactions |
| 0.0 | 0.6 | REACTOME HS GAG BIOSYNTHESIS | Genes involved in HS-GAG biosynthesis |
| 0.0 | 0.1 | REACTOME ACTIVATION OF CHAPERONE GENES BY ATF6 ALPHA | Genes involved in Activation of Chaperone Genes by ATF6-alpha |
| 0.0 | 1.1 | REACTOME PEPTIDE LIGAND BINDING RECEPTORS | Genes involved in Peptide ligand-binding receptors |
| 0.0 | 0.3 | REACTOME MITOCHONDRIAL TRNA AMINOACYLATION | Genes involved in Mitochondrial tRNA aminoacylation |