Project
Illumina Body Map 2 (GSE30611)
Navigation
Downloads
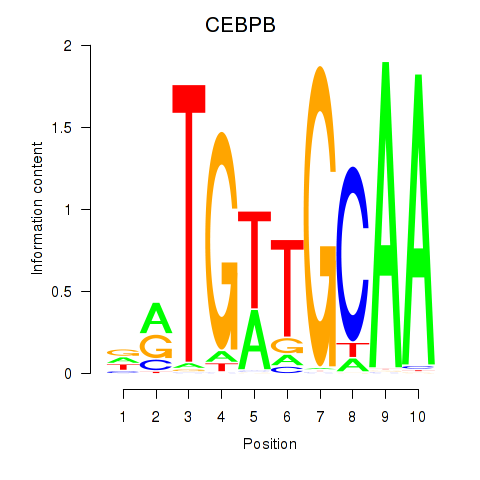
Results for CEBPB
Z-value: 1.86
Motif logo
Transcription factors associated with CEBPB
| Gene Symbol | Gene ID | Gene Info |
|---|---|---|
|
CEBPB
|
ENSG00000172216.6 | CCAAT enhancer binding protein beta |
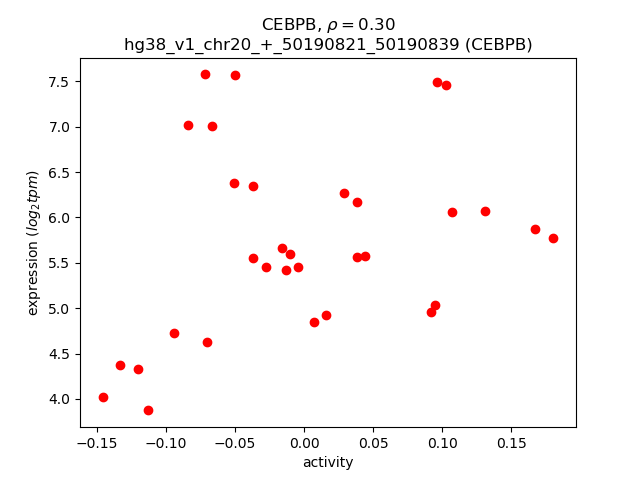
Activity-expression correlation:
| Gene | Promoter | Pearson corr. coef. | P-value | Plot |
|---|---|---|---|---|
| CEBPB | hg38_v1_chr20_+_50190821_50190839 | 0.30 | 9.1e-02 | Click! |
Activity profile of CEBPB motif
Sorted Z-values of CEBPB motif
| Promoter | Log-likelihood | Transcript | Gene | Gene Info |
|---|---|---|---|---|
| chr4_-_154612635 | 10.07 |
ENST00000407946.5
ENST00000405164.5 ENST00000336098.8 ENST00000393846.6 ENST00000404648.7 ENST00000443553.5 |
FGG
|
fibrinogen gamma chain |
| chr16_+_72054477 | 9.34 |
ENST00000355906.10
ENST00000570083.5 ENST00000228226.12 ENST00000398131.6 ENST00000569639.5 ENST00000564499.5 ENST00000357763.8 ENST00000613898.1 ENST00000562526.5 ENST00000565574.5 ENST00000568417.6 |
HP
|
haptoglobin |
| chr20_+_57561103 | 8.72 |
ENST00000319441.6
|
PCK1
|
phosphoenolpyruvate carboxykinase 1 |
| chr20_+_38346474 | 8.46 |
ENST00000217407.3
|
LBP
|
lipopolysaccharide binding protein |
| chr17_-_66220630 | 7.91 |
ENST00000585162.1
|
APOH
|
apolipoprotein H |
| chr3_+_186717348 | 6.96 |
ENST00000447445.1
ENST00000287611.8 ENST00000644859.2 |
KNG1
|
kininogen 1 |
| chr19_-_4540028 | 6.42 |
ENST00000306390.7
|
LRG1
|
leucine rich alpha-2-glycoprotein 1 |
| chr9_-_34691204 | 6.32 |
ENST00000378800.3
ENST00000311925.7 |
CCL19
|
C-C motif chemokine ligand 19 |
| chr22_+_35381086 | 6.12 |
ENST00000216117.9
ENST00000677931.1 ENST00000679074.1 |
HMOX1
|
heme oxygenase 1 |
| chr5_+_151020438 | 5.73 |
ENST00000622181.4
ENST00000614343.4 ENST00000388825.9 ENST00000521650.5 ENST00000517973.1 |
GPX3
|
glutathione peroxidase 3 |
| chr12_+_57454674 | 5.50 |
ENST00000547970.1
|
INHBE
|
inhibin subunit beta E |
| chr20_+_380747 | 5.43 |
ENST00000217233.9
|
TRIB3
|
tribbles pseudokinase 3 |
| chr1_-_203229660 | 5.35 |
ENST00000255427.7
ENST00000367229.6 |
CHIT1
|
chitinase 1 |
| chr3_-_49685090 | 5.31 |
ENST00000448220.5
|
MST1
|
macrophage stimulating 1 |
| chr6_+_31927703 | 5.22 |
ENST00000418949.6
ENST00000299367.10 ENST00000383177.7 ENST00000477310.1 |
C2
ENSG00000244255.5
|
complement C2 novel complement component 2 (C2) and complement factor B (CFB) protein |
| chr6_+_31927683 | 5.14 |
ENST00000456570.5
|
ENSG00000244255.5
|
novel complement component 2 (C2) and complement factor B (CFB) protein |
| chr2_+_240868817 | 5.02 |
ENST00000307503.4
|
AGXT
|
alanine--glyoxylate and serine--pyruvate aminotransferase |
| chr6_+_31927486 | 4.98 |
ENST00000442278.6
|
C2
|
complement C2 |
| chr5_-_142325001 | 4.93 |
ENST00000344120.4
ENST00000434127.3 |
SPRY4
|
sprouty RTK signaling antagonist 4 |
| chr20_+_381246 | 4.82 |
ENST00000449710.5
ENST00000422053.3 |
TRIB3
|
tribbles pseudokinase 3 |
| chr2_+_210556590 | 4.70 |
ENST00000233072.10
ENST00000619804.1 |
CPS1
|
carbamoyl-phosphate synthase 1 |
| chr11_+_114296347 | 4.61 |
ENST00000299964.4
|
NNMT
|
nicotinamide N-methyltransferase |
| chr6_+_31927510 | 3.99 |
ENST00000447952.6
|
C2
|
complement C2 |
| chr12_-_7128873 | 3.73 |
ENST00000542370.1
ENST00000266560.8 |
RBP5
|
retinol binding protein 5 |
| chr12_+_57455266 | 3.69 |
ENST00000266646.3
|
INHBE
|
inhibin subunit beta E |
| chr22_-_30246739 | 3.67 |
ENST00000403987.3
ENST00000249075.4 |
LIF
|
LIF interleukin 6 family cytokine |
| chr12_+_57229694 | 3.54 |
ENST00000557487.5
ENST00000328923.8 ENST00000555634.5 ENST00000556689.5 |
SHMT2
|
serine hydroxymethyltransferase 2 |
| chr12_+_57230086 | 3.52 |
ENST00000414700.7
ENST00000557703.5 |
SHMT2
|
serine hydroxymethyltransferase 2 |
| chr21_-_6467509 | 3.30 |
ENST00000624406.3
ENST00000398168.5 ENST00000624934.3 |
CBSL
|
cystathionine beta-synthase like |
| chr12_-_55842950 | 3.17 |
ENST00000548629.5
|
MMP19
|
matrix metallopeptidase 19 |
| chr12_-_95996302 | 3.03 |
ENST00000261208.8
ENST00000538703.5 ENST00000541929.5 |
HAL
|
histidine ammonia-lyase |
| chr17_+_1762052 | 3.00 |
ENST00000254722.9
ENST00000576406.5 ENST00000571149.5 |
SERPINF1
|
serpin family F member 1 |
| chr22_-_30505650 | 2.95 |
ENST00000381982.3
ENST00000255858.12 |
SEC14L4
|
SEC14 like lipid binding 4 |
| chr1_+_28259473 | 2.87 |
ENST00000253063.4
|
SESN2
|
sestrin 2 |
| chr12_+_57230336 | 2.81 |
ENST00000555773.5
ENST00000554975.5 ENST00000449049.7 |
SHMT2
|
serine hydroxymethyltransferase 2 |
| chr21_-_43075831 | 2.80 |
ENST00000398158.5
ENST00000398165.8 |
CBS
|
cystathionine beta-synthase |
| chr5_+_52787899 | 2.76 |
ENST00000274311.3
ENST00000282588.7 |
PELO
ITGA1
|
pelota mRNA surveillance and ribosome rescue factor integrin subunit alpha 1 |
| chr19_-_32869741 | 2.75 |
ENST00000590341.5
ENST00000587772.1 ENST00000023064.9 |
SLC7A9
|
solute carrier family 7 member 9 |
| chr3_+_101849505 | 2.72 |
ENST00000326151.9
ENST00000326172.9 |
NFKBIZ
|
NFKB inhibitor zeta |
| chr12_+_57230301 | 2.71 |
ENST00000553474.5
|
SHMT2
|
serine hydroxymethyltransferase 2 |
| chr11_+_7485492 | 2.64 |
ENST00000534244.1
ENST00000329293.4 |
OLFML1
|
olfactomedin like 1 |
| chr16_-_28539004 | 2.62 |
ENST00000395641.2
|
NUPR1
|
nuclear protein 1, transcriptional regulator |
| chr1_+_212608628 | 2.62 |
ENST00000613954.4
ENST00000341491.9 ENST00000366985.5 |
ATF3
|
activating transcription factor 3 |
| chr19_-_11236497 | 2.55 |
ENST00000587656.5
|
DOCK6
|
dedicator of cytokinesis 6 |
| chr6_-_134177898 | 2.53 |
ENST00000528577.5
|
SGK1
|
serum/glucocorticoid regulated kinase 1 |
| chr12_+_57230124 | 2.43 |
ENST00000553529.5
ENST00000554310.5 |
SHMT2
|
serine hydroxymethyltransferase 2 |
| chr17_+_41689862 | 2.40 |
ENST00000586699.1
|
EIF1
|
eukaryotic translation initiation factor 1 |
| chr2_-_159798234 | 2.38 |
ENST00000429078.6
ENST00000553424.5 |
CD302
|
CD302 molecule |
| chr17_+_1762012 | 2.37 |
ENST00000571360.5
|
SERPINF1
|
serpin family F member 1 |
| chr15_+_88639009 | 2.30 |
ENST00000306072.10
|
ISG20
|
interferon stimulated exonuclease gene 20 |
| chr1_-_27626229 | 2.29 |
ENST00000399173.5
|
FGR
|
FGR proto-oncogene, Src family tyrosine kinase |
| chr19_-_35513641 | 2.28 |
ENST00000339686.8
ENST00000447113.6 |
DMKN
|
dermokine |
| chr5_+_38846002 | 2.19 |
ENST00000274276.8
|
OSMR
|
oncostatin M receptor |
| chr6_+_150865815 | 2.18 |
ENST00000367308.8
|
MTHFD1L
|
methylenetetrahydrofolate dehydrogenase (NADP+ dependent) 1 like |
| chr15_+_88638947 | 2.17 |
ENST00000559876.2
|
ISG20
|
interferon stimulated exonuclease gene 20 |
| chr9_-_92536031 | 2.09 |
ENST00000344604.9
ENST00000375540.5 |
ECM2
|
extracellular matrix protein 2 |
| chr15_+_96325935 | 2.09 |
ENST00000421109.6
|
NR2F2
|
nuclear receptor subfamily 2 group F member 2 |
| chr3_+_157436842 | 2.08 |
ENST00000295927.4
|
PTX3
|
pentraxin 3 |
| chr5_+_38845824 | 2.07 |
ENST00000502536.5
|
OSMR
|
oncostatin M receptor |
| chr14_-_91946989 | 2.04 |
ENST00000556154.5
|
FBLN5
|
fibulin 5 |
| chr2_-_159798043 | 2.00 |
ENST00000664982.1
ENST00000259053.6 |
ENSG00000287091.1
CD302
|
novel transcript, sense intronic to CD302and LY75-CD302 CD302 molecule |
| chr1_-_27626496 | 1.98 |
ENST00000374003.7
|
FGR
|
FGR proto-oncogene, Src family tyrosine kinase |
| chr1_-_196608359 | 1.97 |
ENST00000609185.5
ENST00000451324.6 ENST00000367433.9 ENST00000294725.14 |
KCNT2
|
potassium sodium-activated channel subfamily T member 2 |
| chr3_+_12351470 | 1.93 |
ENST00000287820.10
|
PPARG
|
peroxisome proliferator activated receptor gamma |
| chr12_-_55842927 | 1.92 |
ENST00000322569.9
ENST00000409200.7 |
MMP19
|
matrix metallopeptidase 19 |
| chr7_+_114922346 | 1.91 |
ENST00000393486.5
|
MDFIC
|
MyoD family inhibitor domain containing |
| chr2_+_6978624 | 1.87 |
ENST00000433456.1
|
RNF144A
|
ring finger protein 144A |
| chr16_-_28538951 | 1.83 |
ENST00000324873.8
|
NUPR1
|
nuclear protein 1, transcriptional regulator |
| chr11_-_102724945 | 1.83 |
ENST00000236826.8
|
MMP8
|
matrix metallopeptidase 8 |
| chr1_-_36482904 | 1.82 |
ENST00000373106.6
|
CSF3R
|
colony stimulating factor 3 receptor |
| chrX_+_13569593 | 1.82 |
ENST00000361306.6
ENST00000380602.3 |
EGFL6
|
EGF like domain multiple 6 |
| chr3_-_3110347 | 1.76 |
ENST00000383846.5
ENST00000427088.1 ENST00000446632.7 ENST00000418488.6 ENST00000438560.5 |
IL5RA
|
interleukin 5 receptor subunit alpha |
| chr6_-_32844643 | 1.74 |
ENST00000374881.3
|
PSMB8
|
proteasome 20S subunit beta 8 |
| chr11_+_7485353 | 1.74 |
ENST00000530135.5
|
OLFML1
|
olfactomedin like 1 |
| chr11_+_7485606 | 1.73 |
ENST00000528758.1
|
OLFML1
|
olfactomedin like 1 |
| chr1_+_53062052 | 1.73 |
ENST00000395871.7
ENST00000673702.1 ENST00000673956.1 ENST00000312553.10 ENST00000371500.8 ENST00000618387.1 |
PODN
|
podocan |
| chr19_-_54313074 | 1.72 |
ENST00000486742.2
ENST00000432233.8 |
LILRA5
|
leukocyte immunoglobulin like receptor A5 |
| chr2_+_113127588 | 1.70 |
ENST00000409930.4
|
IL1RN
|
interleukin 1 receptor antagonist |
| chrX_-_107000185 | 1.70 |
ENST00000355610.9
|
MORC4
|
MORC family CW-type zinc finger 4 |
| chr6_+_30720335 | 1.66 |
ENST00000327892.13
|
TUBB
|
tubulin beta class I |
| chr5_+_150640652 | 1.65 |
ENST00000307662.5
|
SYNPO
|
synaptopodin |
| chr3_+_12351493 | 1.64 |
ENST00000683699.1
|
PPARG
|
peroxisome proliferator activated receptor gamma |
| chr1_+_53014926 | 1.64 |
ENST00000430330.6
ENST00000408941.7 ENST00000478274.6 ENST00000484100.5 ENST00000435345.6 ENST00000488965.1 |
SCP2
|
sterol carrier protein 2 |
| chr2_-_216694794 | 1.61 |
ENST00000449583.1
|
IGFBP5
|
insulin like growth factor binding protein 5 |
| chr1_+_111473792 | 1.61 |
ENST00000343534.9
|
C1orf162
|
chromosome 1 open reading frame 162 |
| chr1_-_27626106 | 1.60 |
ENST00000457296.5
|
FGR
|
FGR proto-oncogene, Src family tyrosine kinase |
| chr11_-_102798148 | 1.60 |
ENST00000315274.7
|
MMP1
|
matrix metallopeptidase 1 |
| chr4_+_76639517 | 1.57 |
ENST00000646790.1
|
SHROOM3
|
shroom family member 3 |
| chr6_+_150866333 | 1.55 |
ENST00000618312.4
ENST00000423867.2 |
MTHFD1L
|
methylenetetrahydrofolate dehydrogenase (NADP+ dependent) 1 like |
| chrX_-_110440218 | 1.53 |
ENST00000372057.1
ENST00000372054.3 |
AMMECR1
GNG5P2
|
AMMECR nuclear protein 1 G protein subunit gamma 5 pseudogene 2 |
| chr12_+_57230274 | 1.51 |
ENST00000557427.5
|
SHMT2
|
serine hydroxymethyltransferase 2 |
| chr1_-_204411804 | 1.51 |
ENST00000367188.5
|
PPP1R15B
|
protein phosphatase 1 regulatory subunit 15B |
| chr19_-_46784905 | 1.50 |
ENST00000594991.5
|
SLC1A5
|
solute carrier family 1 member 5 |
| chr5_-_102296260 | 1.49 |
ENST00000310954.7
|
SLCO4C1
|
solute carrier organic anion transporter family member 4C1 |
| chr16_+_56936654 | 1.49 |
ENST00000563911.5
|
HERPUD1
|
homocysteine inducible ER protein with ubiquitin like domain 1 |
| chr9_+_128920966 | 1.49 |
ENST00000428610.5
ENST00000372592.8 |
PHYHD1
|
phytanoyl-CoA dioxygenase domain containing 1 |
| chr19_+_11239602 | 1.49 |
ENST00000252453.12
|
ANGPTL8
|
angiopoietin like 8 |
| chr1_-_206970457 | 1.46 |
ENST00000324852.9
ENST00000450945.3 ENST00000400962.8 |
FCAMR
|
Fc fragment of IgA and IgM receptor |
| chr9_-_92536067 | 1.43 |
ENST00000444490.6
|
ECM2
|
extracellular matrix protein 2 |
| chr3_+_9423108 | 1.41 |
ENST00000468208.2
|
SETD5
|
SET domain containing 5 |
| chrX_-_107000062 | 1.39 |
ENST00000255495.7
|
MORC4
|
MORC family CW-type zinc finger 4 |
| chr7_-_116030735 | 1.38 |
ENST00000393485.5
|
TFEC
|
transcription factor EC |
| chr17_-_81937320 | 1.38 |
ENST00000577624.5
ENST00000403172.8 ENST00000619204.4 ENST00000629768.2 |
PYCR1
|
pyrroline-5-carboxylate reductase 1 |
| chr2_-_43226594 | 1.37 |
ENST00000282388.4
|
ZFP36L2
|
ZFP36 ring finger protein like 2 |
| chr1_+_153259684 | 1.37 |
ENST00000368742.4
|
LORICRIN
|
loricrin cornified envelope precursor protein |
| chr8_+_22392821 | 1.37 |
ENST00000520832.1
|
SLC39A14
|
solute carrier family 39 member 14 |
| chr12_-_6341848 | 1.33 |
ENST00000366159.8
ENST00000539372.5 |
TNFRSF1A
|
TNF receptor superfamily member 1A |
| chr11_-_65133320 | 1.32 |
ENST00000531018.5
|
SYVN1
|
synoviolin 1 |
| chr10_+_26438404 | 1.29 |
ENST00000356785.4
|
APBB1IP
|
amyloid beta precursor protein binding family B member 1 interacting protein |
| chr14_-_24576240 | 1.28 |
ENST00000216336.3
|
CTSG
|
cathepsin G |
| chr3_+_42856021 | 1.25 |
ENST00000493193.1
|
ACKR2
|
atypical chemokine receptor 2 |
| chr12_-_6342020 | 1.22 |
ENST00000540022.5
ENST00000536194.1 |
TNFRSF1A
|
TNF receptor superfamily member 1A |
| chr12_-_6342066 | 1.22 |
ENST00000162749.7
ENST00000440083.6 |
TNFRSF1A
|
TNF receptor superfamily member 1A |
| chr1_+_111473972 | 1.21 |
ENST00000369718.4
|
C1orf162
|
chromosome 1 open reading frame 162 |
| chr10_+_26438317 | 1.20 |
ENST00000376236.9
|
APBB1IP
|
amyloid beta precursor protein binding family B member 1 interacting protein |
| chr1_-_44031446 | 1.19 |
ENST00000372310.8
ENST00000466926.1 |
SLC6A9
|
solute carrier family 6 member 9 |
| chr1_-_32817311 | 1.18 |
ENST00000373477.9
ENST00000675785.1 |
YARS1
|
tyrosyl-tRNA synthetase 1 |
| chr16_-_4273014 | 1.17 |
ENST00000204517.11
|
TFAP4
|
transcription factor AP-4 |
| chr16_+_56932134 | 1.16 |
ENST00000439977.7
ENST00000300302.9 ENST00000344114.8 ENST00000379792.6 |
HERPUD1
|
homocysteine inducible ER protein with ubiquitin like domain 1 |
| chr3_+_128051610 | 1.16 |
ENST00000464451.5
|
SEC61A1
|
SEC61 translocon subunit alpha 1 |
| chr15_-_82571741 | 1.12 |
ENST00000562833.2
ENST00000611163.4 |
ENSG00000260836.2
CPEB1
|
novel protein cytoplasmic polyadenylation element binding protein 1 |
| chr20_-_2840623 | 1.11 |
ENST00000360652.7
ENST00000448755.5 |
PCED1A
|
PC-esterase domain containing 1A |
| chr9_+_2621766 | 1.09 |
ENST00000382100.8
|
VLDLR
|
very low density lipoprotein receptor |
| chr12_+_55997180 | 1.06 |
ENST00000356124.8
ENST00000266971.8 ENST00000394115.6 ENST00000547586.5 ENST00000552258.5 ENST00000548274.5 ENST00000546833.5 |
SUOX
|
sulfite oxidase |
| chr14_-_91947383 | 1.05 |
ENST00000267620.14
|
FBLN5
|
fibulin 5 |
| chr7_+_114922561 | 1.04 |
ENST00000448022.1
|
MDFIC
|
MyoD family inhibitor domain containing |
| chr16_-_57775103 | 1.03 |
ENST00000540079.6
ENST00000569222.5 |
KIFC3
|
kinesin family member C3 |
| chr11_-_102724781 | 1.02 |
ENST00000438475.2
|
MMP8
|
matrix metallopeptidase 8 |
| chr19_-_46784733 | 1.02 |
ENST00000593713.1
ENST00000598022.1 ENST00000434726.6 |
SLC1A5
|
solute carrier family 1 member 5 |
| chr12_+_9971402 | 1.00 |
ENST00000304361.9
ENST00000396507.7 ENST00000434319.6 |
CLEC12A
|
C-type lectin domain family 12 member A |
| chrX_+_100584928 | 0.99 |
ENST00000373031.5
|
TNMD
|
tenomodulin |
| chr1_+_98661666 | 0.98 |
ENST00000529992.5
|
SNX7
|
sorting nexin 7 |
| chr5_+_73813518 | 0.98 |
ENST00000296799.8
|
ARHGEF28
|
Rho guanine nucleotide exchange factor 28 |
| chr1_-_237945275 | 0.98 |
ENST00000604646.1
|
MTRNR2L11
|
MT-RNR2 like 11 |
| chr3_-_3109980 | 0.96 |
ENST00000256452.7
ENST00000311981.12 ENST00000430514.6 ENST00000456302.5 |
IL5RA
|
interleukin 5 receptor subunit alpha |
| chrX_-_54998530 | 0.96 |
ENST00000545676.5
|
PFKFB1
|
6-phosphofructo-2-kinase/fructose-2,6-biphosphatase 1 |
| chr7_+_48171451 | 0.96 |
ENST00000435803.6
|
ABCA13
|
ATP binding cassette subfamily A member 13 |
| chr12_-_52680398 | 0.95 |
ENST00000252244.3
|
KRT1
|
keratin 1 |
| chr7_-_116030750 | 0.94 |
ENST00000265440.12
ENST00000320239.11 |
TFEC
|
transcription factor EC |
| chr18_+_31447732 | 0.92 |
ENST00000257189.5
|
DSG3
|
desmoglein 3 |
| chr1_-_149936324 | 0.92 |
ENST00000369140.7
|
MTMR11
|
myotubularin related protein 11 |
| chr5_+_179678613 | 0.91 |
ENST00000681674.1
ENST00000681712.1 ENST00000681903.1 |
CANX
|
calnexin |
| chr8_-_22109381 | 0.90 |
ENST00000613958.1
ENST00000611621.2 |
NUDT18
|
nudix hydrolase 18 |
| chr6_+_31971831 | 0.88 |
ENST00000375331.7
ENST00000375333.3 |
STK19
|
serine/threonine kinase 19 |
| chrX_+_116436599 | 0.88 |
ENST00000598581.3
|
SLC6A14
|
solute carrier family 6 member 14 |
| chr12_+_111405861 | 0.85 |
ENST00000341259.7
|
SH2B3
|
SH2B adaptor protein 3 |
| chr14_+_75428011 | 0.85 |
ENST00000651602.1
ENST00000559060.5 |
JDP2
|
Jun dimerization protein 2 |
| chr12_-_95995920 | 0.84 |
ENST00000552509.5
|
HAL
|
histidine ammonia-lyase |
| chrX_+_24054931 | 0.83 |
ENST00000253039.9
ENST00000423068.1 |
EIF2S3
|
eukaryotic translation initiation factor 2 subunit gamma |
| chr17_-_40822604 | 0.83 |
ENST00000269576.6
ENST00000635956.2 |
KRT10
|
keratin 10 |
| chr12_+_10213624 | 0.83 |
ENST00000545290.1
|
GABARAPL1
|
GABA type A receptor associated protein like 1 |
| chr17_-_81937277 | 0.82 |
ENST00000405481.8
ENST00000329875.13 ENST00000585215.5 |
PYCR1
|
pyrroline-5-carboxylate reductase 1 |
| chr8_+_38974212 | 0.81 |
ENST00000302495.5
|
HTRA4
|
HtrA serine peptidase 4 |
| chr12_-_57520480 | 0.80 |
ENST00000642841.1
ENST00000547303.5 ENST00000552740.5 ENST00000547526.1 ENST00000346473.8 ENST00000551116.5 |
ENSG00000285133.1
DDIT3
|
novel protein DNA damage inducible transcript 3 |
| chr1_+_99646025 | 0.79 |
ENST00000263174.9
ENST00000605497.5 ENST00000615664.1 |
PALMD
|
palmdelphin |
| chr20_-_2841109 | 0.78 |
ENST00000356872.7
ENST00000439542.1 |
PCED1A
|
PC-esterase domain containing 1A |
| chr17_-_10469558 | 0.76 |
ENST00000255381.2
|
MYH4
|
myosin heavy chain 4 |
| chr18_+_74501090 | 0.76 |
ENST00000582666.5
|
CNDP2
|
carnosine dipeptidase 2 |
| chr1_-_37947010 | 0.76 |
ENST00000458109.6
ENST00000373024.8 ENST00000373023.6 |
INPP5B
|
inositol polyphosphate-5-phosphatase B |
| chr1_+_162631984 | 0.75 |
ENST00000415555.5
|
DDR2
|
discoidin domain receptor tyrosine kinase 2 |
| chr20_+_41340780 | 0.72 |
ENST00000373257.8
|
LPIN3
|
lipin 3 |
| chr12_+_57520959 | 0.71 |
ENST00000551351.5
|
MBD6
|
methyl-CpG binding domain protein 6 |
| chr5_-_151093566 | 0.70 |
ENST00000521001.1
|
TNIP1
|
TNFAIP3 interacting protein 1 |
| chr15_-_79971164 | 0.70 |
ENST00000335661.6
ENST00000267953.4 ENST00000677151.1 |
BCL2A1
|
BCL2 related protein A1 |
| chr11_+_62881686 | 0.69 |
ENST00000536981.6
ENST00000539891.6 |
SLC3A2
|
solute carrier family 3 member 2 |
| chr4_-_156970903 | 0.69 |
ENST00000422544.2
|
PDGFC
|
platelet derived growth factor C |
| chr6_+_32844789 | 0.68 |
ENST00000414474.5
|
PSMB9
|
proteasome 20S subunit beta 9 |
| chr3_+_141386393 | 0.67 |
ENST00000503809.5
|
ZBTB38
|
zinc finger and BTB domain containing 38 |
| chr20_+_41340878 | 0.67 |
ENST00000632009.1
|
LPIN3
|
lipin 3 |
| chr11_+_119084873 | 0.66 |
ENST00000652429.1
ENST00000442944.7 ENST00000537841.5 ENST00000542729.5 ENST00000546302.6 ENST00000536813.6 ENST00000544387.5 ENST00000543090.5 |
HMBS
|
hydroxymethylbilane synthase |
| chr14_+_19876232 | 0.65 |
ENST00000298642.2
|
OR4K2
|
olfactory receptor family 4 subfamily K member 2 |
| chr17_+_30921935 | 0.62 |
ENST00000581285.5
ENST00000330889.8 |
ADAP2
|
ArfGAP with dual PH domains 2 |
| chr19_+_48756067 | 0.61 |
ENST00000222157.5
|
FGF21
|
fibroblast growth factor 21 |
| chr9_+_2621556 | 0.61 |
ENST00000680746.1
|
VLDLR
|
very low density lipoprotein receptor |
| chr10_+_113125536 | 0.59 |
ENST00000349937.7
|
TCF7L2
|
transcription factor 7 like 2 |
| chr19_+_35745613 | 0.57 |
ENST00000222266.2
ENST00000587708.7 |
PSENEN
|
presenilin enhancer, gamma-secretase subunit |
| chr15_+_62066975 | 0.56 |
ENST00000355522.5
|
C2CD4A
|
C2 calcium dependent domain containing 4A |
| chr6_+_127577168 | 0.55 |
ENST00000329722.8
|
C6orf58
|
chromosome 6 open reading frame 58 |
| chr17_-_81937221 | 0.55 |
ENST00000402252.6
ENST00000583564.5 ENST00000585244.1 ENST00000337943.9 ENST00000579698.5 |
PYCR1
|
pyrroline-5-carboxylate reductase 1 |
| chr15_+_40952962 | 0.55 |
ENST00000444189.7
|
CHAC1
|
ChaC glutathione specific gamma-glutamylcyclotransferase 1 |
| chr14_+_75427688 | 0.55 |
ENST00000419727.6
|
JDP2
|
Jun dimerization protein 2 |
| chr4_-_69860138 | 0.55 |
ENST00000226444.4
|
SULT1E1
|
sulfotransferase family 1E member 1 |
| chr17_+_30921899 | 0.52 |
ENST00000581548.5
ENST00000580525.5 |
ADAP2
|
ArfGAP with dual PH domains 2 |
| chr1_+_43650466 | 0.51 |
ENST00000463151.5
|
KDM4A
|
lysine demethylase 4A |
| chr12_+_57520698 | 0.50 |
ENST00000548887.5
|
MBD6
|
methyl-CpG binding domain protein 6 |
| chr4_+_146214515 | 0.50 |
ENST00000636502.1
|
REELD1
|
reeler domain containing 1 |
| chr7_+_80133830 | 0.50 |
ENST00000648098.1
ENST00000648476.1 ENST00000648412.1 ENST00000648953.1 ENST00000648306.1 ENST00000648832.1 ENST00000648877.1 ENST00000442586.2 ENST00000649487.1 ENST00000649267.1 |
GNAI1
|
G protein subunit alpha i1 |
| chr10_-_21517825 | 0.49 |
ENST00000444772.3
|
SKIDA1
|
SKI/DACH domain containing 1 |
| chr19_+_35745590 | 0.49 |
ENST00000591949.1
|
PSENEN
|
presenilin enhancer, gamma-secretase subunit |
| chr19_-_54081365 | 0.47 |
ENST00000432826.2
|
TARM1
|
T cell-interacting, activating receptor on myeloid cells 1 |
| chr1_-_109613070 | 0.47 |
ENST00000351050.8
|
GNAT2
|
G protein subunit alpha transducin 2 |
| chr18_+_63752935 | 0.47 |
ENST00000425392.5
ENST00000336429.6 |
SERPINB7
|
serpin family B member 7 |
| chr6_+_125781108 | 0.45 |
ENST00000368357.7
|
NCOA7
|
nuclear receptor coactivator 7 |
| chr5_+_33440947 | 0.44 |
ENST00000455217.6
ENST00000265112.8 |
TARS1
|
threonyl-tRNA synthetase 1 |
| chr1_-_44031352 | 0.40 |
ENST00000372306.7
ENST00000475075.6 |
SLC6A9
|
solute carrier family 6 member 9 |
| chr9_-_13175824 | 0.39 |
ENST00000545857.5
|
MPDZ
|
multiple PDZ domain crumbs cell polarity complex component |
| chr1_+_25430854 | 0.37 |
ENST00000399766.7
|
MACO1
|
macoilin 1 |
| chr20_-_34112205 | 0.36 |
ENST00000374980.3
|
EIF2S2
|
eukaryotic translation initiation factor 2 subunit beta |
| chr1_-_145962581 | 0.36 |
ENST00000619813.1
|
ANKRD34A
|
ankyrin repeat domain 34A |
| chr2_-_213152427 | 0.35 |
ENST00000452786.2
|
IKZF2
|
IKAROS family zinc finger 2 |
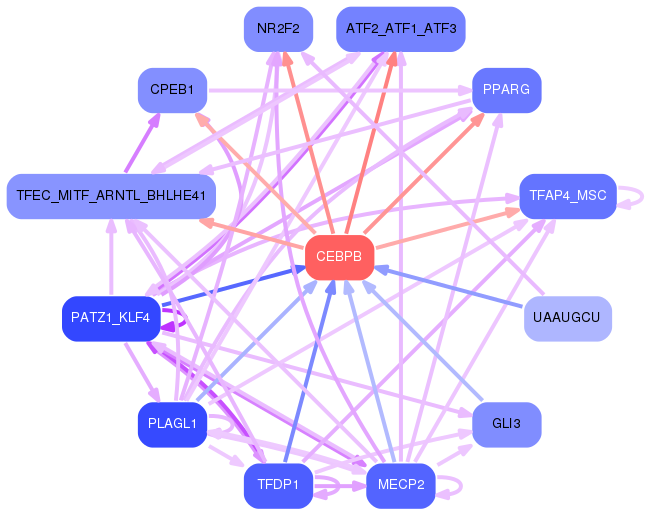
Network of associatons between targets according to the STRING database.

First level regulatory network of CEBPB
Gene Ontology Analysis
Gene overrepresentation in biological process category:
| Log-likelihood per target | Total log-likelihood | Term | Description |
|---|---|---|---|
| 3.1 | 9.3 | GO:2000296 | negative regulation of hydrogen peroxide catabolic process(GO:2000296) |
| 2.9 | 8.7 | GO:0061402 | positive regulation of transcription from RNA polymerase II promoter in response to acidic pH(GO:0061402) |
| 2.8 | 8.5 | GO:0015920 | lipopolysaccharide transport(GO:0015920) |
| 2.1 | 6.3 | GO:2000547 | regulation of dendritic cell dendrite assembly(GO:2000547) |
| 1.8 | 16.5 | GO:0019264 | glycine biosynthetic process from serine(GO:0019264) |
| 1.6 | 4.7 | GO:0070408 | carbamoyl phosphate metabolic process(GO:0070408) carbamoyl phosphate biosynthetic process(GO:0070409) response to ammonia(GO:1903717) cellular response to ammonia(GO:1903718) |
| 1.3 | 5.0 | GO:0009436 | glyoxylate catabolic process(GO:0009436) |
| 1.2 | 6.1 | GO:0006788 | heme oxidation(GO:0006788) regulation of transcription from RNA polymerase II promoter in response to iron(GO:0034395) |
| 1.1 | 4.5 | GO:0000738 | DNA catabolic process, exonucleolytic(GO:0000738) |
| 1.0 | 2.9 | GO:0090526 | regulation of gluconeogenesis involved in cellular glucose homeostasis(GO:0090526) |
| 0.9 | 14.2 | GO:2000427 | positive regulation of apoptotic cell clearance(GO:2000427) |
| 0.9 | 3.7 | GO:0060708 | spongiotrophoblast differentiation(GO:0060708) |
| 0.9 | 6.1 | GO:0006535 | cysteine biosynthetic process from serine(GO:0006535) |
| 0.8 | 5.7 | GO:0006982 | response to lipid hydroperoxide(GO:0006982) |
| 0.8 | 5.3 | GO:0044245 | polysaccharide digestion(GO:0044245) |
| 0.7 | 3.7 | GO:0009257 | 10-formyltetrahydrofolate biosynthetic process(GO:0009257) |
| 0.7 | 2.1 | GO:1903015 | regulation of exo-alpha-sialidase activity(GO:1903015) |
| 0.7 | 7.9 | GO:0034392 | negative regulation of smooth muscle cell apoptotic process(GO:0034392) |
| 0.7 | 2.6 | GO:1903984 | regulation of transcription from RNA polymerase II promoter in response to arsenic-containing substance(GO:0061394) positive regulation of TRAIL-activated apoptotic signaling pathway(GO:1903984) |
| 0.6 | 2.5 | GO:0010585 | glutamine secretion(GO:0010585) L-glutamine import(GO:0036229) L-glutamine import into cell(GO:1903803) |
| 0.6 | 5.4 | GO:0071279 | cellular response to cobalt ion(GO:0071279) |
| 0.6 | 3.9 | GO:0019556 | histidine catabolic process to glutamate and formamide(GO:0019556) histidine catabolic process to glutamate and formate(GO:0019557) formamide metabolic process(GO:0043606) |
| 0.5 | 2.7 | GO:0038043 | interleukin-5-mediated signaling pathway(GO:0038043) |
| 0.5 | 1.6 | GO:1904204 | regulation of skeletal muscle hypertrophy(GO:1904204) |
| 0.5 | 4.3 | GO:0038165 | oncostatin-M-mediated signaling pathway(GO:0038165) |
| 0.5 | 1.6 | GO:0061536 | glycine secretion(GO:0061536) glycine secretion, neurotransmission(GO:0061537) |
| 0.5 | 2.1 | GO:0009956 | radial pattern formation(GO:0009956) |
| 0.5 | 5.1 | GO:0001554 | luteolysis(GO:0001554) |
| 0.5 | 2.3 | GO:1903575 | cornified envelope assembly(GO:1903575) |
| 0.4 | 3.6 | GO:2000230 | negative regulation of pancreatic stellate cell proliferation(GO:2000230) |
| 0.4 | 17.0 | GO:0072378 | blood coagulation, fibrin clot formation(GO:0072378) |
| 0.4 | 2.8 | GO:0070966 | nuclear-transcribed mRNA catabolic process, no-go decay(GO:0070966) |
| 0.3 | 2.4 | GO:0009048 | dosage compensation(GO:0007549) dosage compensation by inactivation of X chromosome(GO:0009048) |
| 0.3 | 1.0 | GO:0018160 | peptidyl-pyrromethane cofactor linkage(GO:0018160) |
| 0.3 | 8.3 | GO:0045717 | negative regulation of fatty acid biosynthetic process(GO:0045717) |
| 0.3 | 2.8 | GO:0055129 | L-proline biosynthetic process(GO:0055129) |
| 0.3 | 0.9 | GO:1901069 | guanosine-containing compound catabolic process(GO:1901069) |
| 0.3 | 5.3 | GO:0045721 | negative regulation of gluconeogenesis(GO:0045721) |
| 0.3 | 3.1 | GO:0048251 | elastic fiber assembly(GO:0048251) |
| 0.2 | 1.7 | GO:2000660 | negative regulation of interleukin-1-mediated signaling pathway(GO:2000660) |
| 0.2 | 1.6 | GO:0032377 | regulation of intracellular lipid transport(GO:0032377) regulation of intracellular sterol transport(GO:0032380) regulation of intracellular cholesterol transport(GO:0032383) |
| 0.2 | 3.8 | GO:0071550 | death-inducing signaling complex assembly(GO:0071550) |
| 0.2 | 1.7 | GO:0034436 | glycoprotein transport(GO:0034436) |
| 0.2 | 2.5 | GO:0070294 | renal sodium ion absorption(GO:0070294) |
| 0.2 | 5.9 | GO:0043306 | positive regulation of mast cell activation involved in immune response(GO:0033008) positive regulation of mast cell degranulation(GO:0043306) |
| 0.2 | 4.4 | GO:2000194 | regulation of female gonad development(GO:2000194) |
| 0.2 | 4.6 | GO:0034356 | NAD biosynthesis via nicotinamide riboside salvage pathway(GO:0034356) |
| 0.2 | 0.5 | GO:0006711 | estrogen catabolic process(GO:0006711) |
| 0.2 | 0.7 | GO:0052027 | modulation of signal transduction in other organism(GO:0044501) modulation by symbiont of host signal transduction pathway(GO:0052027) modulation of signal transduction in other organism involved in symbiotic interaction(GO:0052250) modulation by symbiont of host I-kappaB kinase/NF-kappaB cascade(GO:0085032) |
| 0.2 | 1.5 | GO:1903898 | negative regulation of PERK-mediated unfolded protein response(GO:1903898) negative regulation of endoplasmic reticulum stress-induced eIF2 alpha phosphorylation(GO:1903912) |
| 0.2 | 1.2 | GO:0039019 | pronephric nephron development(GO:0039019) |
| 0.2 | 1.3 | GO:0070943 | neutrophil mediated cytotoxicity(GO:0070942) neutrophil mediated killing of symbiont cell(GO:0070943) neutrophil mediated killing of bacterium(GO:0070944) |
| 0.2 | 1.0 | GO:1903301 | positive regulation of glucokinase activity(GO:0033133) positive regulation of hexokinase activity(GO:1903301) |
| 0.2 | 1.1 | GO:0019418 | sulfide oxidation(GO:0019418) sulfide oxidation, using sulfide:quinone oxidoreductase(GO:0070221) |
| 0.1 | 2.5 | GO:0002291 | T cell activation via T cell receptor contact with antigen bound to MHC molecule on antigen presenting cell(GO:0002291) |
| 0.1 | 6.4 | GO:1903846 | positive regulation of transforming growth factor beta receptor signaling pathway(GO:0030511) positive regulation of cellular response to transforming growth factor beta stimulus(GO:1903846) |
| 0.1 | 0.8 | GO:0032792 | negative regulation of CREB transcription factor activity(GO:0032792) |
| 0.1 | 2.9 | GO:1903071 | positive regulation of ER-associated ubiquitin-dependent protein catabolic process(GO:1903071) |
| 0.1 | 0.3 | GO:0060264 | respiratory burst involved in inflammatory response(GO:0002536) regulation of respiratory burst involved in inflammatory response(GO:0060264) |
| 0.1 | 8.2 | GO:0010862 | positive regulation of pathway-restricted SMAD protein phosphorylation(GO:0010862) |
| 0.1 | 1.0 | GO:0035990 | tendon cell differentiation(GO:0035990) tendon formation(GO:0035992) |
| 0.1 | 1.1 | GO:0015811 | L-cystine transport(GO:0015811) |
| 0.1 | 1.0 | GO:0090080 | positive regulation of MAPKKK cascade by fibroblast growth factor receptor signaling pathway(GO:0090080) |
| 0.1 | 1.4 | GO:0097011 | cellular response to granulocyte macrophage colony-stimulating factor stimulus(GO:0097011) response to granulocyte macrophage colony-stimulating factor(GO:0097012) |
| 0.1 | 0.3 | GO:0042144 | vacuole fusion, non-autophagic(GO:0042144) |
| 0.1 | 1.4 | GO:0015684 | ferrous iron transport(GO:0015684) ferrous iron transmembrane transport(GO:1903874) |
| 0.1 | 1.0 | GO:0045218 | zonula adherens maintenance(GO:0045218) |
| 0.1 | 0.7 | GO:0060356 | leucine import(GO:0060356) |
| 0.1 | 0.5 | GO:0090362 | positive regulation of platelet-derived growth factor production(GO:0090362) |
| 0.1 | 1.6 | GO:0045176 | apical protein localization(GO:0045176) |
| 0.1 | 0.9 | GO:0001867 | complement activation, lectin pathway(GO:0001867) |
| 0.1 | 0.2 | GO:0051389 | inactivation of MAPKK activity(GO:0051389) |
| 0.1 | 1.5 | GO:0050746 | regulation of lipoprotein metabolic process(GO:0050746) |
| 0.1 | 1.8 | GO:0097186 | amelogenesis(GO:0097186) |
| 0.1 | 0.3 | GO:1900039 | positive regulation of cellular response to hypoxia(GO:1900039) |
| 0.1 | 1.1 | GO:2000766 | negative regulation of cytoplasmic translation(GO:2000766) |
| 0.1 | 1.2 | GO:0043922 | negative regulation by host of viral transcription(GO:0043922) |
| 0.0 | 0.6 | GO:0048625 | myoblast fate commitment(GO:0048625) |
| 0.0 | 3.0 | GO:0007257 | activation of JUN kinase activity(GO:0007257) |
| 0.0 | 0.5 | GO:1900113 | negative regulation of histone H3-K9 trimethylation(GO:1900113) |
| 0.0 | 1.1 | GO:0007220 | Notch receptor processing(GO:0007220) |
| 0.0 | 1.4 | GO:0006646 | phosphatidylethanolamine biosynthetic process(GO:0006646) |
| 0.0 | 0.2 | GO:0060686 | negative regulation of prostatic bud formation(GO:0060686) |
| 0.0 | 1.2 | GO:0031065 | positive regulation of histone deacetylation(GO:0031065) |
| 0.0 | 1.3 | GO:1904380 | endoplasmic reticulum mannose trimming(GO:1904380) |
| 0.0 | 0.8 | GO:0038063 | collagen-activated tyrosine kinase receptor signaling pathway(GO:0038063) |
| 0.0 | 4.4 | GO:0070373 | negative regulation of ERK1 and ERK2 cascade(GO:0070373) |
| 0.0 | 0.2 | GO:0051142 | regulation of NK T cell proliferation(GO:0051140) positive regulation of NK T cell proliferation(GO:0051142) |
| 0.0 | 4.4 | GO:0030574 | collagen catabolic process(GO:0030574) |
| 0.0 | 0.9 | GO:0034975 | protein folding in endoplasmic reticulum(GO:0034975) |
| 0.0 | 0.2 | GO:0009098 | branched-chain amino acid biosynthetic process(GO:0009082) leucine biosynthetic process(GO:0009098) valine biosynthetic process(GO:0009099) |
| 0.0 | 1.1 | GO:0006750 | glutathione biosynthetic process(GO:0006750) |
| 0.0 | 0.5 | GO:0042670 | retinal cone cell differentiation(GO:0042670) retinal cone cell development(GO:0046549) |
| 0.0 | 0.3 | GO:0036093 | male germ cell proliferation(GO:0002176) germ cell proliferation(GO:0036093) |
| 0.0 | 0.8 | GO:0043562 | cellular response to nitrogen starvation(GO:0006995) cellular response to nitrogen levels(GO:0043562) |
| 0.0 | 0.9 | GO:1904778 | regulation of protein localization to cell cortex(GO:1904776) positive regulation of protein localization to cell cortex(GO:1904778) |
| 0.0 | 1.5 | GO:0043252 | sodium-independent organic anion transport(GO:0043252) |
| 0.0 | 0.2 | GO:2000825 | positive regulation of androgen receptor activity(GO:2000825) |
| 0.0 | 1.1 | GO:0046856 | phosphatidylinositol dephosphorylation(GO:0046856) |
| 0.0 | 0.1 | GO:0033031 | positive regulation of neutrophil apoptotic process(GO:0033031) |
| 0.0 | 0.8 | GO:0007171 | activation of transmembrane receptor protein tyrosine kinase activity(GO:0007171) |
| 0.0 | 0.8 | GO:0035162 | embryonic hemopoiesis(GO:0035162) |
| 0.0 | 5.3 | GO:0010811 | positive regulation of cell-substrate adhesion(GO:0010811) |
| 0.0 | 0.3 | GO:0006449 | regulation of translational termination(GO:0006449) |
| 0.0 | 1.1 | GO:0018149 | peptide cross-linking(GO:0018149) |
| 0.0 | 2.0 | GO:0002479 | antigen processing and presentation of exogenous peptide antigen via MHC class I, TAP-dependent(GO:0002479) |
| 0.0 | 0.1 | GO:0018963 | phthalate metabolic process(GO:0018963) |
| 0.0 | 1.5 | GO:0042267 | natural killer cell mediated cytotoxicity(GO:0042267) |
| 0.0 | 0.7 | GO:0008053 | mitochondrial fusion(GO:0008053) |
| 0.0 | 0.5 | GO:1903204 | negative regulation of oxidative stress-induced neuron death(GO:1903204) |
| 0.0 | 0.2 | GO:0031937 | positive regulation of chromatin silencing(GO:0031937) |
| 0.0 | 1.9 | GO:0032436 | positive regulation of proteasomal ubiquitin-dependent protein catabolic process(GO:0032436) |
| 0.0 | 0.2 | GO:0071027 | nuclear RNA surveillance(GO:0071027) nuclear mRNA surveillance(GO:0071028) |
| 0.0 | 0.0 | GO:0010728 | regulation of hydrogen peroxide biosynthetic process(GO:0010728) |
| 0.0 | 0.3 | GO:0031581 | hemidesmosome assembly(GO:0031581) |
Gene overrepresentation in cellular component category:
| Log-likelihood per target | Total log-likelihood | Term | Description |
|---|---|---|---|
| 2.3 | 9.3 | GO:0031838 | haptoglobin-hemoglobin complex(GO:0031838) |
| 1.4 | 4.3 | GO:0005900 | oncostatin-M receptor complex(GO:0005900) |
| 1.3 | 16.5 | GO:0070552 | BRISC complex(GO:0070552) |
| 1.1 | 3.4 | GO:1990622 | CHOP-ATF3 complex(GO:1990622) |
| 0.8 | 9.9 | GO:0005577 | fibrinogen complex(GO:0005577) |
| 0.6 | 2.8 | GO:0034665 | integrin alpha1-beta1 complex(GO:0034665) |
| 0.4 | 7.9 | GO:0031089 | platelet dense granule lumen(GO:0031089) |
| 0.3 | 3.1 | GO:0071953 | elastic fiber(GO:0071953) |
| 0.3 | 2.7 | GO:1990037 | Lewy body core(GO:1990037) |
| 0.3 | 2.4 | GO:1990111 | spermatoproteasome complex(GO:1990111) |
| 0.3 | 1.3 | GO:0000839 | Hrd1p ubiquitin ligase ERAD-L complex(GO:0000839) |
| 0.2 | 2.9 | GO:1990316 | ATG1/ULK1 kinase complex(GO:1990316) |
| 0.2 | 5.1 | GO:0043203 | axon hillock(GO:0043203) |
| 0.2 | 16.7 | GO:1904724 | tertiary granule lumen(GO:1904724) |
| 0.2 | 1.2 | GO:0005850 | eukaryotic translation initiation factor 2 complex(GO:0005850) |
| 0.1 | 1.6 | GO:0042567 | insulin-like growth factor ternary complex(GO:0042567) |
| 0.1 | 1.4 | GO:0016593 | Cdc73/Paf1 complex(GO:0016593) |
| 0.1 | 1.1 | GO:0070765 | gamma-secretase complex(GO:0070765) |
| 0.1 | 3.5 | GO:0005614 | interstitial matrix(GO:0005614) |
| 0.1 | 6.7 | GO:0031907 | peroxisomal matrix(GO:0005782) microbody lumen(GO:0031907) |
| 0.1 | 1.7 | GO:0005641 | nuclear envelope lumen(GO:0005641) |
| 0.1 | 2.5 | GO:0042101 | T cell receptor complex(GO:0042101) |
| 0.1 | 4.7 | GO:0009295 | nucleoid(GO:0009295) mitochondrial nucleoid(GO:0042645) |
| 0.1 | 5.9 | GO:0016235 | aggresome(GO:0016235) |
| 0.1 | 1.5 | GO:0000164 | protein phosphatase type 1 complex(GO:0000164) |
| 0.1 | 6.0 | GO:0031093 | platelet alpha granule lumen(GO:0031093) |
| 0.0 | 4.5 | GO:0015030 | Cajal body(GO:0015030) |
| 0.0 | 0.9 | GO:0044233 | ER-mitochondrion membrane contact site(GO:0044233) |
| 0.0 | 1.2 | GO:0010369 | chromocenter(GO:0010369) |
| 0.0 | 1.7 | GO:0034361 | very-low-density lipoprotein particle(GO:0034361) triglyceride-rich lipoprotein particle(GO:0034385) |
| 0.0 | 1.0 | GO:0005915 | zonula adherens(GO:0005915) |
| 0.0 | 2.9 | GO:0001533 | cornified envelope(GO:0001533) |
| 0.0 | 0.6 | GO:0071664 | beta-catenin-TCF7L2 complex(GO:0070369) catenin-TCF7L2 complex(GO:0071664) |
| 0.0 | 6.1 | GO:0005901 | caveola(GO:0005901) |
| 0.0 | 1.1 | GO:1990124 | messenger ribonucleoprotein complex(GO:1990124) |
| 0.0 | 0.2 | GO:0035867 | alphav-beta3 integrin-IGF-1-IGF1R complex(GO:0035867) |
| 0.0 | 3.6 | GO:0031526 | brush border membrane(GO:0031526) |
| 0.0 | 0.3 | GO:0005610 | laminin-5 complex(GO:0005610) |
| 0.0 | 3.2 | GO:0005902 | microvillus(GO:0005902) |
| 0.0 | 0.3 | GO:0044305 | calyx of Held(GO:0044305) |
| 0.0 | 0.8 | GO:0032982 | myosin filament(GO:0032982) |
| 0.0 | 2.5 | GO:0035577 | azurophil granule membrane(GO:0035577) |
| 0.0 | 0.5 | GO:0042622 | photoreceptor outer segment membrane(GO:0042622) |
| 0.0 | 45.4 | GO:0005615 | extracellular space(GO:0005615) |
| 0.0 | 3.8 | GO:0032587 | ruffle membrane(GO:0032587) |
| 0.0 | 0.3 | GO:0030897 | HOPS complex(GO:0030897) |
| 0.0 | 0.5 | GO:0005721 | pericentric heterochromatin(GO:0005721) |
| 0.0 | 0.4 | GO:0043220 | Schmidt-Lanterman incisure(GO:0043220) |
| 0.0 | 0.8 | GO:0032839 | dendrite cytoplasm(GO:0032839) |
| 0.0 | 0.9 | GO:0099738 | cell cortex region(GO:0099738) |
| 0.0 | 3.2 | GO:0090575 | RNA polymerase II transcription factor complex(GO:0090575) |
| 0.0 | 7.4 | GO:0005759 | mitochondrial matrix(GO:0005759) |
| 0.0 | 1.3 | GO:0070821 | tertiary granule membrane(GO:0070821) |
| 0.0 | 1.5 | GO:0042470 | melanosome(GO:0042470) pigment granule(GO:0048770) |
| 0.0 | 0.8 | GO:0030670 | phagocytic vesicle membrane(GO:0030670) |
Gene overrepresentation in molecular function category:
| Log-likelihood per target | Total log-likelihood | Term | Description |
|---|---|---|---|
| 2.9 | 8.7 | GO:0004613 | phosphoenolpyruvate carboxykinase activity(GO:0004611) phosphoenolpyruvate carboxykinase (GTP) activity(GO:0004613) |
| 1.8 | 16.5 | GO:0004372 | glycine hydroxymethyltransferase activity(GO:0004372) threonine aldolase activity(GO:0004793) L-allo-threonine aldolase activity(GO:0008732) |
| 1.5 | 4.5 | GO:0008859 | exoribonuclease II activity(GO:0008859) |
| 1.3 | 9.3 | GO:0030492 | hemoglobin binding(GO:0030492) |
| 1.3 | 7.9 | GO:0060230 | lipoprotein lipase activator activity(GO:0060230) |
| 1.2 | 6.1 | GO:0004392 | heme oxygenase (decyclizing) activity(GO:0004392) |
| 1.2 | 4.7 | GO:0004087 | carbamoyl-phosphate synthase (ammonia) activity(GO:0004087) carbamoyl-phosphate synthase (glutamine-hydrolyzing) activity(GO:0004088) |
| 1.1 | 6.3 | GO:0031735 | CCR10 chemokine receptor binding(GO:0031735) |
| 0.9 | 8.5 | GO:0070891 | lipoteichoic acid binding(GO:0070891) |
| 0.9 | 6.1 | GO:0004122 | cystathionine beta-synthase activity(GO:0004122) |
| 0.8 | 5.0 | GO:0008453 | alanine-glyoxylate transaminase activity(GO:0008453) |
| 0.7 | 3.7 | GO:0004329 | formate-tetrahydrofolate ligase activity(GO:0004329) |
| 0.7 | 4.3 | GO:0004924 | oncostatin-M receptor activity(GO:0004924) |
| 0.7 | 3.5 | GO:0070052 | collagen V binding(GO:0070052) |
| 0.7 | 5.9 | GO:0034988 | Fc-gamma receptor I complex binding(GO:0034988) |
| 0.6 | 1.7 | GO:0005150 | interleukin-1, Type I receptor binding(GO:0005150) |
| 0.6 | 3.9 | GO:0016841 | ammonia-lyase activity(GO:0016841) |
| 0.5 | 1.6 | GO:0070538 | oleic acid binding(GO:0070538) |
| 0.5 | 2.7 | GO:0004914 | interleukin-5 receptor activity(GO:0004914) |
| 0.5 | 10.3 | GO:0055106 | ubiquitin-protein transferase regulator activity(GO:0055106) |
| 0.5 | 3.8 | GO:0043120 | tumor necrosis factor binding(GO:0043120) |
| 0.4 | 1.7 | GO:0034189 | very-low-density lipoprotein particle binding(GO:0034189) |
| 0.4 | 1.6 | GO:0015375 | glycine:sodium symporter activity(GO:0015375) |
| 0.4 | 2.5 | GO:0015186 | L-glutamine transmembrane transporter activity(GO:0015186) |
| 0.3 | 2.8 | GO:0004735 | pyrroline-5-carboxylate reductase activity(GO:0004735) |
| 0.3 | 1.0 | GO:0004418 | hydroxymethylbilane synthase activity(GO:0004418) |
| 0.3 | 2.9 | GO:0070728 | leucine binding(GO:0070728) |
| 0.3 | 5.3 | GO:0004568 | chitinase activity(GO:0004568) |
| 0.3 | 2.8 | GO:0098639 | collagen binding involved in cell-matrix adhesion(GO:0098639) |
| 0.3 | 0.9 | GO:0044715 | 8-oxo-dGDP phosphatase activity(GO:0044715) |
| 0.3 | 3.6 | GO:0050692 | DBD domain binding(GO:0050692) |
| 0.3 | 5.7 | GO:0008430 | selenium binding(GO:0008430) |
| 0.2 | 3.7 | GO:0001135 | transcription factor activity, RNA polymerase II transcription factor recruiting(GO:0001135) |
| 0.2 | 1.0 | GO:0070095 | fructose-6-phosphate binding(GO:0070095) |
| 0.2 | 2.1 | GO:0001849 | complement component C1q binding(GO:0001849) |
| 0.2 | 1.1 | GO:0043546 | molybdopterin cofactor binding(GO:0043546) |
| 0.2 | 14.7 | GO:0005160 | transforming growth factor beta receptor binding(GO:0005160) |
| 0.2 | 3.7 | GO:0019841 | retinol binding(GO:0019841) |
| 0.1 | 3.7 | GO:0030957 | Tat protein binding(GO:0030957) |
| 0.1 | 1.8 | GO:0030280 | structural constituent of epidermis(GO:0030280) |
| 0.1 | 0.8 | GO:0102008 | cytosolic dipeptidase activity(GO:0102008) |
| 0.1 | 1.1 | GO:0015184 | L-cystine transmembrane transporter activity(GO:0015184) |
| 0.1 | 1.6 | GO:0031995 | insulin-like growth factor II binding(GO:0031995) |
| 0.1 | 1.4 | GO:0015093 | ferrous iron transmembrane transporter activity(GO:0015093) |
| 0.1 | 1.1 | GO:0043533 | inositol 1,3,4,5 tetrakisphosphate binding(GO:0043533) |
| 0.1 | 0.5 | GO:0047894 | flavonol 3-sulfotransferase activity(GO:0047894) |
| 0.1 | 31.1 | GO:0004252 | serine-type endopeptidase activity(GO:0004252) |
| 0.1 | 2.5 | GO:0035925 | mRNA 3'-UTR AU-rich region binding(GO:0035925) |
| 0.1 | 2.4 | GO:0070003 | threonine-type endopeptidase activity(GO:0004298) threonine-type peptidase activity(GO:0070003) |
| 0.1 | 1.2 | GO:0019957 | C-C chemokine binding(GO:0019957) |
| 0.1 | 1.3 | GO:1904264 | ubiquitin protein ligase activity involved in ERAD pathway(GO:1904264) |
| 0.1 | 2.2 | GO:0032794 | GTPase activating protein binding(GO:0032794) |
| 0.1 | 2.5 | GO:0017081 | chloride channel regulator activity(GO:0017081) |
| 0.1 | 7.0 | GO:0004869 | cysteine-type endopeptidase inhibitor activity(GO:0004869) |
| 0.1 | 0.3 | GO:0003839 | gamma-glutamylcyclotransferase activity(GO:0003839) |
| 0.1 | 0.2 | GO:0034353 | RNA pyrophosphohydrolase activity(GO:0034353) |
| 0.1 | 0.8 | GO:0052658 | inositol-1,4,5-trisphosphate 5-phosphatase activity(GO:0052658) |
| 0.1 | 1.4 | GO:0008195 | phosphatidate phosphatase activity(GO:0008195) |
| 0.1 | 2.1 | GO:0001972 | retinoic acid binding(GO:0001972) |
| 0.0 | 0.4 | GO:0043812 | phosphatidylinositol-4-phosphate phosphatase activity(GO:0043812) |
| 0.0 | 0.2 | GO:0005010 | insulin-like growth factor-activated receptor activity(GO:0005010) |
| 0.0 | 2.0 | GO:0015269 | calcium-activated potassium channel activity(GO:0015269) |
| 0.0 | 0.5 | GO:0015272 | ATP-activated inward rectifier potassium channel activity(GO:0015272) |
| 0.0 | 0.8 | GO:0043522 | leucine zipper domain binding(GO:0043522) |
| 0.0 | 0.8 | GO:0038062 | protein tyrosine kinase collagen receptor activity(GO:0038062) collagen receptor activity(GO:0038064) |
| 0.0 | 5.8 | GO:0004867 | serine-type endopeptidase inhibitor activity(GO:0004867) |
| 0.0 | 3.6 | GO:0003743 | translation initiation factor activity(GO:0003743) |
| 0.0 | 0.9 | GO:0034185 | apolipoprotein binding(GO:0034185) |
| 0.0 | 0.2 | GO:0004084 | branched-chain-amino-acid transaminase activity(GO:0004084) L-leucine transaminase activity(GO:0052654) L-valine transaminase activity(GO:0052655) L-isoleucine transaminase activity(GO:0052656) |
| 0.0 | 0.7 | GO:0005432 | calcium:sodium antiporter activity(GO:0005432) |
| 0.0 | 1.5 | GO:0015347 | sodium-independent organic anion transmembrane transporter activity(GO:0015347) |
| 0.0 | 1.9 | GO:0031624 | ubiquitin conjugating enzyme binding(GO:0031624) |
| 0.0 | 0.3 | GO:0003747 | translation release factor activity(GO:0003747) translation termination factor activity(GO:0008079) |
| 0.0 | 0.7 | GO:0051400 | BH domain binding(GO:0051400) |
| 0.0 | 0.5 | GO:0008020 | G-protein coupled photoreceptor activity(GO:0008020) |
| 0.0 | 0.1 | GO:0004925 | prolactin receptor activity(GO:0004925) |
| 0.0 | 1.0 | GO:0008569 | ATP-dependent microtubule motor activity, minus-end-directed(GO:0008569) |
| 0.0 | 4.6 | GO:0008170 | N-methyltransferase activity(GO:0008170) |
| 0.0 | 0.9 | GO:0005328 | neurotransmitter:sodium symporter activity(GO:0005328) |
| 0.0 | 1.0 | GO:0005104 | fibroblast growth factor receptor binding(GO:0005104) |
| 0.0 | 0.6 | GO:0045295 | gamma-catenin binding(GO:0045295) |
| 0.0 | 0.7 | GO:0005161 | platelet-derived growth factor receptor binding(GO:0005161) |
| 0.0 | 4.9 | GO:0005178 | integrin binding(GO:0005178) |
| 0.0 | 0.3 | GO:0048273 | mitogen-activated protein kinase p38 binding(GO:0048273) |
| 0.0 | 0.3 | GO:0008525 | phosphatidylcholine transporter activity(GO:0008525) |
| 0.0 | 0.2 | GO:0005143 | interleukin-12 receptor binding(GO:0005143) |
| 0.0 | 0.5 | GO:0051864 | histone demethylase activity (H3-K9 specific)(GO:0032454) histone demethylase activity (H3-K36 specific)(GO:0051864) |
| 0.0 | 0.2 | GO:0008449 | N-acetylglucosamine-6-sulfatase activity(GO:0008449) |
| 0.0 | 4.5 | GO:0001078 | transcriptional repressor activity, RNA polymerase II core promoter proximal region sequence-specific binding(GO:0001078) |
| 0.0 | 1.7 | GO:0005518 | collagen binding(GO:0005518) |
| 0.0 | 1.5 | GO:0051213 | dioxygenase activity(GO:0051213) |
| 0.0 | 0.8 | GO:0000146 | microfilament motor activity(GO:0000146) |
| 0.0 | 1.2 | GO:0043022 | ribosome binding(GO:0043022) |
| 0.0 | 1.2 | GO:0070888 | E-box binding(GO:0070888) |
| 0.0 | 5.4 | GO:0030246 | carbohydrate binding(GO:0030246) |
| 0.0 | 0.3 | GO:0015271 | outward rectifier potassium channel activity(GO:0015271) |
| 0.0 | 1.5 | GO:0005179 | hormone activity(GO:0005179) |
| 0.0 | 0.4 | GO:0005545 | 1-phosphatidylinositol binding(GO:0005545) |
Gene overrepresentation in curated gene sets: canonical pathways category:
| Log-likelihood per target | Total log-likelihood | Term | Description |
|---|---|---|---|
| 0.3 | 16.8 | PID INTEGRIN2 PATHWAY | Beta2 integrin cell surface interactions |
| 0.2 | 2.7 | PID IL5 PATHWAY | IL5-mediated signaling events |
| 0.2 | 11.2 | PID AMB2 NEUTROPHILS PATHWAY | amb2 Integrin signaling |
| 0.1 | 9.8 | PID FRA PATHWAY | Validated transcriptional targets of AP1 family members Fra1 and Fra2 |
| 0.1 | 8.7 | PID HNF3B PATHWAY | FOXA2 and FOXA3 transcription factor networks |
| 0.1 | 2.8 | PID INTEGRIN CS PATHWAY | Integrin family cell surface interactions |
| 0.1 | 2.8 | SA MMP CYTOKINE CONNECTION | Cytokines can induce activation of matrix metalloproteinases, which degrade extracellular matrix. |
| 0.1 | 3.0 | PID UPA UPAR PATHWAY | Urokinase-type plasminogen activator (uPA) and uPAR-mediated signaling |
| 0.1 | 3.6 | PID WNT NONCANONICAL PATHWAY | Noncanonical Wnt signaling pathway |
| 0.1 | 5.7 | PID IL6 7 PATHWAY | IL6-mediated signaling events |
| 0.0 | 2.6 | ST ADRENERGIC | Adrenergic Pathway |
| 0.0 | 1.1 | PID SYNDECAN 3 PATHWAY | Syndecan-3-mediated signaling events |
| 0.0 | 1.1 | PID AURORA A PATHWAY | Aurora A signaling |
| 0.0 | 20.2 | NABA SECRETED FACTORS | Genes encoding secreted soluble factors |
| 0.0 | 1.5 | PID CD40 PATHWAY | CD40/CD40L signaling |
| 0.0 | 3.2 | PID AP1 PATHWAY | AP-1 transcription factor network |
| 0.0 | 14.8 | NABA ECM REGULATORS | Genes encoding enzymes and their regulators involved in the remodeling of the extracellular matrix |
| 0.0 | 2.5 | PID PI3KCI PATHWAY | Class I PI3K signaling events |
| 0.0 | 1.7 | NABA PROTEOGLYCANS | Genes encoding proteoglycans |
| 0.0 | 0.8 | PID EPO PATHWAY | EPO signaling pathway |
| 0.0 | 2.0 | PID CDC42 REG PATHWAY | Regulation of CDC42 activity |
| 0.0 | 3.1 | PID BETA CATENIN NUC PATHWAY | Regulation of nuclear beta catenin signaling and target gene transcription |
| 0.0 | 2.1 | PID TELOMERASE PATHWAY | Regulation of Telomerase |
| 0.0 | 1.2 | PID ECADHERIN STABILIZATION PATHWAY | Stabilization and expansion of the E-cadherin adherens junction |
| 0.0 | 0.2 | PID IL2 STAT5 PATHWAY | IL2 signaling events mediated by STAT5 |
| 0.0 | 4.5 | NABA ECM GLYCOPROTEINS | Genes encoding structural ECM glycoproteins |
| 0.0 | 0.5 | PID CONE PATHWAY | Visual signal transduction: Cones |
| 0.0 | 0.7 | PID NFAT TFPATHWAY | Calcineurin-regulated NFAT-dependent transcription in lymphocytes |
| 0.0 | 0.7 | PID BCR 5PATHWAY | BCR signaling pathway |
| 0.0 | 1.4 | PID CMYB PATHWAY | C-MYB transcription factor network |
Gene overrepresentation in curated gene sets: REACTOME pathways category:
| Log-likelihood per target | Total log-likelihood | Term | Description |
|---|---|---|---|
| 0.7 | 9.2 | REACTOME GLYCOPROTEIN HORMONES | Genes involved in Glycoprotein hormones |
| 0.6 | 14.2 | REACTOME INITIAL TRIGGERING OF COMPLEMENT | Genes involved in Initial triggering of complement |
| 0.5 | 10.1 | REACTOME COMMON PATHWAY | Genes involved in Common Pathway |
| 0.5 | 10.3 | REACTOME NEGATIVE REGULATION OF THE PI3K AKT NETWORK | Genes involved in Negative regulation of the PI3K/AKT network |
| 0.5 | 8.7 | REACTOME ABACAVIR TRANSPORT AND METABOLISM | Genes involved in Abacavir transport and metabolism |
| 0.3 | 7.0 | REACTOME INTRINSIC PATHWAY | Genes involved in Intrinsic Pathway |
| 0.2 | 7.1 | REACTOME METABOLISM OF PORPHYRINS | Genes involved in Metabolism of porphyrins |
| 0.2 | 4.5 | REACTOME REGULATION OF INSULIN LIKE GROWTH FACTOR IGF ACTIVITY BY INSULIN LIKE GROWTH FACTOR BINDING PROTEINS IGFBPS | Genes involved in Regulation of Insulin-like Growth Factor (IGF) Activity by Insulin-like Growth Factor Binding Proteins (IGFBPs) |
| 0.1 | 5.9 | REACTOME PLATELET SENSITIZATION BY LDL | Genes involved in Platelet sensitization by LDL |
| 0.1 | 6.1 | REACTOME ACTIVATION OF GENES BY ATF4 | Genes involved in Activation of Genes by ATF4 |
| 0.1 | 3.8 | REACTOME EXTRINSIC PATHWAY FOR APOPTOSIS | Genes involved in Extrinsic Pathway for Apoptosis |
| 0.1 | 2.5 | REACTOME AMINO ACID SYNTHESIS AND INTERCONVERSION TRANSAMINATION | Genes involved in Amino acid synthesis and interconversion (transamination) |
| 0.1 | 2.8 | REACTOME DEGRADATION OF THE EXTRACELLULAR MATRIX | Genes involved in Degradation of the extracellular matrix |
| 0.1 | 2.8 | REACTOME OTHER SEMAPHORIN INTERACTIONS | Genes involved in Other semaphorin interactions |
| 0.1 | 2.5 | REACTOME GRB2 SOS PROVIDES LINKAGE TO MAPK SIGNALING FOR INTERGRINS | Genes involved in GRB2:SOS provides linkage to MAPK signaling for Intergrins |
| 0.1 | 2.8 | REACTOME SULFUR AMINO ACID METABOLISM | Genes involved in Sulfur amino acid metabolism |
| 0.1 | 2.5 | REACTOME NA CL DEPENDENT NEUROTRANSMITTER TRANSPORTERS | Genes involved in Na+/Cl- dependent neurotransmitter transporters |
| 0.1 | 15.8 | REACTOME METABOLISM OF AMINO ACIDS AND DERIVATIVES | Genes involved in Metabolism of amino acids and derivatives |
| 0.1 | 1.1 | REACTOME SIGNALING BY NOTCH4 | Genes involved in Signaling by NOTCH4 |
| 0.1 | 1.5 | REACTOME TRANSPORT OF ORGANIC ANIONS | Genes involved in Transport of organic anions |
| 0.1 | 4.8 | REACTOME CHEMOKINE RECEPTORS BIND CHEMOKINES | Genes involved in Chemokine receptors bind chemokines |
| 0.1 | 1.6 | REACTOME SYNTHESIS OF BILE ACIDS AND BILE SALTS VIA 7ALPHA HYDROXYCHOLESTEROL | Genes involved in Synthesis of bile acids and bile salts via 7alpha-hydroxycholesterol |
| 0.1 | 0.9 | REACTOME CALNEXIN CALRETICULIN CYCLE | Genes involved in Calnexin/calreticulin cycle |
| 0.1 | 1.4 | REACTOME SYNTHESIS OF PE | Genes involved in Synthesis of PE |
| 0.1 | 1.2 | REACTOME ER PHAGOSOME PATHWAY | Genes involved in ER-Phagosome pathway |
| 0.0 | 5.2 | REACTOME PHASE II CONJUGATION | Genes involved in Phase II conjugation |
| 0.0 | 1.7 | REACTOME IL1 SIGNALING | Genes involved in Interleukin-1 signaling |
| 0.0 | 0.8 | REACTOME REGULATION OF KIT SIGNALING | Genes involved in Regulation of KIT signaling |
| 0.0 | 4.5 | REACTOME INTERFERON ALPHA BETA SIGNALING | Genes involved in Interferon alpha/beta signaling |
| 0.0 | 0.7 | REACTOME VEGF LIGAND RECEPTOR INTERACTIONS | Genes involved in VEGF ligand-receptor interactions |
| 0.0 | 0.9 | REACTOME APOPTOTIC CLEAVAGE OF CELL ADHESION PROTEINS | Genes involved in Apoptotic cleavage of cell adhesion proteins |
| 0.0 | 6.4 | REACTOME TOLL RECEPTOR CASCADES | Genes involved in Toll Receptor Cascades |
| 0.0 | 1.3 | REACTOME IL RECEPTOR SHC SIGNALING | Genes involved in Interleukin receptor SHC signaling |
| 0.0 | 0.5 | REACTOME ADENYLATE CYCLASE INHIBITORY PATHWAY | Genes involved in Adenylate cyclase inhibitory pathway |
| 0.0 | 2.6 | REACTOME TRANSCRIPTIONAL REGULATION OF WHITE ADIPOCYTE DIFFERENTIATION | Genes involved in Transcriptional Regulation of White Adipocyte Differentiation |
| 0.0 | 1.7 | REACTOME LOSS OF NLP FROM MITOTIC CENTROSOMES | Genes involved in Loss of Nlp from mitotic centrosomes |
| 0.0 | 1.3 | REACTOME ACTIVATION OF CHAPERONE GENES BY XBP1S | Genes involved in Activation of Chaperone Genes by XBP1(S) |
| 0.0 | 0.4 | REACTOME SYNTHESIS OF PIPS AT THE GOLGI MEMBRANE | Genes involved in Synthesis of PIPs at the Golgi membrane |
| 0.0 | 2.4 | REACTOME FACTORS INVOLVED IN MEGAKARYOCYTE DEVELOPMENT AND PLATELET PRODUCTION | Genes involved in Factors involved in megakaryocyte development and platelet production |
| 0.0 | 0.3 | REACTOME TANDEM PORE DOMAIN POTASSIUM CHANNELS | Genes involved in Tandem pore domain potassium channels |
| 0.0 | 0.6 | REACTOME ASSOCIATION OF TRIC CCT WITH TARGET PROTEINS DURING BIOSYNTHESIS | Genes involved in Association of TriC/CCT with target proteins during biosynthesis |
| 0.0 | 0.5 | REACTOME PLC BETA MEDIATED EVENTS | Genes involved in PLC beta mediated events |