Project
Illumina Body Map 2 (GSE30611)
Navigation
Downloads
Results for CTCF_CTCFL
Z-value: 1.13
Motif logo
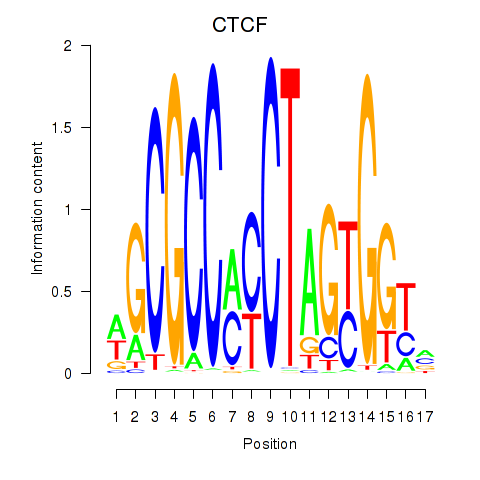
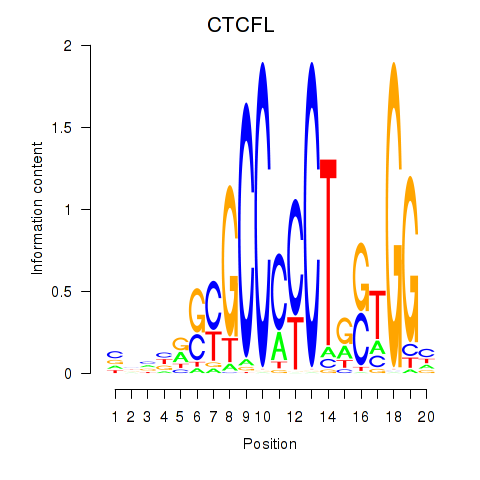
Transcription factors associated with CTCF_CTCFL
| Gene Symbol | Gene ID | Gene Info |
|---|---|---|
|
CTCF
|
ENSG00000102974.16 | CCCTC-binding factor |
|
CTCFL
|
ENSG00000124092.13 | CCCTC-binding factor like |
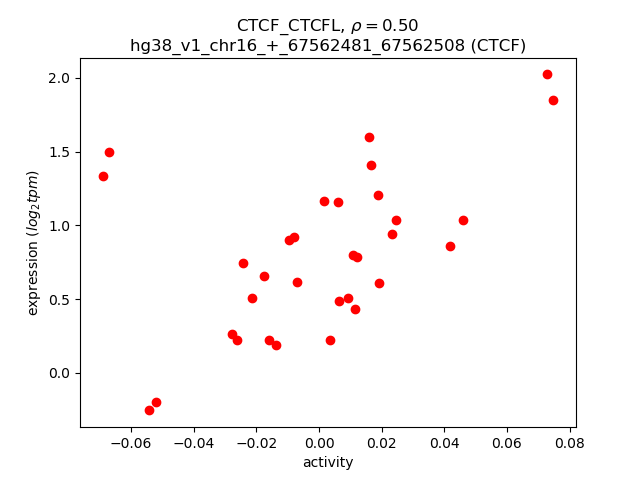
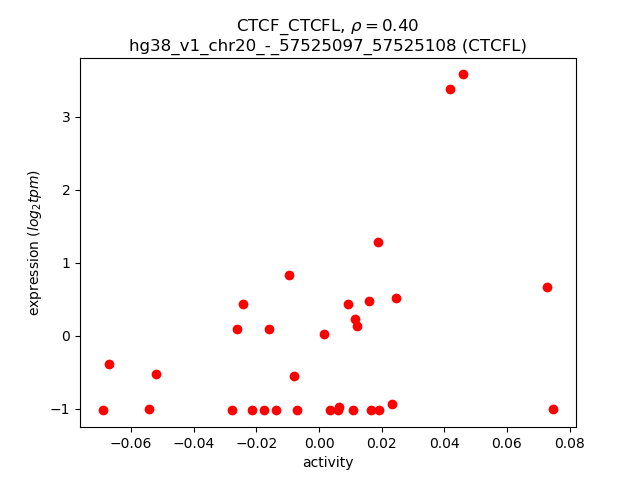
Activity-expression correlation:
| Gene | Promoter | Pearson corr. coef. | P-value | Plot |
|---|---|---|---|---|
| CTCF | hg38_v1_chr16_+_67562481_67562508 | 0.50 | 3.3e-03 | Click! |
| CTCFL | hg38_v1_chr20_-_57525097_57525108 | 0.40 | 2.5e-02 | Click! |
Activity profile of CTCF_CTCFL motif
Sorted Z-values of CTCF_CTCFL motif
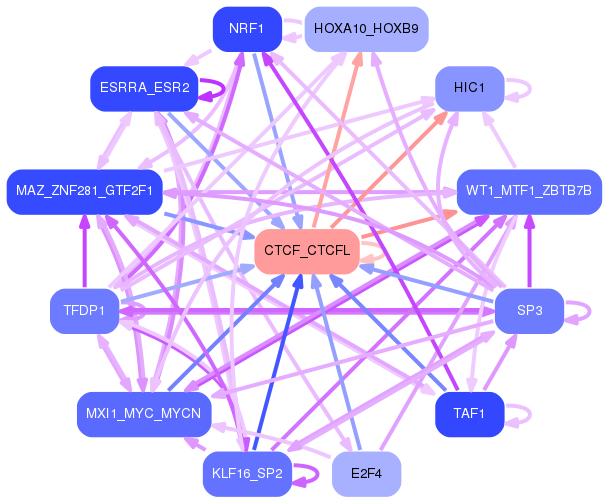
Network of associatons between targets according to the STRING database.

First level regulatory network of CTCF_CTCFL
Gene Ontology Analysis
Gene overrepresentation in biological process category:
| Log-likelihood per target | Total log-likelihood | Term | Description |
|---|---|---|---|
| 2.4 | 12.0 | GO:1901202 | negative regulation of extracellular matrix assembly(GO:1901202) |
| 0.8 | 3.3 | GO:0044691 | tooth eruption(GO:0044691) |
| 0.8 | 3.2 | GO:0031455 | glycine betaine biosynthetic process from choline(GO:0019285) glycine betaine metabolic process(GO:0031455) glycine betaine biosynthetic process(GO:0031456) |
| 0.5 | 1.6 | GO:0008065 | establishment of blood-nerve barrier(GO:0008065) positive regulation of bicellular tight junction assembly(GO:1903348) |
| 0.5 | 2.6 | GO:0003065 | positive regulation of heart rate by epinephrine(GO:0003065) |
| 0.5 | 2.5 | GO:0038098 | sequestering of BMP from receptor via BMP binding(GO:0038098) |
| 0.5 | 3.4 | GO:0003383 | apical constriction(GO:0003383) |
| 0.5 | 4.1 | GO:2001137 | positive regulation of endocytic recycling(GO:2001137) |
| 0.4 | 3.5 | GO:0030538 | embryonic genitalia morphogenesis(GO:0030538) |
| 0.4 | 3.4 | GO:0030241 | skeletal muscle myosin thick filament assembly(GO:0030241) |
| 0.4 | 1.9 | GO:1903575 | cornified envelope assembly(GO:1903575) |
| 0.4 | 1.1 | GO:0099540 | synaptic signaling via neuropeptide(GO:0099538) trans-synaptic signaling by neuropeptide(GO:0099540) trans-synaptic signaling by neuropeptide, modulating synaptic transmission(GO:0099551) |
| 0.4 | 2.2 | GO:2000721 | positive regulation of transcription from RNA polymerase II promoter involved in smooth muscle cell differentiation(GO:2000721) |
| 0.4 | 1.4 | GO:0072302 | negative regulation of metanephric glomerulus development(GO:0072299) negative regulation of metanephric glomerular mesangial cell proliferation(GO:0072302) |
| 0.3 | 1.4 | GO:0031443 | fast-twitch skeletal muscle fiber contraction(GO:0031443) |
| 0.3 | 4.1 | GO:0035865 | cellular response to potassium ion(GO:0035865) |
| 0.3 | 1.6 | GO:0030070 | insulin processing(GO:0030070) |
| 0.3 | 2.5 | GO:0035934 | corticosterone secretion(GO:0035934) |
| 0.3 | 1.5 | GO:0001575 | globoside metabolic process(GO:0001575) |
| 0.3 | 2.1 | GO:0098706 | ferric iron import into cell(GO:0097461) ferric iron import across plasma membrane(GO:0098706) |
| 0.3 | 5.0 | GO:0048672 | positive regulation of collateral sprouting(GO:0048672) |
| 0.3 | 1.2 | GO:0033686 | positive regulation of luteinizing hormone secretion(GO:0033686) |
| 0.3 | 3.4 | GO:0071907 | determination of digestive tract left/right asymmetry(GO:0071907) |
| 0.3 | 1.4 | GO:0035106 | operant conditioning(GO:0035106) |
| 0.3 | 1.1 | GO:0034148 | regulation of toll-like receptor 5 signaling pathway(GO:0034147) negative regulation of toll-like receptor 5 signaling pathway(GO:0034148) negative regulation of nucleotide-binding oligomerization domain containing 1 signaling pathway(GO:0070429) |
| 0.2 | 2.0 | GO:0030644 | cellular chloride ion homeostasis(GO:0030644) |
| 0.2 | 1.7 | GO:1901377 | mycotoxin catabolic process(GO:0043387) aflatoxin catabolic process(GO:0046223) organic heteropentacyclic compound catabolic process(GO:1901377) regulation of glutathione biosynthetic process(GO:1903786) positive regulation of glutathione biosynthetic process(GO:1903788) |
| 0.2 | 0.9 | GO:1990167 | protein K6-linked deubiquitination(GO:0044313) protein K27-linked deubiquitination(GO:1990167) |
| 0.2 | 0.7 | GO:1901492 | positive regulation of lymphangiogenesis(GO:1901492) |
| 0.2 | 1.6 | GO:0001920 | negative regulation of receptor recycling(GO:0001920) |
| 0.2 | 0.7 | GO:0090031 | renal vesicle induction(GO:0072034) positive regulation of steroid hormone biosynthetic process(GO:0090031) |
| 0.2 | 0.9 | GO:0097210 | response to gonadotropin-releasing hormone(GO:0097210) cellular response to gonadotropin-releasing hormone(GO:0097211) |
| 0.2 | 0.9 | GO:2000434 | regulation of protein neddylation(GO:2000434) negative regulation of protein neddylation(GO:2000435) |
| 0.2 | 1.1 | GO:0009257 | 10-formyltetrahydrofolate biosynthetic process(GO:0009257) |
| 0.2 | 1.2 | GO:0003431 | growth plate cartilage chondrocyte development(GO:0003431) |
| 0.2 | 1.4 | GO:0071169 | establishment of protein localization to chromatin(GO:0071169) |
| 0.2 | 1.1 | GO:1904526 | regulation of microtubule binding(GO:1904526) |
| 0.2 | 0.4 | GO:0051695 | actin filament uncapping(GO:0051695) |
| 0.2 | 7.3 | GO:0051764 | actin crosslink formation(GO:0051764) |
| 0.2 | 0.9 | GO:0035854 | regulation of primitive erythrocyte differentiation(GO:0010725) eosinophil fate commitment(GO:0035854) |
| 0.2 | 0.7 | GO:0032912 | negative regulation of transforming growth factor beta2 production(GO:0032912) |
| 0.2 | 0.7 | GO:0090258 | negative regulation of mitochondrial fission(GO:0090258) |
| 0.2 | 0.8 | GO:0035927 | RNA import into mitochondrion(GO:0035927) |
| 0.2 | 0.8 | GO:0044858 | plasma membrane raft distribution(GO:0044855) plasma membrane raft localization(GO:0044856) plasma membrane raft polarization(GO:0044858) regulation of plasma membrane raft polarization(GO:1903906) |
| 0.2 | 1.1 | GO:0030035 | microspike assembly(GO:0030035) |
| 0.2 | 0.6 | GO:1903445 | intermembrane transport(GO:0046909) protein transport from ciliary membrane to plasma membrane(GO:1903445) |
| 0.2 | 2.1 | GO:0060666 | dichotomous subdivision of terminal units involved in salivary gland branching(GO:0060666) |
| 0.2 | 1.7 | GO:0030259 | lipid glycosylation(GO:0030259) |
| 0.2 | 0.5 | GO:1901069 | guanosine-containing compound catabolic process(GO:1901069) |
| 0.2 | 0.8 | GO:0033512 | L-lysine catabolic process to acetyl-CoA via saccharopine(GO:0033512) |
| 0.2 | 0.6 | GO:0034402 | recruitment of 3'-end processing factors to RNA polymerase II holoenzyme complex(GO:0034402) |
| 0.1 | 0.6 | GO:0006272 | leading strand elongation(GO:0006272) |
| 0.1 | 1.3 | GO:0031444 | slow-twitch skeletal muscle fiber contraction(GO:0031444) |
| 0.1 | 2.0 | GO:0016191 | synaptic vesicle uncoating(GO:0016191) |
| 0.1 | 1.6 | GO:2000346 | negative regulation of hepatocyte proliferation(GO:2000346) |
| 0.1 | 0.3 | GO:0010868 | negative regulation of triglyceride biosynthetic process(GO:0010868) |
| 0.1 | 0.8 | GO:1900245 | positive regulation of MDA-5 signaling pathway(GO:1900245) |
| 0.1 | 1.4 | GO:0038028 | insulin receptor signaling pathway via phosphatidylinositol 3-kinase(GO:0038028) |
| 0.1 | 2.7 | GO:0000712 | resolution of meiotic recombination intermediates(GO:0000712) |
| 0.1 | 0.7 | GO:0061502 | early endosome to recycling endosome transport(GO:0061502) |
| 0.1 | 0.8 | GO:0021825 | cerebral cortex tangential migration using cell-cell interactions(GO:0021823) substrate-dependent cerebral cortex tangential migration(GO:0021825) postnatal olfactory bulb interneuron migration(GO:0021827) chemorepulsion involved in postnatal olfactory bulb interneuron migration(GO:0021836) negative regulation of negative chemotaxis(GO:0050925) |
| 0.1 | 0.7 | GO:1902626 | assembly of large subunit precursor of preribosome(GO:1902626) |
| 0.1 | 1.3 | GO:0051549 | positive regulation of keratinocyte migration(GO:0051549) |
| 0.1 | 0.4 | GO:2001295 | malonyl-CoA biosynthetic process(GO:2001295) |
| 0.1 | 0.5 | GO:0002268 | follicular dendritic cell differentiation(GO:0002268) |
| 0.1 | 1.1 | GO:0048386 | positive regulation of retinoic acid receptor signaling pathway(GO:0048386) |
| 0.1 | 0.3 | GO:0003420 | regulation of growth plate cartilage chondrocyte proliferation(GO:0003420) |
| 0.1 | 2.7 | GO:0048387 | negative regulation of retinoic acid receptor signaling pathway(GO:0048387) |
| 0.1 | 0.4 | GO:0046586 | regulation of calcium-dependent cell-cell adhesion(GO:0046586) |
| 0.1 | 0.5 | GO:1990502 | dense core granule maturation(GO:1990502) |
| 0.1 | 0.4 | GO:0014876 | negative regulation of muscle atrophy(GO:0014736) response to injury involved in regulation of muscle adaptation(GO:0014876) |
| 0.1 | 2.2 | GO:0035791 | platelet-derived growth factor receptor-beta signaling pathway(GO:0035791) |
| 0.1 | 3.6 | GO:0044342 | type B pancreatic cell proliferation(GO:0044342) |
| 0.1 | 1.4 | GO:0033314 | mitotic DNA replication checkpoint(GO:0033314) |
| 0.1 | 0.7 | GO:0098886 | modification of dendritic spine(GO:0098886) |
| 0.1 | 1.0 | GO:0032525 | somite rostral/caudal axis specification(GO:0032525) |
| 0.1 | 0.7 | GO:0010643 | cell communication by chemical coupling(GO:0010643) |
| 0.1 | 1.3 | GO:0035754 | B cell chemotaxis(GO:0035754) |
| 0.1 | 1.8 | GO:0036066 | protein O-linked fucosylation(GO:0036066) |
| 0.1 | 0.6 | GO:0016185 | synaptic vesicle budding from presynaptic endocytic zone membrane(GO:0016185) |
| 0.1 | 0.5 | GO:1902766 | skeletal muscle satellite cell migration(GO:1902766) |
| 0.1 | 0.5 | GO:1904565 | response to 1-oleoyl-sn-glycerol 3-phosphate(GO:1904565) cellular response to 1-oleoyl-sn-glycerol 3-phosphate(GO:1904566) |
| 0.1 | 2.5 | GO:0071318 | cellular response to ATP(GO:0071318) |
| 0.1 | 0.9 | GO:0044026 | DNA hypermethylation(GO:0044026) |
| 0.1 | 0.6 | GO:0032439 | endosome localization(GO:0032439) |
| 0.1 | 2.0 | GO:0006228 | UTP biosynthetic process(GO:0006228) |
| 0.1 | 0.5 | GO:0007198 | adenylate cyclase-inhibiting serotonin receptor signaling pathway(GO:0007198) |
| 0.1 | 2.8 | GO:0010804 | negative regulation of tumor necrosis factor-mediated signaling pathway(GO:0010804) |
| 0.1 | 1.8 | GO:0033235 | positive regulation of protein sumoylation(GO:0033235) |
| 0.1 | 0.9 | GO:0000389 | mRNA 3'-splice site recognition(GO:0000389) |
| 0.1 | 0.6 | GO:0042796 | snRNA transcription from RNA polymerase III promoter(GO:0042796) |
| 0.1 | 1.3 | GO:0097116 | gephyrin clustering involved in postsynaptic density assembly(GO:0097116) |
| 0.1 | 2.0 | GO:0007021 | tubulin complex assembly(GO:0007021) |
| 0.1 | 0.3 | GO:0034059 | response to anoxia(GO:0034059) |
| 0.1 | 0.4 | GO:0034421 | post-translational protein acetylation(GO:0034421) |
| 0.1 | 1.4 | GO:0000244 | spliceosomal tri-snRNP complex assembly(GO:0000244) |
| 0.1 | 0.3 | GO:0033341 | regulation of collagen binding(GO:0033341) |
| 0.1 | 0.8 | GO:0006398 | mRNA 3'-end processing by stem-loop binding and cleavage(GO:0006398) |
| 0.1 | 0.6 | GO:0061056 | sclerotome development(GO:0061056) |
| 0.1 | 0.7 | GO:0048478 | replication fork protection(GO:0048478) |
| 0.1 | 0.8 | GO:0075525 | viral translational termination-reinitiation(GO:0075525) |
| 0.1 | 0.3 | GO:0033693 | neurofilament bundle assembly(GO:0033693) |
| 0.1 | 0.4 | GO:1902228 | mammary gland fat development(GO:0060611) positive regulation of macrophage colony-stimulating factor signaling pathway(GO:1902228) positive regulation of response to macrophage colony-stimulating factor(GO:1903971) positive regulation of cellular response to macrophage colony-stimulating factor stimulus(GO:1903974) positive regulation of microglial cell migration(GO:1904141) |
| 0.1 | 0.3 | GO:0002188 | translation reinitiation(GO:0002188) |
| 0.1 | 0.8 | GO:0007185 | transmembrane receptor protein tyrosine phosphatase signaling pathway(GO:0007185) |
| 0.1 | 2.1 | GO:0060907 | positive regulation of macrophage cytokine production(GO:0060907) |
| 0.1 | 1.4 | GO:0035878 | nail development(GO:0035878) |
| 0.1 | 0.7 | GO:0031999 | negative regulation of fatty acid beta-oxidation(GO:0031999) |
| 0.1 | 0.4 | GO:0071500 | cellular response to nitrosative stress(GO:0071500) |
| 0.1 | 0.9 | GO:0000463 | maturation of LSU-rRNA from tricistronic rRNA transcript (SSU-rRNA, 5.8S rRNA, LSU-rRNA)(GO:0000463) |
| 0.1 | 0.4 | GO:0050915 | sensory perception of sour taste(GO:0050915) |
| 0.1 | 0.1 | GO:1900222 | negative regulation of beta-amyloid clearance(GO:1900222) |
| 0.1 | 0.1 | GO:0043974 | histone H3-K27 acetylation(GO:0043974) regulation of histone H3-K27 acetylation(GO:1901674) |
| 0.1 | 0.6 | GO:0035511 | oxidative DNA demethylation(GO:0035511) |
| 0.1 | 2.4 | GO:0033622 | integrin activation(GO:0033622) |
| 0.1 | 0.3 | GO:0009082 | branched-chain amino acid biosynthetic process(GO:0009082) leucine biosynthetic process(GO:0009098) valine biosynthetic process(GO:0009099) |
| 0.1 | 0.4 | GO:0090070 | positive regulation of ribosome biogenesis(GO:0090070) positive regulation of rRNA processing(GO:2000234) |
| 0.1 | 0.5 | GO:0035610 | protein side chain deglutamylation(GO:0035610) |
| 0.1 | 0.3 | GO:0014022 | neural plate elongation(GO:0014022) convergent extension involved in neural plate elongation(GO:0022007) |
| 0.1 | 0.6 | GO:0000707 | meiotic DNA recombinase assembly(GO:0000707) |
| 0.1 | 0.4 | GO:0060800 | regulation of cell differentiation involved in embryonic placenta development(GO:0060800) |
| 0.1 | 0.2 | GO:1902775 | mitochondrial large ribosomal subunit assembly(GO:1902775) |
| 0.1 | 0.5 | GO:0021798 | forebrain dorsal/ventral pattern formation(GO:0021798) |
| 0.1 | 0.5 | GO:0000255 | allantoin metabolic process(GO:0000255) isoleucine metabolic process(GO:0006549) |
| 0.1 | 0.7 | GO:1901748 | leukotriene D4 metabolic process(GO:1901748) leukotriene D4 biosynthetic process(GO:1901750) |
| 0.1 | 1.5 | GO:1900025 | negative regulation of substrate adhesion-dependent cell spreading(GO:1900025) |
| 0.1 | 0.2 | GO:0098917 | retrograde trans-synaptic signaling(GO:0098917) |
| 0.1 | 0.2 | GO:0006384 | transcription initiation from RNA polymerase III promoter(GO:0006384) |
| 0.1 | 0.4 | GO:1904100 | regulation of protein O-linked glycosylation(GO:1904098) positive regulation of protein O-linked glycosylation(GO:1904100) |
| 0.1 | 0.5 | GO:0043615 | astrocyte cell migration(GO:0043615) |
| 0.1 | 1.9 | GO:0000387 | spliceosomal snRNP assembly(GO:0000387) |
| 0.1 | 0.5 | GO:0051694 | pointed-end actin filament capping(GO:0051694) |
| 0.1 | 0.5 | GO:0098887 | neurotransmitter receptor transport, endosome to postsynaptic membrane(GO:0098887) |
| 0.1 | 0.4 | GO:0000720 | pyrimidine dimer repair by nucleotide-excision repair(GO:0000720) positive regulation of t-circle formation(GO:1904431) |
| 0.1 | 1.1 | GO:0006703 | estrogen biosynthetic process(GO:0006703) |
| 0.1 | 0.3 | GO:0072425 | signal transduction involved in G2 DNA damage checkpoint(GO:0072425) signal transduction involved in mitotic G2 DNA damage checkpoint(GO:0072434) |
| 0.1 | 0.4 | GO:2000819 | regulation of nucleotide-excision repair(GO:2000819) |
| 0.1 | 0.7 | GO:2000623 | regulation of nuclear-transcribed mRNA catabolic process, nonsense-mediated decay(GO:2000622) negative regulation of nuclear-transcribed mRNA catabolic process, nonsense-mediated decay(GO:2000623) |
| 0.1 | 1.6 | GO:0014850 | response to muscle activity(GO:0014850) |
| 0.1 | 1.5 | GO:0098903 | regulation of membrane repolarization during action potential(GO:0098903) |
| 0.1 | 0.2 | GO:1902474 | positive regulation of protein localization to synapse(GO:1902474) |
| 0.1 | 0.3 | GO:0060370 | susceptibility to T cell mediated cytotoxicity(GO:0060370) |
| 0.0 | 2.6 | GO:0032292 | myelination in peripheral nervous system(GO:0022011) peripheral nervous system axon ensheathment(GO:0032292) |
| 0.0 | 0.8 | GO:0043619 | regulation of transcription from RNA polymerase II promoter in response to oxidative stress(GO:0043619) |
| 0.0 | 0.8 | GO:1902730 | regulation of heparan sulfate proteoglycan biosynthetic process(GO:0010908) positive regulation of heparan sulfate proteoglycan biosynthetic process(GO:0010909) positive regulation of proteoglycan biosynthetic process(GO:1902730) |
| 0.0 | 0.3 | GO:0030174 | regulation of DNA-dependent DNA replication initiation(GO:0030174) |
| 0.0 | 0.3 | GO:1903412 | response to bile acid(GO:1903412) |
| 0.0 | 0.5 | GO:0030472 | mitotic spindle organization in nucleus(GO:0030472) |
| 0.0 | 0.3 | GO:0044565 | dendritic cell proliferation(GO:0044565) |
| 0.0 | 0.3 | GO:1904355 | positive regulation of telomere capping(GO:1904355) |
| 0.0 | 0.2 | GO:0018262 | isopeptide cross-linking via N6-(L-isoglutamyl)-L-lysine(GO:0018153) isopeptide cross-linking(GO:0018262) |
| 0.0 | 0.4 | GO:0001826 | inner cell mass cell differentiation(GO:0001826) |
| 0.0 | 0.5 | GO:2000601 | positive regulation of Arp2/3 complex-mediated actin nucleation(GO:2000601) |
| 0.0 | 1.1 | GO:0032060 | bleb assembly(GO:0032060) |
| 0.0 | 0.6 | GO:0070494 | regulation of thrombin receptor signaling pathway(GO:0070494) negative regulation of thrombin receptor signaling pathway(GO:0070495) |
| 0.0 | 1.0 | GO:1901223 | negative regulation of NIK/NF-kappaB signaling(GO:1901223) |
| 0.0 | 0.1 | GO:0016321 | female meiosis chromosome segregation(GO:0016321) |
| 0.0 | 1.4 | GO:0034755 | iron ion transmembrane transport(GO:0034755) |
| 0.0 | 1.3 | GO:1904776 | regulation of protein localization to cell cortex(GO:1904776) positive regulation of protein localization to cell cortex(GO:1904778) |
| 0.0 | 0.5 | GO:0032020 | ISG15-protein conjugation(GO:0032020) |
| 0.0 | 0.2 | GO:0032431 | activation of phospholipase A2 activity(GO:0032431) |
| 0.0 | 1.9 | GO:0016339 | calcium-dependent cell-cell adhesion via plasma membrane cell adhesion molecules(GO:0016339) |
| 0.0 | 0.2 | GO:1903613 | regulation of protein tyrosine phosphatase activity(GO:1903613) positive regulation of protein tyrosine phosphatase activity(GO:1903615) |
| 0.0 | 1.1 | GO:0006123 | mitochondrial electron transport, cytochrome c to oxygen(GO:0006123) |
| 0.0 | 0.1 | GO:0097010 | eukaryotic translation initiation factor 4F complex assembly(GO:0097010) |
| 0.0 | 0.2 | GO:1901727 | positive regulation of histone deacetylase activity(GO:1901727) |
| 0.0 | 0.5 | GO:0046600 | negative regulation of centriole replication(GO:0046600) |
| 0.0 | 1.2 | GO:0039702 | viral budding via host ESCRT complex(GO:0039702) |
| 0.0 | 0.6 | GO:0048266 | behavioral response to pain(GO:0048266) |
| 0.0 | 0.6 | GO:1901407 | regulation of phosphorylation of RNA polymerase II C-terminal domain(GO:1901407) |
| 0.0 | 0.2 | GO:0033274 | response to vitamin B2(GO:0033274) heterochromatin maintenance(GO:0070829) |
| 0.0 | 0.5 | GO:0015014 | heparan sulfate proteoglycan biosynthetic process, polysaccharide chain biosynthetic process(GO:0015014) |
| 0.0 | 0.4 | GO:1902857 | positive regulation of nonmotile primary cilium assembly(GO:1902857) |
| 0.0 | 0.8 | GO:1902018 | negative regulation of cilium assembly(GO:1902018) |
| 0.0 | 1.2 | GO:0034063 | stress granule assembly(GO:0034063) |
| 0.0 | 0.5 | GO:0034472 | snRNA 3'-end processing(GO:0034472) |
| 0.0 | 3.8 | GO:0035690 | cellular response to drug(GO:0035690) |
| 0.0 | 1.4 | GO:0061003 | positive regulation of dendritic spine morphogenesis(GO:0061003) |
| 0.0 | 0.3 | GO:0035356 | cellular triglyceride homeostasis(GO:0035356) |
| 0.0 | 0.2 | GO:2000984 | regulation of ATP citrate synthase activity(GO:2000983) negative regulation of ATP citrate synthase activity(GO:2000984) |
| 0.0 | 0.5 | GO:0061088 | regulation of sequestering of zinc ion(GO:0061088) |
| 0.0 | 0.8 | GO:0048172 | regulation of short-term neuronal synaptic plasticity(GO:0048172) |
| 0.0 | 0.2 | GO:0010157 | response to chlorate(GO:0010157) |
| 0.0 | 0.4 | GO:0033601 | positive regulation of mammary gland epithelial cell proliferation(GO:0033601) |
| 0.0 | 2.1 | GO:0042073 | intraciliary transport(GO:0042073) |
| 0.0 | 0.3 | GO:0032803 | regulation of low-density lipoprotein particle receptor catabolic process(GO:0032803) |
| 0.0 | 1.0 | GO:0060065 | uterus development(GO:0060065) |
| 0.0 | 1.0 | GO:0060716 | labyrinthine layer blood vessel development(GO:0060716) |
| 0.0 | 0.6 | GO:0045199 | maintenance of apical/basal cell polarity(GO:0035090) maintenance of epithelial cell apical/basal polarity(GO:0045199) |
| 0.0 | 0.1 | GO:1901536 | convergent extension involved in axis elongation(GO:0060028) regulation of DNA demethylation(GO:1901535) negative regulation of DNA demethylation(GO:1901536) regulation of genetic imprinting(GO:2000653) |
| 0.0 | 0.9 | GO:0000185 | activation of MAPKKK activity(GO:0000185) |
| 0.0 | 1.4 | GO:0051973 | positive regulation of telomerase activity(GO:0051973) |
| 0.0 | 0.3 | GO:1990504 | dense core granule exocytosis(GO:1990504) |
| 0.0 | 0.3 | GO:1900454 | positive regulation of long term synaptic depression(GO:1900454) |
| 0.0 | 1.3 | GO:0048384 | retinoic acid receptor signaling pathway(GO:0048384) |
| 0.0 | 1.7 | GO:0032467 | positive regulation of cytokinesis(GO:0032467) |
| 0.0 | 0.3 | GO:0036159 | inner dynein arm assembly(GO:0036159) |
| 0.0 | 0.1 | GO:0061428 | negative regulation of transcription from RNA polymerase II promoter in response to hypoxia(GO:0061428) |
| 0.0 | 0.5 | GO:0046519 | sphingoid metabolic process(GO:0046519) |
| 0.0 | 3.7 | GO:0098869 | cellular oxidant detoxification(GO:0098869) |
| 0.0 | 0.4 | GO:0045023 | G0 to G1 transition(GO:0045023) |
| 0.0 | 1.2 | GO:0032728 | positive regulation of interferon-beta production(GO:0032728) |
| 0.0 | 0.2 | GO:0043314 | negative regulation of neutrophil degranulation(GO:0043314) |
| 0.0 | 0.1 | GO:0072733 | response to staurosporine(GO:0072733) cellular response to staurosporine(GO:0072734) |
| 0.0 | 0.0 | GO:2000724 | regulation of cardiac vascular smooth muscle cell differentiation(GO:2000722) positive regulation of cardiac vascular smooth muscle cell differentiation(GO:2000724) |
| 0.0 | 0.6 | GO:0006488 | dolichol-linked oligosaccharide biosynthetic process(GO:0006488) |
| 0.0 | 0.5 | GO:0006450 | regulation of translational fidelity(GO:0006450) |
| 0.0 | 0.3 | GO:0044351 | macropinocytosis(GO:0044351) |
| 0.0 | 0.4 | GO:0030949 | positive regulation of vascular endothelial growth factor receptor signaling pathway(GO:0030949) |
| 0.0 | 0.1 | GO:0001994 | norepinephrine-epinephrine vasoconstriction involved in regulation of systemic arterial blood pressure(GO:0001994) |
| 0.0 | 0.9 | GO:0030252 | growth hormone secretion(GO:0030252) |
| 0.0 | 0.2 | GO:0043117 | positive regulation of vascular permeability(GO:0043117) |
| 0.0 | 0.4 | GO:0045292 | mRNA cis splicing, via spliceosome(GO:0045292) |
| 0.0 | 0.3 | GO:0090179 | planar cell polarity pathway involved in neural tube closure(GO:0090179) |
| 0.0 | 0.2 | GO:0000727 | double-strand break repair via break-induced replication(GO:0000727) |
| 0.0 | 0.8 | GO:0014002 | astrocyte development(GO:0014002) |
| 0.0 | 0.5 | GO:0008210 | estrogen metabolic process(GO:0008210) |
| 0.0 | 0.9 | GO:0006376 | mRNA splice site selection(GO:0006376) |
| 0.0 | 4.5 | GO:0031638 | zymogen activation(GO:0031638) |
| 0.0 | 0.7 | GO:0036109 | alpha-linolenic acid metabolic process(GO:0036109) |
| 0.0 | 0.2 | GO:0070417 | cellular response to cold(GO:0070417) |
| 0.0 | 0.5 | GO:0070935 | 3'-UTR-mediated mRNA stabilization(GO:0070935) |
| 0.0 | 0.1 | GO:0010825 | positive regulation of centrosome duplication(GO:0010825) |
| 0.0 | 0.8 | GO:0009303 | rRNA transcription(GO:0009303) |
| 0.0 | 0.9 | GO:0030866 | cortical actin cytoskeleton organization(GO:0030866) |
| 0.0 | 0.0 | GO:0046532 | regulation of photoreceptor cell differentiation(GO:0046532) |
| 0.0 | 0.1 | GO:0006726 | eye pigment biosynthetic process(GO:0006726) eye pigment metabolic process(GO:0042441) pigment metabolic process involved in developmental pigmentation(GO:0043324) pigment metabolic process involved in pigmentation(GO:0043474) |
| 0.0 | 0.1 | GO:0007008 | outer mitochondrial membrane organization(GO:0007008) protein import into mitochondrial outer membrane(GO:0045040) |
| 0.0 | 0.6 | GO:0044458 | motile cilium assembly(GO:0044458) |
| 0.0 | 0.2 | GO:0010993 | regulation of ubiquitin homeostasis(GO:0010993) free ubiquitin chain polymerization(GO:0010994) |
| 0.0 | 0.7 | GO:0045746 | negative regulation of Notch signaling pathway(GO:0045746) |
| 0.0 | 0.6 | GO:0006337 | nucleosome disassembly(GO:0006337) |
| 0.0 | 0.3 | GO:0045008 | depyrimidination(GO:0045008) |
| 0.0 | 0.2 | GO:0051045 | negative regulation of membrane protein ectodomain proteolysis(GO:0051045) |
| 0.0 | 2.4 | GO:0007218 | neuropeptide signaling pathway(GO:0007218) |
| 0.0 | 0.5 | GO:0001502 | cartilage condensation(GO:0001502) |
| 0.0 | 0.1 | GO:0019919 | peptidyl-arginine methylation, to asymmetrical-dimethyl arginine(GO:0019919) |
| 0.0 | 0.1 | GO:0071504 | cellular response to heparin(GO:0071504) |
| 0.0 | 1.1 | GO:1904837 | beta-catenin-TCF complex assembly(GO:1904837) |
| 0.0 | 0.1 | GO:1901091 | regulation of protein tetramerization(GO:1901090) negative regulation of protein tetramerization(GO:1901091) regulation of protein homotetramerization(GO:1901093) negative regulation of protein homotetramerization(GO:1901094) |
| 0.0 | 0.2 | GO:0019375 | galactosylceramide biosynthetic process(GO:0006682) galactolipid biosynthetic process(GO:0019375) |
| 0.0 | 0.3 | GO:0010310 | regulation of hydrogen peroxide metabolic process(GO:0010310) |
| 0.0 | 0.3 | GO:0001682 | tRNA 5'-leader removal(GO:0001682) |
| 0.0 | 0.1 | GO:0009149 | pyrimidine nucleoside triphosphate catabolic process(GO:0009149) pyrimidine deoxyribonucleoside triphosphate catabolic process(GO:0009213) |
| 0.0 | 0.2 | GO:0050957 | equilibrioception(GO:0050957) |
| 0.0 | 0.1 | GO:1904479 | negative regulation of intestinal absorption(GO:1904479) |
| 0.0 | 0.3 | GO:0060632 | regulation of microtubule-based movement(GO:0060632) |
| 0.0 | 0.8 | GO:0007339 | binding of sperm to zona pellucida(GO:0007339) |
| 0.0 | 0.5 | GO:0021535 | cell migration in hindbrain(GO:0021535) |
| 0.0 | 0.1 | GO:0045113 | regulation of integrin biosynthetic process(GO:0045113) |
| 0.0 | 0.4 | GO:0051450 | myoblast proliferation(GO:0051450) |
| 0.0 | 0.7 | GO:0048546 | digestive tract morphogenesis(GO:0048546) |
| 0.0 | 0.2 | GO:0071374 | cellular response to parathyroid hormone stimulus(GO:0071374) |
| 0.0 | 0.1 | GO:0006529 | asparagine biosynthetic process(GO:0006529) |
| 0.0 | 0.1 | GO:0035519 | protein K29-linked ubiquitination(GO:0035519) |
| 0.0 | 0.8 | GO:0030513 | positive regulation of BMP signaling pathway(GO:0030513) |
| 0.0 | 0.3 | GO:0042737 | drug catabolic process(GO:0042737) |
| 0.0 | 0.1 | GO:0090206 | negative regulation of cholesterol biosynthetic process(GO:0045541) negative regulation of cholesterol metabolic process(GO:0090206) |
| 0.0 | 0.1 | GO:0034393 | positive regulation of smooth muscle cell apoptotic process(GO:0034393) |
| 0.0 | 0.4 | GO:0051642 | centrosome localization(GO:0051642) |
| 0.0 | 0.4 | GO:1902166 | negative regulation of intrinsic apoptotic signaling pathway in response to DNA damage by p53 class mediator(GO:1902166) |
| 0.0 | 0.9 | GO:0006336 | DNA replication-independent nucleosome assembly(GO:0006336) DNA replication-independent nucleosome organization(GO:0034724) |
| 0.0 | 0.2 | GO:0050966 | detection of mechanical stimulus involved in sensory perception of pain(GO:0050966) |
| 0.0 | 0.2 | GO:0071871 | response to epinephrine(GO:0071871) |
| 0.0 | 4.0 | GO:0035023 | regulation of Rho protein signal transduction(GO:0035023) |
| 0.0 | 0.3 | GO:0014029 | neural crest formation(GO:0014029) |
| 0.0 | 0.2 | GO:0046951 | ketone body biosynthetic process(GO:0046951) |
| 0.0 | 0.8 | GO:0007405 | neuroblast proliferation(GO:0007405) |
| 0.0 | 0.1 | GO:2001241 | positive regulation of extrinsic apoptotic signaling pathway in absence of ligand(GO:2001241) |
| 0.0 | 1.5 | GO:0016266 | O-glycan processing(GO:0016266) |
| 0.0 | 0.1 | GO:0002043 | blood vessel endothelial cell proliferation involved in sprouting angiogenesis(GO:0002043) |
| 0.0 | 0.2 | GO:0034501 | protein localization to kinetochore(GO:0034501) |
| 0.0 | 1.9 | GO:0006939 | smooth muscle contraction(GO:0006939) |
| 0.0 | 0.3 | GO:0043517 | positive regulation of DNA damage response, signal transduction by p53 class mediator(GO:0043517) |
| 0.0 | 2.9 | GO:0030308 | negative regulation of cell growth(GO:0030308) |
| 0.0 | 0.3 | GO:1903830 | magnesium ion transmembrane transport(GO:1903830) |
| 0.0 | 0.5 | GO:0048512 | circadian behavior(GO:0048512) |
| 0.0 | 0.2 | GO:0051096 | positive regulation of helicase activity(GO:0051096) |
| 0.0 | 0.2 | GO:2001197 | regulation of basement membrane assembly involved in embryonic body morphogenesis(GO:1904259) positive regulation of basement membrane assembly involved in embryonic body morphogenesis(GO:1904261) basement membrane assembly involved in embryonic body morphogenesis(GO:2001197) |
| 0.0 | 0.2 | GO:0000183 | chromatin silencing at rDNA(GO:0000183) |
| 0.0 | 0.3 | GO:0006020 | inositol metabolic process(GO:0006020) |
| 0.0 | 0.2 | GO:0070286 | axonemal dynein complex assembly(GO:0070286) |
| 0.0 | 0.1 | GO:0044154 | histone H3-K14 acetylation(GO:0044154) |
| 0.0 | 0.2 | GO:0015825 | L-serine transport(GO:0015825) |
| 0.0 | 0.5 | GO:0030206 | chondroitin sulfate biosynthetic process(GO:0030206) |
| 0.0 | 0.5 | GO:0010644 | cell communication by electrical coupling(GO:0010644) |
| 0.0 | 0.2 | GO:0000469 | cleavage involved in rRNA processing(GO:0000469) |
| 0.0 | 0.1 | GO:0090232 | positive regulation of spindle checkpoint(GO:0090232) positive regulation of mitotic cell cycle spindle assembly checkpoint(GO:0090267) |
| 0.0 | 0.3 | GO:0016254 | preassembly of GPI anchor in ER membrane(GO:0016254) |
| 0.0 | 0.1 | GO:0035067 | polyamine transport(GO:0015846) negative regulation of histone acetylation(GO:0035067) |
| 0.0 | 0.1 | GO:0048280 | vesicle fusion with Golgi apparatus(GO:0048280) |
| 0.0 | 0.2 | GO:0007097 | nuclear migration(GO:0007097) |
| 0.0 | 0.5 | GO:0031572 | G2 DNA damage checkpoint(GO:0031572) |
| 0.0 | 0.2 | GO:0070262 | peptidyl-serine dephosphorylation(GO:0070262) |
Gene overrepresentation in cellular component category:
| Log-likelihood per target | Total log-likelihood | Term | Description |
|---|---|---|---|
| 1.1 | 3.3 | GO:0005584 | collagen type I trimer(GO:0005584) |
| 0.5 | 2.0 | GO:0071821 | FANCM-MHF complex(GO:0071821) |
| 0.4 | 2.2 | GO:0097233 | lamellar body membrane(GO:0097232) alveolar lamellar body membrane(GO:0097233) |
| 0.4 | 2.6 | GO:0005927 | muscle tendon junction(GO:0005927) |
| 0.3 | 3.4 | GO:0042567 | insulin-like growth factor ternary complex(GO:0042567) |
| 0.3 | 1.4 | GO:0060053 | neurofilament cytoskeleton(GO:0060053) |
| 0.3 | 2.2 | GO:0034678 | integrin alpha8-beta1 complex(GO:0034678) |
| 0.3 | 2.1 | GO:0005683 | U7 snRNP(GO:0005683) |
| 0.3 | 12.7 | GO:0031527 | filopodium membrane(GO:0031527) |
| 0.2 | 1.9 | GO:0071953 | elastic fiber(GO:0071953) |
| 0.2 | 0.9 | GO:0016938 | kinesin I complex(GO:0016938) |
| 0.2 | 1.1 | GO:0044393 | microspike(GO:0044393) |
| 0.2 | 0.5 | GO:0070195 | growth hormone receptor complex(GO:0070195) |
| 0.2 | 2.6 | GO:0005862 | muscle thin filament tropomyosin(GO:0005862) |
| 0.1 | 2.1 | GO:0002116 | semaphorin receptor complex(GO:0002116) |
| 0.1 | 0.4 | GO:0070939 | Dsl1p complex(GO:0070939) |
| 0.1 | 1.4 | GO:0045179 | apical cortex(GO:0045179) |
| 0.1 | 2.2 | GO:0005593 | FACIT collagen trimer(GO:0005593) |
| 0.1 | 0.5 | GO:0033257 | Bcl3/NF-kappaB2 complex(GO:0033257) |
| 0.1 | 0.7 | GO:0090571 | RNA polymerase II transcription repressor complex(GO:0090571) |
| 0.1 | 0.4 | GO:0016939 | kinesin II complex(GO:0016939) |
| 0.1 | 1.2 | GO:0097255 | R2TP complex(GO:0097255) |
| 0.1 | 3.4 | GO:0032982 | myosin filament(GO:0032982) |
| 0.1 | 4.7 | GO:0005921 | gap junction(GO:0005921) |
| 0.1 | 0.8 | GO:0045298 | tubulin complex(GO:0045298) |
| 0.1 | 0.4 | GO:0031933 | telomeric heterochromatin(GO:0031933) |
| 0.1 | 0.6 | GO:0089701 | U2AF(GO:0089701) |
| 0.1 | 6.9 | GO:0031941 | filamentous actin(GO:0031941) |
| 0.1 | 1.2 | GO:0005583 | fibrillar collagen trimer(GO:0005583) banded collagen fibril(GO:0098643) |
| 0.1 | 1.7 | GO:0036449 | microtubule minus-end(GO:0036449) |
| 0.1 | 6.4 | GO:0045171 | intercellular bridge(GO:0045171) |
| 0.1 | 0.5 | GO:0030991 | intraciliary transport particle A(GO:0030991) |
| 0.1 | 0.5 | GO:0000110 | nucleotide-excision repair factor 1 complex(GO:0000110) |
| 0.1 | 1.3 | GO:0000813 | ESCRT I complex(GO:0000813) |
| 0.1 | 0.6 | GO:0033063 | Rad51B-Rad51C-Rad51D-XRCC2 complex(GO:0033063) |
| 0.1 | 0.6 | GO:0001739 | sex chromatin(GO:0001739) |
| 0.1 | 0.5 | GO:0005658 | alpha DNA polymerase:primase complex(GO:0005658) |
| 0.1 | 0.8 | GO:0005742 | mitochondrial outer membrane translocase complex(GO:0005742) |
| 0.1 | 0.3 | GO:0036156 | inner dynein arm(GO:0036156) |
| 0.1 | 1.3 | GO:0005861 | troponin complex(GO:0005861) |
| 0.1 | 0.4 | GO:0043541 | UDP-N-acetylglucosamine transferase complex(GO:0043541) |
| 0.1 | 1.8 | GO:0005666 | DNA-directed RNA polymerase III complex(GO:0005666) |
| 0.1 | 1.5 | GO:0031588 | nucleotide-activated protein kinase complex(GO:0031588) |
| 0.1 | 0.7 | GO:0033269 | internode region of axon(GO:0033269) |
| 0.1 | 1.5 | GO:1990454 | L-type voltage-gated calcium channel complex(GO:1990454) |
| 0.1 | 1.3 | GO:0008091 | spectrin(GO:0008091) |
| 0.1 | 1.5 | GO:0097431 | mitotic spindle pole(GO:0097431) |
| 0.1 | 4.2 | GO:0005891 | voltage-gated calcium channel complex(GO:0005891) |
| 0.1 | 0.6 | GO:0030688 | preribosome, small subunit precursor(GO:0030688) |
| 0.1 | 0.3 | GO:0097443 | sorting endosome(GO:0097443) |
| 0.1 | 0.4 | GO:0070847 | core mediator complex(GO:0070847) |
| 0.1 | 0.8 | GO:0030478 | actin cap(GO:0030478) |
| 0.1 | 0.6 | GO:0097504 | Gemini of coiled bodies(GO:0097504) |
| 0.1 | 1.8 | GO:0030992 | intraciliary transport particle B(GO:0030992) |
| 0.0 | 0.5 | GO:0098845 | postsynaptic endosome(GO:0098845) |
| 0.0 | 2.0 | GO:0032391 | photoreceptor connecting cilium(GO:0032391) |
| 0.0 | 0.4 | GO:1990682 | CSF1-CSF1R complex(GO:1990682) |
| 0.0 | 0.1 | GO:0034515 | proteasome storage granule(GO:0034515) |
| 0.0 | 0.4 | GO:0005797 | Golgi medial cisterna(GO:0005797) |
| 0.0 | 0.2 | GO:0048476 | Holliday junction resolvase complex(GO:0048476) |
| 0.0 | 0.6 | GO:0034464 | BBSome(GO:0034464) |
| 0.0 | 0.6 | GO:0031298 | replication fork protection complex(GO:0031298) |
| 0.0 | 1.0 | GO:0036038 | MKS complex(GO:0036038) |
| 0.0 | 0.5 | GO:0005865 | striated muscle thin filament(GO:0005865) myofilament(GO:0036379) |
| 0.0 | 0.3 | GO:0000801 | central element(GO:0000801) |
| 0.0 | 0.7 | GO:0005751 | mitochondrial respiratory chain complex IV(GO:0005751) |
| 0.0 | 0.6 | GO:0031465 | Cul4B-RING E3 ubiquitin ligase complex(GO:0031465) |
| 0.0 | 0.3 | GO:0016272 | prefoldin complex(GO:0016272) |
| 0.0 | 0.5 | GO:0016593 | Cdc73/Paf1 complex(GO:0016593) |
| 0.0 | 4.9 | GO:0016328 | lateral plasma membrane(GO:0016328) |
| 0.0 | 0.3 | GO:0070876 | SOSS complex(GO:0070876) |
| 0.0 | 1.0 | GO:0097440 | apical dendrite(GO:0097440) |
| 0.0 | 1.7 | GO:0009925 | basal plasma membrane(GO:0009925) |
| 0.0 | 0.2 | GO:0005846 | nuclear cap binding complex(GO:0005846) |
| 0.0 | 0.2 | GO:0033565 | ESCRT-0 complex(GO:0033565) |
| 0.0 | 0.3 | GO:0032777 | Piccolo NuA4 histone acetyltransferase complex(GO:0032777) |
| 0.0 | 0.2 | GO:0034753 | nuclear aryl hydrocarbon receptor complex(GO:0034753) |
| 0.0 | 0.2 | GO:0000172 | ribonuclease MRP complex(GO:0000172) |
| 0.0 | 2.0 | GO:0002102 | podosome(GO:0002102) |
| 0.0 | 3.0 | GO:0030669 | clathrin-coated endocytic vesicle membrane(GO:0030669) |
| 0.0 | 0.4 | GO:0000506 | glycosylphosphatidylinositol-N-acetylglucosaminyltransferase (GPI-GnT) complex(GO:0000506) |
| 0.0 | 0.5 | GO:0032039 | integrator complex(GO:0032039) |
| 0.0 | 0.2 | GO:0033553 | rDNA heterochromatin(GO:0033553) |
| 0.0 | 3.3 | GO:0036126 | sperm flagellum(GO:0036126) |
| 0.0 | 1.1 | GO:0043218 | compact myelin(GO:0043218) |
| 0.0 | 0.3 | GO:0097418 | neurofibrillary tangle(GO:0097418) |
| 0.0 | 0.3 | GO:0031211 | serine C-palmitoyltransferase complex(GO:0017059) endoplasmic reticulum palmitoyltransferase complex(GO:0031211) |
| 0.0 | 0.1 | GO:0072563 | endothelial microparticle(GO:0072563) |
| 0.0 | 0.0 | GO:0034455 | t-UTP complex(GO:0034455) |
| 0.0 | 0.1 | GO:0000942 | condensed nuclear chromosome outer kinetochore(GO:0000942) |
| 0.0 | 1.2 | GO:0000159 | protein phosphatase type 2A complex(GO:0000159) |
| 0.0 | 0.3 | GO:0005785 | signal recognition particle receptor complex(GO:0005785) |
| 0.0 | 0.3 | GO:0071004 | U2-type prespliceosome(GO:0071004) |
| 0.0 | 0.6 | GO:0005682 | U5 snRNP(GO:0005682) |
| 0.0 | 0.4 | GO:0031931 | TORC1 complex(GO:0031931) |
| 0.0 | 0.2 | GO:0043196 | varicosity(GO:0043196) |
| 0.0 | 0.1 | GO:0070557 | PCNA-p21 complex(GO:0070557) |
| 0.0 | 2.7 | GO:0071013 | catalytic step 2 spliceosome(GO:0071013) |
| 0.0 | 0.4 | GO:0043020 | NADPH oxidase complex(GO:0043020) |
| 0.0 | 0.3 | GO:0070775 | H3 histone acetyltransferase complex(GO:0070775) MOZ/MORF histone acetyltransferase complex(GO:0070776) |
| 0.0 | 0.1 | GO:1990923 | PET complex(GO:1990923) |
| 0.0 | 4.0 | GO:0043296 | apical junction complex(GO:0043296) |
| 0.0 | 1.4 | GO:0032154 | cleavage furrow(GO:0032154) cell surface furrow(GO:0097610) |
| 0.0 | 0.5 | GO:0005852 | eukaryotic translation initiation factor 3 complex(GO:0005852) |
| 0.0 | 0.2 | GO:0031428 | box C/D snoRNP complex(GO:0031428) |
| 0.0 | 0.7 | GO:0000791 | euchromatin(GO:0000791) |
| 0.0 | 2.4 | GO:0032580 | Golgi cisterna membrane(GO:0032580) |
| 0.0 | 2.0 | GO:0060170 | ciliary membrane(GO:0060170) |
| 0.0 | 0.6 | GO:0005614 | interstitial matrix(GO:0005614) |
| 0.0 | 1.9 | GO:0031463 | Cul3-RING ubiquitin ligase complex(GO:0031463) |
| 0.0 | 0.3 | GO:0030870 | Mre11 complex(GO:0030870) |
| 0.0 | 0.1 | GO:0030681 | multimeric ribonuclease P complex(GO:0030681) |
| 0.0 | 0.1 | GO:0061617 | MICOS complex(GO:0061617) |
| 0.0 | 1.3 | GO:0010494 | cytoplasmic stress granule(GO:0010494) |
| 0.0 | 0.2 | GO:0071986 | Ragulator complex(GO:0071986) |
| 0.0 | 3.3 | GO:0001650 | fibrillar center(GO:0001650) |
| 0.0 | 0.6 | GO:0001917 | photoreceptor inner segment(GO:0001917) |
| 0.0 | 0.1 | GO:1990730 | VCP-NSFL1C complex(GO:1990730) |
| 0.0 | 0.2 | GO:0045180 | basal cortex(GO:0045180) |
| 0.0 | 0.5 | GO:0071564 | npBAF complex(GO:0071564) |
| 0.0 | 0.2 | GO:0071437 | invadopodium(GO:0071437) |
| 0.0 | 0.0 | GO:0071014 | U2-type post-mRNA release spliceosomal complex(GO:0071008) post-mRNA release spliceosomal complex(GO:0071014) |
| 0.0 | 1.2 | GO:0097014 | axoneme(GO:0005930) ciliary plasm(GO:0097014) |
| 0.0 | 0.5 | GO:0031514 | motile cilium(GO:0031514) |
| 0.0 | 1.4 | GO:0016528 | sarcoplasm(GO:0016528) |
| 0.0 | 5.1 | GO:0005788 | endoplasmic reticulum lumen(GO:0005788) |
Gene overrepresentation in molecular function category:
| Log-likelihood per target | Total log-likelihood | Term | Description |
|---|---|---|---|
| 0.8 | 4.1 | GO:0008332 | low voltage-gated calcium channel activity(GO:0008332) |
| 0.6 | 2.2 | GO:0005019 | platelet-derived growth factor beta-receptor activity(GO:0005019) |
| 0.5 | 5.3 | GO:1904929 | coreceptor activity involved in Wnt signaling pathway, planar cell polarity pathway(GO:1904929) |
| 0.5 | 7.1 | GO:0035374 | chondroitin sulfate binding(GO:0035374) |
| 0.5 | 1.4 | GO:0019781 | NEDD8 activating enzyme activity(GO:0019781) |
| 0.4 | 1.1 | GO:0060175 | brain-derived neurotrophic factor-activated receptor activity(GO:0060175) |
| 0.3 | 0.9 | GO:0061629 | RNA polymerase II sequence-specific DNA binding transcription factor binding(GO:0061629) |
| 0.3 | 3.9 | GO:0008160 | protein tyrosine phosphatase activator activity(GO:0008160) |
| 0.3 | 1.7 | GO:0052851 | cupric reductase activity(GO:0008823) ferric-chelate reductase (NADPH) activity(GO:0052851) |
| 0.3 | 0.8 | GO:0030943 | mitochondrion targeting sequence binding(GO:0030943) |
| 0.3 | 1.4 | GO:0004995 | tachykinin receptor activity(GO:0004995) |
| 0.3 | 0.8 | GO:0071209 | U7 snRNA binding(GO:0071209) |
| 0.2 | 2.0 | GO:0004111 | creatine kinase activity(GO:0004111) |
| 0.2 | 1.1 | GO:0004329 | formate-tetrahydrofolate ligase activity(GO:0004329) |
| 0.2 | 4.8 | GO:0019841 | retinol binding(GO:0019841) |
| 0.2 | 1.4 | GO:0044729 | hemi-methylated DNA-binding(GO:0044729) |
| 0.2 | 0.8 | GO:0001601 | peptide YY receptor activity(GO:0001601) |
| 0.2 | 3.3 | GO:0048407 | platelet-derived growth factor binding(GO:0048407) |
| 0.2 | 0.8 | GO:0099609 | microtubule lateral binding(GO:0099609) |
| 0.2 | 0.9 | GO:0045485 | omega-6 fatty acid desaturase activity(GO:0045485) |
| 0.2 | 0.7 | GO:0072320 | volume-sensitive chloride channel activity(GO:0072320) |
| 0.2 | 0.9 | GO:0000026 | alpha-1,2-mannosyltransferase activity(GO:0000026) |
| 0.2 | 0.4 | GO:0097677 | STAT family protein binding(GO:0097677) |
| 0.2 | 2.5 | GO:0036122 | BMP binding(GO:0036122) |
| 0.2 | 0.5 | GO:0050509 | N-acetylglucosaminyl-proteoglycan 4-beta-glucuronosyltransferase activity(GO:0050509) |
| 0.2 | 1.3 | GO:1990446 | U1 snRNP binding(GO:1990446) |
| 0.2 | 0.9 | GO:0051731 | polynucleotide 5'-hydroxyl-kinase activity(GO:0051731) |
| 0.1 | 1.0 | GO:0047045 | testosterone 17-beta-dehydrogenase (NADP+) activity(GO:0047045) |
| 0.1 | 1.3 | GO:0003854 | 3-beta-hydroxy-delta5-steroid dehydrogenase activity(GO:0003854) |
| 0.1 | 1.0 | GO:0003960 | NADPH:quinone reductase activity(GO:0003960) |
| 0.1 | 0.6 | GO:0035514 | DNA demethylase activity(GO:0035514) |
| 0.1 | 0.9 | GO:0043141 | ATP-dependent 5'-3' DNA helicase activity(GO:0043141) |
| 0.1 | 0.6 | GO:0019797 | procollagen-proline 3-dioxygenase activity(GO:0019797) |
| 0.1 | 0.6 | GO:0032795 | heterotrimeric G-protein binding(GO:0032795) |
| 0.1 | 1.6 | GO:0070181 | small ribosomal subunit rRNA binding(GO:0070181) |
| 0.1 | 1.2 | GO:0008158 | hedgehog receptor activity(GO:0008158) |
| 0.1 | 0.5 | GO:0051500 | D-aminoacyl-tRNA deacylase activity(GO:0051499) D-tyrosyl-tRNA(Tyr) deacylase activity(GO:0051500) |
| 0.1 | 0.8 | GO:0016212 | kynurenine-oxoglutarate transaminase activity(GO:0016212) kynurenine aminotransferase activity(GO:0036137) |
| 0.1 | 3.1 | GO:0004185 | serine-type carboxypeptidase activity(GO:0004185) |
| 0.1 | 0.5 | GO:0050510 | N-acetylgalactosaminyl-proteoglycan 3-beta-glucuronosyltransferase activity(GO:0050510) |
| 0.1 | 3.7 | GO:0004602 | glutathione peroxidase activity(GO:0004602) |
| 0.1 | 1.1 | GO:0042285 | UDP-xylosyltransferase activity(GO:0035252) xylosyltransferase activity(GO:0042285) |
| 0.1 | 1.3 | GO:0042731 | PH domain binding(GO:0042731) |
| 0.1 | 1.3 | GO:0031014 | troponin T binding(GO:0031014) |
| 0.1 | 2.1 | GO:0017154 | semaphorin receptor activity(GO:0017154) |
| 0.1 | 3.2 | GO:0004029 | aldehyde dehydrogenase (NAD) activity(GO:0004029) |
| 0.1 | 1.5 | GO:0004679 | AMP-activated protein kinase activity(GO:0004679) |
| 0.1 | 0.9 | GO:1990948 | ligase inhibitor activity(GO:0055104) ubiquitin ligase inhibitor activity(GO:1990948) |
| 0.1 | 1.7 | GO:0008140 | cAMP response element binding protein binding(GO:0008140) |
| 0.1 | 0.4 | GO:0044736 | acid-sensing ion channel activity(GO:0044736) |
| 0.1 | 6.0 | GO:0004864 | protein phosphatase inhibitor activity(GO:0004864) |
| 0.1 | 0.2 | GO:0048257 | 3'-flap endonuclease activity(GO:0048257) |
| 0.1 | 1.7 | GO:0019215 | intermediate filament binding(GO:0019215) |
| 0.1 | 13.3 | GO:0005518 | collagen binding(GO:0005518) |
| 0.1 | 0.6 | GO:0035368 | selenocysteine insertion sequence binding(GO:0035368) |
| 0.1 | 2.7 | GO:0042974 | retinoic acid receptor binding(GO:0042974) |
| 0.1 | 3.4 | GO:0035250 | UDP-galactosyltransferase activity(GO:0035250) |
| 0.1 | 0.3 | GO:0052655 | branched-chain-amino-acid transaminase activity(GO:0004084) L-leucine transaminase activity(GO:0052654) L-valine transaminase activity(GO:0052655) L-isoleucine transaminase activity(GO:0052656) |
| 0.1 | 1.8 | GO:0001056 | RNA polymerase III activity(GO:0001056) |
| 0.1 | 0.3 | GO:0016213 | linoleoyl-CoA desaturase activity(GO:0016213) |
| 0.1 | 1.3 | GO:0008253 | 5'-nucleotidase activity(GO:0008253) |
| 0.1 | 0.5 | GO:1990599 | 3' overhang single-stranded DNA endodeoxyribonuclease activity(GO:1990599) |
| 0.1 | 0.4 | GO:0031705 | bombesin receptor binding(GO:0031705) |
| 0.1 | 2.7 | GO:0070530 | K63-linked polyubiquitin binding(GO:0070530) |
| 0.1 | 5.3 | GO:0030331 | estrogen receptor binding(GO:0030331) |
| 0.1 | 8.5 | GO:0008307 | structural constituent of muscle(GO:0008307) |
| 0.1 | 0.8 | GO:0045159 | myosin II binding(GO:0045159) |
| 0.1 | 0.5 | GO:0035727 | lysophosphatidic acid binding(GO:0035727) |
| 0.1 | 0.4 | GO:0004169 | dolichyl-phosphate-mannose-protein mannosyltransferase activity(GO:0004169) |
| 0.1 | 0.2 | GO:0030550 | acetylcholine receptor inhibitor activity(GO:0030550) |
| 0.1 | 0.4 | GO:0003989 | acetyl-CoA carboxylase activity(GO:0003989) |
| 0.1 | 1.1 | GO:0004089 | carbonate dehydratase activity(GO:0004089) |
| 0.1 | 0.5 | GO:0042296 | ISG15 transferase activity(GO:0042296) |
| 0.1 | 0.4 | GO:0050733 | RS domain binding(GO:0050733) |
| 0.1 | 0.8 | GO:0001135 | transcription factor activity, RNA polymerase II transcription factor recruiting(GO:0001135) |
| 0.1 | 0.2 | GO:0003858 | 3-hydroxybutyrate dehydrogenase activity(GO:0003858) |
| 0.1 | 0.5 | GO:1903763 | gap junction channel activity involved in cell communication by electrical coupling(GO:1903763) |
| 0.0 | 0.4 | GO:0005157 | macrophage colony-stimulating factor receptor binding(GO:0005157) |
| 0.0 | 0.6 | GO:0051378 | amine binding(GO:0043176) serotonin binding(GO:0051378) |
| 0.0 | 1.3 | GO:0008191 | metalloendopeptidase inhibitor activity(GO:0008191) |
| 0.0 | 0.8 | GO:0004791 | thioredoxin-disulfide reductase activity(GO:0004791) |
| 0.0 | 1.7 | GO:0019789 | SUMO transferase activity(GO:0019789) |
| 0.0 | 0.3 | GO:0004758 | serine C-palmitoyltransferase activity(GO:0004758) C-palmitoyltransferase activity(GO:0016454) |
| 0.0 | 0.4 | GO:0015349 | thyroid hormone transmembrane transporter activity(GO:0015349) |
| 0.0 | 1.3 | GO:0097109 | neuroligin family protein binding(GO:0097109) |
| 0.0 | 1.2 | GO:0003993 | acid phosphatase activity(GO:0003993) |
| 0.0 | 0.1 | GO:0034057 | RNA strand-exchange activity(GO:0034057) |
| 0.0 | 0.1 | GO:0032093 | SAM domain binding(GO:0032093) |
| 0.0 | 0.4 | GO:0035242 | protein-arginine omega-N asymmetric methyltransferase activity(GO:0035242) |
| 0.0 | 0.3 | GO:0004499 | N,N-dimethylaniline monooxygenase activity(GO:0004499) |
| 0.0 | 0.2 | GO:0004530 | deoxyribonuclease I activity(GO:0004530) |
| 0.0 | 1.5 | GO:0008331 | high voltage-gated calcium channel activity(GO:0008331) |
| 0.0 | 1.2 | GO:0005095 | GTPase inhibitor activity(GO:0005095) |
| 0.0 | 0.2 | GO:0004489 | methylenetetrahydrofolate reductase (NAD(P)H) activity(GO:0004489) |
| 0.0 | 0.3 | GO:0008269 | JAK pathway signal transduction adaptor activity(GO:0008269) |
| 0.0 | 0.4 | GO:0017176 | phosphatidylinositol N-acetylglucosaminyltransferase activity(GO:0017176) |
| 0.0 | 0.1 | GO:0010736 | serum response element binding(GO:0010736) |
| 0.0 | 2.3 | GO:0005158 | insulin receptor binding(GO:0005158) |
| 0.0 | 0.4 | GO:0035877 | death effector domain binding(GO:0035877) |
| 0.0 | 0.2 | GO:0042392 | sphingosine-1-phosphate phosphatase activity(GO:0042392) |
| 0.0 | 0.7 | GO:0000150 | recombinase activity(GO:0000150) |
| 0.0 | 2.1 | GO:0016504 | peptidase activator activity(GO:0016504) |
| 0.0 | 0.5 | GO:0008494 | translation activator activity(GO:0008494) |
| 0.0 | 0.2 | GO:0030628 | pre-mRNA 3'-splice site binding(GO:0030628) |
| 0.0 | 0.1 | GO:0004937 | alpha1-adrenergic receptor activity(GO:0004937) |
| 0.0 | 0.1 | GO:0016309 | 1-phosphatidylinositol-5-phosphate 4-kinase activity(GO:0016309) |
| 0.0 | 0.2 | GO:0008410 | CoA-transferase activity(GO:0008410) |
| 0.0 | 0.1 | GO:0032090 | Pyrin domain binding(GO:0032090) |
| 0.0 | 0.9 | GO:0005024 | transforming growth factor beta-activated receptor activity(GO:0005024) |
| 0.0 | 0.7 | GO:0005522 | profilin binding(GO:0005522) |
| 0.0 | 1.2 | GO:0008266 | poly(U) RNA binding(GO:0008266) |
| 0.0 | 0.1 | GO:0015173 | aromatic amino acid transmembrane transporter activity(GO:0015173) |
| 0.0 | 0.4 | GO:0016176 | superoxide-generating NADPH oxidase activator activity(GO:0016176) |
| 0.0 | 0.6 | GO:0042809 | vitamin D receptor binding(GO:0042809) |
| 0.0 | 0.5 | GO:0031821 | G-protein coupled serotonin receptor binding(GO:0031821) |
| 0.0 | 0.6 | GO:0008349 | MAP kinase kinase kinase kinase activity(GO:0008349) |
| 0.0 | 2.7 | GO:0005044 | scavenger receptor activity(GO:0005044) |
| 0.0 | 5.6 | GO:0005200 | structural constituent of cytoskeleton(GO:0005200) |
| 0.0 | 0.9 | GO:0004550 | nucleoside diphosphate kinase activity(GO:0004550) |
| 0.0 | 1.1 | GO:0019198 | transmembrane receptor protein tyrosine phosphatase activity(GO:0005001) transmembrane receptor protein phosphatase activity(GO:0019198) |
| 0.0 | 0.8 | GO:0070742 | C2H2 zinc finger domain binding(GO:0070742) |
| 0.0 | 1.5 | GO:0001103 | RNA polymerase II repressing transcription factor binding(GO:0001103) |
| 0.0 | 0.3 | GO:0005078 | MAP-kinase scaffold activity(GO:0005078) |
| 0.0 | 0.3 | GO:0035251 | UDP-glucosyltransferase activity(GO:0035251) |
| 0.0 | 0.3 | GO:0032794 | GTPase activating protein binding(GO:0032794) |
| 0.0 | 0.2 | GO:0018812 | 3-hydroxyacyl-CoA dehydratase activity(GO:0018812) |
| 0.0 | 0.1 | GO:0004910 | interleukin-1, Type II, blocking receptor activity(GO:0004910) |
| 0.0 | 1.8 | GO:0001221 | transcription cofactor binding(GO:0001221) |
| 0.0 | 0.5 | GO:0005523 | tropomyosin binding(GO:0005523) |
| 0.0 | 0.4 | GO:0045504 | dynein heavy chain binding(GO:0045504) |
| 0.0 | 0.1 | GO:0008378 | galactosyltransferase activity(GO:0008378) |
| 0.0 | 0.2 | GO:0004839 | ubiquitin activating enzyme activity(GO:0004839) |
| 0.0 | 2.0 | GO:0004004 | ATP-dependent RNA helicase activity(GO:0004004) |
| 0.0 | 0.6 | GO:0030898 | actin-dependent ATPase activity(GO:0030898) |
| 0.0 | 0.1 | GO:0048763 | calcium-induced calcium release activity(GO:0048763) |
| 0.0 | 0.2 | GO:0010484 | H3 histone acetyltransferase activity(GO:0010484) |
| 0.0 | 0.2 | GO:0004727 | prenylated protein tyrosine phosphatase activity(GO:0004727) |
| 0.0 | 0.4 | GO:0005432 | calcium:sodium antiporter activity(GO:0005432) |
| 0.0 | 1.1 | GO:0070840 | dynein complex binding(GO:0070840) |
| 0.0 | 0.5 | GO:0030215 | semaphorin receptor binding(GO:0030215) |
| 0.0 | 0.3 | GO:0005007 | fibroblast growth factor-activated receptor activity(GO:0005007) |
| 0.0 | 0.2 | GO:0032052 | bile acid binding(GO:0032052) |
| 0.0 | 4.3 | GO:0005089 | Rho guanyl-nucleotide exchange factor activity(GO:0005089) |
| 0.0 | 0.2 | GO:0034511 | U3 snoRNA binding(GO:0034511) |
| 0.0 | 0.2 | GO:0019784 | NEDD8-specific protease activity(GO:0019784) |
| 0.0 | 0.2 | GO:0001665 | alpha-N-acetylgalactosaminide alpha-2,6-sialyltransferase activity(GO:0001665) |
| 0.0 | 0.5 | GO:0004653 | polypeptide N-acetylgalactosaminyltransferase activity(GO:0004653) |
| 0.0 | 0.2 | GO:0004526 | ribonuclease P activity(GO:0004526) |
| 0.0 | 0.2 | GO:0001517 | N-acetylglucosamine 6-O-sulfotransferase activity(GO:0001517) |
| 0.0 | 0.2 | GO:0001733 | galactosylceramide sulfotransferase activity(GO:0001733) galactose 3-O-sulfotransferase activity(GO:0050694) |
| 0.0 | 0.1 | GO:0004066 | asparagine synthase (glutamine-hydrolyzing) activity(GO:0004066) |
| 0.0 | 0.5 | GO:0031005 | filamin binding(GO:0031005) |
| 0.0 | 0.3 | GO:0005000 | vasopressin receptor activity(GO:0005000) |
| 0.0 | 0.2 | GO:0003810 | protein-glutamine gamma-glutamyltransferase activity(GO:0003810) |
| 0.0 | 0.1 | GO:0047192 | 1-alkylglycerophosphocholine O-acetyltransferase activity(GO:0047192) |
| 0.0 | 0.3 | GO:0043225 | anion transmembrane-transporting ATPase activity(GO:0043225) |
| 0.0 | 0.2 | GO:0004300 | enoyl-CoA hydratase activity(GO:0004300) |
| 0.0 | 0.3 | GO:0003906 | DNA-(apurinic or apyrimidinic site) lyase activity(GO:0003906) |
| 0.0 | 0.2 | GO:0019237 | centromeric DNA binding(GO:0019237) |
| 0.0 | 0.7 | GO:0050840 | extracellular matrix binding(GO:0050840) |
| 0.0 | 0.5 | GO:0004181 | metallocarboxypeptidase activity(GO:0004181) |
| 0.0 | 2.7 | GO:0005178 | integrin binding(GO:0005178) |
| 0.0 | 0.6 | GO:0031492 | nucleosomal DNA binding(GO:0031492) |
| 0.0 | 0.1 | GO:0010997 | anaphase-promoting complex binding(GO:0010997) |
| 0.0 | 0.1 | GO:0033265 | choline binding(GO:0033265) |
| 0.0 | 0.5 | GO:0003887 | DNA-directed DNA polymerase activity(GO:0003887) |
| 0.0 | 1.9 | GO:0008013 | beta-catenin binding(GO:0008013) |
| 0.0 | 0.4 | GO:0070182 | DNA polymerase binding(GO:0070182) |
| 0.0 | 0.3 | GO:0015095 | magnesium ion transmembrane transporter activity(GO:0015095) |
| 0.0 | 0.2 | GO:0001164 | RNA polymerase I regulatory region DNA binding(GO:0001013) RNA polymerase I regulatory region sequence-specific DNA binding(GO:0001163) RNA polymerase I CORE element sequence-specific DNA binding(GO:0001164) |
| 0.0 | 0.4 | GO:0005527 | macrolide binding(GO:0005527) FK506 binding(GO:0005528) |
| 0.0 | 0.1 | GO:0022858 | L-alanine transmembrane transporter activity(GO:0015180) alanine transmembrane transporter activity(GO:0022858) |
| 0.0 | 0.1 | GO:0005143 | interleukin-12 receptor binding(GO:0005143) |
| 0.0 | 0.4 | GO:0015002 | cytochrome-c oxidase activity(GO:0004129) heme-copper terminal oxidase activity(GO:0015002) oxidoreductase activity, acting on a heme group of donors, oxygen as acceptor(GO:0016676) |
| 0.0 | 0.6 | GO:0044183 | protein binding involved in protein folding(GO:0044183) |
| 0.0 | 0.0 | GO:0030284 | estrogen receptor activity(GO:0030284) |
| 0.0 | 0.1 | GO:0016206 | catechol O-methyltransferase activity(GO:0016206) |
| 0.0 | 0.1 | GO:0043995 | histone acetyltransferase activity (H4-K5 specific)(GO:0043995) histone acetyltransferase activity (H4-K8 specific)(GO:0043996) histone acetyltransferase activity (H4-K16 specific)(GO:0046972) |
| 0.0 | 0.1 | GO:0004445 | inositol-polyphosphate 5-phosphatase activity(GO:0004445) |
| 0.0 | 0.2 | GO:0022889 | L-serine transmembrane transporter activity(GO:0015194) serine transmembrane transporter activity(GO:0022889) |
| 0.0 | 0.3 | GO:0008239 | dipeptidyl-peptidase activity(GO:0008239) |
| 0.0 | 0.0 | GO:0004306 | ethanolamine-phosphate cytidylyltransferase activity(GO:0004306) |
| 0.0 | 0.5 | GO:0005385 | zinc ion transmembrane transporter activity(GO:0005385) |
| 0.0 | 0.1 | GO:0032552 | deoxyribonucleotide binding(GO:0032552) |
Gene overrepresentation in curated gene sets: canonical pathways category:
| Log-likelihood per target | Total log-likelihood | Term | Description |
|---|---|---|---|
| 0.5 | 1.9 | PID NECTIN PATHWAY | Nectin adhesion pathway |
| 0.4 | 2.0 | PID FAK PATHWAY | Signaling events mediated by focal adhesion kinase |
| 0.3 | 11.3 | PID ANTHRAX PATHWAY | Cellular roles of Anthrax toxin |
| 0.1 | 2.5 | ST JAK STAT PATHWAY | Jak-STAT Pathway |
| 0.1 | 0.4 | PID PDGFRA PATHWAY | PDGFR-alpha signaling pathway |
| 0.1 | 7.1 | NABA COLLAGENS | Genes encoding collagen proteins |
| 0.1 | 1.4 | PID P38 GAMMA DELTA PATHWAY | Signaling mediated by p38-gamma and p38-delta |
| 0.0 | 3.6 | PID WNT NONCANONICAL PATHWAY | Noncanonical Wnt signaling pathway |
| 0.0 | 0.2 | ST TYPE I INTERFERON PATHWAY | Type I Interferon (alpha/beta IFN) Pathway |
| 0.0 | 3.5 | PID ARF6 TRAFFICKING PATHWAY | Arf6 trafficking events |
| 0.0 | 3.9 | PID TAP63 PATHWAY | Validated transcriptional targets of TAp63 isoforms |
| 0.0 | 2.1 | PID TCR CALCIUM PATHWAY | Calcium signaling in the CD4+ TCR pathway |
| 0.0 | 1.2 | PID MYC PATHWAY | C-MYC pathway |
| 0.0 | 1.1 | PID NCADHERIN PATHWAY | N-cadherin signaling events |
| 0.0 | 0.5 | PID S1P S1P4 PATHWAY | S1P4 pathway |
| 0.0 | 1.0 | PID HDAC CLASSIII PATHWAY | Signaling events mediated by HDAC Class III |
| 0.0 | 1.8 | PID AJDISS 2PATHWAY | Posttranslational regulation of adherens junction stability and dissassembly |
| 0.0 | 1.1 | PID A6B1 A6B4 INTEGRIN PATHWAY | a6b1 and a6b4 Integrin signaling |
| 0.0 | 0.7 | PID PRL SIGNALING EVENTS PATHWAY | Signaling events mediated by PRL |
| 0.0 | 1.0 | PID CXCR3 PATHWAY | CXCR3-mediated signaling events |
| 0.0 | 5.4 | NABA ECM AFFILIATED | Genes encoding proteins affiliated structurally or functionally to extracellular matrix proteins |
| 0.0 | 1.3 | PID LKB1 PATHWAY | LKB1 signaling events |
| 0.0 | 1.0 | PID PI3K PLC TRK PATHWAY | Trk receptor signaling mediated by PI3K and PLC-gamma |
| 0.0 | 5.1 | NABA ECM GLYCOPROTEINS | Genes encoding structural ECM glycoproteins |
| 0.0 | 1.0 | NABA CORE MATRISOME | Ensemble of genes encoding core extracellular matrix including ECM glycoproteins, collagens and proteoglycans |
| 0.0 | 1.6 | PID ILK PATHWAY | Integrin-linked kinase signaling |
| 0.0 | 0.4 | PID IGF1 PATHWAY | IGF1 pathway |
| 0.0 | 0.3 | PID FGF PATHWAY | FGF signaling pathway |
| 0.0 | 0.9 | PID ATR PATHWAY | ATR signaling pathway |
| 0.0 | 0.5 | PID TGFBR PATHWAY | TGF-beta receptor signaling |
| 0.0 | 0.9 | ST TUMOR NECROSIS FACTOR PATHWAY | Tumor Necrosis Factor Pathway. |
| 0.0 | 1.0 | PID AURORA B PATHWAY | Aurora B signaling |
| 0.0 | 0.9 | SIG REGULATION OF THE ACTIN CYTOSKELETON BY RHO GTPASES | Genes related to regulation of the actin cytoskeleton |
| 0.0 | 1.0 | PID CDC42 REG PATHWAY | Regulation of CDC42 activity |
| 0.0 | 1.7 | PID AR PATHWAY | Coregulation of Androgen receptor activity |
| 0.0 | 1.4 | PID HDAC CLASSI PATHWAY | Signaling events mediated by HDAC Class I |
| 0.0 | 0.3 | PID INSULIN GLUCOSE PATHWAY | Insulin-mediated glucose transport |
Gene overrepresentation in curated gene sets: REACTOME pathways category:
| Log-likelihood per target | Total log-likelihood | Term | Description |
|---|---|---|---|
| 0.2 | 9.2 | REACTOME CRMPS IN SEMA3A SIGNALING | Genes involved in CRMPs in Sema3A signaling |
| 0.2 | 3.3 | REACTOME PLATELET ADHESION TO EXPOSED COLLAGEN | Genes involved in Platelet Adhesion to exposed collagen |
| 0.2 | 4.5 | REACTOME REGULATION OF INSULIN LIKE GROWTH FACTOR IGF ACTIVITY BY INSULIN LIKE GROWTH FACTOR BINDING PROTEINS IGFBPS | Genes involved in Regulation of Insulin-like Growth Factor (IGF) Activity by Insulin-like Growth Factor Binding Proteins (IGFBPs) |
| 0.1 | 2.1 | REACTOME SLBP DEPENDENT PROCESSING OF REPLICATION DEPENDENT HISTONE PRE MRNAS | Genes involved in SLBP Dependent Processing of Replication-Dependent Histone Pre-mRNAs |
| 0.1 | 6.0 | REACTOME SMOOTH MUSCLE CONTRACTION | Genes involved in Smooth Muscle Contraction |
| 0.1 | 1.3 | REACTOME SYNTHESIS OF BILE ACIDS AND BILE SALTS VIA 24 HYDROXYCHOLESTEROL | Genes involved in Synthesis of bile acids and bile salts via 24-hydroxycholesterol |
| 0.1 | 2.0 | REACTOME INTEGRIN CELL SURFACE INTERACTIONS | Genes involved in Integrin cell surface interactions |
| 0.1 | 1.5 | REACTOME REGULATION OF RHEB GTPASE ACTIVITY BY AMPK | Genes involved in Regulation of Rheb GTPase activity by AMPK |
| 0.1 | 1.8 | REACTOME RNA POL III CHAIN ELONGATION | Genes involved in RNA Polymerase III Chain Elongation |
| 0.1 | 4.3 | REACTOME COLLAGEN FORMATION | Genes involved in Collagen formation |
| 0.1 | 0.8 | REACTOME MEMBRANE BINDING AND TARGETTING OF GAG PROTEINS | Genes involved in Membrane binding and targetting of GAG proteins |
| 0.1 | 5.5 | REACTOME NCAM1 INTERACTIONS | Genes involved in NCAM1 interactions |
| 0.1 | 0.9 | REACTOME RNA POL III TRANSCRIPTION INITIATION FROM TYPE 3 PROMOTER | Genes involved in RNA Polymerase III Transcription Initiation From Type 3 Promoter |
| 0.1 | 0.8 | REACTOME TRYPTOPHAN CATABOLISM | Genes involved in Tryptophan catabolism |
| 0.1 | 1.0 | REACTOME INHIBITION OF REPLICATION INITIATION OF DAMAGED DNA BY RB1 E2F1 | Genes involved in Inhibition of replication initiation of damaged DNA by RB1/E2F1 |
| 0.0 | 1.6 | REACTOME INSULIN SYNTHESIS AND PROCESSING | Genes involved in Insulin Synthesis and Processing |
| 0.0 | 2.3 | REACTOME TIGHT JUNCTION INTERACTIONS | Genes involved in Tight junction interactions |
| 0.0 | 0.6 | REACTOME REGULATION OF WATER BALANCE BY RENAL AQUAPORINS | Genes involved in Regulation of Water Balance by Renal Aquaporins |
| 0.0 | 0.6 | REACTOME SEROTONIN RECEPTORS | Genes involved in Serotonin receptors |
| 0.0 | 1.7 | REACTOME CASPASE MEDIATED CLEAVAGE OF CYTOSKELETAL PROTEINS | Genes involved in Caspase-mediated cleavage of cytoskeletal proteins |
| 0.0 | 0.6 | REACTOME GAP JUNCTION TRAFFICKING | Genes involved in Gap junction trafficking |
| 0.0 | 1.9 | REACTOME MUSCLE CONTRACTION | Genes involved in Muscle contraction |
| 0.0 | 0.9 | REACTOME ABCA TRANSPORTERS IN LIPID HOMEOSTASIS | Genes involved in ABCA transporters in lipid homeostasis |
| 0.0 | 5.1 | REACTOME MRNA SPLICING | Genes involved in mRNA Splicing |
| 0.0 | 1.3 | REACTOME KINESINS | Genes involved in Kinesins |
| 0.0 | 1.1 | REACTOME BETA DEFENSINS | Genes involved in Beta defensins |
| 0.0 | 0.7 | REACTOME ALPHA LINOLENIC ACID ALA METABOLISM | Genes involved in alpha-linolenic acid (ALA) metabolism |
| 0.0 | 0.1 | REACTOME PHOSPHORYLATION OF THE APC C | Genes involved in Phosphorylation of the APC/C |
| 0.0 | 0.7 | REACTOME ACTIVATION OF RAC | Genes involved in Activation of Rac |
| 0.0 | 4.5 | REACTOME FACTORS INVOLVED IN MEGAKARYOCYTE DEVELOPMENT AND PLATELET PRODUCTION | Genes involved in Factors involved in megakaryocyte development and platelet production |
| 0.0 | 1.1 | REACTOME A TETRASACCHARIDE LINKER SEQUENCE IS REQUIRED FOR GAG SYNTHESIS | Genes involved in A tetrasaccharide linker sequence is required for GAG synthesis |
| 0.0 | 1.5 | REACTOME METABOLISM OF NON CODING RNA | Genes involved in Metabolism of non-coding RNA |
| 0.0 | 0.5 | REACTOME CHONDROITIN SULFATE BIOSYNTHESIS | Genes involved in Chondroitin sulfate biosynthesis |
| 0.0 | 0.8 | REACTOME BIOSYNTHESIS OF THE N GLYCAN PRECURSOR DOLICHOL LIPID LINKED OLIGOSACCHARIDE LLO AND TRANSFER TO A NASCENT PROTEIN | Genes involved in Biosynthesis of the N-glycan precursor (dolichol lipid-linked oligosaccharide, LLO) and transfer to a nascent protein |
| 0.0 | 0.5 | REACTOME FORMATION OF TRANSCRIPTION COUPLED NER TC NER REPAIR COMPLEX | Genes involved in Formation of transcription-coupled NER (TC-NER) repair complex |
| 0.0 | 0.1 | REACTOME ACTIVATION OF THE MRNA UPON BINDING OF THE CAP BINDING COMPLEX AND EIFS AND SUBSEQUENT BINDING TO 43S | Genes involved in Activation of the mRNA upon binding of the cap-binding complex and eIFs, and subsequent binding to 43S |
| 0.0 | 0.5 | REACTOME HS GAG BIOSYNTHESIS | Genes involved in HS-GAG biosynthesis |
| 0.0 | 0.5 | REACTOME EXTENSION OF TELOMERES | Genes involved in Extension of Telomeres |
| 0.0 | 0.6 | REACTOME DEPOSITION OF NEW CENPA CONTAINING NUCLEOSOMES AT THE CENTROMERE | Genes involved in Deposition of New CENPA-containing Nucleosomes at the Centromere |
| 0.0 | 0.6 | REACTOME HOMOLOGOUS RECOMBINATION REPAIR OF REPLICATION INDEPENDENT DOUBLE STRAND BREAKS | Genes involved in Homologous recombination repair of replication-independent double-strand breaks |
| 0.0 | 0.4 | REACTOME MTORC1 MEDIATED SIGNALLING | Genes involved in mTORC1-mediated signalling |
| 0.0 | 0.4 | REACTOME SIGNAL ATTENUATION | Genes involved in Signal attenuation |
| 0.0 | 1.8 | REACTOME NRAGE SIGNALS DEATH THROUGH JNK | Genes involved in NRAGE signals death through JNK |
| 0.0 | 0.6 | REACTOME G ALPHA1213 SIGNALLING EVENTS | Genes involved in G alpha (12/13) signalling events |
| 0.0 | 0.8 | REACTOME NEGATIVE REGULATORS OF RIG I MDA5 SIGNALING | Genes involved in Negative regulators of RIG-I/MDA5 signaling |
| 0.0 | 0.3 | REACTOME FGFR4 LIGAND BINDING AND ACTIVATION | Genes involved in FGFR4 ligand binding and activation |
| 0.0 | 0.4 | REACTOME GAP JUNCTION ASSEMBLY | Genes involved in Gap junction assembly |
| 0.0 | 0.4 | REACTOME INHIBITION OF THE PROTEOLYTIC ACTIVITY OF APC C REQUIRED FOR THE ONSET OF ANAPHASE BY MITOTIC SPINDLE CHECKPOINT COMPONENTS | Genes involved in Inhibition of the proteolytic activity of APC/C required for the onset of anaphase by mitotic spindle checkpoint components |
| 0.0 | 0.3 | REACTOME ACYL CHAIN REMODELLING OF PG | Genes involved in Acyl chain remodelling of PG |
| 0.0 | 0.5 | REACTOME CELL EXTRACELLULAR MATRIX INTERACTIONS | Genes involved in Cell-extracellular matrix interactions |
| 0.0 | 1.3 | REACTOME GOLGI ASSOCIATED VESICLE BIOGENESIS | Genes involved in Golgi Associated Vesicle Biogenesis |
| 0.0 | 0.3 | REACTOME BRANCHED CHAIN AMINO ACID CATABOLISM | Genes involved in Branched-chain amino acid catabolism |
| 0.0 | 0.3 | REACTOME ABC FAMILY PROTEINS MEDIATED TRANSPORT | Genes involved in ABC-family proteins mediated transport |
| 0.0 | 0.1 | REACTOME G ALPHA Z SIGNALLING EVENTS | Genes involved in G alpha (z) signalling events |
| 0.0 | 0.3 | REACTOME FRS2 MEDIATED CASCADE | Genes involved in FRS2-mediated cascade |