Project
Illumina Body Map 2 (GSE30611)
Navigation
Downloads
Results for CUGGCUG
Z-value: 0.50
Motif logo

miRNA associated with seed CUGGCUG
| Name | miRBASE accession |
|---|---|
|
hsa-miR-3064-5p
|
MIMAT0019864 |
|
hsa-miR-6504-5p
|
MIMAT0025464 |
Activity profile of CUGGCUG motif
Sorted Z-values of CUGGCUG motif
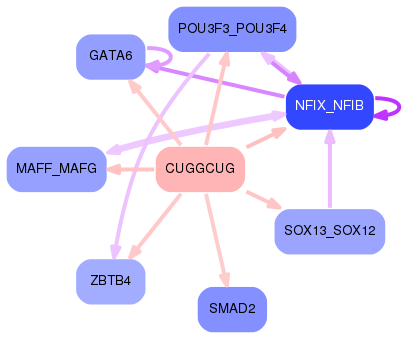
Network of associatons between targets according to the STRING database.

First level regulatory network of CUGGCUG
Gene Ontology Analysis
Gene overrepresentation in biological process category:
| Log-likelihood per target | Total log-likelihood | Term | Description |
|---|---|---|---|
| 0.7 | 2.1 | GO:1904204 | regulation of skeletal muscle hypertrophy(GO:1904204) |
| 0.1 | 0.3 | GO:1903033 | regulation of microtubule plus-end binding(GO:1903031) positive regulation of microtubule plus-end binding(GO:1903033) |
| 0.1 | 0.2 | GO:0071206 | establishment of protein localization to juxtaparanode region of axon(GO:0071206) |
| 0.1 | 0.8 | GO:0051045 | negative regulation of membrane protein ectodomain proteolysis(GO:0051045) |
| 0.1 | 0.2 | GO:2000118 | regulation of sodium-dependent phosphate transport(GO:2000118) |
| 0.1 | 0.4 | GO:0033159 | negative regulation of protein import into nucleus, translocation(GO:0033159) |
| 0.1 | 0.2 | GO:0044376 | RNA polymerase II complex import to nucleus(GO:0044376) RNA polymerase III complex localization to nucleus(GO:1990022) |
| 0.1 | 0.2 | GO:1902598 | creatine transport(GO:0015881) creatine transmembrane transport(GO:1902598) |
| 0.1 | 0.3 | GO:0003431 | growth plate cartilage chondrocyte development(GO:0003431) |
| 0.0 | 0.3 | GO:0010701 | positive regulation of norepinephrine secretion(GO:0010701) |
| 0.0 | 0.2 | GO:1902228 | mammary gland fat development(GO:0060611) positive regulation of macrophage colony-stimulating factor signaling pathway(GO:1902228) positive regulation of response to macrophage colony-stimulating factor(GO:1903971) positive regulation of cellular response to macrophage colony-stimulating factor stimulus(GO:1903974) positive regulation of microglial cell migration(GO:1904141) |
| 0.0 | 0.4 | GO:0060754 | positive regulation of mast cell chemotaxis(GO:0060754) |
| 0.0 | 0.4 | GO:0097011 | cellular response to granulocyte macrophage colony-stimulating factor stimulus(GO:0097011) response to granulocyte macrophage colony-stimulating factor(GO:0097012) |
| 0.0 | 0.2 | GO:0006432 | phenylalanyl-tRNA aminoacylation(GO:0006432) |
| 0.0 | 0.7 | GO:0021694 | cerebellar Purkinje cell layer formation(GO:0021694) cerebellar Purkinje cell differentiation(GO:0021702) |
| 0.0 | 0.1 | GO:0040009 | regulation of growth rate(GO:0040009) |
| 0.0 | 0.6 | GO:1904261 | regulation of basement membrane assembly involved in embryonic body morphogenesis(GO:1904259) positive regulation of basement membrane assembly involved in embryonic body morphogenesis(GO:1904261) basement membrane assembly involved in embryonic body morphogenesis(GO:2001197) |
| 0.0 | 0.2 | GO:1904098 | regulation of protein O-linked glycosylation(GO:1904098) positive regulation of protein O-linked glycosylation(GO:1904100) |
| 0.0 | 0.1 | GO:0072675 | osteoclast fusion(GO:0072675) |
| 0.0 | 0.1 | GO:1905006 | negative regulation of epithelial to mesenchymal transition involved in endocardial cushion formation(GO:1905006) |
| 0.0 | 0.4 | GO:0008354 | germ cell migration(GO:0008354) |
| 0.0 | 0.1 | GO:0035963 | cellular response to interleukin-13(GO:0035963) |
| 0.0 | 0.1 | GO:1904481 | response to tetrahydrofolate(GO:1904481) cellular response to tetrahydrofolate(GO:1904482) |
| 0.0 | 0.9 | GO:0010667 | negative regulation of cardiac muscle cell apoptotic process(GO:0010667) |
| 0.0 | 0.4 | GO:1900119 | positive regulation of execution phase of apoptosis(GO:1900119) |
| 0.0 | 0.2 | GO:0045602 | negative regulation of endothelial cell differentiation(GO:0045602) |
| 0.0 | 0.0 | GO:1905053 | regulation of base-excision repair(GO:1905051) positive regulation of base-excision repair(GO:1905053) |
| 0.0 | 0.6 | GO:0060732 | positive regulation of inositol phosphate biosynthetic process(GO:0060732) |
| 0.0 | 0.2 | GO:1901727 | positive regulation of histone deacetylase activity(GO:1901727) |
| 0.0 | 0.1 | GO:0072023 | thick ascending limb development(GO:0072023) metanephric thick ascending limb development(GO:0072233) |
| 0.0 | 0.1 | GO:0090526 | regulation of gluconeogenesis involved in cellular glucose homeostasis(GO:0090526) |
| 0.0 | 0.1 | GO:0009386 | translational attenuation(GO:0009386) |
| 0.0 | 0.2 | GO:0006729 | tetrahydrobiopterin biosynthetic process(GO:0006729) tetrahydrobiopterin metabolic process(GO:0046146) |
| 0.0 | 0.1 | GO:0090365 | regulation of mRNA modification(GO:0090365) |
| 0.0 | 2.3 | GO:0051965 | positive regulation of synapse assembly(GO:0051965) |
| 0.0 | 0.2 | GO:0061299 | retina vasculature morphogenesis in camera-type eye(GO:0061299) |
| 0.0 | 0.3 | GO:0050966 | detection of mechanical stimulus involved in sensory perception of pain(GO:0050966) |
| 0.0 | 0.5 | GO:0048681 | negative regulation of axon regeneration(GO:0048681) |
| 0.0 | 0.0 | GO:0051891 | positive regulation of cardioblast differentiation(GO:0051891) |
| 0.0 | 0.1 | GO:0060979 | vasculogenesis involved in coronary vascular morphogenesis(GO:0060979) |
| 0.0 | 0.2 | GO:0048251 | elastic fiber assembly(GO:0048251) |
| 0.0 | 0.3 | GO:0046325 | negative regulation of glucose import(GO:0046325) |
| 0.0 | 0.3 | GO:0070886 | positive regulation of calcineurin-NFAT signaling cascade(GO:0070886) |
| 0.0 | 0.2 | GO:0042373 | vitamin K metabolic process(GO:0042373) |
| 0.0 | 0.7 | GO:0001919 | regulation of receptor recycling(GO:0001919) |
| 0.0 | 0.1 | GO:1990009 | retinal cell apoptotic process(GO:1990009) |
| 0.0 | 0.4 | GO:0031643 | positive regulation of myelination(GO:0031643) |
| 0.0 | 0.2 | GO:0007196 | adenylate cyclase-inhibiting G-protein coupled glutamate receptor signaling pathway(GO:0007196) |
| 0.0 | 0.0 | GO:0001189 | RNA polymerase I transcriptional preinitiation complex assembly(GO:0001188) RNA polymerase I transcriptional preinitiation complex assembly at the promoter for the nuclear large rRNA transcript(GO:0001189) |
| 0.0 | 0.1 | GO:0042985 | negative regulation of amyloid precursor protein biosynthetic process(GO:0042985) |
| 0.0 | 0.1 | GO:0035881 | amacrine cell differentiation(GO:0035881) |
| 0.0 | 0.0 | GO:1904457 | beta-glucoside metabolic process(GO:1901804) beta-glucoside catabolic process(GO:1901805) positive regulation of neuronal action potential(GO:1904457) |
Gene overrepresentation in cellular component category:
| Log-likelihood per target | Total log-likelihood | Term | Description |
|---|---|---|---|
| 0.2 | 2.1 | GO:0042567 | insulin-like growth factor ternary complex(GO:0042567) |
| 0.1 | 0.2 | GO:0009328 | phenylalanine-tRNA ligase complex(GO:0009328) |
| 0.0 | 0.6 | GO:0045180 | basal cortex(GO:0045180) |
| 0.0 | 0.2 | GO:1990682 | CSF1-CSF1R complex(GO:1990682) |
| 0.0 | 0.7 | GO:0005614 | interstitial matrix(GO:0005614) |
| 0.0 | 0.3 | GO:0098643 | fibrillar collagen trimer(GO:0005583) banded collagen fibril(GO:0098643) |
| 0.0 | 0.4 | GO:0017146 | NMDA selective glutamate receptor complex(GO:0017146) |
| 0.0 | 0.0 | GO:0070877 | microprocessor complex(GO:0070877) ribonuclease III complex(GO:1903095) |
| 0.0 | 0.1 | GO:0070554 | synaptobrevin 2-SNAP-25-syntaxin-3-complexin complex(GO:0070554) |
Gene overrepresentation in molecular function category:
| Log-likelihood per target | Total log-likelihood | Term | Description |
|---|---|---|---|
| 0.1 | 2.1 | GO:0031995 | insulin-like growth factor II binding(GO:0031995) |
| 0.1 | 0.6 | GO:0004999 | vasoactive intestinal polypeptide receptor activity(GO:0004999) |
| 0.1 | 0.4 | GO:0016524 | latrotoxin receptor activity(GO:0016524) |
| 0.1 | 0.4 | GO:0048101 | calcium- and calmodulin-regulated 3',5'-cyclic-GMP phosphodiesterase activity(GO:0048101) |
| 0.1 | 0.4 | GO:0042392 | sphingosine-1-phosphate phosphatase activity(GO:0042392) |
| 0.1 | 0.2 | GO:0005308 | creatine transmembrane transporter activity(GO:0005308) |
| 0.0 | 0.2 | GO:0004826 | phenylalanine-tRNA ligase activity(GO:0004826) |
| 0.0 | 0.2 | GO:0004720 | protein-lysine 6-oxidase activity(GO:0004720) |
| 0.0 | 0.4 | GO:0030911 | TPR domain binding(GO:0030911) |
| 0.0 | 0.8 | GO:0008191 | metalloendopeptidase inhibitor activity(GO:0008191) |
| 0.0 | 0.4 | GO:0035374 | chondroitin sulfate binding(GO:0035374) |
| 0.0 | 0.9 | GO:0005212 | structural constituent of eye lens(GO:0005212) |
| 0.0 | 0.2 | GO:0004169 | dolichyl-phosphate-mannose-protein mannosyltransferase activity(GO:0004169) |
| 0.0 | 0.4 | GO:0004972 | NMDA glutamate receptor activity(GO:0004972) |
| 0.0 | 0.2 | GO:0016900 | oxidoreductase activity, acting on the CH-OH group of donors, disulfide as acceptor(GO:0016900) vitamin-K-epoxide reductase (warfarin-sensitive) activity(GO:0047057) |
| 0.0 | 0.2 | GO:0005157 | macrophage colony-stimulating factor receptor binding(GO:0005157) |
| 0.0 | 0.2 | GO:0001640 | adenylate cyclase inhibiting G-protein coupled glutamate receptor activity(GO:0001640) G-protein coupled glutamate receptor activity(GO:0098988) |
| 0.0 | 0.2 | GO:0016361 | activin receptor activity, type I(GO:0016361) BMP receptor activity(GO:0098821) |
| 0.0 | 0.1 | GO:0005173 | stem cell factor receptor binding(GO:0005173) |
| 0.0 | 0.7 | GO:0001968 | fibronectin binding(GO:0001968) |
| 0.0 | 0.4 | GO:0005172 | vascular endothelial growth factor receptor binding(GO:0005172) |
| 0.0 | 0.1 | GO:0097363 | protein O-GlcNAc transferase activity(GO:0097363) |
| 0.0 | 0.3 | GO:1990459 | transferrin receptor binding(GO:1990459) |
| 0.0 | 0.1 | GO:0004157 | dihydropyrimidinase activity(GO:0004157) |
| 0.0 | 0.1 | GO:0070905 | serine binding(GO:0070905) |
| 0.0 | 0.2 | GO:0016167 | glial cell-derived neurotrophic factor receptor activity(GO:0016167) |
| 0.0 | 0.1 | GO:0050119 | N-acetylglucosamine deacetylase activity(GO:0050119) |
| 0.0 | 0.1 | GO:0034714 | type III transforming growth factor beta receptor binding(GO:0034714) |
| 0.0 | 0.2 | GO:0009881 | photoreceptor activity(GO:0009881) |
| 0.0 | 0.1 | GO:0005237 | inhibitory extracellular ligand-gated ion channel activity(GO:0005237) |
| 0.0 | 0.1 | GO:0016286 | small conductance calcium-activated potassium channel activity(GO:0016286) |
Gene overrepresentation in curated gene sets: canonical pathways category:
| Log-likelihood per target | Total log-likelihood | Term | Description |
|---|---|---|---|
| 0.0 | 0.4 | PID VEGF VEGFR PATHWAY | VEGF and VEGFR signaling network |
Gene overrepresentation in curated gene sets: REACTOME pathways category:
| Log-likelihood per target | Total log-likelihood | Term | Description |
|---|---|---|---|
| 0.1 | 2.1 | REACTOME REGULATION OF INSULIN LIKE GROWTH FACTOR IGF ACTIVITY BY INSULIN LIKE GROWTH FACTOR BINDING PROTEINS IGFBPS | Genes involved in Regulation of Insulin-like Growth Factor (IGF) Activity by Insulin-like Growth Factor Binding Proteins (IGFBPs) |
| 0.0 | 0.2 | REACTOME CYTOSOLIC TRNA AMINOACYLATION | Genes involved in Cytosolic tRNA aminoacylation |
| 0.0 | 0.8 | REACTOME CGMP EFFECTS | Genes involved in cGMP effects |
| 0.0 | 0.2 | REACTOME TETRAHYDROBIOPTERIN BH4 SYNTHESIS RECYCLING SALVAGE AND REGULATION | Genes involved in Tetrahydrobiopterin (BH4) synthesis, recycling, salvage and regulation |
| 0.0 | 0.1 | REACTOME NITRIC OXIDE STIMULATES GUANYLATE CYCLASE | Genes involved in Nitric oxide stimulates guanylate cyclase |
| 0.0 | 0.4 | REACTOME CRMPS IN SEMA3A SIGNALING | Genes involved in CRMPs in Sema3A signaling |