Project
Illumina Body Map 2 (GSE30611)
Navigation
Downloads
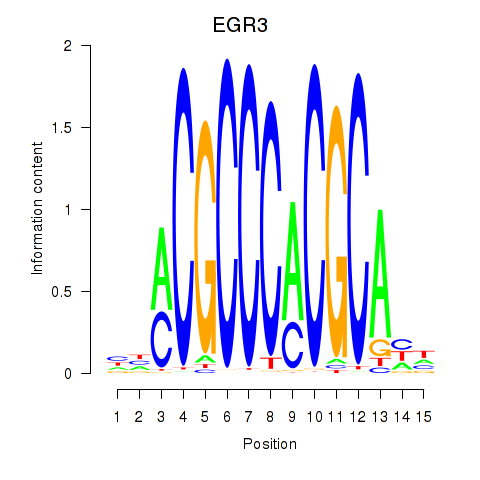
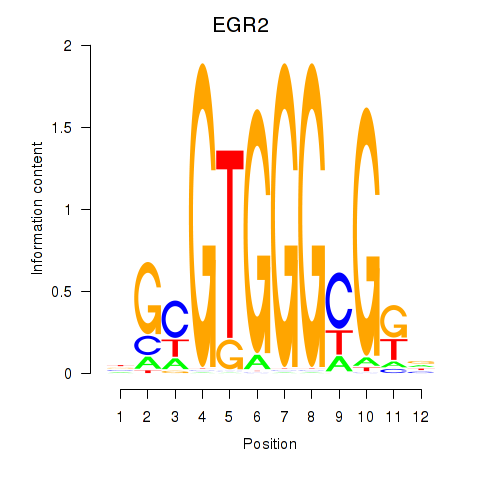
Results for EGR3_EGR2
Z-value: 1.17
Motif logo
Transcription factors associated with EGR3_EGR2
| Gene Symbol | Gene ID | Gene Info |
|---|---|---|
|
EGR3
|
ENSG00000179388.9 | early growth response 3 |
|
EGR2
|
ENSG00000122877.17 | early growth response 2 |
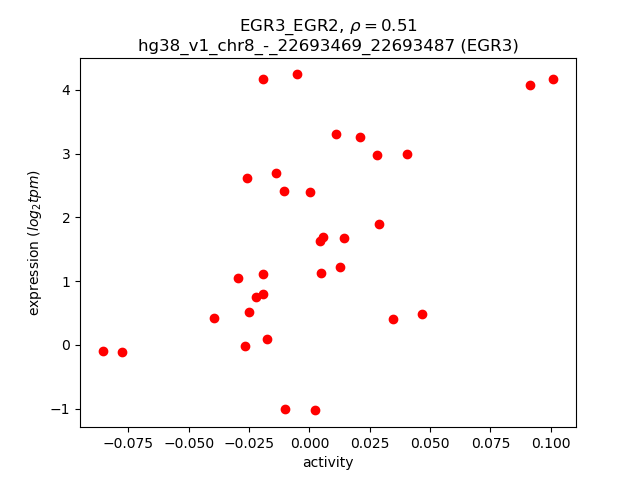
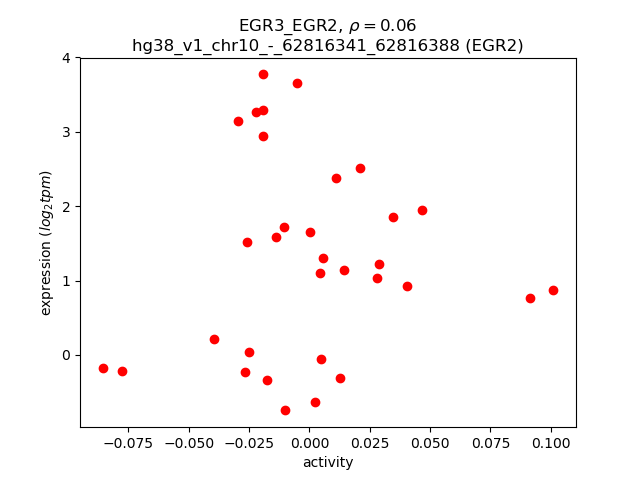
Activity-expression correlation:
| Gene | Promoter | Pearson corr. coef. | P-value | Plot |
|---|---|---|---|---|
| EGR3 | hg38_v1_chr8_-_22693469_22693487 | 0.51 | 2.7e-03 | Click! |
| EGR2 | hg38_v1_chr10_-_62816341_62816388 | 0.06 | 7.2e-01 | Click! |
Activity profile of EGR3_EGR2 motif
Sorted Z-values of EGR3_EGR2 motif
| Promoter | Log-likelihood | Transcript | Gene | Gene Info |
|---|---|---|---|---|
| chr11_+_124739927 | 6.87 |
ENST00000284292.11
ENST00000412681.2 |
NRGN
|
neurogranin |
| chr22_+_19714450 | 4.36 |
ENST00000455784.7
ENST00000406395.5 |
SEPTIN5
|
septin 5 |
| chrX_-_47619850 | 4.21 |
ENST00000295987.13
ENST00000340666.5 |
SYN1
|
synapsin I |
| chr4_-_36244438 | 4.10 |
ENST00000303965.9
|
ARAP2
|
ArfGAP with RhoGAP domain, ankyrin repeat and PH domain 2 |
| chr19_+_35143237 | 3.75 |
ENST00000586063.5
ENST00000270310.7 ENST00000588265.1 |
FXYD7
|
FXYD domain containing ion transport regulator 7 |
| chr16_-_31010611 | 3.68 |
ENST00000215095.11
|
STX1B
|
syntaxin 1B |
| chr10_-_43267059 | 3.40 |
ENST00000395810.6
|
RASGEF1A
|
RasGEF domain family member 1A |
| chr4_-_89837106 | 3.29 |
ENST00000394986.5
ENST00000394991.8 ENST00000506244.5 ENST00000394989.6 ENST00000673902.1 ENST00000674129.1 |
SNCA
|
synuclein alpha |
| chr22_+_19714675 | 3.28 |
ENST00000412544.5
|
SEPTIN5
|
septin 5 |
| chrX_+_118823762 | 3.08 |
ENST00000310164.3
|
ZCCHC12
|
zinc finger CCHC-type containing 12 |
| chr4_-_89836963 | 2.94 |
ENST00000420646.6
ENST00000673718.1 |
SNCA
|
synuclein alpha |
| chr4_+_82430638 | 2.69 |
ENST00000509635.5
ENST00000505846.5 |
ENOPH1
|
enolase-phosphatase 1 |
| chr1_-_34929574 | 2.68 |
ENST00000373347.6
|
DLGAP3
|
DLG associated protein 3 |
| chr11_-_18791563 | 2.64 |
ENST00000396168.1
|
PTPN5
|
protein tyrosine phosphatase non-receptor type 5 |
| chrX_-_153830527 | 2.58 |
ENST00000393758.7
ENST00000544474.5 |
PDZD4
|
PDZ domain containing 4 |
| chr4_-_25862979 | 2.56 |
ENST00000399878.8
|
SEL1L3
|
SEL1L family member 3 |
| chr19_-_3801791 | 2.50 |
ENST00000590849.1
ENST00000395045.6 |
MATK
|
megakaryocyte-associated tyrosine kinase |
| chr15_+_83447328 | 2.47 |
ENST00000427482.7
|
SH3GL3
|
SH3 domain containing GRB2 like 3, endophilin A3 |
| chr4_+_82430563 | 2.46 |
ENST00000273920.8
|
ENOPH1
|
enolase-phosphatase 1 |
| chr7_-_712940 | 2.46 |
ENST00000544935.5
ENST00000430040.5 ENST00000456696.2 ENST00000406797.5 |
PRKAR1B
|
protein kinase cAMP-dependent type I regulatory subunit beta |
| chr9_-_127980976 | 2.44 |
ENST00000373095.6
|
FAM102A
|
family with sequence similarity 102 member A |
| chr15_+_83447411 | 2.41 |
ENST00000324537.5
|
SH3GL3
|
SH3 domain containing GRB2 like 3, endophilin A3 |
| chr19_+_589873 | 2.39 |
ENST00000251287.3
|
HCN2
|
hyperpolarization activated cyclic nucleotide gated potassium and sodium channel 2 |
| chrX_-_49200174 | 2.37 |
ENST00000472598.5
ENST00000263233.9 ENST00000479808.5 |
SYP
|
synaptophysin |
| chr9_+_34958254 | 2.32 |
ENST00000242315.3
|
PHF24
|
PHD finger protein 24 |
| chr12_+_78864768 | 2.31 |
ENST00000261205.9
ENST00000457153.6 |
SYT1
|
synaptotagmin 1 |
| chr19_-_13506408 | 2.30 |
ENST00000637736.1
ENST00000637432.1 ENST00000638029.1 ENST00000360228.11 ENST00000638009.2 ENST00000637769.1 ENST00000635895.1 |
CACNA1A
|
calcium voltage-gated channel subunit alpha1 A |
| chr11_-_18791768 | 2.26 |
ENST00000358540.7
|
PTPN5
|
protein tyrosine phosphatase non-receptor type 5 |
| chrX_+_16946862 | 2.26 |
ENST00000303843.7
|
REPS2
|
RALBP1 associated Eps domain containing 2 |
| chr9_+_17579059 | 2.19 |
ENST00000380607.5
|
SH3GL2
|
SH3 domain containing GRB2 like 2, endophilin A1 |
| chr19_+_10289939 | 2.16 |
ENST00000221980.5
|
ICAM5
|
intercellular adhesion molecule 5 |
| chr12_+_70366277 | 2.08 |
ENST00000258111.5
|
KCNMB4
|
potassium calcium-activated channel subfamily M regulatory beta subunit 4 |
| chr5_-_176610104 | 2.06 |
ENST00000303991.5
|
GPRIN1
|
G protein regulated inducer of neurite outgrowth 1 |
| chr7_-_712437 | 2.06 |
ENST00000360274.8
|
PRKAR1B
|
protein kinase cAMP-dependent type I regulatory subunit beta |
| chr19_+_49119531 | 2.04 |
ENST00000334186.9
|
PPFIA3
|
PTPRF interacting protein alpha 3 |
| chr1_+_155078829 | 2.01 |
ENST00000368408.4
|
EFNA3
|
ephrin A3 |
| chr12_-_54391270 | 2.01 |
ENST00000352268.10
ENST00000549962.5 ENST00000338010.9 ENST00000550774.5 |
ZNF385A
|
zinc finger protein 385A |
| chr6_+_24126186 | 2.00 |
ENST00000378478.5
ENST00000378491.9 ENST00000378477.2 |
NRSN1
|
neurensin 1 |
| chr3_-_184261547 | 1.99 |
ENST00000296238.4
|
CAMK2N2
|
calcium/calmodulin dependent protein kinase II inhibitor 2 |
| chr14_+_99684283 | 1.96 |
ENST00000261835.8
|
CYP46A1
|
cytochrome P450 family 46 subfamily A member 1 |
| chr17_+_39626702 | 1.94 |
ENST00000580825.5
|
PPP1R1B
|
protein phosphatase 1 regulatory inhibitor subunit 1B |
| chr15_-_79971164 | 1.93 |
ENST00000335661.6
ENST00000267953.4 ENST00000677151.1 |
BCL2A1
|
BCL2 related protein A1 |
| chr16_+_30183595 | 1.92 |
ENST00000219150.10
ENST00000570045.5 ENST00000565497.5 ENST00000570244.5 |
CORO1A
|
coronin 1A |
| chr10_+_127907036 | 1.92 |
ENST00000254667.8
ENST00000442830.5 |
PTPRE
|
protein tyrosine phosphatase receptor type E |
| chr4_-_89837076 | 1.91 |
ENST00000506691.1
|
SNCA
|
synuclein alpha |
| chr17_-_44915486 | 1.87 |
ENST00000638281.1
ENST00000588316.1 ENST00000588735.3 ENST00000639277.1 ENST00000253408.11 ENST00000435360.8 ENST00000586793.6 ENST00000588037.1 ENST00000592320.6 |
GFAP
|
glial fibrillary acidic protein |
| chr21_+_33025927 | 1.85 |
ENST00000430860.1
ENST00000382357.4 ENST00000333337.3 |
OLIG2
|
oligodendrocyte transcription factor 2 |
| chr17_-_7207245 | 1.79 |
ENST00000649971.1
|
DLG4
|
discs large MAGUK scaffold protein 4 |
| chr4_-_6472548 | 1.75 |
ENST00000382599.9
|
PPP2R2C
|
protein phosphatase 2 regulatory subunit Bgamma |
| chrX_-_153830490 | 1.72 |
ENST00000164640.8
|
PDZD4
|
PDZ domain containing 4 |
| chr17_+_7884783 | 1.69 |
ENST00000380358.9
|
CHD3
|
chromodomain helicase DNA binding protein 3 |
| chrX_-_48957548 | 1.68 |
ENST00000376488.8
ENST00000396743.7 ENST00000156084.8 |
OTUD5
|
OTU deubiquitinase 5 |
| chr1_-_154627576 | 1.66 |
ENST00000648311.1
|
ADAR
|
adenosine deaminase RNA specific |
| chr1_-_84690406 | 1.66 |
ENST00000605755.5
ENST00000342203.8 ENST00000437941.6 |
SSX2IP
|
SSX family member 2 interacting protein |
| chr20_-_4015518 | 1.65 |
ENST00000545616.2
ENST00000358395.11 |
RNF24
|
ring finger protein 24 |
| chr1_+_239386556 | 1.63 |
ENST00000676153.1
|
CHRM3
|
cholinergic receptor muscarinic 3 |
| chr4_-_108166715 | 1.63 |
ENST00000510624.5
|
LEF1
|
lymphoid enhancer binding factor 1 |
| chr19_+_55283982 | 1.60 |
ENST00000309383.6
|
BRSK1
|
BR serine/threonine kinase 1 |
| chr14_+_94174284 | 1.59 |
ENST00000304338.8
|
PPP4R4
|
protein phosphatase 4 regulatory subunit 4 |
| chr19_-_1863497 | 1.58 |
ENST00000617223.1
ENST00000250916.6 |
KLF16
|
Kruppel like factor 16 |
| chr6_-_29632387 | 1.57 |
ENST00000376977.7
|
GABBR1
|
gamma-aminobutyric acid type B receptor subunit 1 |
| chr19_-_40218339 | 1.56 |
ENST00000311308.6
|
TTC9B
|
tetratricopeptide repeat domain 9B |
| chr22_+_48576306 | 1.54 |
ENST00000358295.9
|
TAFA5
|
TAFA chemokine like family member 5 |
| chr6_-_111873272 | 1.53 |
ENST00000518295.5
ENST00000484067.6 |
FYN
|
FYN proto-oncogene, Src family tyrosine kinase |
| chr19_-_36032799 | 1.53 |
ENST00000592017.5
ENST00000360535.9 |
CLIP3
|
CAP-Gly domain containing linker protein 3 |
| chr19_-_13506223 | 1.51 |
ENST00000635727.1
ENST00000636012.1 ENST00000637276.1 ENST00000636549.1 ENST00000573710.7 ENST00000637927.1 |
CACNA1A
|
calcium voltage-gated channel subunit alpha1 A |
| chr9_+_124257923 | 1.50 |
ENST00000320246.10
ENST00000373600.7 |
NEK6
|
NIMA related kinase 6 |
| chr17_-_8162932 | 1.50 |
ENST00000488857.5
ENST00000316509.11 ENST00000481878.1 ENST00000498285.1 |
VAMP2
ENSG00000263620.1
|
vesicle associated membrane protein 2 novel protein |
| chr4_-_25863537 | 1.50 |
ENST00000502949.5
ENST00000264868.9 ENST00000513691.1 ENST00000514872.1 |
SEL1L3
|
SEL1L family member 3 |
| chr10_+_103277129 | 1.48 |
ENST00000369849.9
|
INA
|
internexin neuronal intermediate filament protein alpha |
| chr2_+_190880809 | 1.48 |
ENST00000320717.8
|
GLS
|
glutaminase |
| chr20_+_38724478 | 1.45 |
ENST00000217420.2
|
SLC32A1
|
solute carrier family 32 member 1 |
| chr9_-_137028271 | 1.45 |
ENST00000265662.9
ENST00000371605.7 |
ABCA2
|
ATP binding cassette subfamily A member 2 |
| chr19_-_50968775 | 1.45 |
ENST00000391808.5
|
KLK6
|
kallikrein related peptidase 6 |
| chr20_-_5001474 | 1.45 |
ENST00000338244.6
|
SLC23A2
|
solute carrier family 23 member 2 |
| chr19_+_29526499 | 1.43 |
ENST00000335523.7
|
VSTM2B
|
V-set and transmembrane domain containing 2B |
| chr9_+_137877773 | 1.43 |
ENST00000371372.6
ENST00000277551.6 ENST00000277549.9 ENST00000371363.5 ENST00000371355.8 ENST00000371357.5 |
CACNA1B
|
calcium voltage-gated channel subunit alpha1 B |
| chr1_+_26529745 | 1.43 |
ENST00000374168.7
ENST00000374166.8 |
RPS6KA1
|
ribosomal protein S6 kinase A1 |
| chr19_-_50968966 | 1.40 |
ENST00000376851.7
|
KLK6
|
kallikrein related peptidase 6 |
| chr5_+_134114673 | 1.39 |
ENST00000342854.10
ENST00000395029.5 |
TCF7
|
transcription factor 7 |
| chr1_+_162069674 | 1.39 |
ENST00000361897.10
|
NOS1AP
|
nitric oxide synthase 1 adaptor protein |
| chr2_-_60550900 | 1.38 |
ENST00000643222.1
ENST00000643459.1 ENST00000489516.7 |
BCL11A
|
BAF chromatin remodeling complex subunit BCL11A |
| chr19_-_36032625 | 1.38 |
ENST00000593074.5
|
CLIP3
|
CAP-Gly domain containing linker protein 3 |
| chr12_+_76764241 | 1.37 |
ENST00000550876.1
|
ZDHHC17
|
zinc finger DHHC-type palmitoyltransferase 17 |
| chr11_-_64745331 | 1.36 |
ENST00000377489.5
ENST00000354024.7 |
RASGRP2
|
RAS guanyl releasing protein 2 |
| chr17_+_39626944 | 1.35 |
ENST00000582680.5
ENST00000254079.9 |
PPP1R1B
|
protein phosphatase 1 regulatory inhibitor subunit 1B |
| chr9_+_137139481 | 1.35 |
ENST00000371546.8
ENST00000371550.8 ENST00000371553.7 ENST00000371555.8 ENST00000371559.8 ENST00000371560.4 |
GRIN1
|
glutamate ionotropic receptor NMDA type subunit 1 |
| chr5_-_132011580 | 1.34 |
ENST00000651250.1
ENST00000434099.6 ENST00000296869.9 ENST00000651356.1 ENST00000651883.2 |
ACSL6
|
acyl-CoA synthetase long chain family member 6 |
| chr6_-_110179623 | 1.33 |
ENST00000265601.7
ENST00000447287.5 ENST00000392589.6 ENST00000444391.5 |
WASF1
|
WASP family member 1 |
| chrX_-_129654946 | 1.32 |
ENST00000429967.3
|
APLN
|
apelin |
| chrX_-_153673778 | 1.31 |
ENST00000340888.8
|
PNCK
|
pregnancy up-regulated nonubiquitous CaM kinase |
| chr1_-_229342966 | 1.30 |
ENST00000284617.7
|
CCSAP
|
centriole, cilia and spindle associated protein |
| chrX_+_16946650 | 1.30 |
ENST00000357277.8
|
REPS2
|
RALBP1 associated Eps domain containing 2 |
| chr17_-_1179940 | 1.29 |
ENST00000302538.10
|
ABR
|
ABR activator of RhoGEF and GTPase |
| chr5_+_161848112 | 1.28 |
ENST00000393943.10
|
GABRA1
|
gamma-aminobutyric acid type A receptor subunit alpha1 |
| chr4_-_108166750 | 1.27 |
ENST00000515500.5
|
LEF1
|
lymphoid enhancer binding factor 1 |
| chr14_-_23352741 | 1.26 |
ENST00000354772.9
|
SLC22A17
|
solute carrier family 22 member 17 |
| chr4_-_152352800 | 1.26 |
ENST00000393956.9
|
FBXW7
|
F-box and WD repeat domain containing 7 |
| chr6_-_110179702 | 1.26 |
ENST00000392587.6
|
WASF1
|
WASP family member 1 |
| chr2_+_218568558 | 1.26 |
ENST00000627282.2
ENST00000542068.5 |
CNOT9
|
CCR4-NOT transcription complex subunit 9 |
| chr12_-_109021015 | 1.25 |
ENST00000546618.2
ENST00000610966.5 |
SVOP
|
SV2 related protein |
| chr12_-_54981838 | 1.25 |
ENST00000316577.12
|
TESPA1
|
thymocyte expressed, positive selection associated 1 |
| chr3_+_196744 | 1.24 |
ENST00000256509.7
ENST00000397491.6 |
CHL1
|
cell adhesion molecule L1 like |
| chr1_+_206583255 | 1.24 |
ENST00000581888.1
|
RASSF5
|
Ras association domain family member 5 |
| chr6_-_110179995 | 1.23 |
ENST00000392586.5
ENST00000419252.1 ENST00000359451.6 ENST00000392588.5 |
WASF1
|
WASP family member 1 |
| chr17_+_38869853 | 1.23 |
ENST00000433206.6
|
LASP1
|
LIM and SH3 protein 1 |
| chrX_-_48957871 | 1.23 |
ENST00000610466.4
|
OTUD5
|
OTU deubiquitinase 5 |
| chr9_-_137028223 | 1.22 |
ENST00000341511.11
|
ABCA2
|
ATP binding cassette subfamily A member 2 |
| chr17_+_28744002 | 1.22 |
ENST00000618771.1
ENST00000262395.10 ENST00000422344.5 |
TRAF4
|
TNF receptor associated factor 4 |
| chr10_-_62268837 | 1.22 |
ENST00000373789.8
|
RTKN2
|
rhotekin 2 |
| chr5_-_132011811 | 1.19 |
ENST00000379255.5
ENST00000430403.5 ENST00000357096.5 |
ACSL6
|
acyl-CoA synthetase long chain family member 6 |
| chr1_-_202160577 | 1.17 |
ENST00000629151.2
ENST00000476061.5 ENST00000464870.5 ENST00000467283.5 ENST00000435759.6 ENST00000486116.5 ENST00000477625.5 |
PTPN7
|
protein tyrosine phosphatase non-receptor type 7 |
| chr21_+_20998399 | 1.17 |
ENST00000400546.6
|
NCAM2
|
neural cell adhesion molecule 2 |
| chr5_-_146878720 | 1.16 |
ENST00000394411.9
ENST00000453001.5 |
PPP2R2B
|
protein phosphatase 2 regulatory subunit Bbeta |
| chr22_+_37639660 | 1.16 |
ENST00000649765.2
ENST00000451997.6 |
SH3BP1
ENSG00000285304.1
|
SH3 domain binding protein 1 novel protein |
| chr16_+_83968244 | 1.15 |
ENST00000305202.9
|
NECAB2
|
N-terminal EF-hand calcium binding protein 2 |
| chr8_-_143160603 | 1.15 |
ENST00000615409.1
ENST00000414417.6 |
LY6H
|
lymphocyte antigen 6 family member H |
| chrX_-_53321319 | 1.15 |
ENST00000640694.1
ENST00000674510.1 ENST00000675719.1 ENST00000642864.1 |
IQSEC2
|
IQ motif and Sec7 domain ArfGEF 2 |
| chr2_-_9630491 | 1.14 |
ENST00000381844.8
|
YWHAQ
|
tyrosine 3-monooxygenase/tryptophan 5-monooxygenase activation protein theta |
| chrX_-_19887459 | 1.13 |
ENST00000379697.7
|
SH3KBP1
|
SH3 domain containing kinase binding protein 1 |
| chr14_-_23352872 | 1.13 |
ENST00000397267.5
|
SLC22A17
|
solute carrier family 22 member 17 |
| chr7_-_100656384 | 1.13 |
ENST00000461605.1
ENST00000160382.10 |
ACTL6B
|
actin like 6B |
| chr12_-_89708816 | 1.13 |
ENST00000428670.8
|
ATP2B1
|
ATPase plasma membrane Ca2+ transporting 1 |
| chr16_+_29812230 | 1.13 |
ENST00000300797.7
ENST00000637403.1 ENST00000572820.2 ENST00000637064.1 ENST00000636246.1 |
PRRT2
|
proline rich transmembrane protein 2 |
| chr16_+_4958289 | 1.13 |
ENST00000251170.12
|
SEC14L5
|
SEC14 like lipid binding 5 |
| chr15_+_43517590 | 1.13 |
ENST00000300231.6
|
MAP1A
|
microtubule associated protein 1A |
| chr17_+_28744034 | 1.12 |
ENST00000444415.7
ENST00000262396.10 |
TRAF4
|
TNF receptor associated factor 4 |
| chr15_-_70854008 | 1.12 |
ENST00000559140.2
|
LARP6
|
La ribonucleoprotein 6, translational regulator |
| chr2_-_225042433 | 1.11 |
ENST00000258390.12
|
DOCK10
|
dedicator of cytokinesis 10 |
| chr5_-_141651376 | 1.11 |
ENST00000522783.5
ENST00000519800.1 ENST00000435817.7 |
FCHSD1
|
FCH and double SH3 domains 1 |
| chr3_+_4814528 | 1.10 |
ENST00000478515.2
ENST00000649139.1 ENST00000647685.1 ENST00000649908.1 |
ITPR1
|
inositol 1,4,5-trisphosphate receptor type 1 |
| chr20_+_43914801 | 1.10 |
ENST00000341197.9
|
TOX2
|
TOX high mobility group box family member 2 |
| chr6_-_111873421 | 1.09 |
ENST00000368678.8
ENST00000523238.5 ENST00000354650.7 |
FYN
|
FYN proto-oncogene, Src family tyrosine kinase |
| chr5_+_126777112 | 1.09 |
ENST00000261366.10
ENST00000492190.5 ENST00000395354.1 |
LMNB1
|
lamin B1 |
| chr15_+_39581068 | 1.09 |
ENST00000397591.2
ENST00000260356.6 |
THBS1
|
thrombospondin 1 |
| chr20_-_4015389 | 1.08 |
ENST00000336095.10
|
RNF24
|
ring finger protein 24 |
| chr4_+_157221598 | 1.07 |
ENST00000505888.1
|
GRIA2
|
glutamate ionotropic receptor AMPA type subunit 2 |
| chr1_-_92961440 | 1.06 |
ENST00000370310.5
ENST00000615519.4 ENST00000613902.4 ENST00000616709.4 |
DIPK1A
|
divergent protein kinase domain 1A |
| chr22_+_19719435 | 1.06 |
ENST00000395109.6
|
SEPTIN5
|
septin 5 |
| chr11_+_66291887 | 1.06 |
ENST00000327259.5
|
TMEM151A
|
transmembrane protein 151A |
| chr11_+_119206298 | 1.05 |
ENST00000634586.1
ENST00000634840.1 ENST00000264033.6 ENST00000637974.1 |
CBL
|
Cbl proto-oncogene |
| chr4_-_576278 | 1.05 |
ENST00000610212.3
|
TMEM271
|
transmembrane protein 271 |
| chr8_+_56211686 | 1.04 |
ENST00000521831.5
ENST00000303759.3 ENST00000517636.5 ENST00000517933.5 ENST00000355315.8 ENST00000518801.5 ENST00000523975.5 ENST00000396723.9 ENST00000523061.5 ENST00000521524.5 |
CHCHD7
|
coiled-coil-helix-coiled-coil-helix domain containing 7 |
| chr7_+_24284181 | 1.03 |
ENST00000407573.5
ENST00000242152.7 |
NPY
|
neuropeptide Y |
| chr17_+_44308573 | 1.02 |
ENST00000590941.5
ENST00000225441.11 ENST00000426726.8 |
RUNDC3A
|
RUN domain containing 3A |
| chr11_-_134412234 | 1.01 |
ENST00000312527.9
|
B3GAT1
|
beta-1,3-glucuronyltransferase 1 |
| chr12_+_4269771 | 1.01 |
ENST00000676411.1
|
CCND2
|
cyclin D2 |
| chr16_-_2196575 | 1.01 |
ENST00000343516.8
|
CASKIN1
|
CASK interacting protein 1 |
| chr7_+_90596281 | 1.01 |
ENST00000380050.8
|
CDK14
|
cyclin dependent kinase 14 |
| chr1_-_40665654 | 1.01 |
ENST00000372684.8
|
RIMS3
|
regulating synaptic membrane exocytosis 3 |
| chr4_+_71236029 | 1.01 |
ENST00000639096.1
ENST00000638464.1 |
SLC4A4
|
solute carrier family 4 member 4 |
| chrX_+_91779367 | 1.01 |
ENST00000682573.1
|
PCDH11X
|
protocadherin 11 X-linked |
| chr1_+_109621088 | 1.01 |
ENST00000369840.7
ENST00000358729.9 ENST00000476688.3 |
AMPD2
|
adenosine monophosphate deaminase 2 |
| chr1_+_107141022 | 1.00 |
ENST00000370067.5
ENST00000370068.6 |
NTNG1
|
netrin G1 |
| chr6_-_136792466 | 1.00 |
ENST00000359015.5
|
MAP3K5
|
mitogen-activated protein kinase kinase kinase 5 |
| chr2_-_27495185 | 0.99 |
ENST00000264703.4
|
FNDC4
|
fibronectin type III domain containing 4 |
| chrX_-_153673678 | 0.99 |
ENST00000370150.5
|
PNCK
|
pregnancy up-regulated nonubiquitous CaM kinase |
| chr15_+_51341648 | 0.98 |
ENST00000335449.11
ENST00000560215.5 |
GLDN
|
gliomedin |
| chr6_+_71886900 | 0.98 |
ENST00000517960.5
ENST00000518273.5 ENST00000522291.5 ENST00000521978.5 ENST00000520567.5 ENST00000264839.11 |
RIMS1
|
regulating synaptic membrane exocytosis 1 |
| chr7_+_139778229 | 0.97 |
ENST00000425687.5
ENST00000650822.1 ENST00000416849.6 ENST00000438104.6 ENST00000336425.10 |
TBXAS1
|
thromboxane A synthase 1 |
| chr19_+_18683656 | 0.97 |
ENST00000338797.10
ENST00000321949.13 |
CRTC1
|
CREB regulated transcription coactivator 1 |
| chr10_-_25016105 | 0.97 |
ENST00000376363.5
ENST00000331161.9 |
ENKUR
|
enkurin, TRPC channel interacting protein |
| chr6_+_33428223 | 0.97 |
ENST00000682587.1
|
SYNGAP1
|
synaptic Ras GTPase activating protein 1 |
| chr12_+_82686926 | 0.97 |
ENST00000548305.5
|
TMTC2
|
transmembrane O-mannosyltransferase targeting cadherins 2 |
| chr17_-_49362206 | 0.96 |
ENST00000430262.3
|
ZNF652
|
zinc finger protein 652 |
| chr11_+_67415670 | 0.96 |
ENST00000531040.5
ENST00000307823.7 |
CARNS1
|
carnosine synthase 1 |
| chr18_+_54828406 | 0.96 |
ENST00000262094.10
|
RAB27B
|
RAB27B, member RAS oncogene family |
| chr17_+_81035122 | 0.96 |
ENST00000321280.11
ENST00000575989.5 ENST00000428708.7 ENST00000575712.5 ENST00000575245.5 ENST00000435091.7 ENST00000321300.10 |
BAIAP2
|
BAR/IMD domain containing adaptor protein 2 |
| chr5_+_138439020 | 0.96 |
ENST00000378339.7
ENST00000254901.9 ENST00000506158.5 |
REEP2
|
receptor accessory protein 2 |
| chr22_-_37984534 | 0.95 |
ENST00000396884.8
|
SOX10
|
SRY-box transcription factor 10 |
| chr6_+_71288803 | 0.94 |
ENST00000370435.5
|
OGFRL1
|
opioid growth factor receptor like 1 |
| chr1_-_111989608 | 0.94 |
ENST00000302127.5
|
KCND3
|
potassium voltage-gated channel subfamily D member 3 |
| chr5_+_142771119 | 0.94 |
ENST00000642734.1
|
ARHGAP26
|
Rho GTPase activating protein 26 |
| chr7_-_108456321 | 0.93 |
ENST00000379024.8
ENST00000351718.8 |
NRCAM
|
neuronal cell adhesion molecule |
| chr6_-_30556477 | 0.93 |
ENST00000376621.8
|
GNL1
|
G protein nucleolar 1 (putative) |
| chr14_+_100065400 | 0.93 |
ENST00000555706.5
ENST00000392920.8 ENST00000555048.5 |
EVL
|
Enah/Vasp-like |
| chr18_-_72543528 | 0.93 |
ENST00000585159.5
ENST00000584764.5 |
CBLN2
|
cerebellin 2 precursor |
| chr14_-_77271200 | 0.93 |
ENST00000298352.5
|
NGB
|
neuroglobin |
| chr5_+_61332236 | 0.93 |
ENST00000252744.6
|
ZSWIM6
|
zinc finger SWIM-type containing 6 |
| chr17_+_59619605 | 0.92 |
ENST00000621829.4
|
CLTC
|
clathrin heavy chain |
| chr7_-_1160144 | 0.92 |
ENST00000397083.6
ENST00000401903.5 ENST00000316495.8 |
ZFAND2A
|
zinc finger AN1-type containing 2A |
| chrX_-_48957027 | 0.92 |
ENST00000455452.5
|
OTUD5
|
OTU deubiquitinase 5 |
| chr2_-_148020689 | 0.92 |
ENST00000457954.5
ENST00000392857.10 ENST00000540442.5 ENST00000535373.5 |
ORC4
|
origin recognition complex subunit 4 |
| chr8_-_132481057 | 0.92 |
ENST00000388996.10
|
KCNQ3
|
potassium voltage-gated channel subfamily Q member 3 |
| chr8_+_22161655 | 0.92 |
ENST00000318561.7
|
SFTPC
|
surfactant protein C |
| chr11_-_46391767 | 0.91 |
ENST00000682254.1
|
CHRM4
|
cholinergic receptor muscarinic 4 |
| chrX_+_71144818 | 0.91 |
ENST00000536169.5
ENST00000358741.4 ENST00000395855.6 ENST00000374051.7 |
NLGN3
|
neuroligin 3 |
| chr5_-_146878595 | 0.90 |
ENST00000394409.7
|
PPP2R2B
|
protein phosphatase 2 regulatory subunit Bbeta |
| chr9_-_133479075 | 0.90 |
ENST00000414172.1
ENST00000371897.8 ENST00000371899.9 |
SLC2A6
|
solute carrier family 2 member 6 |
| chr3_+_124094663 | 0.90 |
ENST00000460856.5
ENST00000240874.7 |
KALRN
|
kalirin RhoGEF kinase |
| chr6_-_83709382 | 0.90 |
ENST00000520302.5
ENST00000520213.5 ENST00000439399.6 |
SNAP91
|
synaptosome associated protein 91 |
| chr5_+_161848314 | 0.90 |
ENST00000437025.6
|
GABRA1
|
gamma-aminobutyric acid type A receptor subunit alpha1 |
| chr11_+_67416086 | 0.89 |
ENST00000445895.2
|
CARNS1
|
carnosine synthase 1 |
| chr19_-_9936501 | 0.89 |
ENST00000264833.9
|
OLFM2
|
olfactomedin 2 |
| chr17_-_38604612 | 0.89 |
ENST00000612431.1
|
SRCIN1
|
SRC kinase signaling inhibitor 1 |
| chr17_+_32486975 | 0.88 |
ENST00000313401.4
|
CDK5R1
|
cyclin dependent kinase 5 regulatory subunit 1 |
| chr2_-_148020754 | 0.88 |
ENST00000440042.1
ENST00000536575.5 |
ORC4
|
origin recognition complex subunit 4 |
| chr18_-_72867509 | 0.88 |
ENST00000583169.5
|
NETO1
|
neuropilin and tolloid like 1 |
| chr16_+_29900474 | 0.88 |
ENST00000308748.10
|
ASPHD1
|
aspartate beta-hydroxylase domain containing 1 |
| chr1_+_32013848 | 0.88 |
ENST00000327300.12
ENST00000492989.1 |
KHDRBS1
|
KH RNA binding domain containing, signal transduction associated 1 |
Network of associatons between targets according to the STRING database.

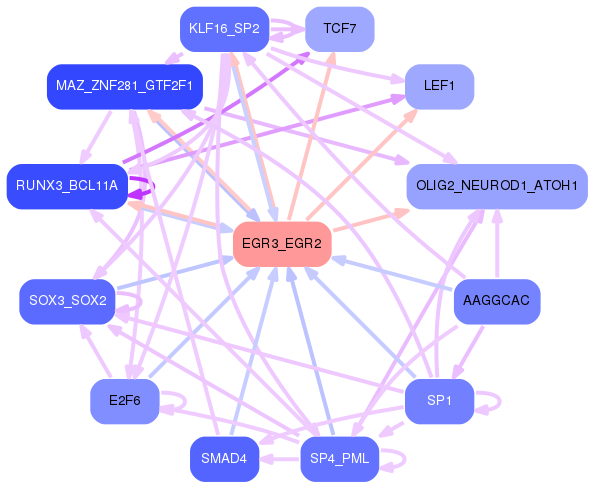
First level regulatory network of EGR3_EGR2
Gene Ontology Analysis
Gene overrepresentation in biological process category:
| Log-likelihood per target | Total log-likelihood | Term | Description |
|---|---|---|---|
| 1.4 | 8.1 | GO:0051622 | negative regulation of dopamine uptake involved in synaptic transmission(GO:0051585) norepinephrine uptake(GO:0051620) regulation of norepinephrine uptake(GO:0051621) negative regulation of norepinephrine uptake(GO:0051622) negative regulation of catecholamine uptake involved in synaptic transmission(GO:0051945) regulation of glutathione peroxidase activity(GO:1903282) positive regulation of glutathione peroxidase activity(GO:1903284) positive regulation of hydrogen peroxide catabolic process(GO:1903285) positive regulation of peroxidase activity(GO:2000470) |
| 1.2 | 3.7 | GO:1903422 | negative regulation of synaptic vesicle recycling(GO:1903422) |
| 0.9 | 5.1 | GO:0019509 | L-methionine biosynthetic process from methylthioadenosine(GO:0019509) |
| 0.8 | 2.4 | GO:0008355 | olfactory learning(GO:0008355) |
| 0.8 | 2.4 | GO:0021530 | spinal cord oligodendrocyte cell differentiation(GO:0021529) spinal cord oligodendrocyte cell fate specification(GO:0021530) |
| 0.6 | 1.8 | GO:1903947 | positive regulation of voltage-gated potassium channel activity involved in ventricular cardiac muscle cell action potential repolarization(GO:1903762) positive regulation of ventricular cardiac muscle cell action potential(GO:1903947) positive regulation of membrane repolarization during ventricular cardiac muscle cell action potential(GO:1905026) positive regulation of membrane repolarization during cardiac muscle cell action potential(GO:1905033) |
| 0.5 | 3.3 | GO:1900369 | negative regulation of RNA interference(GO:1900369) |
| 0.5 | 2.7 | GO:2000325 | regulation of ligand-dependent nuclear receptor transcription coactivator activity(GO:2000325) positive regulation of ligand-dependent nuclear receptor transcription coactivator activity(GO:2000327) |
| 0.5 | 1.4 | GO:0015882 | L-ascorbic acid transport(GO:0015882) molecular hydrogen transport(GO:0015993) transepithelial L-ascorbic acid transport(GO:0070904) |
| 0.5 | 2.4 | GO:0015891 | iron chelate transport(GO:0015688) siderophore transport(GO:0015891) |
| 0.5 | 5.6 | GO:0051388 | positive regulation of neurotrophin TRK receptor signaling pathway(GO:0051388) |
| 0.5 | 1.8 | GO:1902683 | regulation of receptor localization to synapse(GO:1902683) |
| 0.4 | 1.3 | GO:0071613 | granzyme B production(GO:0071613) regulation of granzyme B production(GO:0071661) positive regulation of granzyme B production(GO:0071663) |
| 0.4 | 1.3 | GO:0043397 | corticotropin-releasing hormone secretion(GO:0043396) regulation of corticotropin-releasing hormone secretion(GO:0043397) |
| 0.4 | 1.7 | GO:0060024 | rhythmic synaptic transmission(GO:0060024) |
| 0.4 | 0.4 | GO:0097114 | NMDA glutamate receptor clustering(GO:0097114) |
| 0.4 | 2.9 | GO:0061153 | trachea submucosa development(GO:0061152) trachea gland development(GO:0061153) |
| 0.4 | 3.6 | GO:0007197 | adenylate cyclase-inhibiting G-protein coupled acetylcholine receptor signaling pathway(GO:0007197) |
| 0.4 | 2.3 | GO:0098746 | fast, calcium ion-dependent exocytosis of neurotransmitter(GO:0098746) |
| 0.4 | 1.9 | GO:0032796 | uropod organization(GO:0032796) |
| 0.4 | 2.7 | GO:0032377 | regulation of intracellular lipid transport(GO:0032377) regulation of intracellular sterol transport(GO:0032380) regulation of intracellular cholesterol transport(GO:0032383) |
| 0.4 | 1.5 | GO:0070650 | endoplasmic reticulum polarization(GO:0061163) actin filament bundle retrograde transport(GO:0061573) actin filament bundle distribution(GO:0070650) |
| 0.4 | 2.6 | GO:2000784 | regulation of unidimensional cell growth(GO:0051510) negative regulation of unidimensional cell growth(GO:0051511) establishment of cell polarity regulating cell shape(GO:0071964) regulation of establishment or maintenance of cell polarity regulating cell shape(GO:2000769) positive regulation of establishment or maintenance of cell polarity regulating cell shape(GO:2000771) regulation of establishment of cell polarity regulating cell shape(GO:2000782) positive regulation of establishment of cell polarity regulating cell shape(GO:2000784) positive regulation of barbed-end actin filament capping(GO:2000814) |
| 0.4 | 1.5 | GO:0035498 | carnosine metabolic process(GO:0035498) |
| 0.4 | 1.1 | GO:0002581 | negative regulation of antigen processing and presentation of peptide or polysaccharide antigen via MHC class II(GO:0002581) |
| 0.4 | 1.8 | GO:1904565 | response to 1-oleoyl-sn-glycerol 3-phosphate(GO:1904565) cellular response to 1-oleoyl-sn-glycerol 3-phosphate(GO:1904566) |
| 0.3 | 2.0 | GO:1902162 | platelet alpha granule organization(GO:0070889) regulation of DNA damage response, signal transduction by p53 class mediator resulting in transcription of p21 class mediator(GO:1902162) positive regulation of DNA damage response, signal transduction by p53 class mediator resulting in transcription of p21 class mediator(GO:1902164) |
| 0.3 | 2.6 | GO:1902951 | negative regulation of dendritic spine maintenance(GO:1902951) |
| 0.3 | 1.0 | GO:1902630 | regulation of membrane hyperpolarization(GO:1902630) |
| 0.3 | 1.3 | GO:0002337 | B-1a B cell differentiation(GO:0002337) |
| 0.3 | 1.3 | GO:2000638 | regulation of SREBP signaling pathway(GO:2000638) negative regulation of SREBP signaling pathway(GO:2000639) |
| 0.3 | 0.6 | GO:0033058 | directional locomotion(GO:0033058) |
| 0.3 | 2.8 | GO:1905247 | positive regulation of aspartic-type endopeptidase activity involved in amyloid precursor protein catabolic process(GO:1902961) positive regulation of aspartic-type peptidase activity(GO:1905247) |
| 0.3 | 2.4 | GO:1902998 | regulation of neuronal signal transduction(GO:1902847) positive regulation of neurofibrillary tangle assembly(GO:1902998) |
| 0.3 | 0.9 | GO:0021722 | superior olivary nucleus development(GO:0021718) superior olivary nucleus maturation(GO:0021722) |
| 0.3 | 2.9 | GO:0018230 | peptidyl-L-cysteine S-palmitoylation(GO:0018230) peptidyl-S-diacylglycerol-L-cysteine biosynthetic process from peptidyl-cysteine(GO:0018231) |
| 0.3 | 0.6 | GO:2000969 | positive regulation of alpha-amino-3-hydroxy-5-methyl-4-isoxazole propionate selective glutamate receptor activity(GO:2000969) |
| 0.3 | 1.1 | GO:0002541 | activation of plasma proteins involved in acute inflammatory response(GO:0002541) |
| 0.3 | 1.8 | GO:0006543 | glutamine catabolic process(GO:0006543) |
| 0.3 | 1.5 | GO:0061091 | regulation of phospholipid translocation(GO:0061091) positive regulation of phospholipid translocation(GO:0061092) |
| 0.3 | 2.0 | GO:1903593 | regulation of histamine secretion by mast cell(GO:1903593) |
| 0.2 | 0.9 | GO:1902938 | regulation of intracellular calcium activated chloride channel activity(GO:1902938) |
| 0.2 | 2.1 | GO:0043314 | negative regulation of neutrophil degranulation(GO:0043314) |
| 0.2 | 1.2 | GO:1904021 | negative regulation of G-protein coupled receptor internalization(GO:1904021) |
| 0.2 | 1.4 | GO:1904800 | regulation of neuron remodeling(GO:1904799) negative regulation of neuron remodeling(GO:1904800) negative regulation of branching morphogenesis of a nerve(GO:2000173) |
| 0.2 | 4.9 | GO:2000480 | negative regulation of cAMP-dependent protein kinase activity(GO:2000480) |
| 0.2 | 0.7 | GO:0051596 | methylglyoxal catabolic process to D-lactate via S-lactoyl-glutathione(GO:0019243) methylglyoxal catabolic process(GO:0051596) methylglyoxal catabolic process to lactate(GO:0061727) |
| 0.2 | 0.9 | GO:0046833 | positive regulation of RNA export from nucleus(GO:0046833) |
| 0.2 | 2.1 | GO:1990416 | cellular response to brain-derived neurotrophic factor stimulus(GO:1990416) |
| 0.2 | 0.9 | GO:1902269 | positive regulation of polyamine transmembrane transport(GO:1902269) |
| 0.2 | 1.9 | GO:0000395 | mRNA 5'-splice site recognition(GO:0000395) |
| 0.2 | 1.7 | GO:0051935 | amino acid neurotransmitter reuptake(GO:0051933) glutamate reuptake(GO:0051935) |
| 0.2 | 1.0 | GO:0050893 | sensory processing(GO:0050893) |
| 0.2 | 11.9 | GO:0007214 | gamma-aminobutyric acid signaling pathway(GO:0007214) |
| 0.2 | 1.2 | GO:0010387 | COP9 signalosome assembly(GO:0010387) |
| 0.2 | 4.2 | GO:2000311 | regulation of alpha-amino-3-hydroxy-5-methyl-4-isoxazole propionate selective glutamate receptor activity(GO:2000311) |
| 0.2 | 2.8 | GO:0007621 | negative regulation of female receptivity(GO:0007621) |
| 0.2 | 1.4 | GO:0031133 | regulation of axon diameter(GO:0031133) |
| 0.2 | 0.4 | GO:0071262 | regulation of eIF2 alpha phosphorylation by amino acid starvation(GO:0060733) regulation of translational initiation in response to starvation(GO:0071262) positive regulation of translational initiation in response to starvation(GO:0071264) |
| 0.2 | 1.0 | GO:0071393 | cellular response to progesterone stimulus(GO:0071393) |
| 0.2 | 2.1 | GO:0060295 | regulation of cilium movement involved in cell motility(GO:0060295) regulation of cilium beat frequency involved in ciliary motility(GO:0060296) regulation of cilium-dependent cell motility(GO:1902019) |
| 0.2 | 0.6 | GO:0002036 | regulation of L-glutamate transport(GO:0002036) |
| 0.2 | 2.6 | GO:0061179 | negative regulation of insulin secretion involved in cellular response to glucose stimulus(GO:0061179) |
| 0.2 | 2.3 | GO:0090073 | positive regulation of protein homodimerization activity(GO:0090073) |
| 0.2 | 7.1 | GO:1900273 | positive regulation of long-term synaptic potentiation(GO:1900273) |
| 0.2 | 4.1 | GO:0045162 | clustering of voltage-gated sodium channels(GO:0045162) |
| 0.2 | 1.3 | GO:0060399 | positive regulation of growth hormone receptor signaling pathway(GO:0060399) |
| 0.2 | 0.5 | GO:1902595 | regulation of DNA replication origin binding(GO:1902595) |
| 0.2 | 1.8 | GO:2000491 | positive regulation of hepatic stellate cell activation(GO:2000491) |
| 0.2 | 1.4 | GO:1900126 | negative regulation of hyaluronan biosynthetic process(GO:1900126) |
| 0.2 | 0.9 | GO:2000312 | regulation of kainate selective glutamate receptor activity(GO:2000312) |
| 0.2 | 1.4 | GO:0048619 | embryonic genitalia morphogenesis(GO:0030538) embryonic hindgut morphogenesis(GO:0048619) |
| 0.2 | 4.5 | GO:0048172 | regulation of short-term neuronal synaptic plasticity(GO:0048172) |
| 0.2 | 2.4 | GO:0071321 | cellular response to cGMP(GO:0071321) |
| 0.2 | 0.7 | GO:1901842 | negative regulation of high voltage-gated calcium channel activity(GO:1901842) |
| 0.2 | 4.2 | GO:0097091 | synaptic vesicle clustering(GO:0097091) |
| 0.2 | 0.7 | GO:0046379 | extracellular polysaccharide biosynthetic process(GO:0045226) extracellular polysaccharide metabolic process(GO:0046379) |
| 0.2 | 0.8 | GO:0038169 | somatostatin receptor signaling pathway(GO:0038169) somatostatin signaling pathway(GO:0038170) |
| 0.2 | 1.0 | GO:1905232 | cellular response to L-glutamate(GO:1905232) |
| 0.2 | 1.1 | GO:0050916 | sensory perception of sweet taste(GO:0050916) |
| 0.2 | 0.5 | GO:0098974 | postsynaptic actin cytoskeleton organization(GO:0098974) |
| 0.2 | 0.5 | GO:1990258 | box C/D snoRNA 3'-end processing(GO:0000494) box C/D snoRNA metabolic process(GO:0033967) box C/D snoRNA processing(GO:0034963) histone glutamine methylation(GO:1990258) |
| 0.2 | 0.5 | GO:0044725 | chromatin reprogramming in the zygote(GO:0044725) |
| 0.2 | 0.8 | GO:0002905 | mature B cell apoptotic process(GO:0002901) regulation of mature B cell apoptotic process(GO:0002905) negative regulation of mature B cell apoptotic process(GO:0002906) positive regulation of mast cell cytokine production(GO:0032765) |
| 0.2 | 0.3 | GO:0003064 | regulation of heart rate by hormone(GO:0003064) |
| 0.2 | 0.5 | GO:0006212 | uracil catabolic process(GO:0006212) beta-alanine biosynthetic process(GO:0019483) |
| 0.2 | 1.5 | GO:0098700 | neurotransmitter loading into synaptic vesicle(GO:0098700) |
| 0.1 | 2.8 | GO:0016540 | protein autoprocessing(GO:0016540) |
| 0.1 | 0.7 | GO:0072709 | cellular response to sorbitol(GO:0072709) |
| 0.1 | 1.9 | GO:0097688 | AMPA glutamate receptor clustering(GO:0097113) glutamate receptor clustering(GO:0097688) |
| 0.1 | 1.0 | GO:0032097 | positive regulation of response to food(GO:0032097) positive regulation of appetite(GO:0032100) |
| 0.1 | 0.4 | GO:0060557 | positive regulation of chronic inflammatory response to antigenic stimulus(GO:0002876) positive regulation of vitamin metabolic process(GO:0046136) positive regulation of vitamin D biosynthetic process(GO:0060557) positive regulation of calcidiol 1-monooxygenase activity(GO:0060559) |
| 0.1 | 0.4 | GO:0007525 | somatic muscle development(GO:0007525) |
| 0.1 | 0.7 | GO:0038098 | sequestering of BMP from receptor via BMP binding(GO:0038098) |
| 0.1 | 0.3 | GO:1904924 | negative regulation of mitophagy in response to mitochondrial depolarization(GO:1904924) |
| 0.1 | 0.8 | GO:0010700 | negative regulation of norepinephrine secretion(GO:0010700) |
| 0.1 | 1.4 | GO:0071787 | endoplasmic reticulum tubular network assembly(GO:0071787) |
| 0.1 | 0.6 | GO:0046504 | ether lipid biosynthetic process(GO:0008611) glycerol ether biosynthetic process(GO:0046504) ether biosynthetic process(GO:1901503) |
| 0.1 | 1.4 | GO:0021769 | orbitofrontal cortex development(GO:0021769) |
| 0.1 | 1.1 | GO:0071386 | cellular response to corticosterone stimulus(GO:0071386) |
| 0.1 | 1.8 | GO:0016127 | cholesterol catabolic process(GO:0006707) sterol catabolic process(GO:0016127) |
| 0.1 | 0.6 | GO:1903061 | positive regulation of protein lipidation(GO:1903061) negative regulation of ER-associated ubiquitin-dependent protein catabolic process(GO:1903070) |
| 0.1 | 0.4 | GO:0070541 | response to platinum ion(GO:0070541) |
| 0.1 | 0.6 | GO:1901382 | chorionic trophoblast cell proliferation(GO:0097360) regulation of chorionic trophoblast cell proliferation(GO:1901382) |
| 0.1 | 0.5 | GO:0032286 | central nervous system myelin maintenance(GO:0032286) |
| 0.1 | 0.4 | GO:2000588 | positive regulation of platelet-derived growth factor receptor-beta signaling pathway(GO:2000588) |
| 0.1 | 0.3 | GO:0046725 | negative regulation by virus of viral protein levels in host cell(GO:0046725) negative regulation of metanephric nephron tubule epithelial cell differentiation(GO:0072308) |
| 0.1 | 0.4 | GO:0034147 | regulation of toll-like receptor 5 signaling pathway(GO:0034147) negative regulation of toll-like receptor 5 signaling pathway(GO:0034148) negative regulation of nucleotide-binding oligomerization domain containing 1 signaling pathway(GO:0070429) tolerance induction to lipopolysaccharide(GO:0072573) |
| 0.1 | 0.3 | GO:0033341 | regulation of collagen binding(GO:0033341) |
| 0.1 | 0.5 | GO:0098904 | regulation of AV node cell action potential(GO:0098904) |
| 0.1 | 0.4 | GO:0033606 | B cell receptor transport within lipid bilayer(GO:0032595) B cell receptor transport into membrane raft(GO:0032597) protein transport out of membrane raft(GO:0032599) chemokine receptor transport out of membrane raft(GO:0032600) negative regulation of transforming growth factor beta3 production(GO:0032913) chemokine receptor transport within lipid bilayer(GO:0033606) |
| 0.1 | 0.5 | GO:0035627 | ceramide transport(GO:0035627) |
| 0.1 | 0.6 | GO:1904383 | response to sodium phosphate(GO:1904383) |
| 0.1 | 0.5 | GO:0061741 | vacuolar transmembrane transport(GO:0034486) chaperone-mediated protein transport involved in chaperone-mediated autophagy(GO:0061741) |
| 0.1 | 0.4 | GO:0033634 | positive regulation of cell-cell adhesion mediated by integrin(GO:0033634) |
| 0.1 | 1.1 | GO:0035871 | protein K11-linked deubiquitination(GO:0035871) |
| 0.1 | 0.3 | GO:1990751 | positive regulation of Schwann cell migration(GO:1900149) regulation of Schwann cell chemotaxis(GO:1904266) positive regulation of Schwann cell chemotaxis(GO:1904268) Schwann cell chemotaxis(GO:1990751) |
| 0.1 | 2.9 | GO:0070262 | peptidyl-serine dephosphorylation(GO:0070262) |
| 0.1 | 0.5 | GO:1905205 | positive regulation of connective tissue replacement(GO:1905205) |
| 0.1 | 1.4 | GO:0019367 | fatty acid elongation, saturated fatty acid(GO:0019367) fatty acid elongation, unsaturated fatty acid(GO:0019368) fatty acid elongation, monounsaturated fatty acid(GO:0034625) fatty acid elongation, polyunsaturated fatty acid(GO:0034626) |
| 0.1 | 2.6 | GO:0035020 | regulation of Rac protein signal transduction(GO:0035020) |
| 0.1 | 2.3 | GO:1903830 | magnesium ion transmembrane transport(GO:1903830) |
| 0.1 | 0.4 | GO:0036446 | myofibroblast differentiation(GO:0036446) regulation of myofibroblast differentiation(GO:1904760) negative regulation of myofibroblast differentiation(GO:1904761) |
| 0.1 | 0.5 | GO:0071072 | negative regulation of phospholipid biosynthetic process(GO:0071072) |
| 0.1 | 1.0 | GO:0060052 | neurofilament cytoskeleton organization(GO:0060052) |
| 0.1 | 1.7 | GO:1903800 | positive regulation of production of miRNAs involved in gene silencing by miRNA(GO:1903800) |
| 0.1 | 0.3 | GO:0045074 | interleukin-10 biosynthetic process(GO:0042091) regulation of interleukin-10 biosynthetic process(GO:0045074) |
| 0.1 | 0.2 | GO:0014806 | smooth muscle hyperplasia(GO:0014806) |
| 0.1 | 0.4 | GO:0021849 | neuroblast division in subventricular zone(GO:0021849) |
| 0.1 | 0.3 | GO:0002949 | tRNA threonylcarbamoyladenosine modification(GO:0002949) |
| 0.1 | 1.0 | GO:0050882 | voluntary musculoskeletal movement(GO:0050882) |
| 0.1 | 0.3 | GO:2000417 | negative regulation of eosinophil migration(GO:2000417) |
| 0.1 | 1.0 | GO:0032264 | IMP salvage(GO:0032264) |
| 0.1 | 0.3 | GO:0030221 | basophil differentiation(GO:0030221) |
| 0.1 | 0.6 | GO:0003363 | lamellipodium assembly involved in ameboidal cell migration(GO:0003363) |
| 0.1 | 0.4 | GO:1990108 | protein linear deubiquitination(GO:1990108) |
| 0.1 | 2.5 | GO:0071985 | multivesicular body sorting pathway(GO:0071985) |
| 0.1 | 0.5 | GO:0090118 | receptor-mediated endocytosis of low-density lipoprotein particle involved in cholesterol transport(GO:0090118) |
| 0.1 | 0.2 | GO:0060734 | regulation of endoplasmic reticulum stress-induced eIF2 alpha phosphorylation(GO:0060734) |
| 0.1 | 0.7 | GO:0071802 | negative regulation of podosome assembly(GO:0071802) |
| 0.1 | 1.9 | GO:1904714 | regulation of chaperone-mediated autophagy(GO:1904714) |
| 0.1 | 1.2 | GO:2000623 | regulation of nuclear-transcribed mRNA catabolic process, nonsense-mediated decay(GO:2000622) negative regulation of nuclear-transcribed mRNA catabolic process, nonsense-mediated decay(GO:2000623) |
| 0.1 | 0.3 | GO:2000625 | nuclear-transcribed mRNA catabolic process, endonucleolytic cleavage-dependent decay(GO:0000294) regulation of miRNA catabolic process(GO:2000625) positive regulation of miRNA catabolic process(GO:2000627) |
| 0.1 | 0.9 | GO:0032237 | activation of store-operated calcium channel activity(GO:0032237) positive regulation of store-operated calcium channel activity(GO:1901341) |
| 0.1 | 1.5 | GO:2000821 | regulation of grooming behavior(GO:2000821) |
| 0.1 | 0.6 | GO:0051684 | maintenance of Golgi location(GO:0051684) |
| 0.1 | 0.3 | GO:0032747 | positive regulation of interleukin-23 production(GO:0032747) |
| 0.1 | 0.5 | GO:1901909 | diadenosine polyphosphate catabolic process(GO:0015961) diphosphoinositol polyphosphate metabolic process(GO:0071543) diadenosine pentaphosphate metabolic process(GO:1901906) diadenosine pentaphosphate catabolic process(GO:1901907) diadenosine hexaphosphate metabolic process(GO:1901908) diadenosine hexaphosphate catabolic process(GO:1901909) adenosine 5'-(hexahydrogen pentaphosphate) metabolic process(GO:1901910) adenosine 5'-(hexahydrogen pentaphosphate) catabolic process(GO:1901911) |
| 0.1 | 0.7 | GO:0035234 | ectopic germ cell programmed cell death(GO:0035234) |
| 0.1 | 0.7 | GO:0046604 | positive regulation of mitotic centrosome separation(GO:0046604) |
| 0.1 | 0.4 | GO:0043311 | positive regulation of eosinophil degranulation(GO:0043311) positive regulation of eosinophil activation(GO:1902568) |
| 0.1 | 0.6 | GO:0021869 | forebrain ventricular zone progenitor cell division(GO:0021869) |
| 0.1 | 0.2 | GO:0098507 | polynucleotide 5' dephosphorylation(GO:0098507) |
| 0.1 | 0.5 | GO:1904049 | negative regulation of spontaneous neurotransmitter secretion(GO:1904049) |
| 0.1 | 2.4 | GO:0071108 | protein K48-linked deubiquitination(GO:0071108) |
| 0.1 | 0.2 | GO:0070318 | positive regulation of G0 to G1 transition(GO:0070318) |
| 0.1 | 0.7 | GO:0031666 | positive regulation of lipopolysaccharide-mediated signaling pathway(GO:0031666) |
| 0.1 | 0.6 | GO:0030035 | microspike assembly(GO:0030035) |
| 0.1 | 0.4 | GO:1990180 | mitochondrial tRNA 3'-end processing(GO:1990180) |
| 0.1 | 0.7 | GO:0021860 | pyramidal neuron development(GO:0021860) |
| 0.1 | 0.7 | GO:0042428 | serotonin metabolic process(GO:0042428) |
| 0.1 | 0.2 | GO:0090365 | regulation of mRNA modification(GO:0090365) |
| 0.1 | 1.1 | GO:0002315 | marginal zone B cell differentiation(GO:0002315) |
| 0.1 | 0.9 | GO:2000310 | regulation of N-methyl-D-aspartate selective glutamate receptor activity(GO:2000310) |
| 0.1 | 1.2 | GO:0005513 | detection of calcium ion(GO:0005513) |
| 0.1 | 0.6 | GO:0051725 | protein de-ADP-ribosylation(GO:0051725) |
| 0.1 | 0.2 | GO:0035674 | tricarboxylic acid transmembrane transport(GO:0035674) |
| 0.1 | 0.3 | GO:1903568 | negative regulation of protein localization to cilium(GO:1903565) regulation of protein localization to ciliary membrane(GO:1903567) negative regulation of protein localization to ciliary membrane(GO:1903568) |
| 0.1 | 1.1 | GO:0070886 | positive regulation of calcineurin-NFAT signaling cascade(GO:0070886) |
| 0.1 | 0.8 | GO:0010968 | regulation of microtubule nucleation(GO:0010968) |
| 0.1 | 0.4 | GO:0035063 | nuclear speck organization(GO:0035063) |
| 0.1 | 0.4 | GO:0043988 | histone H3-S28 phosphorylation(GO:0043988) |
| 0.1 | 0.6 | GO:0000160 | phosphorelay signal transduction system(GO:0000160) |
| 0.1 | 0.2 | GO:0019046 | release from viral latency(GO:0019046) regulation of DNA strand elongation(GO:0060382) |
| 0.1 | 0.2 | GO:0006597 | spermine biosynthetic process(GO:0006597) |
| 0.1 | 0.9 | GO:0002175 | protein localization to paranode region of axon(GO:0002175) |
| 0.1 | 0.5 | GO:0060023 | soft palate development(GO:0060023) |
| 0.1 | 0.3 | GO:2000176 | regulation of pro-T cell differentiation(GO:2000174) positive regulation of pro-T cell differentiation(GO:2000176) |
| 0.1 | 0.7 | GO:0061087 | positive regulation of histone H3-K27 methylation(GO:0061087) |
| 0.1 | 0.5 | GO:1904628 | response to phorbol 13-acetate 12-myristate(GO:1904627) cellular response to phorbol 13-acetate 12-myristate(GO:1904628) |
| 0.1 | 1.2 | GO:0006828 | manganese ion transport(GO:0006828) |
| 0.1 | 1.2 | GO:0071481 | cellular response to X-ray(GO:0071481) |
| 0.1 | 1.1 | GO:0010764 | negative regulation of fibroblast migration(GO:0010764) |
| 0.1 | 0.5 | GO:0060137 | maternal process involved in parturition(GO:0060137) |
| 0.1 | 1.1 | GO:0050884 | neuromuscular process controlling posture(GO:0050884) |
| 0.1 | 1.9 | GO:0032515 | negative regulation of phosphoprotein phosphatase activity(GO:0032515) |
| 0.1 | 1.0 | GO:0051152 | positive regulation of smooth muscle cell differentiation(GO:0051152) |
| 0.1 | 0.9 | GO:1900028 | negative regulation of ruffle assembly(GO:1900028) |
| 0.1 | 0.2 | GO:0031204 | posttranslational protein targeting to membrane, translocation(GO:0031204) |
| 0.1 | 0.1 | GO:0046619 | optic placode formation involved in camera-type eye formation(GO:0046619) |
| 0.1 | 0.5 | GO:0031629 | synaptic vesicle fusion to presynaptic active zone membrane(GO:0031629) vesicle fusion to plasma membrane(GO:0099500) |
| 0.1 | 2.1 | GO:0061577 | calcium ion transmembrane transport via high voltage-gated calcium channel(GO:0061577) |
| 0.1 | 0.5 | GO:1900383 | regulation of synaptic plasticity by receptor localization to synapse(GO:1900383) |
| 0.1 | 1.0 | GO:0031284 | positive regulation of guanylate cyclase activity(GO:0031284) |
| 0.1 | 0.4 | GO:0045607 | regulation of auditory receptor cell differentiation(GO:0045607) regulation of mechanoreceptor differentiation(GO:0045631) regulation of inner ear receptor cell differentiation(GO:2000980) |
| 0.1 | 0.2 | GO:1900042 | positive regulation of interleukin-2 secretion(GO:1900042) |
| 0.1 | 1.2 | GO:0097623 | potassium ion export across plasma membrane(GO:0097623) |
| 0.1 | 0.4 | GO:0042636 | negative regulation of hair cycle(GO:0042636) |
| 0.1 | 0.8 | GO:0035524 | proline transmembrane transport(GO:0035524) |
| 0.1 | 0.4 | GO:0044387 | negative regulation of protein kinase activity by regulation of protein phosphorylation(GO:0044387) |
| 0.1 | 1.4 | GO:0035249 | synaptic transmission, glutamatergic(GO:0035249) |
| 0.1 | 0.5 | GO:0036091 | positive regulation of transcription from RNA polymerase II promoter in response to oxidative stress(GO:0036091) |
| 0.1 | 2.4 | GO:0046710 | GDP metabolic process(GO:0046710) |
| 0.1 | 0.5 | GO:0014057 | positive regulation of acetylcholine secretion, neurotransmission(GO:0014057) |
| 0.1 | 0.3 | GO:0060160 | negative regulation of dopamine receptor signaling pathway(GO:0060160) |
| 0.1 | 0.6 | GO:2000786 | positive regulation of autophagosome assembly(GO:2000786) |
| 0.1 | 1.6 | GO:0007413 | axonal fasciculation(GO:0007413) |
| 0.1 | 1.1 | GO:0070935 | 3'-UTR-mediated mRNA stabilization(GO:0070935) |
| 0.1 | 0.9 | GO:2000463 | positive regulation of excitatory postsynaptic potential(GO:2000463) |
| 0.1 | 0.9 | GO:0007196 | adenylate cyclase-inhibiting G-protein coupled glutamate receptor signaling pathway(GO:0007196) |
| 0.1 | 1.3 | GO:0006068 | ethanol catabolic process(GO:0006068) |
| 0.0 | 1.9 | GO:0035235 | ionotropic glutamate receptor signaling pathway(GO:0035235) |
| 0.0 | 0.8 | GO:0070777 | D-aspartate transport(GO:0070777) D-aspartate import(GO:0070779) |
| 0.0 | 0.2 | GO:2000329 | peptidyl-lysine oxidation(GO:0018057) negative regulation of T-helper 17 cell lineage commitment(GO:2000329) |
| 0.0 | 1.3 | GO:0008053 | mitochondrial fusion(GO:0008053) |
| 0.0 | 0.4 | GO:0036481 | intrinsic apoptotic signaling pathway in response to hydrogen peroxide(GO:0036481) |
| 0.0 | 0.2 | GO:0060158 | phospholipase C-activating dopamine receptor signaling pathway(GO:0060158) |
| 0.0 | 0.3 | GO:0060332 | positive regulation of response to interferon-gamma(GO:0060332) positive regulation of interferon-gamma-mediated signaling pathway(GO:0060335) |
| 0.0 | 1.8 | GO:0030033 | microvillus assembly(GO:0030033) |
| 0.0 | 0.4 | GO:0018211 | protein C-linked glycosylation(GO:0018103) peptidyl-tryptophan modification(GO:0018211) protein C-linked glycosylation via tryptophan(GO:0018317) protein C-linked glycosylation via 2'-alpha-mannosyl-L-tryptophan(GO:0018406) |
| 0.0 | 1.1 | GO:0090141 | positive regulation of mitochondrial fission(GO:0090141) |
| 0.0 | 1.1 | GO:0007175 | negative regulation of epidermal growth factor-activated receptor activity(GO:0007175) |
| 0.0 | 0.9 | GO:0007253 | cytoplasmic sequestering of NF-kappaB(GO:0007253) |
| 0.0 | 1.0 | GO:0060081 | membrane hyperpolarization(GO:0060081) |
| 0.0 | 0.4 | GO:1903748 | negative regulation of establishment of protein localization to mitochondrion(GO:1903748) |
| 0.0 | 0.6 | GO:0045647 | negative regulation of erythrocyte differentiation(GO:0045647) |
| 0.0 | 0.2 | GO:1900194 | negative regulation of oocyte maturation(GO:1900194) |
| 0.0 | 0.2 | GO:0031584 | activation of phospholipase D activity(GO:0031584) |
| 0.0 | 0.1 | GO:0048633 | positive regulation of skeletal muscle tissue growth(GO:0048633) |
| 0.0 | 2.7 | GO:0050650 | chondroitin sulfate proteoglycan biosynthetic process(GO:0050650) |
| 0.0 | 0.3 | GO:0032185 | septin cytoskeleton organization(GO:0032185) |
| 0.0 | 0.7 | GO:2000291 | regulation of myoblast proliferation(GO:2000291) |
| 0.0 | 0.2 | GO:0048691 | modulation by virus of host transcription(GO:0019056) positive regulation of sprouting of injured axon(GO:0048687) positive regulation of axon extension involved in regeneration(GO:0048691) modulation by symbiont of host transcription(GO:0052026) |
| 0.0 | 0.2 | GO:0032072 | plasmacytoid dendritic cell activation(GO:0002270) regulation of restriction endodeoxyribonuclease activity(GO:0032072) T-helper 1 cell activation(GO:0035711) |
| 0.0 | 0.2 | GO:0060979 | vasculogenesis involved in coronary vascular morphogenesis(GO:0060979) |
| 0.0 | 0.8 | GO:2000574 | regulation of microtubule motor activity(GO:2000574) |
| 0.0 | 0.2 | GO:1904744 | positive regulation of telomeric DNA binding(GO:1904744) |
| 0.0 | 0.4 | GO:1904779 | regulation of protein localization to centrosome(GO:1904779) |
| 0.0 | 1.5 | GO:0035640 | exploration behavior(GO:0035640) |
| 0.0 | 0.6 | GO:0021978 | telencephalon regionalization(GO:0021978) |
| 0.0 | 0.6 | GO:0015812 | gamma-aminobutyric acid transport(GO:0015812) |
| 0.0 | 3.8 | GO:0046579 | positive regulation of Ras protein signal transduction(GO:0046579) |
| 0.0 | 1.2 | GO:2000369 | regulation of clathrin-mediated endocytosis(GO:2000369) |
| 0.0 | 0.2 | GO:0032364 | oxygen homeostasis(GO:0032364) |
| 0.0 | 0.1 | GO:0061011 | hepatic duct development(GO:0061011) |
| 0.0 | 0.5 | GO:0070307 | lens fiber cell development(GO:0070307) |
| 0.0 | 0.3 | GO:2000465 | regulation of glycogen (starch) synthase activity(GO:2000465) |
| 0.0 | 0.1 | GO:0033319 | UDP-D-xylose metabolic process(GO:0033319) UDP-D-xylose biosynthetic process(GO:0033320) |
| 0.0 | 0.1 | GO:1905167 | regulation of lysosomal protein catabolic process(GO:1905165) positive regulation of lysosomal protein catabolic process(GO:1905167) |
| 0.0 | 0.3 | GO:2001206 | positive regulation of osteoclast development(GO:2001206) |
| 0.0 | 0.2 | GO:0006311 | meiotic gene conversion(GO:0006311) |
| 0.0 | 0.2 | GO:0030311 | poly-N-acetyllactosamine biosynthetic process(GO:0030311) |
| 0.0 | 0.3 | GO:0032957 | inositol trisphosphate metabolic process(GO:0032957) |
| 0.0 | 0.6 | GO:2000766 | negative regulation of cytoplasmic translation(GO:2000766) |
| 0.0 | 0.2 | GO:0055009 | atrial cardiac muscle tissue development(GO:0003228) atrial cardiac muscle tissue morphogenesis(GO:0055009) |
| 0.0 | 0.9 | GO:0046838 | phosphorylated carbohydrate dephosphorylation(GO:0046838) inositol phosphate dephosphorylation(GO:0046855) inositol phosphate catabolic process(GO:0071545) |
| 0.0 | 0.2 | GO:0046874 | quinolinate metabolic process(GO:0046874) pyridine-containing compound catabolic process(GO:0072526) |
| 0.0 | 0.3 | GO:0035494 | SNARE complex disassembly(GO:0035494) |
| 0.0 | 1.5 | GO:1904659 | hexose transmembrane transport(GO:0035428) glucose transmembrane transport(GO:1904659) |
| 0.0 | 0.3 | GO:0034128 | negative regulation of MyD88-independent toll-like receptor signaling pathway(GO:0034128) |
| 0.0 | 0.1 | GO:0097029 | mature conventional dendritic cell differentiation(GO:0097029) |
| 0.0 | 0.3 | GO:0070164 | negative regulation of adiponectin secretion(GO:0070164) |
| 0.0 | 0.6 | GO:0038203 | TORC2 signaling(GO:0038203) |
| 0.0 | 0.5 | GO:0006527 | arginine catabolic process(GO:0006527) |
| 0.0 | 0.2 | GO:0061051 | positive regulation of cell growth involved in cardiac muscle cell development(GO:0061051) |
| 0.0 | 0.7 | GO:0042574 | retinal metabolic process(GO:0042574) |
| 0.0 | 0.5 | GO:0030050 | vesicle transport along actin filament(GO:0030050) |
| 0.0 | 0.2 | GO:0022027 | interkinetic nuclear migration(GO:0022027) |
| 0.0 | 1.4 | GO:0048265 | response to pain(GO:0048265) |
| 0.0 | 3.7 | GO:0006501 | C-terminal protein lipidation(GO:0006501) |
| 0.0 | 0.1 | GO:0015917 | aminophospholipid transport(GO:0015917) |
| 0.0 | 0.4 | GO:0098582 | innate vocalization behavior(GO:0098582) |
| 0.0 | 0.3 | GO:0090286 | cytoskeletal anchoring at nuclear membrane(GO:0090286) |
| 0.0 | 3.2 | GO:0050806 | positive regulation of synaptic transmission(GO:0050806) |
| 0.0 | 0.9 | GO:0061099 | negative regulation of protein tyrosine kinase activity(GO:0061099) |
| 0.0 | 1.3 | GO:0008542 | visual learning(GO:0008542) |
| 0.0 | 0.2 | GO:0007352 | zygotic specification of dorsal/ventral axis(GO:0007352) |
| 0.0 | 0.1 | GO:1901874 | negative regulation of post-translational protein modification(GO:1901874) |
| 0.0 | 1.3 | GO:0032012 | regulation of ARF protein signal transduction(GO:0032012) |
| 0.0 | 0.2 | GO:0003415 | chondrocyte hypertrophy(GO:0003415) |
| 0.0 | 0.1 | GO:1903182 | regulation of SUMO transferase activity(GO:1903182) positive regulation of SUMO transferase activity(GO:1903755) |
| 0.0 | 0.2 | GO:0015015 | heparan sulfate proteoglycan biosynthetic process, enzymatic modification(GO:0015015) |
| 0.0 | 2.8 | GO:0071349 | interleukin-12-mediated signaling pathway(GO:0035722) cellular response to interleukin-12(GO:0071349) |
| 0.0 | 1.0 | GO:0001573 | ganglioside metabolic process(GO:0001573) |
| 0.0 | 2.2 | GO:0031572 | G2 DNA damage checkpoint(GO:0031572) |
| 0.0 | 0.7 | GO:1904707 | positive regulation of vascular smooth muscle cell proliferation(GO:1904707) |
| 0.0 | 0.3 | GO:0042985 | negative regulation of amyloid precursor protein biosynthetic process(GO:0042985) |
| 0.0 | 0.3 | GO:0036371 | protein localization to T-tubule(GO:0036371) |
| 0.0 | 0.0 | GO:0060372 | regulation of atrial cardiac muscle cell membrane repolarization(GO:0060372) |
| 0.0 | 0.2 | GO:0046836 | glycolipid transport(GO:0046836) |
| 0.0 | 0.1 | GO:0019322 | pentose-phosphate shunt, oxidative branch(GO:0009051) pentose biosynthetic process(GO:0019322) aldonic acid metabolic process(GO:0019520) D-gluconate metabolic process(GO:0019521) |
| 0.0 | 0.6 | GO:0035988 | chondrocyte proliferation(GO:0035988) |
| 0.0 | 0.5 | GO:0019371 | cyclooxygenase pathway(GO:0019371) |
| 0.0 | 0.3 | GO:0010606 | positive regulation of cytoplasmic mRNA processing body assembly(GO:0010606) |
| 0.0 | 0.1 | GO:1903490 | regulation of cytokinetic process(GO:0032954) regulation of mitotic cytokinetic process(GO:1903436) positive regulation of mitotic cytokinetic process(GO:1903438) positive regulation of mitotic cytokinesis(GO:1903490) |
| 0.0 | 2.8 | GO:0090307 | mitotic spindle assembly(GO:0090307) |
| 0.0 | 0.1 | GO:1901388 | regulation of transforming growth factor beta activation(GO:1901388) negative regulation of transforming growth factor beta activation(GO:1901389) |
| 0.0 | 0.2 | GO:0016185 | synaptic vesicle budding from presynaptic endocytic zone membrane(GO:0016185) |
| 0.0 | 0.3 | GO:0070734 | histone H3-K27 methylation(GO:0070734) |
| 0.0 | 0.2 | GO:0021902 | commitment of neuronal cell to specific neuron type in forebrain(GO:0021902) |
| 0.0 | 0.4 | GO:0075522 | IRES-dependent viral translational initiation(GO:0075522) |
| 0.0 | 0.9 | GO:0051457 | maintenance of protein location in nucleus(GO:0051457) |
| 0.0 | 1.7 | GO:0007212 | dopamine receptor signaling pathway(GO:0007212) |
| 0.0 | 0.5 | GO:0006703 | estrogen biosynthetic process(GO:0006703) |
| 0.0 | 1.3 | GO:0006270 | DNA replication initiation(GO:0006270) |
| 0.0 | 0.2 | GO:0043951 | negative regulation of cAMP-mediated signaling(GO:0043951) |
| 0.0 | 0.3 | GO:0008210 | estrogen metabolic process(GO:0008210) |
| 0.0 | 0.3 | GO:0001731 | formation of translation preinitiation complex(GO:0001731) |
| 0.0 | 0.6 | GO:0015671 | oxygen transport(GO:0015671) |
| 0.0 | 0.1 | GO:1903461 | Okazaki fragment processing involved in mitotic DNA replication(GO:1903461) |
| 0.0 | 0.6 | GO:0002407 | dendritic cell chemotaxis(GO:0002407) |
| 0.0 | 0.3 | GO:0090161 | Golgi ribbon formation(GO:0090161) |
| 0.0 | 1.8 | GO:0038128 | ERBB2 signaling pathway(GO:0038128) |
| 0.0 | 1.2 | GO:0050690 | regulation of defense response to virus by virus(GO:0050690) |
| 0.0 | 0.8 | GO:0010715 | regulation of extracellular matrix disassembly(GO:0010715) |
| 0.0 | 0.1 | GO:0002296 | T-helper 1 cell lineage commitment(GO:0002296) |
| 0.0 | 0.7 | GO:0016578 | histone deubiquitination(GO:0016578) |
| 0.0 | 0.3 | GO:0048387 | negative regulation of retinoic acid receptor signaling pathway(GO:0048387) |
| 0.0 | 1.4 | GO:0061178 | regulation of insulin secretion involved in cellular response to glucose stimulus(GO:0061178) |
| 0.0 | 0.2 | GO:2000270 | negative regulation of fibroblast apoptotic process(GO:2000270) |
| 0.0 | 1.0 | GO:0007274 | neuromuscular synaptic transmission(GO:0007274) |
| 0.0 | 0.5 | GO:0060334 | regulation of interferon-gamma-mediated signaling pathway(GO:0060334) |
| 0.0 | 0.2 | GO:0071435 | potassium ion export(GO:0071435) |
| 0.0 | 0.3 | GO:0032025 | response to cobalt ion(GO:0032025) |
| 0.0 | 1.1 | GO:0021762 | substantia nigra development(GO:0021762) |
| 0.0 | 0.4 | GO:0038092 | nodal signaling pathway(GO:0038092) |
| 0.0 | 0.5 | GO:0034063 | stress granule assembly(GO:0034063) |
| 0.0 | 1.9 | GO:1902017 | regulation of cilium assembly(GO:1902017) |
| 0.0 | 0.4 | GO:0045063 | T-helper 1 cell differentiation(GO:0045063) |
| 0.0 | 1.1 | GO:0043001 | Golgi to plasma membrane protein transport(GO:0043001) |
| 0.0 | 0.4 | GO:0032688 | negative regulation of interferon-beta production(GO:0032688) |
| 0.0 | 0.4 | GO:0002115 | store-operated calcium entry(GO:0002115) |
| 0.0 | 0.2 | GO:0003263 | cardioblast proliferation(GO:0003263) regulation of cardioblast proliferation(GO:0003264) |
| 0.0 | 0.2 | GO:0010909 | regulation of heparan sulfate proteoglycan biosynthetic process(GO:0010908) positive regulation of heparan sulfate proteoglycan biosynthetic process(GO:0010909) canonical Wnt signaling pathway involved in positive regulation of epithelial to mesenchymal transition(GO:0044334) positive regulation of proteoglycan biosynthetic process(GO:1902730) |
| 0.0 | 0.6 | GO:0010763 | positive regulation of fibroblast migration(GO:0010763) |
| 0.0 | 1.3 | GO:0051965 | positive regulation of synapse assembly(GO:0051965) |
| 0.0 | 0.6 | GO:0036465 | synaptic vesicle recycling(GO:0036465) |
| 0.0 | 0.3 | GO:0009173 | UMP biosynthetic process(GO:0006222) pyrimidine ribonucleoside monophosphate metabolic process(GO:0009173) pyrimidine ribonucleoside monophosphate biosynthetic process(GO:0009174) UMP metabolic process(GO:0046049) |
| 0.0 | 0.0 | GO:0006196 | AMP catabolic process(GO:0006196) |
| 0.0 | 0.2 | GO:0048672 | positive regulation of collateral sprouting(GO:0048672) |
| 0.0 | 0.7 | GO:0009303 | rRNA transcription(GO:0009303) |
| 0.0 | 0.2 | GO:0006013 | mannose metabolic process(GO:0006013) |
| 0.0 | 1.4 | GO:0071277 | cellular response to calcium ion(GO:0071277) |
| 0.0 | 0.1 | GO:0007185 | transmembrane receptor protein tyrosine phosphatase signaling pathway(GO:0007185) |
| 0.0 | 0.7 | GO:0032008 | positive regulation of TOR signaling(GO:0032008) |
| 0.0 | 1.3 | GO:0010923 | negative regulation of phosphatase activity(GO:0010923) |
| 0.0 | 0.2 | GO:0035279 | mRNA cleavage involved in gene silencing by miRNA(GO:0035279) mRNA cleavage involved in gene silencing(GO:0098795) |
| 0.0 | 1.2 | GO:0015701 | bicarbonate transport(GO:0015701) |
| 0.0 | 0.1 | GO:1901164 | negative regulation of trophoblast cell migration(GO:1901164) |
| 0.0 | 0.3 | GO:0051085 | chaperone mediated protein folding requiring cofactor(GO:0051085) |
| 0.0 | 0.5 | GO:0030166 | proteoglycan biosynthetic process(GO:0030166) |
| 0.0 | 0.5 | GO:0006379 | mRNA cleavage(GO:0006379) |
| 0.0 | 0.4 | GO:0036152 | phosphatidylethanolamine acyl-chain remodeling(GO:0036152) |
| 0.0 | 0.4 | GO:2001222 | regulation of neuron migration(GO:2001222) |
| 0.0 | 0.1 | GO:1903300 | negative regulation of glucokinase activity(GO:0033132) negative regulation of hexokinase activity(GO:1903300) |
| 0.0 | 0.2 | GO:1990440 | positive regulation of transcription from RNA polymerase II promoter in response to endoplasmic reticulum stress(GO:1990440) |
| 0.0 | 1.5 | GO:0045454 | cell redox homeostasis(GO:0045454) |
| 0.0 | 0.3 | GO:0034035 | purine ribonucleoside bisphosphate metabolic process(GO:0034035) 3'-phosphoadenosine 5'-phosphosulfate metabolic process(GO:0050427) |
| 0.0 | 0.5 | GO:0030866 | cortical actin cytoskeleton organization(GO:0030866) |
| 0.0 | 0.3 | GO:0006851 | mitochondrial calcium ion transport(GO:0006851) |
| 0.0 | 0.5 | GO:0000060 | protein import into nucleus, translocation(GO:0000060) |
| 0.0 | 1.2 | GO:0015914 | phospholipid transport(GO:0015914) |
| 0.0 | 0.1 | GO:0019074 | viral genome packaging(GO:0019072) viral RNA genome packaging(GO:0019074) |
| 0.0 | 0.5 | GO:0018198 | peptidyl-cysteine modification(GO:0018198) |
| 0.0 | 0.2 | GO:0000290 | deadenylation-dependent decapping of nuclear-transcribed mRNA(GO:0000290) |
| 0.0 | 0.1 | GO:0034975 | protein folding in endoplasmic reticulum(GO:0034975) |
| 0.0 | 0.1 | GO:0031118 | rRNA pseudouridine synthesis(GO:0031118) |
| 0.0 | 0.3 | GO:1903861 | positive regulation of dendrite extension(GO:1903861) |
| 0.0 | 0.2 | GO:0048670 | regulation of collateral sprouting(GO:0048670) |
| 0.0 | 0.9 | GO:0050909 | sensory perception of taste(GO:0050909) |
| 0.0 | 0.0 | GO:0006045 | N-acetylglucosamine biosynthetic process(GO:0006045) glucosamine-containing compound biosynthetic process(GO:1901073) |
| 0.0 | 0.1 | GO:0008063 | Toll signaling pathway(GO:0008063) |
| 0.0 | 0.1 | GO:0070884 | regulation of calcineurin-NFAT signaling cascade(GO:0070884) |
Gene overrepresentation in cellular component category:
| Log-likelihood per target | Total log-likelihood | Term | Description |
|---|---|---|---|
| 0.7 | 3.3 | GO:0038039 | G-protein coupled receptor heterodimeric complex(GO:0038039) |
| 0.6 | 2.4 | GO:0098855 | HCN channel complex(GO:0098855) |
| 0.5 | 2.0 | GO:0070044 | synaptobrevin 2-SNAP-25-syntaxin-1a complex(GO:0070044) |
| 0.5 | 7.9 | GO:0044327 | dendritic spine head(GO:0044327) |
| 0.4 | 2.1 | GO:1902937 | inward rectifier potassium channel complex(GO:1902937) |
| 0.4 | 3.3 | GO:0044530 | supraspliceosomal complex(GO:0044530) |
| 0.4 | 3.7 | GO:0048787 | presynaptic active zone membrane(GO:0048787) |
| 0.4 | 2.0 | GO:1990742 | microvesicle(GO:1990742) |
| 0.3 | 2.6 | GO:0032279 | asymmetric synapse(GO:0032279) |
| 0.3 | 1.4 | GO:1990498 | mitotic spindle microtubule(GO:1990498) |
| 0.3 | 1.1 | GO:0098843 | postsynaptic endocytic zone(GO:0098843) |
| 0.3 | 8.0 | GO:0098563 | integral component of synaptic vesicle membrane(GO:0030285) intrinsic component of synaptic vesicle membrane(GO:0098563) |
| 0.3 | 4.1 | GO:0031209 | SCAR complex(GO:0031209) |
| 0.2 | 4.5 | GO:0098839 | postsynaptic density membrane(GO:0098839) |
| 0.2 | 0.6 | GO:0005592 | collagen type XI trimer(GO:0005592) |
| 0.2 | 0.6 | GO:0034686 | integrin alphav-beta8 complex(GO:0034686) |
| 0.2 | 1.5 | GO:0030121 | AP-1 adaptor complex(GO:0030121) |
| 0.2 | 9.2 | GO:0031092 | platelet alpha granule membrane(GO:0031092) |
| 0.2 | 4.9 | GO:0005952 | cAMP-dependent protein kinase complex(GO:0005952) |
| 0.2 | 0.9 | GO:0016533 | cyclin-dependent protein kinase 5 holoenzyme complex(GO:0016533) |
| 0.2 | 2.1 | GO:0061673 | mitotic spindle astral microtubule(GO:0061673) |
| 0.2 | 1.4 | GO:0005594 | collagen type IX trimer(GO:0005594) |
| 0.2 | 1.9 | GO:0043190 | ATP-binding cassette (ABC) transporter complex(GO:0043190) |
| 0.2 | 3.1 | GO:1990907 | beta-catenin-TCF complex(GO:1990907) |
| 0.2 | 1.3 | GO:1990452 | Parkin-FBXW7-Cul1 ubiquitin ligase complex(GO:1990452) |
| 0.2 | 0.6 | GO:0044393 | microspike(GO:0044393) |
| 0.2 | 0.9 | GO:1990604 | IRE1-TRAF2-ASK1 complex(GO:1990604) |
| 0.1 | 1.8 | GO:0005664 | origin recognition complex(GO:0000808) nuclear origin of replication recognition complex(GO:0005664) |
| 0.1 | 2.7 | GO:0030015 | CCR4-NOT core complex(GO:0030015) |
| 0.1 | 1.0 | GO:0000308 | cytoplasmic cyclin-dependent protein kinase holoenzyme complex(GO:0000308) |
| 0.1 | 7.3 | GO:0048786 | presynaptic active zone(GO:0048786) |
| 0.1 | 2.4 | GO:0042583 | chromaffin granule(GO:0042583) neurofibrillary tangle(GO:0097418) |
| 0.1 | 5.3 | GO:0043194 | axon initial segment(GO:0043194) |
| 0.1 | 1.0 | GO:0097129 | cyclin D2-CDK4 complex(GO:0097129) |
| 0.1 | 1.5 | GO:0005955 | calcineurin complex(GO:0005955) |
| 0.1 | 0.5 | GO:0098592 | cytoplasmic side of apical plasma membrane(GO:0098592) |
| 0.1 | 0.5 | GO:0044326 | dendritic spine neck(GO:0044326) |
| 0.1 | 4.6 | GO:1902710 | GABA receptor complex(GO:1902710) GABA-A receptor complex(GO:1902711) |
| 0.1 | 1.5 | GO:0005883 | neurofilament(GO:0005883) |
| 0.1 | 1.0 | GO:0016012 | sarcoglycan complex(GO:0016012) |
| 0.1 | 0.8 | GO:0071256 | Sec61 translocon complex(GO:0005784) translocon complex(GO:0071256) |
| 0.1 | 1.4 | GO:0016600 | flotillin complex(GO:0016600) |
| 0.1 | 0.4 | GO:0034365 | discoidal high-density lipoprotein particle(GO:0034365) |
| 0.1 | 2.0 | GO:0032591 | dendritic spine membrane(GO:0032591) |
| 0.1 | 0.7 | GO:0089701 | U2AF(GO:0089701) |
| 0.1 | 2.1 | GO:1990454 | L-type voltage-gated calcium channel complex(GO:1990454) |
| 0.1 | 0.4 | GO:0034274 | Atg12-Atg5-Atg16 complex(GO:0034274) |
| 0.1 | 1.1 | GO:0005577 | fibrinogen complex(GO:0005577) |
| 0.1 | 0.3 | GO:0043293 | apoptosome(GO:0043293) |
| 0.1 | 3.3 | GO:0032281 | AMPA glutamate receptor complex(GO:0032281) |
| 0.1 | 0.5 | GO:1990761 | growth cone lamellipodium(GO:1990761) |
| 0.1 | 3.9 | GO:0097228 | sperm principal piece(GO:0097228) |
| 0.1 | 0.2 | GO:0030849 | X chromosome(GO:0000805) autosome(GO:0030849) |
| 0.1 | 1.0 | GO:0042589 | zymogen granule membrane(GO:0042589) |
| 0.1 | 0.6 | GO:0097425 | smooth endoplasmic reticulum membrane(GO:0030868) smooth endoplasmic reticulum part(GO:0097425) |
| 0.1 | 1.5 | GO:0005885 | Arp2/3 protein complex(GO:0005885) |
| 0.1 | 0.5 | GO:0061200 | clathrin-sculpted gamma-aminobutyric acid transport vesicle(GO:0061200) clathrin-sculpted gamma-aminobutyric acid transport vesicle membrane(GO:0061202) |
| 0.1 | 8.1 | GO:0042734 | presynaptic membrane(GO:0042734) |
| 0.1 | 1.3 | GO:0017146 | NMDA selective glutamate receptor complex(GO:0017146) |
| 0.1 | 0.9 | GO:0097486 | multivesicular body lumen(GO:0097486) |
| 0.1 | 5.4 | GO:0043198 | dendritic shaft(GO:0043198) |
| 0.1 | 0.8 | GO:0046696 | lipopolysaccharide receptor complex(GO:0046696) |
| 0.1 | 2.3 | GO:0001891 | phagocytic cup(GO:0001891) |
| 0.1 | 3.0 | GO:0031258 | lamellipodium membrane(GO:0031258) |
| 0.1 | 0.3 | GO:0070826 | paraferritin complex(GO:0070826) |
| 0.1 | 3.0 | GO:0000159 | protein phosphatase type 2A complex(GO:0000159) |
| 0.1 | 0.5 | GO:0070852 | cell body fiber(GO:0070852) |
| 0.1 | 0.5 | GO:0031428 | box C/D snoRNP complex(GO:0031428) |
| 0.0 | 0.2 | GO:0097550 | transcriptional preinitiation complex(GO:0097550) |
| 0.0 | 0.8 | GO:0031616 | spindle pole centrosome(GO:0031616) |
| 0.0 | 0.5 | GO:0097197 | tetraspanin-enriched microdomain(GO:0097197) |
| 0.0 | 1.6 | GO:0031233 | intrinsic component of external side of plasma membrane(GO:0031233) |
| 0.0 | 1.3 | GO:0071141 | SMAD protein complex(GO:0071141) |
| 0.0 | 1.3 | GO:0035327 | transcriptionally active chromatin(GO:0035327) |
| 0.0 | 1.3 | GO:0046658 | anchored component of plasma membrane(GO:0046658) |
| 0.0 | 1.4 | GO:1990124 | messenger ribonucleoprotein complex(GO:1990124) |
| 0.0 | 0.2 | GO:0034666 | integrin alpha2-beta1 complex(GO:0034666) |
| 0.0 | 0.7 | GO:0097433 | dense body(GO:0097433) |
| 0.0 | 0.5 | GO:0001940 | male pronucleus(GO:0001940) |
| 0.0 | 0.5 | GO:0070652 | HAUS complex(GO:0070652) |
| 0.0 | 1.4 | GO:0005697 | telomerase holoenzyme complex(GO:0005697) |
| 0.0 | 0.2 | GO:0032301 | MutSalpha complex(GO:0032301) MutSbeta complex(GO:0032302) |
| 0.0 | 3.8 | GO:0008076 | voltage-gated potassium channel complex(GO:0008076) |
| 0.0 | 0.5 | GO:0014701 | junctional sarcoplasmic reticulum membrane(GO:0014701) |
| 0.0 | 0.6 | GO:1990909 | Wnt signalosome(GO:1990909) |
| 0.0 | 0.5 | GO:0031045 | dense core granule(GO:0031045) |
| 0.0 | 2.9 | GO:0099501 | synaptic vesicle membrane(GO:0030672) exocytic vesicle membrane(GO:0099501) |
| 0.0 | 1.5 | GO:0031312 | extrinsic component of organelle membrane(GO:0031312) |
| 0.0 | 11.2 | GO:0060076 | excitatory synapse(GO:0060076) |
| 0.0 | 3.3 | GO:0055038 | recycling endosome membrane(GO:0055038) |
| 0.0 | 0.3 | GO:0098554 | cytoplasmic side of endoplasmic reticulum membrane(GO:0098554) |
| 0.0 | 1.0 | GO:0031083 | BLOC-1 complex(GO:0031083) |
| 0.0 | 4.5 | GO:0043204 | perikaryon(GO:0043204) |
| 0.0 | 0.5 | GO:0043083 | synaptic cleft(GO:0043083) |
| 0.0 | 7.6 | GO:0098793 | presynapse(GO:0098793) |
| 0.0 | 0.1 | GO:1990356 | sumoylated E2 ligase complex(GO:1990356) |
| 0.0 | 0.5 | GO:0030904 | retromer complex(GO:0030904) |
| 0.0 | 0.3 | GO:1990578 | perinuclear endoplasmic reticulum membrane(GO:1990578) |
| 0.0 | 0.2 | GO:0033165 | interphotoreceptor matrix(GO:0033165) |
| 0.0 | 0.1 | GO:1990913 | sperm head plasma membrane(GO:1990913) ooplasm(GO:1990917) |
| 0.0 | 1.9 | GO:0030669 | clathrin-coated endocytic vesicle membrane(GO:0030669) |
| 0.0 | 0.5 | GO:0010369 | chromocenter(GO:0010369) |
| 0.0 | 0.1 | GO:0000243 | commitment complex(GO:0000243) |
| 0.0 | 0.6 | GO:0031932 | TORC2 complex(GO:0031932) |
| 0.0 | 0.4 | GO:0005686 | U2 snRNP(GO:0005686) |
| 0.0 | 1.6 | GO:0005834 | heterotrimeric G-protein complex(GO:0005834) |
| 0.0 | 0.4 | GO:0000124 | SAGA complex(GO:0000124) |
| 0.0 | 0.5 | GO:0031307 | integral component of mitochondrial outer membrane(GO:0031307) |
| 0.0 | 1.5 | GO:0032420 | stereocilium(GO:0032420) |
| 0.0 | 2.1 | GO:0055037 | recycling endosome(GO:0055037) |
| 0.0 | 3.3 | GO:0030426 | growth cone(GO:0030426) |
| 0.0 | 0.3 | GO:0030123 | AP-3 adaptor complex(GO:0030123) |
| 0.0 | 0.6 | GO:0031231 | integral component of peroxisomal membrane(GO:0005779) intrinsic component of peroxisomal membrane(GO:0031231) |
| 0.0 | 6.3 | GO:0043025 | neuronal cell body(GO:0043025) |
| 0.0 | 2.7 | GO:0036064 | ciliary basal body(GO:0036064) |
| 0.0 | 1.7 | GO:0044309 | neuron spine(GO:0044309) |
| 0.0 | 2.7 | GO:0031901 | early endosome membrane(GO:0031901) |
| 0.0 | 0.2 | GO:0033256 | I-kappaB/NF-kappaB complex(GO:0033256) |
| 0.0 | 1.6 | GO:0001750 | photoreceptor outer segment(GO:0001750) |
| 0.0 | 0.3 | GO:0030014 | CCR4-NOT complex(GO:0030014) |
| 0.0 | 0.2 | GO:0070187 | telosome(GO:0070187) |
| 0.0 | 0.9 | GO:0000307 | cyclin-dependent protein kinase holoenzyme complex(GO:0000307) |
| 0.0 | 1.3 | GO:0031903 | peroxisomal membrane(GO:0005778) microbody membrane(GO:0031903) |
| 0.0 | 0.3 | GO:0034993 | microtubule organizing center attachment site(GO:0034992) LINC complex(GO:0034993) |
| 0.0 | 0.1 | GO:0000138 | Golgi trans cisterna(GO:0000138) |
| 0.0 | 0.7 | GO:0071565 | nBAF complex(GO:0071565) |
| 0.0 | 1.3 | GO:1904724 | tertiary granule lumen(GO:1904724) |
| 0.0 | 1.1 | GO:0005637 | nuclear inner membrane(GO:0005637) |
| 0.0 | 0.2 | GO:0097450 | astrocyte end-foot(GO:0097450) glial limiting end-foot(GO:0097451) |
| 0.0 | 0.1 | GO:0042382 | paraspeckles(GO:0042382) |
| 0.0 | 0.1 | GO:1990131 | Gtr1-Gtr2 GTPase complex(GO:1990131) |
| 0.0 | 0.1 | GO:0016272 | prefoldin complex(GO:0016272) |
| 0.0 | 0.2 | GO:0001917 | photoreceptor inner segment(GO:0001917) |
| 0.0 | 0.7 | GO:0005801 | cis-Golgi network(GO:0005801) |
| 0.0 | 0.7 | GO:0000315 | organellar large ribosomal subunit(GO:0000315) mitochondrial large ribosomal subunit(GO:0005762) |
| 0.0 | 0.8 | GO:0005881 | cytoplasmic microtubule(GO:0005881) |
| 0.0 | 0.8 | GO:0019005 | SCF ubiquitin ligase complex(GO:0019005) |
| 0.0 | 0.1 | GO:0008622 | epsilon DNA polymerase complex(GO:0008622) |
| 0.0 | 0.4 | GO:0005839 | proteasome core complex(GO:0005839) |
Gene overrepresentation in molecular function category:
| Log-likelihood per target | Total log-likelihood | Term | Description |
|---|---|---|---|
| 1.4 | 8.1 | GO:0060961 | phospholipase D inhibitor activity(GO:0060961) |
| 0.8 | 3.3 | GO:0031751 | D4 dopamine receptor binding(GO:0031751) |
| 0.7 | 2.6 | GO:0042282 | hydroxymethylglutaryl-CoA reductase (NADPH) activity(GO:0004420) hydroxymethylglutaryl-CoA reductase activity(GO:0042282) |
| 0.6 | 5.0 | GO:1904315 | neurotransmitter receptor activity involved in regulation of postsynaptic membrane potential(GO:0099529) transmitter-gated ion channel activity involved in regulation of postsynaptic membrane potential(GO:1904315) |
| 0.5 | 3.3 | GO:0004965 | G-protein coupled GABA receptor activity(GO:0004965) |
| 0.5 | 2.0 | GO:0008427 | calcium-dependent protein kinase inhibitor activity(GO:0008427) |
| 0.5 | 3.4 | GO:0097001 | ceramide binding(GO:0097001) |
| 0.5 | 1.4 | GO:0015229 | L-ascorbate:sodium symporter activity(GO:0008520) L-ascorbic acid transporter activity(GO:0015229) sodium-dependent L-ascorbate transmembrane transporter activity(GO:0070890) |
| 0.4 | 3.6 | GO:0016907 | G-protein coupled acetylcholine receptor activity(GO:0016907) |
| 0.4 | 3.3 | GO:0003726 | double-stranded RNA adenosine deaminase activity(GO:0003726) |
| 0.3 | 2.6 | GO:0042610 | CD8 receptor binding(GO:0042610) |
| 0.3 | 1.0 | GO:0036134 | thromboxane-A synthase activity(GO:0004796) 12-hydroxyheptadecatrienoic acid synthase activity(GO:0036134) |
| 0.3 | 1.6 | GO:0004441 | inositol-1,4-bisphosphate 1-phosphatase activity(GO:0004441) inositol-1,3,4-trisphosphate 1-phosphatase activity(GO:0052829) |
| 0.3 | 0.9 | GO:0099530 | G-protein coupled receptor activity involved in regulation of postsynaptic membrane potential(GO:0099530) |
| 0.3 | 2.4 | GO:0005222 | intracellular cAMP activated cation channel activity(GO:0005222) |
| 0.3 | 0.9 | GO:0016534 | cyclin-dependent protein kinase 5 activator activity(GO:0016534) |
| 0.3 | 1.2 | GO:0031687 | A2A adenosine receptor binding(GO:0031687) |
| 0.3 | 0.8 | GO:0008294 | calcium- and calmodulin-responsive adenylate cyclase activity(GO:0008294) |
| 0.2 | 1.5 | GO:0005275 | amine transmembrane transporter activity(GO:0005275) |
| 0.2 | 5.5 | GO:0008603 | cAMP-dependent protein kinase regulator activity(GO:0008603) |
| 0.2 | 2.3 | GO:0030348 | syntaxin-3 binding(GO:0030348) |
| 0.2 | 1.8 | GO:0004359 | glutaminase activity(GO:0004359) |
| 0.2 | 4.7 | GO:0061578 | Lys63-specific deubiquitinase activity(GO:0061578) |
| 0.2 | 0.7 | GO:0004416 | hydroxyacylglutathione hydrolase activity(GO:0004416) |
| 0.2 | 1.3 | GO:0047894 | flavonol 3-sulfotransferase activity(GO:0047894) |
| 0.2 | 1.1 | GO:0070052 | fibrinogen binding(GO:0070051) collagen V binding(GO:0070052) |
| 0.2 | 0.6 | GO:0030158 | protein xylosyltransferase activity(GO:0030158) |
| 0.2 | 7.5 | GO:0070300 | phosphatidic acid binding(GO:0070300) |
| 0.2 | 0.6 | GO:0034416 | bisphosphoglycerate phosphatase activity(GO:0034416) inositol-1,3,4,5-tetrakisphosphate 3-phosphatase activity(GO:0051717) |
| 0.2 | 2.7 | GO:0015279 | store-operated calcium channel activity(GO:0015279) |
| 0.2 | 8.0 | GO:0008331 | high voltage-gated calcium channel activity(GO:0008331) |
| 0.2 | 1.8 | GO:0035727 | lysophosphatidic acid binding(GO:0035727) |
| 0.2 | 0.6 | GO:0016309 | 1-phosphatidylinositol-5-phosphate 4-kinase activity(GO:0016309) |
| 0.2 | 0.6 | GO:0033842 | N-acetyl-beta-glucosaminyl-glycoprotein 4-beta-N-acetylgalactosaminyltransferase activity(GO:0033842) |
| 0.2 | 2.9 | GO:0030284 | estrogen receptor activity(GO:0030284) |
| 0.2 | 2.3 | GO:0022851 | GABA-gated chloride ion channel activity(GO:0022851) |
| 0.2 | 1.4 | GO:0050816 | phosphothreonine binding(GO:0050816) |
| 0.2 | 0.9 | GO:0004906 | interferon-gamma receptor activity(GO:0004906) |
| 0.2 | 1.7 | GO:0008526 | phosphatidylinositol transporter activity(GO:0008526) |
| 0.2 | 0.7 | GO:0004698 | calcium-dependent protein kinase C activity(GO:0004698) |
| 0.2 | 1.0 | GO:0015018 | galactosylgalactosylxylosylprotein 3-beta-glucuronosyltransferase activity(GO:0015018) |
| 0.2 | 0.7 | GO:0004513 | neolactotetraosylceramide alpha-2,3-sialyltransferase activity(GO:0004513) lactosylceramide alpha-2,3-sialyltransferase activity(GO:0047291) |
| 0.2 | 0.8 | GO:0004994 | somatostatin receptor activity(GO:0004994) |
| 0.2 | 1.6 | GO:0031812 | G-protein coupled nucleotide receptor binding(GO:0031811) P2Y1 nucleotide receptor binding(GO:0031812) |
| 0.2 | 0.5 | GO:0098973 | structural constituent of synapse(GO:0098918) structural constituent of postsynaptic actin cytoskeleton(GO:0098973) |
| 0.2 | 0.9 | GO:0005105 | type 1 fibroblast growth factor receptor binding(GO:0005105) |
| 0.2 | 0.5 | GO:1990259 | protein-glutamine N-methyltransferase activity(GO:0036009) histone-glutamine methyltransferase activity(GO:1990259) |
| 0.2 | 0.6 | GO:0001641 | group II metabotropic glutamate receptor activity(GO:0001641) |
| 0.2 | 2.0 | GO:0097100 | supercoiled DNA binding(GO:0097100) |
| 0.1 | 1.0 | GO:0050659 | N-acetylgalactosamine 4-sulfate 6-O-sulfotransferase activity(GO:0050659) |
| 0.1 | 0.4 | GO:0019785 | ISG15-specific protease activity(GO:0019785) |
| 0.1 | 1.7 | GO:0015272 | ATP-activated inward rectifier potassium channel activity(GO:0015272) |
| 0.1 | 1.3 | GO:0035500 | MH2 domain binding(GO:0035500) |
| 0.1 | 1.1 | GO:0005220 | inositol 1,4,5-trisphosphate-sensitive calcium-release channel activity(GO:0005220) |
| 0.1 | 0.3 | GO:0031750 | D3 dopamine receptor binding(GO:0031750) |
| 0.1 | 0.5 | GO:0035033 | histone deacetylase regulator activity(GO:0035033) |
| 0.1 | 1.2 | GO:0043325 | phosphatidylinositol-3,4-bisphosphate binding(GO:0043325) |
| 0.1 | 0.8 | GO:0005298 | proline:sodium symporter activity(GO:0005298) |
| 0.1 | 0.5 | GO:0098770 | FBXO family protein binding(GO:0098770) |
| 0.1 | 2.3 | GO:0031996 | thioesterase binding(GO:0031996) |
| 0.1 | 0.8 | GO:0008273 | calcium, potassium:sodium antiporter activity(GO:0008273) |
| 0.1 | 0.4 | GO:1904854 | proteasome core complex binding(GO:1904854) |
| 0.1 | 2.3 | GO:0003680 | AT DNA binding(GO:0003680) |
| 0.1 | 0.5 | GO:0033765 | 3-oxo-5-alpha-steroid 4-dehydrogenase activity(GO:0003865) steroid dehydrogenase activity, acting on the CH-CH group of donors(GO:0033765) cholestenone 5-alpha-reductase activity(GO:0047751) |
| 0.1 | 7.0 | GO:0005484 | SNAP receptor activity(GO:0005484) |
| 0.1 | 3.1 | GO:0086080 | protein binding involved in heterotypic cell-cell adhesion(GO:0086080) |
| 0.1 | 1.5 | GO:0005005 | transmembrane-ephrin receptor activity(GO:0005005) |
| 0.1 | 0.8 | GO:0031685 | adenosine receptor binding(GO:0031685) |
| 0.1 | 0.8 | GO:1990050 | phosphatidic acid transporter activity(GO:1990050) |
| 0.1 | 0.6 | GO:1990430 | extracellular matrix protein binding(GO:1990430) |
| 0.1 | 1.8 | GO:0030020 | extracellular matrix structural constituent conferring tensile strength(GO:0030020) |
| 0.1 | 1.3 | GO:0055131 | C3HC4-type RING finger domain binding(GO:0055131) |
| 0.1 | 2.4 | GO:0051400 | BH domain binding(GO:0051400) |
| 0.1 | 0.5 | GO:0048763 | calcium-induced calcium release activity(GO:0048763) |
| 0.1 | 0.7 | GO:0008321 | Ral guanyl-nucleotide exchange factor activity(GO:0008321) |
| 0.1 | 1.3 | GO:0070290 | N-acylphosphatidylethanolamine-specific phospholipase D activity(GO:0070290) |
| 0.1 | 0.9 | GO:0042978 | ornithine decarboxylase activator activity(GO:0042978) |
| 0.1 | 1.3 | GO:0010851 | cyclase regulator activity(GO:0010851) |
| 0.1 | 0.6 | GO:0080019 | fatty-acyl-CoA reductase (alcohol-forming) activity(GO:0080019) |
| 0.1 | 1.8 | GO:0032051 | clathrin light chain binding(GO:0032051) |
| 0.1 | 0.4 | GO:0047192 | 1-alkylglycerophosphocholine O-acetyltransferase activity(GO:0047192) |
| 0.1 | 1.4 | GO:0102337 | fatty acid elongase activity(GO:0009922) 3-oxo-arachidoyl-CoA synthase activity(GO:0102336) 3-oxo-cerotoyl-CoA synthase activity(GO:0102337) 3-oxo-lignoceronyl-CoA synthase activity(GO:0102338) |
| 0.1 | 1.0 | GO:0003876 | AMP deaminase activity(GO:0003876) adenosine-phosphate deaminase activity(GO:0047623) |
| 0.1 | 0.5 | GO:0070326 | very-low-density lipoprotein particle receptor binding(GO:0070326) |
| 0.1 | 2.3 | GO:0015095 | magnesium ion transmembrane transporter activity(GO:0015095) |
| 0.1 | 0.3 | GO:2001069 | glycogen binding(GO:2001069) |
| 0.1 | 1.2 | GO:1902282 | voltage-gated potassium channel activity involved in ventricular cardiac muscle cell action potential repolarization(GO:1902282) |
| 0.1 | 0.3 | GO:0032093 | SAM domain binding(GO:0032093) |
| 0.1 | 0.4 | GO:0030550 | acetylcholine receptor inhibitor activity(GO:0030550) |
| 0.1 | 0.5 | GO:0070579 | methylcytosine dioxygenase activity(GO:0070579) |
| 0.1 | 1.1 | GO:0038132 | neuregulin binding(GO:0038132) |
| 0.1 | 1.9 | GO:0032036 | myosin heavy chain binding(GO:0032036) |
| 0.1 | 1.3 | GO:1990247 | N6-methyladenosine-containing RNA binding(GO:1990247) |
| 0.1 | 0.4 | GO:0019776 | Atg8 ligase activity(GO:0019776) |
| 0.1 | 0.9 | GO:0046974 | histone methyltransferase activity (H3-K9 specific)(GO:0046974) |
| 0.1 | 2.2 | GO:0019992 | diacylglycerol binding(GO:0019992) |
| 0.1 | 0.5 | GO:0034431 | endopolyphosphatase activity(GO:0000298) diphosphoinositol-polyphosphate diphosphatase activity(GO:0008486) bis(5'-adenosyl)-hexaphosphatase activity(GO:0034431) bis(5'-adenosyl)-pentaphosphatase activity(GO:0034432) inositol diphosphate tetrakisphosphate diphosphatase activity(GO:0052840) inositol bisdiphosphate tetrakisphosphate diphosphatase activity(GO:0052841) inositol diphosphate pentakisphosphate diphosphatase activity(GO:0052842) inositol-1-diphosphate-2,3,4,5,6-pentakisphosphate diphosphatase activity(GO:0052843) inositol-3-diphosphate-1,2,4,5,6-pentakisphosphate diphosphatase activity(GO:0052844) inositol-5-diphosphate-1,2,3,4,6-pentakisphosphate diphosphatase activity(GO:0052845) inositol-1,5-bisdiphosphate-2,3,4,6-tetrakisphosphate 1-diphosphatase activity(GO:0052846) inositol-1,5-bisdiphosphate-2,3,4,6-tetrakisphosphate 5-diphosphatase activity(GO:0052847) inositol-3,5-bisdiphosphate-2,3,4,6-tetrakisphosphate 5-diphosphatase activity(GO:0052848) |
| 0.1 | 1.1 | GO:0004971 | AMPA glutamate receptor activity(GO:0004971) |
| 0.1 | 0.6 | GO:0004499 | N,N-dimethylaniline monooxygenase activity(GO:0004499) |
| 0.1 | 0.5 | GO:0016509 | long-chain-3-hydroxyacyl-CoA dehydrogenase activity(GO:0016509) |
| 0.1 | 0.8 | GO:0015277 | kainate selective glutamate receptor activity(GO:0015277) |
| 0.1 | 0.2 | GO:0004651 | polynucleotide 5'-phosphatase activity(GO:0004651) |
| 0.1 | 0.4 | GO:0047179 | platelet-activating factor acetyltransferase activity(GO:0047179) |
| 0.1 | 0.6 | GO:0000155 | phosphorelay sensor kinase activity(GO:0000155) |
| 0.1 | 1.5 | GO:0008140 | cAMP response element binding protein binding(GO:0008140) |
| 0.1 | 0.5 | GO:0001537 | N-acetylgalactosamine 4-O-sulfotransferase activity(GO:0001537) |
| 0.1 | 1.9 | GO:0030215 | semaphorin receptor binding(GO:0030215) |
| 0.1 | 1.5 | GO:0055056 | D-glucose transmembrane transporter activity(GO:0055056) |
| 0.1 | 1.3 | GO:0003688 | DNA replication origin binding(GO:0003688) |
| 0.1 | 0.7 | GO:0030160 | GKAP/Homer scaffold activity(GO:0030160) |
| 0.1 | 0.8 | GO:0070181 | small ribosomal subunit rRNA binding(GO:0070181) |
| 0.1 | 0.2 | GO:0017089 | glycolipid transporter activity(GO:0017089) |
| 0.1 | 0.2 | GO:0004630 | phospholipase D activity(GO:0004630) |
| 0.1 | 0.3 | GO:0005094 | Rho GDP-dissociation inhibitor activity(GO:0005094) |
| 0.1 | 0.5 | GO:0016403 | dimethylargininase activity(GO:0016403) |
| 0.1 | 4.1 | GO:0005547 | phosphatidylinositol-3,4,5-trisphosphate binding(GO:0005547) |
| 0.1 | 0.2 | GO:0070506 | high-density lipoprotein particle receptor activity(GO:0070506) |
| 0.1 | 0.5 | GO:0004873 | asialoglycoprotein receptor activity(GO:0004873) |
| 0.1 | 1.8 | GO:0042043 | neurexin family protein binding(GO:0042043) |
| 0.1 | 0.5 | GO:1990829 | C-rich single-stranded DNA binding(GO:1990829) |
| 0.1 | 0.8 | GO:0005234 | extracellular-glutamate-gated ion channel activity(GO:0005234) |
| 0.1 | 0.2 | GO:0031826 | type 2A serotonin receptor binding(GO:0031826) |
| 0.1 | 2.0 | GO:0051787 | misfolded protein binding(GO:0051787) |
| 0.1 | 0.2 | GO:0052830 | inositol tetrakisphosphate 1-kinase activity(GO:0047325) inositol-1,3,4-trisphosphate 6-kinase activity(GO:0052725) inositol-1,3,4-trisphosphate 5-kinase activity(GO:0052726) inositol-1,3,4,5,6-pentakisphosphate 1-phosphatase activity(GO:0052825) inositol-1,3,4,6-tetrakisphosphate 6-phosphatase activity(GO:0052830) inositol-1,3,4,6-tetrakisphosphate 1-phosphatase activity(GO:0052831) inositol-3,4,6-trisphosphate 1-kinase activity(GO:0052835) |
| 0.1 | 7.2 | GO:0048365 | Rac GTPase binding(GO:0048365) |
| 0.1 | 0.3 | GO:0048101 | calcium- and calmodulin-regulated 3',5'-cyclic-GMP phosphodiesterase activity(GO:0048101) |
| 0.1 | 0.3 | GO:0015639 | cadmium ion transmembrane transporter activity(GO:0015086) cobalt ion transmembrane transporter activity(GO:0015087) lead ion transmembrane transporter activity(GO:0015094) ferrous iron uptake transmembrane transporter activity(GO:0015639) |
| 0.1 | 0.6 | GO:0015185 | gamma-aminobutyric acid:sodium symporter activity(GO:0005332) gamma-aminobutyric acid transmembrane transporter activity(GO:0015185) |
| 0.1 | 1.5 | GO:0001222 | transcription corepressor binding(GO:0001222) |
| 0.1 | 0.3 | GO:0032794 | GTPase activating protein binding(GO:0032794) |
| 0.1 | 0.3 | GO:0061649 | ubiquitinated histone binding(GO:0061649) |
| 0.1 | 0.8 | GO:0001135 | transcription factor activity, RNA polymerase II transcription factor recruiting(GO:0001135) |
| 0.1 | 4.3 | GO:0005154 | epidermal growth factor receptor binding(GO:0005154) |
| 0.1 | 1.1 | GO:0038064 | collagen receptor activity(GO:0038064) |
| 0.1 | 0.5 | GO:0005237 | inhibitory extracellular ligand-gated ion channel activity(GO:0005237) |
| 0.1 | 0.8 | GO:0035612 | AP-2 adaptor complex binding(GO:0035612) |
| 0.1 | 0.3 | GO:0050501 | hyaluronan synthase activity(GO:0050501) |
| 0.1 | 2.3 | GO:0017075 | syntaxin-1 binding(GO:0017075) |
| 0.1 | 1.7 | GO:0004012 | phospholipid-translocating ATPase activity(GO:0004012) |
| 0.1 | 0.8 | GO:0015501 | glutamate:sodium symporter activity(GO:0015501) |
| 0.0 | 0.7 | GO:0005007 | fibroblast growth factor-activated receptor activity(GO:0005007) |
| 0.0 | 0.3 | GO:0071074 | eukaryotic initiation factor eIF2 binding(GO:0071074) |
| 0.0 | 0.7 | GO:0036122 | BMP binding(GO:0036122) |
| 0.0 | 0.6 | GO:0032027 | myosin light chain binding(GO:0032027) |
| 0.0 | 0.2 | GO:0005173 | stem cell factor receptor binding(GO:0005173) |
| 0.0 | 2.0 | GO:0005001 | transmembrane receptor protein tyrosine phosphatase activity(GO:0005001) transmembrane receptor protein phosphatase activity(GO:0019198) |
| 0.0 | 0.4 | GO:0050733 | RS domain binding(GO:0050733) |
| 0.0 | 0.9 | GO:0005522 | profilin binding(GO:0005522) |
| 0.0 | 2.1 | GO:0015269 | calcium-activated potassium channel activity(GO:0015269) |
| 0.0 | 0.1 | GO:1990254 | keratin filament binding(GO:1990254) |
| 0.0 | 1.0 | GO:0052629 | phosphatidylinositol-3,5-bisphosphate 3-phosphatase activity(GO:0052629) |
| 0.0 | 0.5 | GO:0051425 | PTB domain binding(GO:0051425) |
| 0.0 | 1.0 | GO:0050998 | nitric-oxide synthase binding(GO:0050998) |
| 0.0 | 0.5 | GO:0031802 | type 5 metabotropic glutamate receptor binding(GO:0031802) |
| 0.0 | 1.7 | GO:0005184 | neuropeptide hormone activity(GO:0005184) |
| 0.0 | 0.2 | GO:0003870 | 5-aminolevulinate synthase activity(GO:0003870) N-succinyltransferase activity(GO:0016749) |
| 0.0 | 2.4 | GO:0043015 | gamma-tubulin binding(GO:0043015) |
| 0.0 | 0.2 | GO:0004572 | mannosyl-oligosaccharide 1,3-1,6-alpha-mannosidase activity(GO:0004572) |
| 0.0 | 0.9 | GO:0031681 | G-protein beta-subunit binding(GO:0031681) |
| 0.0 | 3.4 | GO:0017080 | sodium channel regulator activity(GO:0017080) |
| 0.0 | 1.2 | GO:0008494 | translation activator activity(GO:0008494) |
| 0.0 | 0.5 | GO:0047144 | 2-acylglycerol-3-phosphate O-acyltransferase activity(GO:0047144) |
| 0.0 | 1.0 | GO:0008349 | MAP kinase kinase kinase kinase activity(GO:0008349) |
| 0.0 | 1.9 | GO:0005086 | ARF guanyl-nucleotide exchange factor activity(GO:0005086) |
| 0.0 | 0.9 | GO:0005344 | oxygen transporter activity(GO:0005344) |
| 0.0 | 0.3 | GO:0030628 | pre-mRNA 3'-splice site binding(GO:0030628) |
| 0.0 | 1.7 | GO:0030676 | Rac guanyl-nucleotide exchange factor activity(GO:0030676) |
| 0.0 | 1.2 | GO:0008510 | sodium:bicarbonate symporter activity(GO:0008510) |
| 0.0 | 1.6 | GO:0008395 | steroid hydroxylase activity(GO:0008395) |
| 0.0 | 0.5 | GO:0051428 | peptide hormone receptor binding(GO:0051428) |
| 0.0 | 0.9 | GO:0035255 | ionotropic glutamate receptor binding(GO:0035255) |
| 0.0 | 0.2 | GO:0004741 | [pyruvate dehydrogenase (lipoamide)] phosphatase activity(GO:0004741) |
| 0.0 | 0.8 | GO:0005003 | ephrin receptor activity(GO:0005003) |
| 0.0 | 0.1 | GO:0048040 | UDP-glucuronate decarboxylase activity(GO:0048040) |
| 0.0 | 0.1 | GO:0016964 | alpha-2 macroglobulin receptor activity(GO:0016964) apolipoprotein receptor activity(GO:0030226) |
| 0.0 | 0.1 | GO:0070975 | FHA domain binding(GO:0070975) |
| 0.0 | 0.2 | GO:1902444 | riboflavin binding(GO:1902444) |
| 0.0 | 1.4 | GO:0043027 | cysteine-type endopeptidase inhibitor activity involved in apoptotic process(GO:0043027) |
| 0.0 | 0.2 | GO:0000406 | double-strand/single-strand DNA junction binding(GO:0000406) single thymine insertion binding(GO:0032143) dinucleotide repeat insertion binding(GO:0032181) |
| 0.0 | 1.0 | GO:0005092 | GDP-dissociation inhibitor activity(GO:0005092) |
| 0.0 | 0.2 | GO:0008532 | N-acetyllactosaminide beta-1,3-N-acetylglucosaminyltransferase activity(GO:0008532) |
| 0.0 | 1.1 | GO:0031489 | myosin V binding(GO:0031489) |
| 0.0 | 0.2 | GO:0015142 | citrate transmembrane transporter activity(GO:0015137) tricarboxylic acid transmembrane transporter activity(GO:0015142) |
| 0.0 | 0.5 | GO:0070567 | cytidylyltransferase activity(GO:0070567) |
| 0.0 | 0.9 | GO:0043274 | phospholipase binding(GO:0043274) |
| 0.0 | 0.2 | GO:0030620 | U2 snRNA binding(GO:0030620) |
| 0.0 | 2.6 | GO:0015485 | cholesterol binding(GO:0015485) |
| 0.0 | 2.3 | GO:0004693 | cyclin-dependent protein serine/threonine kinase activity(GO:0004693) |
| 0.0 | 2.4 | GO:0001540 | beta-amyloid binding(GO:0001540) |
| 0.0 | 0.1 | GO:0061656 | SUMO conjugating enzyme activity(GO:0061656) |
| 0.0 | 0.2 | GO:0004514 | nicotinate-nucleotide diphosphorylase (carboxylating) activity(GO:0004514) |
| 0.0 | 1.3 | GO:0016881 | acid-amino acid ligase activity(GO:0016881) |
| 0.0 | 0.2 | GO:0008467 | [heparan sulfate]-glucosamine 3-sulfotransferase 1 activity(GO:0008467) |
| 0.0 | 1.5 | GO:0004385 | guanylate kinase activity(GO:0004385) |
| 0.0 | 0.7 | GO:0005251 | delayed rectifier potassium channel activity(GO:0005251) |
| 0.0 | 0.5 | GO:0022820 | potassium:chloride symporter activity(GO:0015379) potassium ion symporter activity(GO:0022820) |
| 0.0 | 0.4 | GO:0022833 | mechanically-gated ion channel activity(GO:0008381) mechanically gated channel activity(GO:0022833) |
| 0.0 | 2.7 | GO:0030276 | clathrin binding(GO:0030276) |
| 0.0 | 0.7 | GO:0004745 | retinol dehydrogenase activity(GO:0004745) |
| 0.0 | 0.7 | GO:0005227 | calcium activated cation channel activity(GO:0005227) |
| 0.0 | 0.3 | GO:0004849 | uridine kinase activity(GO:0004849) |
| 0.0 | 1.3 | GO:0071889 | 14-3-3 protein binding(GO:0071889) |
| 0.0 | 0.1 | GO:0017098 | CTP binding(GO:0002135) sulfonylurea receptor binding(GO:0017098) |
| 0.0 | 0.5 | GO:0016018 | cyclosporin A binding(GO:0016018) |
| 0.0 | 0.4 | GO:0045295 | gamma-catenin binding(GO:0045295) |
| 0.0 | 1.1 | GO:0071855 | neuropeptide receptor binding(GO:0071855) |
| 0.0 | 1.0 | GO:0008093 | cytoskeletal adaptor activity(GO:0008093) |
| 0.0 | 3.1 | GO:0051219 | phosphoprotein binding(GO:0051219) |
| 0.0 | 0.2 | GO:0004720 | protein-lysine 6-oxidase activity(GO:0004720) |
| 0.0 | 0.1 | GO:0051021 | GDP-dissociation inhibitor binding(GO:0051021) Rho GDP-dissociation inhibitor binding(GO:0051022) |
| 0.0 | 0.6 | GO:0043422 | protein kinase B binding(GO:0043422) |
| 0.0 | 0.1 | GO:0003978 | UDP-N-acetylglucosamine 4-epimerase activity(GO:0003974) UDP-glucose 4-epimerase activity(GO:0003978) |
| 0.0 | 1.1 | GO:0031624 | ubiquitin conjugating enzyme binding(GO:0031624) |
| 0.0 | 3.0 | GO:0019888 | protein phosphatase regulator activity(GO:0019888) |
| 0.0 | 0.2 | GO:0004694 | eukaryotic translation initiation factor 2alpha kinase activity(GO:0004694) |
| 0.0 | 0.6 | GO:0038191 | neuropilin binding(GO:0038191) |
| 0.0 | 0.1 | GO:0004616 | phosphogluconate dehydrogenase (decarboxylating) activity(GO:0004616) |
| 0.0 | 0.6 | GO:0004708 | MAP kinase kinase activity(GO:0004708) |
| 0.0 | 0.3 | GO:0031434 | mitogen-activated protein kinase kinase binding(GO:0031434) |
| 0.0 | 0.2 | GO:0044547 | DNA topoisomerase binding(GO:0044547) |
| 0.0 | 0.8 | GO:0005164 | tumor necrosis factor receptor binding(GO:0005164) |
| 0.0 | 0.6 | GO:0031683 | G-protein beta/gamma-subunit complex binding(GO:0031683) |
| 0.0 | 1.8 | GO:0048306 | calcium-dependent protein binding(GO:0048306) |
| 0.0 | 0.4 | GO:0035925 | mRNA 3'-UTR AU-rich region binding(GO:0035925) |
| 0.0 | 0.1 | GO:0019211 | phosphatase activator activity(GO:0019211) |
| 0.0 | 0.1 | GO:0015222 | serotonin transmembrane transporter activity(GO:0015222) |
| 0.0 | 0.9 | GO:0008157 | protein phosphatase 1 binding(GO:0008157) |
| 0.0 | 0.7 | GO:0008187 | poly-pyrimidine tract binding(GO:0008187) |
| 0.0 | 0.6 | GO:0042288 | MHC class I protein binding(GO:0042288) |
| 0.0 | 0.2 | GO:0043024 | ribosomal small subunit binding(GO:0043024) |
| 0.0 | 0.2 | GO:0003872 | 6-phosphofructokinase activity(GO:0003872) |
| 0.0 | 0.9 | GO:0015020 | glucuronosyltransferase activity(GO:0015020) |
| 0.0 | 0.4 | GO:0042577 | lipid phosphatase activity(GO:0042577) |
| 0.0 | 2.7 | GO:0019903 | protein phosphatase binding(GO:0019903) |
| 0.0 | 1.0 | GO:0019894 | kinesin binding(GO:0019894) |
| 0.0 | 0.7 | GO:0097200 | cysteine-type endopeptidase activity involved in execution phase of apoptosis(GO:0097200) |
| 0.0 | 0.1 | GO:0019797 | procollagen-proline 3-dioxygenase activity(GO:0019797) |
| 0.0 | 0.3 | GO:0017162 | aryl hydrocarbon receptor binding(GO:0017162) |
| 0.0 | 0.4 | GO:0004993 | G-protein coupled serotonin receptor activity(GO:0004993) |
| 0.0 | 0.1 | GO:0000026 | alpha-1,2-mannosyltransferase activity(GO:0000026) glycolipid mannosyltransferase activity(GO:0004376) |
| 0.0 | 2.0 | GO:0002039 | p53 binding(GO:0002039) |
| 0.0 | 1.9 | GO:0004197 | cysteine-type endopeptidase activity(GO:0004197) |
| 0.0 | 0.6 | GO:0008239 | dipeptidyl-peptidase activity(GO:0008239) |
| 0.0 | 0.5 | GO:0046875 | ephrin receptor binding(GO:0046875) |
| 0.0 | 1.9 | GO:0003777 | microtubule motor activity(GO:0003777) |
| 0.0 | 0.0 | GO:0008511 | sodium:potassium:chloride symporter activity(GO:0008511) |
| 0.0 | 0.6 | GO:0071837 | HMG box domain binding(GO:0071837) |
| 0.0 | 0.6 | GO:0070530 | K63-linked polyubiquitin binding(GO:0070530) |
| 0.0 | 1.2 | GO:0030374 | ligand-dependent nuclear receptor transcription coactivator activity(GO:0030374) |
| 0.0 | 0.4 | GO:0046966 | thyroid hormone receptor binding(GO:0046966) |
| 0.0 | 4.9 | GO:0003924 | GTPase activity(GO:0003924) |
| 0.0 | 2.9 | GO:0005200 | structural constituent of cytoskeleton(GO:0005200) |
| 0.0 | 0.1 | GO:0097157 | pre-mRNA intronic binding(GO:0097157) |
| 0.0 | 0.3 | GO:0005095 | GTPase inhibitor activity(GO:0005095) |
| 0.0 | 0.4 | GO:0008200 | ion channel inhibitor activity(GO:0008200) |
| 0.0 | 0.0 | GO:0009384 | UDP-N-acetylglucosamine 2-epimerase activity(GO:0008761) N-acylmannosamine kinase activity(GO:0009384) |
| 0.0 | 0.3 | GO:0005123 | death receptor binding(GO:0005123) |
| 0.0 | 0.2 | GO:0047498 | calcium-dependent phospholipase A2 activity(GO:0047498) |
| 0.0 | 0.2 | GO:0050700 | CARD domain binding(GO:0050700) |
| 0.0 | 0.1 | GO:0035374 | chondroitin sulfate binding(GO:0035374) |
| 0.0 | 0.5 | GO:0017022 | myosin binding(GO:0017022) |
| 0.0 | 0.4 | GO:0016628 | oxidoreductase activity, acting on the CH-CH group of donors, NAD or NADP as acceptor(GO:0016628) |
| 0.0 | 0.2 | GO:0010314 | phosphatidylinositol-5-phosphate binding(GO:0010314) |
| 0.0 | 0.9 | GO:0001105 | RNA polymerase II transcription coactivator activity(GO:0001105) |
| 0.0 | 0.3 | GO:0005326 | neurotransmitter transporter activity(GO:0005326) |
| 0.0 | 2.3 | GO:0017124 | SH3 domain binding(GO:0017124) |
| 0.0 | 0.2 | GO:0004535 | poly(A)-specific ribonuclease activity(GO:0004535) |
Gene overrepresentation in curated gene sets: canonical pathways category:
| Log-likelihood per target | Total log-likelihood | Term | Description |
|---|---|---|---|
| 0.2 | 13.3 | PID ALPHA SYNUCLEIN PATHWAY | Alpha-synuclein signaling |
| 0.1 | 3.9 | PID EPHA FWDPATHWAY | EPHA forward signaling |
| 0.1 | 1.4 | PID FAS PATHWAY | FAS (CD95) signaling pathway |
| 0.1 | 2.1 | PID TCR RAS PATHWAY | Ras signaling in the CD4+ TCR pathway |
| 0.1 | 11.0 | PID RAC1 PATHWAY | RAC1 signaling pathway |
| 0.1 | 2.0 | SA B CELL RECEPTOR COMPLEXES | Antigen binding to B cell receptors activates protein tyrosine kinases, such as the Src family, which ultimate activate MAP kinases. |
| 0.1 | 1.2 | ST INTERFERON GAMMA PATHWAY | Interferon gamma pathway. |
| 0.1 | 4.8 | PID ARF6 PATHWAY | Arf6 signaling events |
| 0.1 | 2.2 | ST GA12 PATHWAY | G alpha 12 Pathway |
| 0.1 | 0.4 | PID S1P S1P3 PATHWAY | S1P3 pathway |
| 0.1 | 5.5 | PID INTEGRIN A4B1 PATHWAY | Alpha4 beta1 integrin signaling events |
| 0.1 | 0.5 | PID MYC PATHWAY | C-MYC pathway |
| 0.1 | 0.5 | PID GLYPICAN 1PATHWAY | Glypican 1 network |
| 0.0 | 2.3 | PID MAPK TRK PATHWAY | Trk receptor signaling mediated by the MAPK pathway |
| 0.0 | 1.4 | PID ARF6 DOWNSTREAM PATHWAY | Arf6 downstream pathway |
| 0.0 | 3.7 | PID CD8 TCR PATHWAY | TCR signaling in naïve CD8+ T cells |
| 0.0 | 3.9 | PID ERBB1 INTERNALIZATION PATHWAY | Internalization of ErbB1 |
| 0.0 | 2.3 | PID BCR 5PATHWAY | BCR signaling pathway |
| 0.0 | 1.1 | PID PI3KCI PATHWAY | Class I PI3K signaling events |
| 0.0 | 2.0 | PID PI3K PLC TRK PATHWAY | Trk receptor signaling mediated by PI3K and PLC-gamma |
| 0.0 | 0.2 | PID LPA4 PATHWAY | LPA4-mediated signaling events |
| 0.0 | 1.9 | SIG CD40PATHWAYMAP | Genes related to CD40 signaling |
| 0.0 | 0.7 | PID FGF PATHWAY | FGF signaling pathway |
| 0.0 | 0.9 | PID SYNDECAN 3 PATHWAY | Syndecan-3-mediated signaling events |
| 0.0 | 1.2 | PID NFKAPPAB CANONICAL PATHWAY | Canonical NF-kappaB pathway |
| 0.0 | 0.3 | PID LYMPH ANGIOGENESIS PATHWAY | VEGFR3 signaling in lymphatic endothelium |
| 0.0 | 1.9 | PID HIV NEF PATHWAY | HIV-1 Nef: Negative effector of Fas and TNF-alpha |
| 0.0 | 4.0 | PID RHOA REG PATHWAY | Regulation of RhoA activity |
| 0.0 | 1.6 | PID KIT PATHWAY | Signaling events mediated by Stem cell factor receptor (c-Kit) |
| 0.0 | 2.1 | PID ATR PATHWAY | ATR signaling pathway |
| 0.0 | 0.7 | PID P38 ALPHA BETA PATHWAY | Regulation of p38-alpha and p38-beta |
| 0.0 | 0.4 | PID IL8 CXCR1 PATHWAY | IL8- and CXCR1-mediated signaling events |
| 0.0 | 0.5 | PID IL2 PI3K PATHWAY | IL2 signaling events mediated by PI3K |
| 0.0 | 0.6 | PID INTEGRIN5 PATHWAY | Beta5 beta6 beta7 and beta8 integrin cell surface interactions |
| 0.0 | 0.6 | PID ERBB2 ERBB3 PATHWAY | ErbB2/ErbB3 signaling events |
| 0.0 | 0.8 | PID IL2 STAT5 PATHWAY | IL2 signaling events mediated by STAT5 |
| 0.0 | 0.2 | PID SHP2 PATHWAY | SHP2 signaling |
| 0.0 | 0.5 | PID TOLL ENDOGENOUS PATHWAY | Endogenous TLR signaling |
| 0.0 | 0.2 | PID PDGFRA PATHWAY | PDGFR-alpha signaling pathway |
| 0.0 | 0.2 | PID HDAC CLASSII PATHWAY | Signaling events mediated by HDAC Class II |
| 0.0 | 0.1 | ST JAK STAT PATHWAY | Jak-STAT Pathway |
| 0.0 | 0.9 | PID LYSOPHOSPHOLIPID PATHWAY | LPA receptor mediated events |
| 0.0 | 0.6 | PID FAK PATHWAY | Signaling events mediated by focal adhesion kinase |
| 0.0 | 0.2 | PID IL3 PATHWAY | IL3-mediated signaling events |
| 0.0 | 0.2 | ST DIFFERENTIATION PATHWAY IN PC12 CELLS | Differentiation Pathway in PC12 Cells; this is a specific case of PAC1 Receptor Pathway. |
| 0.0 | 0.5 | PID NCADHERIN PATHWAY | N-cadherin signaling events |
| 0.0 | 0.2 | SA REG CASCADE OF CYCLIN EXPR | Expression of cyclins regulates progression through the cell cycle by activating cyclin-dependent kinases. |
| 0.0 | 1.4 | PID CMYB PATHWAY | C-MYB transcription factor network |
| 0.0 | 0.7 | PID PLK1 PATHWAY | PLK1 signaling events |
| 0.0 | 0.7 | PID TAP63 PATHWAY | Validated transcriptional targets of TAp63 isoforms |
Gene overrepresentation in curated gene sets: REACTOME pathways category:
| Log-likelihood per target | Total log-likelihood | Term | Description |
|---|---|---|---|
| 0.3 | 0.3 | REACTOME CLASS A1 RHODOPSIN LIKE RECEPTORS | Genes involved in Class A/1 (Rhodopsin-like receptors) |
| 0.3 | 9.5 | REACTOME DOPAMINE NEUROTRANSMITTER RELEASE CYCLE | Genes involved in Dopamine Neurotransmitter Release Cycle |
| 0.2 | 4.6 | REACTOME METABOLISM OF POLYAMINES | Genes involved in Metabolism of polyamines |
| 0.2 | 3.2 | REACTOME REGULATION OF INSULIN SECRETION BY ACETYLCHOLINE | Genes involved in Regulation of Insulin Secretion by Acetylcholine |
| 0.2 | 4.9 | REACTOME PROTEOLYTIC CLEAVAGE OF SNARE COMPLEX PROTEINS | Genes involved in Proteolytic cleavage of SNARE complex proteins |
| 0.2 | 0.8 | REACTOME ADP SIGNALLING THROUGH P2RY1 | Genes involved in ADP signalling through P2Y purinoceptor 1 |
| 0.2 | 7.9 | REACTOME AMYLOIDS | Genes involved in Amyloids |
| 0.2 | 1.8 | REACTOME APOBEC3G MEDIATED RESISTANCE TO HIV1 INFECTION | Genes involved in APOBEC3G mediated resistance to HIV-1 infection |
| 0.2 | 4.2 | REACTOME CLASS C 3 METABOTROPIC GLUTAMATE PHEROMONE RECEPTORS | Genes involved in Class C/3 (Metabotropic glutamate/pheromone receptors) |
| 0.2 | 0.6 | REACTOME BINDING AND ENTRY OF HIV VIRION | Genes involved in Binding and entry of HIV virion |
| 0.1 | 2.9 | REACTOME PLATELET ADHESION TO EXPOSED COLLAGEN | Genes involved in Platelet Adhesion to exposed collagen |
| 0.1 | 5.8 | REACTOME GABA A RECEPTOR ACTIVATION | Genes involved in GABA A receptor activation |
| 0.1 | 1.8 | REACTOME CDC6 ASSOCIATION WITH THE ORC ORIGIN COMPLEX | Genes involved in CDC6 association with the ORC:origin complex |
| 0.1 | 6.6 | REACTOME EGFR DOWNREGULATION | Genes involved in EGFR downregulation |
| 0.1 | 1.8 | REACTOME GLUTAMATE NEUROTRANSMITTER RELEASE CYCLE | Genes involved in Glutamate Neurotransmitter Release Cycle |
| 0.1 | 1.6 | REACTOME SYNTHESIS OF BILE ACIDS AND BILE SALTS VIA 24 HYDROXYCHOLESTEROL | Genes involved in Synthesis of bile acids and bile salts via 24-hydroxycholesterol |
| 0.1 | 7.8 | REACTOME DARPP 32 EVENTS | Genes involved in DARPP-32 events |
| 0.1 | 2.7 | REACTOME ABCA TRANSPORTERS IN LIPID HOMEOSTASIS | Genes involved in ABCA transporters in lipid homeostasis |
| 0.1 | 2.6 | REACTOME GABA SYNTHESIS RELEASE REUPTAKE AND DEGRADATION | Genes involved in GABA synthesis, release, reuptake and degradation |
| 0.1 | 0.6 | REACTOME ACTIVATION OF NF KAPPAB IN B CELLS | Genes involved in Activation of NF-kappaB in B Cells |
| 0.1 | 3.7 | REACTOME ERK MAPK TARGETS | Genes involved in ERK/MAPK targets |
| 0.1 | 2.2 | REACTOME RAP1 SIGNALLING | Genes involved in Rap1 signalling |
| 0.1 | 5.3 | REACTOME NEGATIVE REGULATORS OF RIG I MDA5 SIGNALING | Genes involved in Negative regulators of RIG-I/MDA5 signaling |
| 0.1 | 2.5 | REACTOME SEMA3A PAK DEPENDENT AXON REPULSION | Genes involved in Sema3A PAK dependent Axon repulsion |
| 0.1 | 1.2 | REACTOME NEF MEDIATED DOWNREGULATION OF MHC CLASS I COMPLEX CELL SURFACE EXPRESSION | Genes involved in Nef mediated downregulation of MHC class I complex cell surface expression |
| 0.1 | 1.7 | REACTOME INHIBITION OF VOLTAGE GATED CA2 CHANNELS VIA GBETA GAMMA SUBUNITS | Genes involved in Inhibition of voltage gated Ca2+ channels via Gbeta/gamma subunits |
| 0.1 | 3.6 | REACTOME INTERACTION BETWEEN L1 AND ANKYRINS | Genes involved in Interaction between L1 and Ankyrins |
| 0.1 | 0.2 | REACTOME PRE NOTCH TRANSCRIPTION AND TRANSLATION | Genes involved in Pre-NOTCH Transcription and Translation |
| 0.1 | 0.3 | REACTOME CA DEPENDENT EVENTS | Genes involved in Ca-dependent events |
| 0.1 | 1.0 | REACTOME SYNTHESIS OF PIPS AT THE LATE ENDOSOME MEMBRANE | Genes involved in Synthesis of PIPs at the late endosome membrane |
| 0.1 | 0.9 | REACTOME CRMPS IN SEMA3A SIGNALING | Genes involved in CRMPs in Sema3A signaling |
| 0.1 | 3.2 | REACTOME INHIBITION OF INSULIN SECRETION BY ADRENALINE NORADRENALINE | Genes involved in Inhibition of Insulin Secretion by Adrenaline/Noradrenaline |
| 0.1 | 2.2 | REACTOME CHOLESTEROL BIOSYNTHESIS | Genes involved in Cholesterol biosynthesis |
| 0.1 | 1.5 | REACTOME FACILITATIVE NA INDEPENDENT GLUCOSE TRANSPORTERS | Genes involved in Facilitative Na+-independent glucose transporters |
| 0.0 | 1.3 | REACTOME CYTOSOLIC SULFONATION OF SMALL MOLECULES | Genes involved in Cytosolic sulfonation of small molecules |
| 0.0 | 3.7 | REACTOME VOLTAGE GATED POTASSIUM CHANNELS | Genes involved in Voltage gated Potassium channels |
| 0.0 | 1.3 | REACTOME REGULATION OF IFNG SIGNALING | Genes involved in Regulation of IFNG signaling |
| 0.0 | 1.4 | REACTOME TRAFFICKING OF GLUR2 CONTAINING AMPA RECEPTORS | Genes involved in Trafficking of GluR2-containing AMPA receptors |
| 0.0 | 0.8 | REACTOME TRAFFICKING OF AMPA RECEPTORS | Genes involved in Trafficking of AMPA receptors |
| 0.0 | 0.8 | REACTOME ROLE OF DCC IN REGULATING APOPTOSIS | Genes involved in Role of DCC in regulating apoptosis |
| 0.0 | 4.7 | REACTOME REGULATION OF INSULIN SECRETION | Genes involved in Regulation of Insulin Secretion |
| 0.0 | 1.8 | REACTOME SYNTHESIS OF VERY LONG CHAIN FATTY ACYL COAS | Genes involved in Synthesis of very long-chain fatty acyl-CoAs |
| 0.0 | 2.7 | REACTOME POTASSIUM CHANNELS | Genes involved in Potassium Channels |
| 0.0 | 4.7 | REACTOME NRAGE SIGNALS DEATH THROUGH JNK | Genes involved in NRAGE signals death through JNK |
| 0.0 | 0.9 | REACTOME CHYLOMICRON MEDIATED LIPID TRANSPORT | Genes involved in Chylomicron-mediated lipid transport |
| 0.0 | 1.0 | REACTOME PURINE SALVAGE | Genes involved in Purine salvage |
| 0.0 | 0.2 | REACTOME ROLE OF SECOND MESSENGERS IN NETRIN1 SIGNALING | Genes involved in Role of second messengers in netrin-1 signaling |
| 0.0 | 0.3 | REACTOME TRAF6 MEDIATED IRF7 ACTIVATION IN TLR7 8 OR 9 SIGNALING | Genes involved in TRAF6 mediated IRF7 activation in TLR7/8 or 9 signaling |
| 0.0 | 0.9 | REACTOME PREFOLDIN MEDIATED TRANSFER OF SUBSTRATE TO CCT TRIC | Genes involved in Prefoldin mediated transfer of substrate to CCT/TriC |
| 0.0 | 1.8 | REACTOME ASSOCIATION OF TRIC CCT WITH TARGET PROTEINS DURING BIOSYNTHESIS | Genes involved in Association of TriC/CCT with target proteins during biosynthesis |
| 0.0 | 0.9 | REACTOME OTHER SEMAPHORIN INTERACTIONS | Genes involved in Other semaphorin interactions |
| 0.0 | 3.2 | REACTOME INTERFERON ALPHA BETA SIGNALING | Genes involved in Interferon alpha/beta signaling |
| 0.0 | 0.5 | REACTOME ANDROGEN BIOSYNTHESIS | Genes involved in Androgen biosynthesis |
| 0.0 | 0.8 | REACTOME NA CL DEPENDENT NEUROTRANSMITTER TRANSPORTERS | Genes involved in Na+/Cl- dependent neurotransmitter transporters |
| 0.0 | 5.5 | REACTOME SIGNALING BY RHO GTPASES | Genes involved in Signaling by Rho GTPases |
| 0.0 | 0.5 | REACTOME CELL DEATH SIGNALLING VIA NRAGE NRIF AND NADE | Genes involved in Cell death signalling via NRAGE, NRIF and NADE |
| 0.0 | 0.4 | REACTOME SEROTONIN RECEPTORS | Genes involved in Serotonin receptors |
| 0.0 | 0.9 | REACTOME NUCLEOTIDE LIKE PURINERGIC RECEPTORS | Genes involved in Nucleotide-like (purinergic) receptors |
| 0.0 | 0.5 | REACTOME ADVANCED GLYCOSYLATION ENDPRODUCT RECEPTOR SIGNALING | Genes involved in Advanced glycosylation endproduct receptor signaling |
| 0.0 | 1.1 | REACTOME FORMATION OF FIBRIN CLOT CLOTTING CASCADE | Genes involved in Formation of Fibrin Clot (Clotting Cascade) |
| 0.0 | 0.8 | REACTOME ACTIVATION OF KAINATE RECEPTORS UPON GLUTAMATE BINDING | Genes involved in Activation of Kainate Receptors upon glutamate binding |
| 0.0 | 0.7 | REACTOME PROCESSING OF INTRONLESS PRE MRNAS | Genes involved in Processing of Intronless Pre-mRNAs |
| 0.0 | 0.8 | REACTOME METABOLISM OF PORPHYRINS | Genes involved in Metabolism of porphyrins |
| 0.0 | 3.8 | REACTOME MRNA SPLICING | Genes involved in mRNA Splicing |
| 0.0 | 1.0 | REACTOME CHONDROITIN SULFATE BIOSYNTHESIS | Genes involved in Chondroitin sulfate biosynthesis |
| 0.0 | 0.7 | REACTOME JNK C JUN KINASES PHOSPHORYLATION AND ACTIVATION MEDIATED BY ACTIVATED HUMAN TAK1 | Genes involved in JNK (c-Jun kinases) phosphorylation and activation mediated by activated human TAK1 |
| 0.0 | 1.2 | REACTOME SIGNALING BY ROBO RECEPTOR | Genes involved in Signaling by Robo receptor |
| 0.0 | 0.7 | REACTOME UNBLOCKING OF NMDA RECEPTOR GLUTAMATE BINDING AND ACTIVATION | Genes involved in Unblocking of NMDA receptor, glutamate binding and activation |
| 0.0 | 0.7 | REACTOME ACYL CHAIN REMODELLING OF PC | Genes involved in Acyl chain remodelling of PC |
| 0.0 | 0.2 | REACTOME FATTY ACYL COA BIOSYNTHESIS | Genes involved in Fatty Acyl-CoA Biosynthesis |
| 0.0 | 0.6 | REACTOME PEROXISOMAL LIPID METABOLISM | Genes involved in Peroxisomal lipid metabolism |
| 0.0 | 0.3 | REACTOME REGULATION OF GENE EXPRESSION IN BETA CELLS | Genes involved in Regulation of gene expression in beta cells |
| 0.0 | 1.1 | REACTOME ADHERENS JUNCTIONS INTERACTIONS | Genes involved in Adherens junctions interactions |
| 0.0 | 0.6 | REACTOME ENDOSOMAL SORTING COMPLEX REQUIRED FOR TRANSPORT ESCRT | Genes involved in Endosomal Sorting Complex Required For Transport (ESCRT) |
| 0.0 | 0.7 | REACTOME SIGNALING BY BMP | Genes involved in Signaling by BMP |
| 0.0 | 0.2 | REACTOME ER PHAGOSOME PATHWAY | Genes involved in ER-Phagosome pathway |
| 0.0 | 0.7 | REACTOME RNA POL I TRANSCRIPTION | Genes involved in RNA Polymerase I Transcription |
| 0.0 | 0.6 | REACTOME AMINE LIGAND BINDING RECEPTORS | Genes involved in Amine ligand-binding receptors |
| 0.0 | 0.8 | REACTOME DEADENYLATION OF MRNA | Genes involved in Deadenylation of mRNA |
| 0.0 | 1.0 | REACTOME CYTOCHROME P450 ARRANGED BY SUBSTRATE TYPE | Genes involved in Cytochrome P450 - arranged by substrate type |
| 0.0 | 0.2 | REACTOME RETROGRADE NEUROTROPHIN SIGNALLING | Genes involved in Retrograde neurotrophin signalling |
| 0.0 | 0.3 | REACTOME PYRIMIDINE CATABOLISM | Genes involved in Pyrimidine catabolism |
| 0.0 | 0.4 | REACTOME SYNTHESIS OF PA | Genes involved in Synthesis of PA |
| 0.0 | 0.2 | REACTOME PACKAGING OF TELOMERE ENDS | Genes involved in Packaging Of Telomere Ends |
| 0.0 | 0.4 | REACTOME A TETRASACCHARIDE LINKER SEQUENCE IS REQUIRED FOR GAG SYNTHESIS | Genes involved in A tetrasaccharide linker sequence is required for GAG synthesis |
| 0.0 | 0.3 | REACTOME RNA POL III TRANSCRIPTION INITIATION FROM TYPE 3 PROMOTER | Genes involved in RNA Polymerase III Transcription Initiation From Type 3 Promoter |
| 0.0 | 0.7 | REACTOME DOWNSTREAM TCR SIGNALING | Genes involved in Downstream TCR signaling |
| 0.0 | 0.3 | REACTOME MRNA DECAY BY 5 TO 3 EXORIBONUCLEASE | Genes involved in mRNA Decay by 5' to 3' Exoribonuclease |
| 0.0 | 0.2 | REACTOME HDL MEDIATED LIPID TRANSPORT | Genes involved in HDL-mediated lipid transport |
| 0.0 | 0.9 | REACTOME NUCLEAR SIGNALING BY ERBB4 | Genes involved in Nuclear signaling by ERBB4 |
| 0.0 | 0.1 | REACTOME P53 INDEPENDENT G1 S DNA DAMAGE CHECKPOINT | Genes involved in p53-Independent G1/S DNA damage checkpoint |
| 0.0 | 0.3 | REACTOME TRANSLATION | Genes involved in Translation |
| 0.0 | 0.3 | REACTOME P75 NTR RECEPTOR MEDIATED SIGNALLING | Genes involved in p75 NTR receptor-mediated signalling |