Project
Illumina Body Map 2 (GSE30611)
Navigation
Downloads
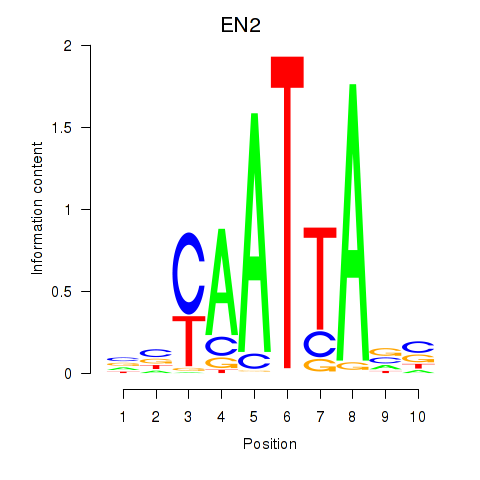
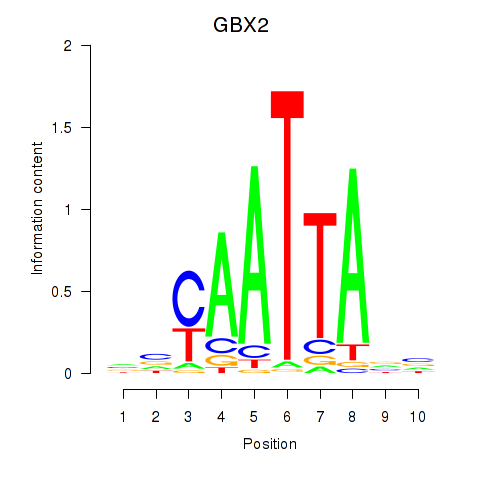
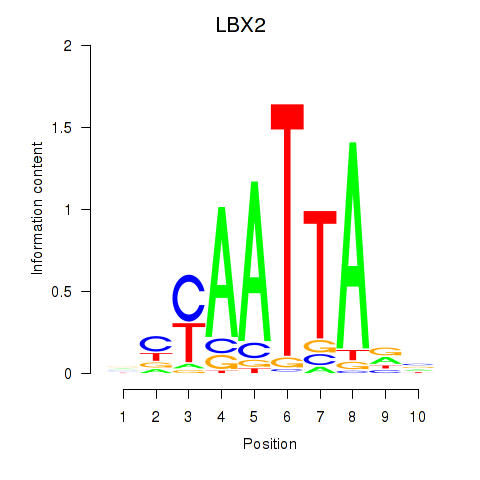
Results for EN2_GBX2_LBX2
Z-value: 0.66
Motif logo
Transcription factors associated with EN2_GBX2_LBX2
| Gene Symbol | Gene ID | Gene Info |
|---|---|---|
|
EN2
|
ENSG00000164778.4 | engrailed homeobox 2 |
|
GBX2
|
ENSG00000168505.7 | gastrulation brain homeobox 2 |
|
LBX2
|
ENSG00000179528.16 | ladybird homeobox 2 |
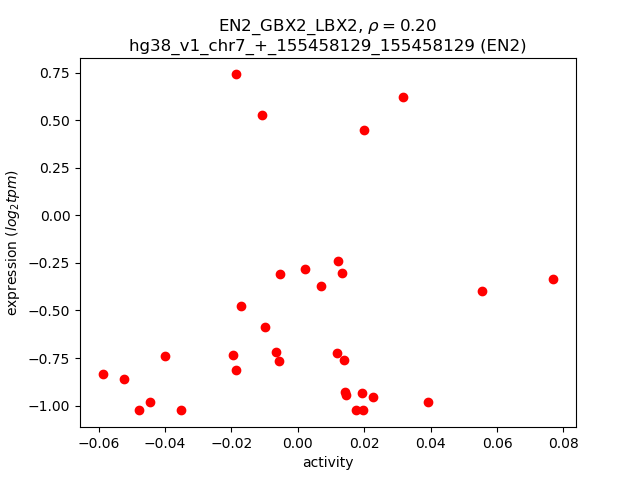
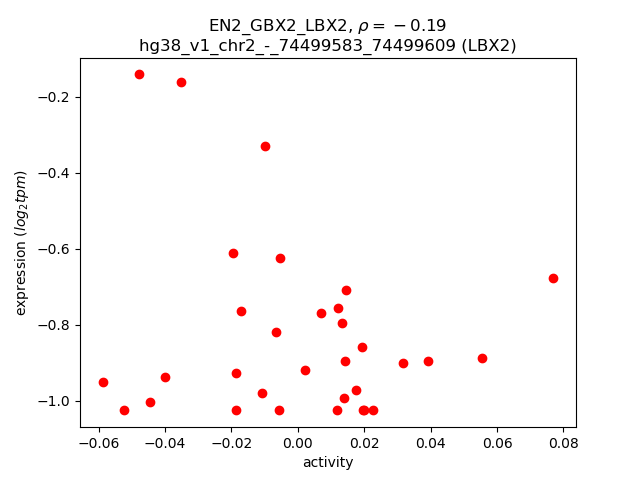
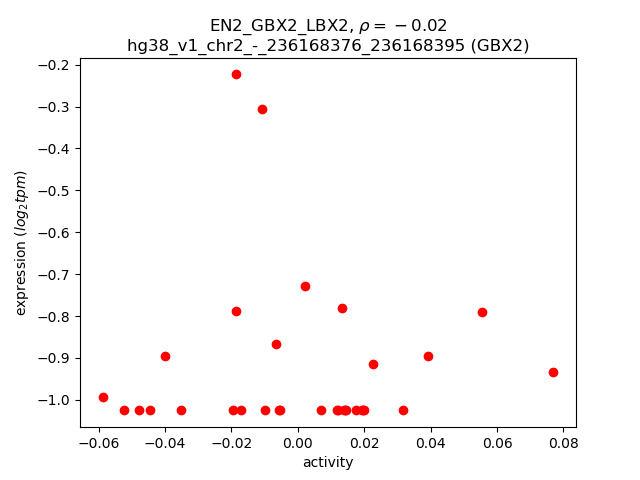
Activity-expression correlation:
| Gene | Promoter | Pearson corr. coef. | P-value | Plot |
|---|---|---|---|---|
| EN2 | hg38_v1_chr7_+_155458129_155458129 | 0.20 | 2.8e-01 | Click! |
| LBX2 | hg38_v1_chr2_-_74499583_74499609 | -0.19 | 2.9e-01 | Click! |
| GBX2 | hg38_v1_chr2_-_236168376_236168395 | -0.02 | 9.2e-01 | Click! |
Activity profile of EN2_GBX2_LBX2 motif
Sorted Z-values of EN2_GBX2_LBX2 motif
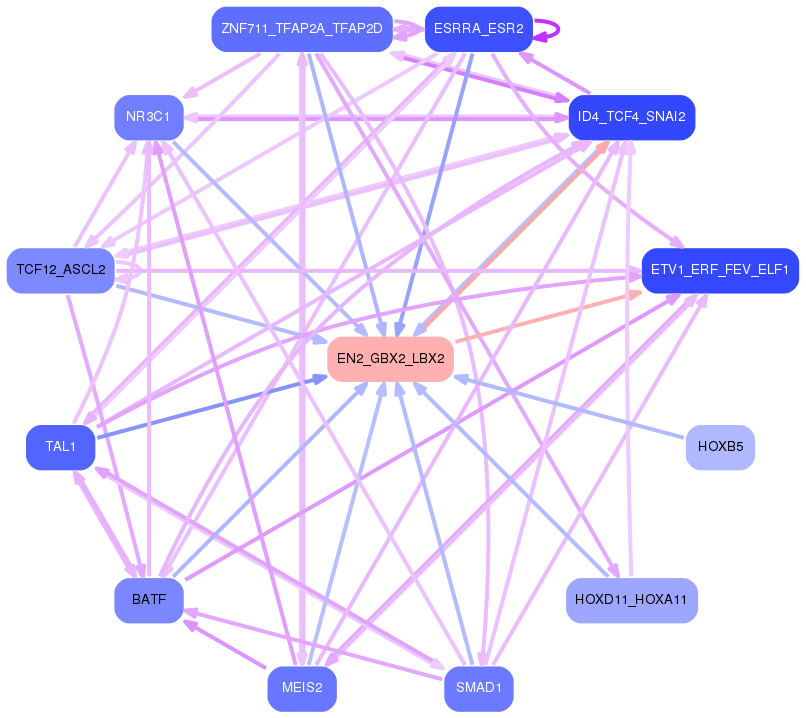
Network of associatons between targets according to the STRING database.

First level regulatory network of EN2_GBX2_LBX2
Gene Ontology Analysis
Gene overrepresentation in biological process category:
| Log-likelihood per target | Total log-likelihood | Term | Description |
|---|---|---|---|
| 0.5 | 2.5 | GO:0015855 | pyrimidine nucleobase transport(GO:0015855) purine nucleobase transmembrane transport(GO:1904823) |
| 0.4 | 1.2 | GO:0071139 | resolution of recombination intermediates(GO:0071139) resolution of mitotic recombination intermediates(GO:0071140) |
| 0.4 | 2.8 | GO:1903435 | positive regulation of constitutive secretory pathway(GO:1903435) |
| 0.3 | 0.9 | GO:0002416 | IgG immunoglobulin transcytosis in epithelial cells mediated by FcRn immunoglobulin receptor(GO:0002416) |
| 0.2 | 0.2 | GO:0061346 | non-canonical Wnt signaling pathway involved in heart development(GO:0061341) planar cell polarity pathway involved in heart morphogenesis(GO:0061346) |
| 0.2 | 0.9 | GO:0042663 | regulation of endodermal cell fate specification(GO:0042663) |
| 0.2 | 0.6 | GO:0070426 | positive regulation of nucleotide-binding oligomerization domain containing signaling pathway(GO:0070426) positive regulation of nucleotide-binding oligomerization domain containing 2 signaling pathway(GO:0070434) |
| 0.1 | 0.4 | GO:0014034 | neural crest cell fate commitment(GO:0014034) |
| 0.1 | 0.4 | GO:1903774 | positive regulation of viral budding via host ESCRT complex(GO:1903774) |
| 0.1 | 0.5 | GO:0036367 | adaptation of rhodopsin mediated signaling(GO:0016062) light adaption(GO:0036367) |
| 0.1 | 1.7 | GO:0048245 | eosinophil chemotaxis(GO:0048245) |
| 0.1 | 0.3 | GO:0002302 | CD8-positive, alpha-beta T cell differentiation involved in immune response(GO:0002302) |
| 0.1 | 0.3 | GO:0090271 | positive regulation of fibroblast growth factor production(GO:0090271) |
| 0.1 | 0.4 | GO:0061055 | myotome development(GO:0061055) |
| 0.1 | 0.4 | GO:0090290 | positive regulation of osteoclast proliferation(GO:0090290) |
| 0.1 | 0.3 | GO:0021986 | epithalamus development(GO:0021538) habenula development(GO:0021986) |
| 0.1 | 0.6 | GO:1904694 | negative regulation of vascular smooth muscle contraction(GO:1904694) |
| 0.1 | 0.5 | GO:0048050 | post-embryonic eye morphogenesis(GO:0048050) |
| 0.1 | 0.6 | GO:0051987 | positive regulation of attachment of spindle microtubules to kinetochore(GO:0051987) |
| 0.1 | 1.0 | GO:0043249 | erythrocyte maturation(GO:0043249) |
| 0.1 | 1.1 | GO:0070389 | chaperone cofactor-dependent protein refolding(GO:0070389) |
| 0.1 | 0.4 | GO:0061743 | motor learning(GO:0061743) |
| 0.1 | 0.7 | GO:0051344 | negative regulation of cyclic-nucleotide phosphodiesterase activity(GO:0051344) |
| 0.0 | 0.3 | GO:0044245 | polysaccharide digestion(GO:0044245) |
| 0.0 | 0.2 | GO:0060928 | cardiac septum cell differentiation(GO:0003292) atrioventricular node cell differentiation(GO:0060922) atrioventricular node cell development(GO:0060928) |
| 0.0 | 0.3 | GO:1904862 | inhibitory synapse assembly(GO:1904862) |
| 0.0 | 0.3 | GO:0044828 | negative regulation by host of viral genome replication(GO:0044828) |
| 0.0 | 0.1 | GO:0090108 | positive regulation of high-density lipoprotein particle assembly(GO:0090108) positive regulation of secretion of lysosomal enzymes(GO:0090340) |
| 0.0 | 0.3 | GO:0034959 | substance P catabolic process(GO:0010814) calcitonin catabolic process(GO:0010816) endothelin maturation(GO:0034959) |
| 0.0 | 0.3 | GO:0021816 | extension of a leading process involved in cell motility in cerebral cortex radial glia guided migration(GO:0021816) |
| 0.0 | 0.4 | GO:0050957 | equilibrioception(GO:0050957) |
| 0.0 | 0.9 | GO:0001829 | trophectodermal cell differentiation(GO:0001829) |
| 0.0 | 0.9 | GO:2000353 | positive regulation of endothelial cell apoptotic process(GO:2000353) |
| 0.0 | 0.3 | GO:0097026 | dendritic cell dendrite assembly(GO:0097026) |
| 0.0 | 0.6 | GO:0019532 | oxalate transport(GO:0019532) |
| 0.0 | 0.4 | GO:0098582 | innate vocalization behavior(GO:0098582) |
| 0.0 | 0.1 | GO:1990637 | response to prolactin(GO:1990637) |
| 0.0 | 0.5 | GO:0045654 | positive regulation of megakaryocyte differentiation(GO:0045654) |
| 0.0 | 0.2 | GO:0070378 | regulation of ERK5 cascade(GO:0070376) positive regulation of ERK5 cascade(GO:0070378) |
| 0.0 | 0.2 | GO:0032468 | Golgi calcium ion homeostasis(GO:0032468) |
| 0.0 | 0.1 | GO:0061394 | regulation of transcription from RNA polymerase II promoter in response to arsenic-containing substance(GO:0061394) |
| 0.0 | 1.0 | GO:0032012 | regulation of ARF protein signal transduction(GO:0032012) |
| 0.0 | 0.1 | GO:0035513 | oxidative RNA demethylation(GO:0035513) oxidative single-stranded RNA demethylation(GO:0035553) |
| 0.0 | 0.2 | GO:0015811 | L-cystine transport(GO:0015811) |
| 0.0 | 0.7 | GO:0050860 | negative regulation of T cell receptor signaling pathway(GO:0050860) |
| 0.0 | 0.3 | GO:0032876 | negative regulation of DNA endoreduplication(GO:0032876) |
| 0.0 | 0.3 | GO:0071578 | zinc II ion transmembrane import(GO:0071578) |
| 0.0 | 0.2 | GO:2000580 | nuclear migration along microfilament(GO:0031022) regulation of ATP-dependent microtubule motor activity, plus-end-directed(GO:2000580) positive regulation of ATP-dependent microtubule motor activity, plus-end-directed(GO:2000582) |
| 0.0 | 0.2 | GO:2000324 | positive regulation of glucocorticoid receptor signaling pathway(GO:2000324) |
| 0.0 | 0.1 | GO:0016198 | axon choice point recognition(GO:0016198) |
| 0.0 | 0.5 | GO:0042789 | mRNA transcription from RNA polymerase II promoter(GO:0042789) |
| 0.0 | 3.7 | GO:0007156 | homophilic cell adhesion via plasma membrane adhesion molecules(GO:0007156) |
| 0.0 | 0.5 | GO:2001224 | positive regulation of neuron migration(GO:2001224) |
| 0.0 | 0.4 | GO:0030277 | maintenance of gastrointestinal epithelium(GO:0030277) |
| 0.0 | 0.2 | GO:0001731 | formation of translation preinitiation complex(GO:0001731) |
| 0.0 | 0.4 | GO:0002230 | positive regulation of defense response to virus by host(GO:0002230) |
| 0.0 | 0.3 | GO:0030150 | protein import into mitochondrial matrix(GO:0030150) |
| 0.0 | 0.3 | GO:0032486 | Rap protein signal transduction(GO:0032486) |
| 0.0 | 0.1 | GO:0021780 | oligodendrocyte cell fate specification(GO:0021778) oligodendrocyte cell fate commitment(GO:0021779) glial cell fate specification(GO:0021780) |
| 0.0 | 0.1 | GO:1902174 | positive regulation of keratinocyte apoptotic process(GO:1902174) |
| 0.0 | 0.3 | GO:0007064 | mitotic sister chromatid cohesion(GO:0007064) |
| 0.0 | 0.1 | GO:0035948 | positive regulation of gluconeogenesis by positive regulation of transcription from RNA polymerase II promoter(GO:0035948) |
| 0.0 | 0.2 | GO:0051988 | regulation of attachment of spindle microtubules to kinetochore(GO:0051988) |
| 0.0 | 0.1 | GO:0015801 | aromatic amino acid transport(GO:0015801) |
| 0.0 | 0.2 | GO:0006228 | UTP biosynthetic process(GO:0006228) |
| 0.0 | 0.2 | GO:0007221 | positive regulation of transcription of Notch receptor target(GO:0007221) |
Gene overrepresentation in cellular component category:
| Log-likelihood per target | Total log-likelihood | Term | Description |
|---|---|---|---|
| 0.2 | 4.0 | GO:0033093 | Weibel-Palade body(GO:0033093) |
| 0.2 | 1.2 | GO:0033063 | Rad51B-Rad51C-Rad51D-XRCC2 complex(GO:0033063) |
| 0.1 | 0.7 | GO:0034751 | aryl hydrocarbon receptor complex(GO:0034751) |
| 0.1 | 0.3 | GO:0002945 | cyclin K-CDK13 complex(GO:0002945) |
| 0.1 | 0.2 | GO:0060187 | cell pole(GO:0060187) |
| 0.1 | 1.7 | GO:0031045 | dense core granule(GO:0031045) |
| 0.0 | 1.0 | GO:0033276 | transcription factor TFTC complex(GO:0033276) |
| 0.0 | 0.6 | GO:0001673 | male germ cell nucleus(GO:0001673) |
| 0.0 | 0.1 | GO:1990617 | CHOP-ATF4 complex(GO:1990617) |
| 0.0 | 0.3 | GO:0005742 | mitochondrial outer membrane translocase complex(GO:0005742) |
| 0.0 | 0.6 | GO:0042622 | photoreceptor outer segment membrane(GO:0042622) |
| 0.0 | 0.2 | GO:0097149 | centralspindlin complex(GO:0097149) |
| 0.0 | 0.2 | GO:0097452 | GAIT complex(GO:0097452) |
| 0.0 | 0.5 | GO:0001527 | microfibril(GO:0001527) fibril(GO:0043205) |
| 0.0 | 0.4 | GO:0090543 | ESCRT III complex(GO:0000815) Flemming body(GO:0090543) |
| 0.0 | 0.6 | GO:1990023 | mitotic spindle midzone(GO:1990023) |
| 0.0 | 0.2 | GO:0002193 | MAML1-RBP-Jkappa- ICN1 complex(GO:0002193) |
| 0.0 | 0.3 | GO:0060077 | inhibitory synapse(GO:0060077) |
| 0.0 | 0.6 | GO:0071565 | nBAF complex(GO:0071565) |
| 0.0 | 0.1 | GO:0032584 | growth cone membrane(GO:0032584) |
| 0.0 | 0.1 | GO:0031523 | Myb complex(GO:0031523) |
| 0.0 | 0.1 | GO:0098554 | cytoplasmic side of endoplasmic reticulum membrane(GO:0098554) |
| 0.0 | 1.0 | GO:0032420 | stereocilium(GO:0032420) |
Gene overrepresentation in molecular function category:
| Log-likelihood per target | Total log-likelihood | Term | Description |
|---|---|---|---|
| 0.5 | 2.5 | GO:0005350 | pyrimidine nucleobase transmembrane transporter activity(GO:0005350) |
| 0.3 | 0.9 | GO:0005174 | CD40 receptor binding(GO:0005174) |
| 0.2 | 0.9 | GO:0019770 | IgG receptor activity(GO:0019770) |
| 0.1 | 0.5 | GO:0044378 | non-sequence-specific DNA binding, bending(GO:0044378) |
| 0.1 | 0.3 | GO:0004574 | oligo-1,6-glucosidase activity(GO:0004574) |
| 0.1 | 1.2 | GO:0008821 | crossover junction endodeoxyribonuclease activity(GO:0008821) |
| 0.1 | 2.8 | GO:0031489 | myosin V binding(GO:0031489) |
| 0.1 | 0.5 | GO:0034597 | phosphatidylinositol-3,4-bisphosphate 4-phosphatase activity(GO:0016316) inositol-1,3,4-trisphosphate 4-phosphatase activity(GO:0017161) phosphatidylinositol-4,5-bisphosphate 4-phosphatase activity(GO:0034597) inositol-3,4-bisphosphate 4-phosphatase activity(GO:0052828) |
| 0.1 | 1.6 | GO:0017162 | aryl hydrocarbon receptor binding(GO:0017162) |
| 0.1 | 0.4 | GO:0030197 | extracellular matrix constituent, lubricant activity(GO:0030197) |
| 0.1 | 0.6 | GO:0055131 | C3HC4-type RING finger domain binding(GO:0055131) |
| 0.0 | 0.9 | GO:0017017 | MAP kinase tyrosine/serine/threonine phosphatase activity(GO:0017017) |
| 0.0 | 0.1 | GO:0001133 | RNA polymerase II transcription factor activity, sequence-specific transcription regulatory region DNA binding(GO:0001133) |
| 0.0 | 3.2 | GO:0005547 | phosphatidylinositol-3,4,5-trisphosphate binding(GO:0005547) |
| 0.0 | 0.2 | GO:0017099 | very-long-chain-acyl-CoA dehydrogenase activity(GO:0017099) |
| 0.0 | 0.1 | GO:0015173 | aromatic amino acid transmembrane transporter activity(GO:0015173) |
| 0.0 | 1.7 | GO:0042056 | chemoattractant activity(GO:0042056) |
| 0.0 | 0.6 | GO:0019531 | oxalate transmembrane transporter activity(GO:0019531) |
| 0.0 | 0.9 | GO:0001087 | transcription factor activity, sequence-specific DNA binding, RNA polymerase recruiting(GO:0001011) transcription factor activity, TFIIB-class binding(GO:0001087) |
| 0.0 | 0.2 | GO:0030298 | receptor signaling protein tyrosine kinase activator activity(GO:0030298) |
| 0.0 | 0.3 | GO:0015288 | porin activity(GO:0015288) |
| 0.0 | 1.1 | GO:0001671 | ATPase activator activity(GO:0001671) |
| 0.0 | 1.0 | GO:0005086 | ARF guanyl-nucleotide exchange factor activity(GO:0005086) |
| 0.0 | 0.1 | GO:0035515 | oxidative RNA demethylase activity(GO:0035515) |
| 0.0 | 0.2 | GO:0015184 | L-alanine transmembrane transporter activity(GO:0015180) L-cystine transmembrane transporter activity(GO:0015184) L-glutamine transmembrane transporter activity(GO:0015186) alanine transmembrane transporter activity(GO:0022858) |
| 0.0 | 0.7 | GO:0005520 | insulin-like growth factor binding(GO:0005520) |
| 0.0 | 0.4 | GO:0048018 | receptor agonist activity(GO:0048018) |
| 0.0 | 0.1 | GO:0005223 | intracellular cGMP activated cation channel activity(GO:0005223) |
| 0.0 | 0.3 | GO:0008353 | RNA polymerase II carboxy-terminal domain kinase activity(GO:0008353) |
| 0.0 | 1.6 | GO:0048365 | Rac GTPase binding(GO:0048365) |
| 0.0 | 0.1 | GO:0005220 | inositol 1,4,5-trisphosphate-sensitive calcium-release channel activity(GO:0005220) |
| 0.0 | 0.1 | GO:0035727 | lysophosphatidic acid binding(GO:0035727) |
| 0.0 | 0.2 | GO:0003688 | DNA replication origin binding(GO:0003688) |
Gene overrepresentation in curated gene sets: canonical pathways category:
| Log-likelihood per target | Total log-likelihood | Term | Description |
|---|---|---|---|
| 0.0 | 0.1 | PID AR NONGENOMIC PATHWAY | Nongenotropic Androgen signaling |
| 0.0 | 2.8 | PID ARF6 PATHWAY | Arf6 signaling events |
| 0.0 | 1.2 | PID FANCONI PATHWAY | Fanconi anemia pathway |
| 0.0 | 0.9 | PID INTEGRIN2 PATHWAY | Beta2 integrin cell surface interactions |
| 0.0 | 1.1 | PID PI3KCI PATHWAY | Class I PI3K signaling events |
| 0.0 | 0.9 | ST ERK1 ERK2 MAPK PATHWAY | ERK1/ERK2 MAPK Pathway |
| 0.0 | 0.7 | PID IL2 STAT5 PATHWAY | IL2 signaling events mediated by STAT5 |
Gene overrepresentation in curated gene sets: REACTOME pathways category:
| Log-likelihood per target | Total log-likelihood | Term | Description |
|---|---|---|---|
| 0.1 | 2.5 | REACTOME PASSIVE TRANSPORT BY AQUAPORINS | Genes involved in Passive Transport by Aquaporins |
| 0.1 | 2.8 | REACTOME INSULIN SYNTHESIS AND PROCESSING | Genes involved in Insulin Synthesis and Processing |
| 0.0 | 0.8 | REACTOME PLATELET ADHESION TO EXPOSED COLLAGEN | Genes involved in Platelet Adhesion to exposed collagen |
| 0.0 | 0.9 | REACTOME ERKS ARE INACTIVATED | Genes involved in ERKs are inactivated |
| 0.0 | 0.5 | REACTOME APOPTOSIS INDUCED DNA FRAGMENTATION | Genes involved in Apoptosis induced DNA fragmentation |
| 0.0 | 0.3 | REACTOME DIGESTION OF DIETARY CARBOHYDRATE | Genes involved in Digestion of dietary carbohydrate |
| 0.0 | 0.5 | REACTOME SYNTHESIS OF PIPS AT THE EARLY ENDOSOME MEMBRANE | Genes involved in Synthesis of PIPs at the early endosome membrane |
| 0.0 | 1.0 | REACTOME RNA POL II TRANSCRIPTION PRE INITIATION AND PROMOTER OPENING | Genes involved in RNA Polymerase II Transcription Pre-Initiation And Promoter Opening |
| 0.0 | 0.3 | REACTOME ZINC TRANSPORTERS | Genes involved in Zinc transporters |
| 0.0 | 0.4 | REACTOME ENDOSOMAL SORTING COMPLEX REQUIRED FOR TRANSPORT ESCRT | Genes involved in Endosomal Sorting Complex Required For Transport (ESCRT) |