Project
Illumina Body Map 2 (GSE30611)
Navigation
Downloads
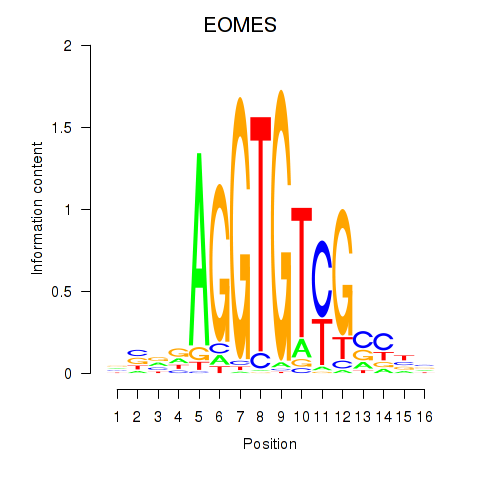
Results for EOMES
Z-value: 1.27
Motif logo
Transcription factors associated with EOMES
| Gene Symbol | Gene ID | Gene Info |
|---|---|---|
|
EOMES
|
ENSG00000163508.13 | eomesodermin |
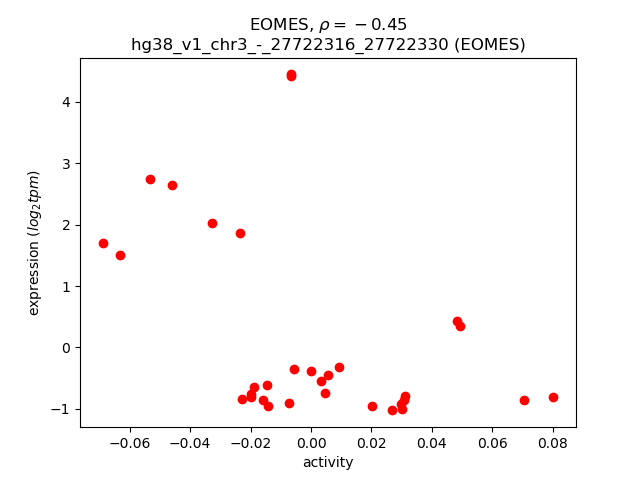
Activity-expression correlation:
| Gene | Promoter | Pearson corr. coef. | P-value | Plot |
|---|---|---|---|---|
| EOMES | hg38_v1_chr3_-_27722316_27722330 | -0.45 | 9.3e-03 | Click! |
Activity profile of EOMES motif
Sorted Z-values of EOMES motif
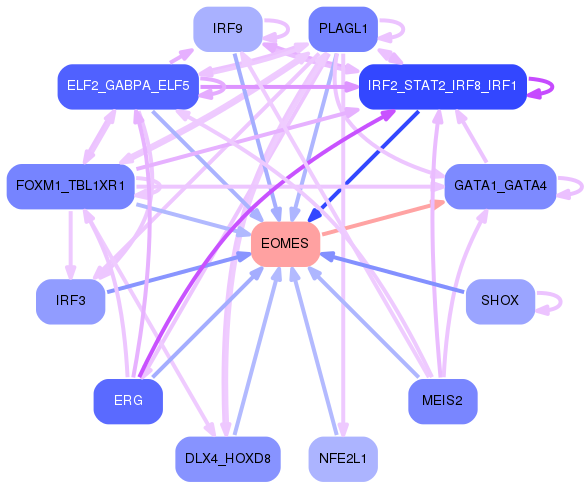
Network of associatons between targets according to the STRING database.

First level regulatory network of EOMES
Gene Ontology Analysis
Gene overrepresentation in biological process category:
| Log-likelihood per target | Total log-likelihood | Term | Description |
|---|---|---|---|
| 0.9 | 2.7 | GO:0006533 | fumarate metabolic process(GO:0006106) aspartate biosynthetic process(GO:0006532) aspartate catabolic process(GO:0006533) |
| 0.8 | 3.3 | GO:0035054 | atrial septum secundum morphogenesis(GO:0003290) embryonic heart tube anterior/posterior pattern specification(GO:0035054) |
| 0.5 | 2.0 | GO:0021784 | postganglionic parasympathetic fiber development(GO:0021784) |
| 0.5 | 1.8 | GO:0060262 | regulation of N-terminal protein palmitoylation(GO:0060254) negative regulation of N-terminal protein palmitoylation(GO:0060262) negative regulation of protein lipidation(GO:1903060) |
| 0.5 | 1.4 | GO:0070093 | negative regulation of glucagon secretion(GO:0070093) |
| 0.4 | 1.8 | GO:0097089 | methyl-branched fatty acid metabolic process(GO:0097089) |
| 0.4 | 2.0 | GO:0034334 | adherens junction maintenance(GO:0034334) maintenance of organ identity(GO:0048496) |
| 0.4 | 1.5 | GO:0071418 | cellular response to amine stimulus(GO:0071418) |
| 0.3 | 3.1 | GO:0007197 | adenylate cyclase-inhibiting G-protein coupled acetylcholine receptor signaling pathway(GO:0007197) |
| 0.3 | 1.3 | GO:1901842 | negative regulation of high voltage-gated calcium channel activity(GO:1901842) |
| 0.3 | 2.0 | GO:0044861 | protein transport into plasma membrane raft(GO:0044861) |
| 0.3 | 1.5 | GO:0035627 | ceramide transport(GO:0035627) |
| 0.3 | 0.8 | GO:0086021 | SA node cell to atrial cardiac muscle cell communication by electrical coupling(GO:0086021) |
| 0.3 | 1.1 | GO:1901143 | insulin catabolic process(GO:1901143) |
| 0.3 | 1.5 | GO:0015853 | adenine transport(GO:0015853) |
| 0.2 | 0.7 | GO:0071206 | establishment of protein localization to juxtaparanode region of axon(GO:0071206) |
| 0.2 | 1.0 | GO:0090149 | mitochondrial membrane fission(GO:0090149) |
| 0.2 | 0.7 | GO:0006391 | transcription initiation from mitochondrial promoter(GO:0006391) |
| 0.2 | 1.0 | GO:0098904 | regulation of AV node cell action potential(GO:0098904) |
| 0.2 | 0.6 | GO:0006597 | spermine biosynthetic process(GO:0006597) |
| 0.2 | 1.6 | GO:0031444 | slow-twitch skeletal muscle fiber contraction(GO:0031444) |
| 0.2 | 0.5 | GO:1990519 | pyrimidine nucleotide transport(GO:0006864) mitochondrial pyrimidine nucleotide import(GO:1990519) |
| 0.2 | 0.7 | GO:0009631 | cold acclimation(GO:0009631) |
| 0.2 | 0.8 | GO:2000691 | regulation of cardiac muscle cell myoblast differentiation(GO:2000690) negative regulation of cardiac muscle cell myoblast differentiation(GO:2000691) |
| 0.2 | 0.8 | GO:0034344 | type III interferon production(GO:0034343) regulation of type III interferon production(GO:0034344) |
| 0.2 | 0.5 | GO:1990697 | protein depalmitoleylation(GO:1990697) |
| 0.2 | 0.9 | GO:1902361 | mitochondrial pyruvate transport(GO:0006850) mitochondrial pyruvate transmembrane transport(GO:1902361) |
| 0.2 | 0.9 | GO:0042776 | mitochondrial ATP synthesis coupled proton transport(GO:0042776) |
| 0.2 | 0.5 | GO:0099403 | negative regulation of maintenance of sister chromatid cohesion(GO:0034092) negative regulation of maintenance of mitotic sister chromatid cohesion(GO:0034183) maintenance of mitotic sister chromatid cohesion, telomeric(GO:0099403) mitotic sister chromatid cohesion, telomeric(GO:0099404) regulation of maintenance of mitotic sister chromatid cohesion, telomeric(GO:1904907) negative regulation of maintenance of mitotic sister chromatid cohesion, telomeric(GO:1904908) |
| 0.1 | 0.9 | GO:0008615 | pyridoxine metabolic process(GO:0008614) pyridoxine biosynthetic process(GO:0008615) vitamin B6 biosynthetic process(GO:0042819) |
| 0.1 | 1.1 | GO:0071484 | cellular response to light intensity(GO:0071484) cellular response to high light intensity(GO:0071486) retinal rod cell apoptotic process(GO:0097473) |
| 0.1 | 0.7 | GO:0090076 | relaxation of skeletal muscle(GO:0090076) |
| 0.1 | 1.2 | GO:0006167 | AMP biosynthetic process(GO:0006167) |
| 0.1 | 0.7 | GO:0071603 | endothelial cell-cell adhesion(GO:0071603) |
| 0.1 | 0.5 | GO:0010728 | regulation of hydrogen peroxide biosynthetic process(GO:0010728) |
| 0.1 | 0.4 | GO:0030718 | germ-line stem cell population maintenance(GO:0030718) |
| 0.1 | 1.0 | GO:0072660 | maintenance of protein location in membrane(GO:0072658) maintenance of protein location in plasma membrane(GO:0072660) positive regulation of membrane depolarization during cardiac muscle cell action potential(GO:1900827) |
| 0.1 | 1.0 | GO:0007079 | mitotic chromosome movement towards spindle pole(GO:0007079) |
| 0.1 | 0.2 | GO:2000485 | regulation of glutamine transport(GO:2000485) |
| 0.1 | 0.5 | GO:0035498 | carnosine metabolic process(GO:0035498) |
| 0.1 | 0.6 | GO:0030806 | negative regulation of cyclic nucleotide catabolic process(GO:0030806) negative regulation of cAMP catabolic process(GO:0030821) |
| 0.1 | 1.0 | GO:0010890 | positive regulation of sequestering of triglyceride(GO:0010890) |
| 0.1 | 0.5 | GO:2000342 | negative regulation of chemokine (C-X-C motif) ligand 2 production(GO:2000342) |
| 0.1 | 0.6 | GO:1990414 | replication-born double-strand break repair via sister chromatid exchange(GO:1990414) homologous recombination-dependent replication fork processing(GO:1990426) |
| 0.1 | 0.4 | GO:0006610 | ribosomal protein import into nucleus(GO:0006610) |
| 0.1 | 0.3 | GO:0007309 | oocyte construction(GO:0007308) oocyte axis specification(GO:0007309) oocyte anterior/posterior axis specification(GO:0007314) pole plasm assembly(GO:0007315) maternal determination of anterior/posterior axis, embryo(GO:0008358) P granule organization(GO:0030719) |
| 0.1 | 0.8 | GO:0006154 | adenosine catabolic process(GO:0006154) inosine biosynthetic process(GO:0046103) |
| 0.1 | 1.9 | GO:0030422 | production of siRNA involved in RNA interference(GO:0030422) |
| 0.1 | 0.3 | GO:0032304 | negative regulation of icosanoid secretion(GO:0032304) |
| 0.1 | 0.6 | GO:0007341 | penetration of zona pellucida(GO:0007341) |
| 0.1 | 0.3 | GO:0061589 | calcium activated phosphatidylserine scrambling(GO:0061589) |
| 0.1 | 0.4 | GO:1904732 | regulation of electron carrier activity(GO:1904732) |
| 0.1 | 0.5 | GO:0048631 | regulation of skeletal muscle tissue growth(GO:0048631) |
| 0.1 | 0.3 | GO:0031453 | regulation of heterochromatin assembly(GO:0031445) positive regulation of heterochromatin assembly(GO:0031453) |
| 0.1 | 0.4 | GO:0072709 | cellular response to sorbitol(GO:0072709) |
| 0.1 | 1.4 | GO:0044351 | macropinocytosis(GO:0044351) |
| 0.1 | 0.2 | GO:1905237 | response to cyclosporin A(GO:1905237) positive regulation of response to drug(GO:2001025) |
| 0.1 | 0.8 | GO:0017196 | N-terminal peptidyl-methionine acetylation(GO:0017196) |
| 0.1 | 0.1 | GO:0035549 | positive regulation of interferon-beta secretion(GO:0035549) |
| 0.1 | 1.7 | GO:0071688 | striated muscle myosin thick filament assembly(GO:0071688) |
| 0.1 | 1.2 | GO:0007135 | meiosis II(GO:0007135) |
| 0.1 | 0.2 | GO:0035262 | positive regulation of luteinizing hormone secretion(GO:0033686) gonad morphogenesis(GO:0035262) |
| 0.1 | 1.4 | GO:1901725 | regulation of histone deacetylase activity(GO:1901725) |
| 0.1 | 0.4 | GO:0060214 | endocardium formation(GO:0060214) |
| 0.1 | 1.2 | GO:0031163 | iron-sulfur cluster assembly(GO:0016226) metallo-sulfur cluster assembly(GO:0031163) |
| 0.1 | 0.1 | GO:0046110 | xanthine metabolic process(GO:0046110) |
| 0.1 | 0.3 | GO:0090579 | transcriptional activation by promoter-enhancer looping(GO:0071733) gene looping(GO:0090202) dsDNA loop formation(GO:0090579) |
| 0.1 | 0.4 | GO:0014005 | microglia differentiation(GO:0014004) microglia development(GO:0014005) |
| 0.1 | 0.2 | GO:0046603 | negative regulation of mitotic centrosome separation(GO:0046603) |
| 0.1 | 0.2 | GO:0050760 | negative regulation of thymidylate synthase biosynthetic process(GO:0050760) |
| 0.1 | 0.2 | GO:0034769 | basement membrane disassembly(GO:0034769) |
| 0.1 | 0.5 | GO:1900383 | regulation of synaptic plasticity by receptor localization to synapse(GO:1900383) |
| 0.1 | 1.8 | GO:0048240 | sperm capacitation(GO:0048240) |
| 0.1 | 0.5 | GO:0007506 | gonadal mesoderm development(GO:0007506) |
| 0.1 | 0.9 | GO:0070934 | CRD-mediated mRNA stabilization(GO:0070934) |
| 0.1 | 0.5 | GO:1904885 | beta-catenin destruction complex assembly(GO:1904885) |
| 0.1 | 0.5 | GO:0099590 | neurotransmitter receptor internalization(GO:0099590) |
| 0.1 | 0.5 | GO:0031914 | negative regulation of synaptic plasticity(GO:0031914) |
| 0.1 | 0.3 | GO:0000973 | posttranscriptional tethering of RNA polymerase II gene DNA at nuclear periphery(GO:0000973) nuclear retention of pre-mRNA at the site of transcription(GO:0071033) |
| 0.1 | 0.5 | GO:1900126 | negative regulation of hyaluronan biosynthetic process(GO:1900126) |
| 0.1 | 0.6 | GO:0010032 | meiotic chromosome condensation(GO:0010032) |
| 0.1 | 1.7 | GO:0048681 | negative regulation of axon regeneration(GO:0048681) |
| 0.1 | 0.2 | GO:0060167 | regulation of adenosine receptor signaling pathway(GO:0060167) positive regulation of adenosine receptor signaling pathway(GO:0060168) |
| 0.1 | 5.0 | GO:0015701 | bicarbonate transport(GO:0015701) |
| 0.1 | 1.6 | GO:2000651 | positive regulation of sodium ion transmembrane transporter activity(GO:2000651) |
| 0.1 | 0.3 | GO:0030950 | establishment or maintenance of actin cytoskeleton polarity(GO:0030950) |
| 0.1 | 0.6 | GO:0035694 | mitochondrial protein catabolic process(GO:0035694) |
| 0.1 | 1.7 | GO:1902603 | carnitine transmembrane transport(GO:1902603) |
| 0.1 | 0.3 | GO:0007060 | male meiosis chromosome segregation(GO:0007060) |
| 0.1 | 0.9 | GO:0030043 | actin filament fragmentation(GO:0030043) |
| 0.1 | 0.3 | GO:0072675 | osteoclast fusion(GO:0072675) |
| 0.1 | 0.3 | GO:0002159 | desmosome assembly(GO:0002159) |
| 0.1 | 0.2 | GO:0018395 | peptidyl-lysine hydroxylation to 5-hydroxy-L-lysine(GO:0018395) histone arginine demethylation(GO:0070077) histone H3-R2 demethylation(GO:0070078) histone H4-R3 demethylation(GO:0070079) |
| 0.1 | 1.5 | GO:0007342 | fusion of sperm to egg plasma membrane(GO:0007342) |
| 0.0 | 0.4 | GO:0072014 | proximal tubule development(GO:0072014) |
| 0.0 | 2.6 | GO:0010738 | regulation of protein kinase A signaling(GO:0010738) |
| 0.0 | 0.1 | GO:1904578 | response to thapsigargin(GO:1904578) cellular response to thapsigargin(GO:1904579) |
| 0.0 | 0.7 | GO:0060992 | response to fungicide(GO:0060992) |
| 0.0 | 0.2 | GO:1904693 | midbrain morphogenesis(GO:1904693) |
| 0.0 | 1.1 | GO:0051988 | regulation of attachment of spindle microtubules to kinetochore(GO:0051988) |
| 0.0 | 0.4 | GO:0035093 | spermatogenesis, exchange of chromosomal proteins(GO:0035093) |
| 0.0 | 0.5 | GO:0097500 | receptor localization to nonmotile primary cilium(GO:0097500) |
| 0.0 | 0.4 | GO:0030644 | cellular chloride ion homeostasis(GO:0030644) chloride ion homeostasis(GO:0055064) |
| 0.0 | 0.4 | GO:0015840 | urea transport(GO:0015840) |
| 0.0 | 0.5 | GO:0046689 | response to mercury ion(GO:0046689) |
| 0.0 | 0.5 | GO:1990034 | calcium ion export from cell(GO:1990034) |
| 0.0 | 2.0 | GO:0005980 | glycogen catabolic process(GO:0005980) |
| 0.0 | 0.4 | GO:0022027 | interkinetic nuclear migration(GO:0022027) |
| 0.0 | 2.5 | GO:0071392 | cellular response to estradiol stimulus(GO:0071392) |
| 0.0 | 1.1 | GO:0016024 | CDP-diacylglycerol biosynthetic process(GO:0016024) |
| 0.0 | 0.8 | GO:0006086 | acetyl-CoA biosynthetic process from pyruvate(GO:0006086) regulation of acetyl-CoA biosynthetic process from pyruvate(GO:0010510) |
| 0.0 | 0.2 | GO:0019242 | methylglyoxal biosynthetic process(GO:0019242) |
| 0.0 | 0.2 | GO:0051228 | mitotic spindle disassembly(GO:0051228) spindle disassembly(GO:0051230) |
| 0.0 | 0.1 | GO:0044333 | Wnt signaling pathway involved in digestive tract morphogenesis(GO:0044333) |
| 0.0 | 0.3 | GO:0015712 | hexose phosphate transport(GO:0015712) glucose-6-phosphate transport(GO:0015760) |
| 0.0 | 0.6 | GO:2000659 | regulation of interleukin-1-mediated signaling pathway(GO:2000659) |
| 0.0 | 0.5 | GO:0042998 | positive regulation of Golgi to plasma membrane protein transport(GO:0042998) |
| 0.0 | 0.1 | GO:0033306 | phytol metabolic process(GO:0033306) fatty alcohol metabolic process(GO:1903173) |
| 0.0 | 0.8 | GO:0032688 | negative regulation of interferon-beta production(GO:0032688) |
| 0.0 | 1.0 | GO:0003334 | keratinocyte development(GO:0003334) |
| 0.0 | 0.2 | GO:0019626 | short-chain fatty acid catabolic process(GO:0019626) |
| 0.0 | 0.3 | GO:0043353 | enucleate erythrocyte differentiation(GO:0043353) |
| 0.0 | 0.3 | GO:0045829 | negative regulation of isotype switching(GO:0045829) |
| 0.0 | 0.5 | GO:0018095 | protein polyglutamylation(GO:0018095) |
| 0.0 | 0.2 | GO:0061153 | trachea submucosa development(GO:0061152) trachea gland development(GO:0061153) |
| 0.0 | 0.6 | GO:1990440 | positive regulation of transcription from RNA polymerase II promoter in response to endoplasmic reticulum stress(GO:1990440) |
| 0.0 | 0.1 | GO:2000686 | negative regulation of rubidium ion transport(GO:2000681) regulation of rubidium ion transmembrane transporter activity(GO:2000686) negative regulation of rubidium ion transmembrane transporter activity(GO:2000687) |
| 0.0 | 0.1 | GO:1903892 | negative regulation of ATF6-mediated unfolded protein response(GO:1903892) |
| 0.0 | 0.8 | GO:0003310 | pancreatic A cell differentiation(GO:0003310) |
| 0.0 | 0.0 | GO:0002085 | inhibition of neuroepithelial cell differentiation(GO:0002085) left lung morphogenesis(GO:0060460) |
| 0.0 | 0.5 | GO:0035331 | negative regulation of hippo signaling(GO:0035331) |
| 0.0 | 0.2 | GO:0070221 | sulfide oxidation(GO:0019418) sulfide oxidation, using sulfide:quinone oxidoreductase(GO:0070221) |
| 0.0 | 0.2 | GO:0010193 | response to ozone(GO:0010193) |
| 0.0 | 1.2 | GO:0009083 | branched-chain amino acid catabolic process(GO:0009083) |
| 0.0 | 0.8 | GO:0010248 | establishment or maintenance of transmembrane electrochemical gradient(GO:0010248) |
| 0.0 | 0.2 | GO:0006990 | positive regulation of transcription from RNA polymerase II promoter involved in unfolded protein response(GO:0006990) |
| 0.0 | 0.7 | GO:0032793 | positive regulation of CREB transcription factor activity(GO:0032793) |
| 0.0 | 1.2 | GO:0000470 | maturation of LSU-rRNA(GO:0000470) |
| 0.0 | 0.2 | GO:1990737 | response to manganese-induced endoplasmic reticulum stress(GO:1990737) positive regulation of type B pancreatic cell apoptotic process(GO:2000676) |
| 0.0 | 0.1 | GO:0061358 | negative regulation of Wnt protein secretion(GO:0061358) |
| 0.0 | 0.5 | GO:0031936 | negative regulation of chromatin silencing(GO:0031936) |
| 0.0 | 0.3 | GO:0006268 | DNA unwinding involved in DNA replication(GO:0006268) |
| 0.0 | 1.5 | GO:0048485 | sympathetic nervous system development(GO:0048485) |
| 0.0 | 0.3 | GO:0070127 | tRNA aminoacylation for mitochondrial protein translation(GO:0070127) |
| 0.0 | 0.3 | GO:0002084 | protein depalmitoylation(GO:0002084) |
| 0.0 | 0.5 | GO:0055091 | phospholipid homeostasis(GO:0055091) |
| 0.0 | 2.9 | GO:0010257 | NADH dehydrogenase complex assembly(GO:0010257) mitochondrial respiratory chain complex I assembly(GO:0032981) mitochondrial respiratory chain complex I biogenesis(GO:0097031) |
| 0.0 | 0.2 | GO:0015870 | acetylcholine transport(GO:0015870) |
| 0.0 | 0.5 | GO:0035269 | protein O-linked mannosylation(GO:0035269) |
| 0.0 | 0.8 | GO:0036149 | phosphatidylinositol acyl-chain remodeling(GO:0036149) |
| 0.0 | 0.7 | GO:0043922 | negative regulation by host of viral transcription(GO:0043922) |
| 0.0 | 0.3 | GO:0090158 | endoplasmic reticulum membrane organization(GO:0090158) positive regulation of ER to Golgi vesicle-mediated transport(GO:1902953) |
| 0.0 | 1.3 | GO:0006607 | NLS-bearing protein import into nucleus(GO:0006607) |
| 0.0 | 0.4 | GO:0042989 | sequestering of actin monomers(GO:0042989) |
| 0.0 | 0.5 | GO:0015074 | DNA integration(GO:0015074) |
| 0.0 | 1.5 | GO:0006336 | DNA replication-independent nucleosome assembly(GO:0006336) |
| 0.0 | 0.5 | GO:0034501 | protein localization to kinetochore(GO:0034501) |
| 0.0 | 0.5 | GO:0048642 | negative regulation of skeletal muscle tissue development(GO:0048642) |
| 0.0 | 0.6 | GO:0016254 | preassembly of GPI anchor in ER membrane(GO:0016254) |
| 0.0 | 0.8 | GO:0071157 | negative regulation of cell cycle arrest(GO:0071157) |
| 0.0 | 0.1 | GO:0097156 | fasciculation of motor neuron axon(GO:0097156) |
| 0.0 | 0.2 | GO:0030174 | regulation of DNA-dependent DNA replication initiation(GO:0030174) |
| 0.0 | 0.2 | GO:0006390 | transcription from mitochondrial promoter(GO:0006390) |
| 0.0 | 1.5 | GO:1903959 | regulation of anion transmembrane transport(GO:1903959) |
| 0.0 | 0.4 | GO:0090110 | cargo loading into COPII-coated vesicle(GO:0090110) |
| 0.0 | 1.0 | GO:0070286 | axonemal dynein complex assembly(GO:0070286) |
| 0.0 | 0.1 | GO:0048200 | COPI-coated vesicle budding(GO:0035964) Golgi transport vesicle coating(GO:0048200) COPI coating of Golgi vesicle(GO:0048205) |
| 0.0 | 0.2 | GO:0030213 | hyaluronan biosynthetic process(GO:0030213) |
| 0.0 | 0.2 | GO:0042048 | olfactory behavior(GO:0042048) |
| 0.0 | 0.6 | GO:0033234 | negative regulation of protein sumoylation(GO:0033234) |
| 0.0 | 0.6 | GO:0006123 | mitochondrial electron transport, cytochrome c to oxygen(GO:0006123) |
| 0.0 | 0.3 | GO:0007512 | adult heart development(GO:0007512) |
| 0.0 | 0.1 | GO:0001189 | RNA polymerase I transcriptional preinitiation complex assembly(GO:0001188) RNA polymerase I transcriptional preinitiation complex assembly at the promoter for the nuclear large rRNA transcript(GO:0001189) |
| 0.0 | 0.8 | GO:0071539 | protein localization to centrosome(GO:0071539) |
| 0.0 | 0.3 | GO:0010579 | regulation of adenylate cyclase activity involved in G-protein coupled receptor signaling pathway(GO:0010578) positive regulation of adenylate cyclase activity involved in G-protein coupled receptor signaling pathway(GO:0010579) |
| 0.0 | 0.1 | GO:0018057 | peptidyl-lysine oxidation(GO:0018057) |
| 0.0 | 0.1 | GO:0034445 | regulation of plasma lipoprotein particle oxidation(GO:0034444) negative regulation of plasma lipoprotein particle oxidation(GO:0034445) |
| 0.0 | 0.2 | GO:0060742 | epithelial cell differentiation involved in prostate gland development(GO:0060742) |
| 0.0 | 0.3 | GO:0006477 | protein sulfation(GO:0006477) |
| 0.0 | 0.5 | GO:0030277 | maintenance of gastrointestinal epithelium(GO:0030277) |
| 0.0 | 0.7 | GO:0007413 | axonal fasciculation(GO:0007413) |
| 0.0 | 3.6 | GO:0018107 | peptidyl-threonine phosphorylation(GO:0018107) |
| 0.0 | 0.2 | GO:1902897 | regulation of postsynaptic density protein 95 clustering(GO:1902897) |
| 0.0 | 1.8 | GO:0055008 | cardiac muscle tissue morphogenesis(GO:0055008) |
| 0.0 | 0.6 | GO:0050860 | negative regulation of T cell receptor signaling pathway(GO:0050860) |
| 0.0 | 0.5 | GO:0006895 | Golgi to endosome transport(GO:0006895) |
| 0.0 | 1.0 | GO:0045022 | early endosome to late endosome transport(GO:0045022) |
| 0.0 | 0.2 | GO:0033564 | anterior/posterior axon guidance(GO:0033564) |
| 0.0 | 0.2 | GO:0055059 | asymmetric neuroblast division(GO:0055059) |
| 0.0 | 0.1 | GO:0098928 | presynaptic signal transduction(GO:0098928) presynapse to nucleus signaling pathway(GO:0099526) |
| 0.0 | 0.4 | GO:0006590 | thyroid hormone generation(GO:0006590) |
| 0.0 | 0.7 | GO:0000027 | ribosomal large subunit assembly(GO:0000027) |
| 0.0 | 0.3 | GO:0006776 | vitamin A metabolic process(GO:0006776) |
| 0.0 | 0.3 | GO:0045116 | protein neddylation(GO:0045116) |
| 0.0 | 0.1 | GO:0060988 | lipid tube assembly(GO:0060988) |
| 0.0 | 0.8 | GO:0046839 | phospholipid dephosphorylation(GO:0046839) |
| 0.0 | 0.1 | GO:0090309 | C-5 methylation of cytosine(GO:0090116) positive regulation of methylation-dependent chromatin silencing(GO:0090309) |
| 0.0 | 0.3 | GO:0070986 | left/right axis specification(GO:0070986) |
| 0.0 | 0.6 | GO:0003009 | skeletal muscle contraction(GO:0003009) |
| 0.0 | 1.0 | GO:0043392 | negative regulation of DNA binding(GO:0043392) |
| 0.0 | 0.3 | GO:0008298 | intracellular mRNA localization(GO:0008298) |
| 0.0 | 1.0 | GO:1900078 | positive regulation of cellular response to insulin stimulus(GO:1900078) |
| 0.0 | 0.1 | GO:0006540 | glutamate decarboxylation to succinate(GO:0006540) |
| 0.0 | 0.5 | GO:0071174 | mitotic spindle checkpoint(GO:0071174) |
| 0.0 | 0.1 | GO:1903588 | negative regulation of blood vessel endothelial cell proliferation involved in sprouting angiogenesis(GO:1903588) |
| 0.0 | 0.3 | GO:1901642 | nucleoside transmembrane transport(GO:1901642) |
| 0.0 | 0.3 | GO:2000059 | negative regulation of protein ubiquitination involved in ubiquitin-dependent protein catabolic process(GO:2000059) |
| 0.0 | 0.2 | GO:0060263 | regulation of respiratory burst(GO:0060263) |
| 0.0 | 1.1 | GO:0005977 | glycogen metabolic process(GO:0005977) |
| 0.0 | 0.0 | GO:0072361 | regulation of glycolytic process by regulation of transcription from RNA polymerase II promoter(GO:0072361) |
| 0.0 | 0.2 | GO:0033617 | mitochondrial respiratory chain complex IV assembly(GO:0033617) |
| 0.0 | 0.2 | GO:0021694 | cerebellar Purkinje cell layer formation(GO:0021694) cerebellar Purkinje cell differentiation(GO:0021702) |
| 0.0 | 0.1 | GO:0030638 | polyketide metabolic process(GO:0030638) aminoglycoside antibiotic metabolic process(GO:0030647) daunorubicin metabolic process(GO:0044597) doxorubicin metabolic process(GO:0044598) |
| 0.0 | 0.1 | GO:0060972 | left/right pattern formation(GO:0060972) |
| 0.0 | 0.1 | GO:0015891 | iron chelate transport(GO:0015688) siderophore transport(GO:0015891) |
| 0.0 | 0.9 | GO:0046710 | GDP metabolic process(GO:0046710) |
| 0.0 | 0.6 | GO:0061318 | renal filtration cell differentiation(GO:0061318) glomerular visceral epithelial cell differentiation(GO:0072112) glomerular epithelial cell differentiation(GO:0072311) |
| 0.0 | 0.5 | GO:0031581 | hemidesmosome assembly(GO:0031581) |
| 0.0 | 0.1 | GO:0042256 | mature ribosome assembly(GO:0042256) |
| 0.0 | 0.0 | GO:0090222 | centrosome-templated microtubule nucleation(GO:0090222) |
| 0.0 | 0.2 | GO:0098909 | regulation of cardiac muscle cell action potential involved in regulation of contraction(GO:0098909) |
| 0.0 | 0.3 | GO:0043982 | histone H4-K5 acetylation(GO:0043981) histone H4-K8 acetylation(GO:0043982) |
| 0.0 | 0.2 | GO:0090051 | negative regulation of cell migration involved in sprouting angiogenesis(GO:0090051) |
| 0.0 | 0.3 | GO:0070493 | thrombin receptor signaling pathway(GO:0070493) |
| 0.0 | 0.6 | GO:0006693 | prostanoid metabolic process(GO:0006692) prostaglandin metabolic process(GO:0006693) |
| 0.0 | 2.0 | GO:0035335 | peptidyl-tyrosine dephosphorylation(GO:0035335) |
| 0.0 | 0.1 | GO:0008063 | Toll signaling pathway(GO:0008063) |
| 0.0 | 0.4 | GO:0007597 | blood coagulation, intrinsic pathway(GO:0007597) |
| 0.0 | 0.0 | GO:0043416 | regulation of skeletal muscle tissue regeneration(GO:0043416) |
| 0.0 | 1.3 | GO:0030433 | ER-associated ubiquitin-dependent protein catabolic process(GO:0030433) |
| 0.0 | 0.2 | GO:0035988 | chondrocyte proliferation(GO:0035988) |
| 0.0 | 0.9 | GO:0006303 | double-strand break repair via nonhomologous end joining(GO:0006303) |
| 0.0 | 0.5 | GO:0006270 | DNA replication initiation(GO:0006270) |
| 0.0 | 0.1 | GO:0000244 | spliceosomal tri-snRNP complex assembly(GO:0000244) |
| 0.0 | 0.4 | GO:0048268 | clathrin coat assembly(GO:0048268) |
| 0.0 | 0.7 | GO:0015909 | long-chain fatty acid transport(GO:0015909) |
| 0.0 | 0.5 | GO:0032012 | regulation of ARF protein signal transduction(GO:0032012) |
| 0.0 | 0.1 | GO:1990592 | protein polyufmylation(GO:1990564) protein K69-linked ufmylation(GO:1990592) |
| 0.0 | 0.2 | GO:0080182 | histone H3-K4 trimethylation(GO:0080182) |
Gene overrepresentation in cellular component category:
| Log-likelihood per target | Total log-likelihood | Term | Description |
|---|---|---|---|
| 0.4 | 3.1 | GO:0032280 | symmetric synapse(GO:0032280) |
| 0.2 | 0.9 | GO:0045259 | mitochondrial proton-transporting ATP synthase complex(GO:0005753) proton-transporting ATP synthase complex(GO:0045259) |
| 0.2 | 0.7 | GO:0071665 | gamma-catenin-TCF7L2 complex(GO:0071665) |
| 0.2 | 0.9 | GO:0070701 | mucus layer(GO:0070701) |
| 0.2 | 2.0 | GO:0005964 | phosphorylase kinase complex(GO:0005964) |
| 0.2 | 0.6 | GO:0043159 | acrosomal matrix(GO:0043159) |
| 0.1 | 1.2 | GO:0005947 | mitochondrial alpha-ketoglutarate dehydrogenase complex(GO:0005947) |
| 0.1 | 3.1 | GO:0005861 | troponin complex(GO:0005861) |
| 0.1 | 0.9 | GO:0005967 | mitochondrial pyruvate dehydrogenase complex(GO:0005967) |
| 0.1 | 2.0 | GO:0044352 | pinosome(GO:0044352) macropinosome(GO:0044354) |
| 0.1 | 1.0 | GO:0070695 | FHF complex(GO:0070695) |
| 0.1 | 0.7 | GO:0005958 | DNA-dependent protein kinase-DNA ligase 4 complex(GO:0005958) |
| 0.1 | 3.2 | GO:0046930 | pore complex(GO:0046930) |
| 0.1 | 0.9 | GO:0033503 | HULC complex(GO:0033503) |
| 0.1 | 0.7 | GO:0031417 | NatC complex(GO:0031417) |
| 0.1 | 0.8 | GO:0032777 | Piccolo NuA4 histone acetyltransferase complex(GO:0032777) |
| 0.1 | 1.7 | GO:0070578 | RISC-loading complex(GO:0070578) |
| 0.1 | 0.8 | GO:0097452 | GAIT complex(GO:0097452) |
| 0.1 | 0.6 | GO:0070545 | PeBoW complex(GO:0070545) |
| 0.1 | 1.0 | GO:0000506 | glycosylphosphatidylinositol-N-acetylglucosaminyltransferase (GPI-GnT) complex(GO:0000506) |
| 0.1 | 0.2 | GO:0044207 | eukaryotic 48S preinitiation complex(GO:0033290) translation initiation ternary complex(GO:0044207) |
| 0.1 | 0.7 | GO:0005879 | axonemal microtubule(GO:0005879) |
| 0.1 | 0.3 | GO:0031933 | telomeric heterochromatin(GO:0031933) |
| 0.1 | 0.7 | GO:0000138 | Golgi trans cisterna(GO:0000138) |
| 0.1 | 0.7 | GO:0000796 | condensin complex(GO:0000796) |
| 0.1 | 2.3 | GO:1990124 | messenger ribonucleoprotein complex(GO:1990124) |
| 0.1 | 1.4 | GO:0031588 | nucleotide-activated protein kinase complex(GO:0031588) |
| 0.1 | 1.0 | GO:0031616 | spindle pole centrosome(GO:0031616) |
| 0.1 | 1.3 | GO:0033202 | Ino80 complex(GO:0031011) DNA helicase complex(GO:0033202) |
| 0.1 | 1.7 | GO:0032982 | myosin filament(GO:0032982) |
| 0.1 | 0.5 | GO:0044305 | calyx of Held(GO:0044305) |
| 0.0 | 1.5 | GO:0030687 | preribosome, large subunit precursor(GO:0030687) |
| 0.0 | 1.2 | GO:0005890 | sodium:potassium-exchanging ATPase complex(GO:0005890) |
| 0.0 | 1.2 | GO:0032591 | dendritic spine membrane(GO:0032591) |
| 0.0 | 1.0 | GO:0031597 | cytosolic proteasome complex(GO:0031597) |
| 0.0 | 0.2 | GO:0044307 | dendritic branch(GO:0044307) |
| 0.0 | 0.8 | GO:0097427 | microtubule bundle(GO:0097427) |
| 0.0 | 1.2 | GO:0030122 | AP-2 adaptor complex(GO:0030122) |
| 0.0 | 1.3 | GO:0031304 | intrinsic component of mitochondrial inner membrane(GO:0031304) integral component of mitochondrial inner membrane(GO:0031305) |
| 0.0 | 1.0 | GO:0000242 | pericentriolar material(GO:0000242) |
| 0.0 | 1.8 | GO:0033268 | node of Ranvier(GO:0033268) |
| 0.0 | 0.7 | GO:0097539 | ciliary transition fiber(GO:0097539) |
| 0.0 | 0.3 | GO:0031414 | N-terminal protein acetyltransferase complex(GO:0031414) |
| 0.0 | 0.5 | GO:0000940 | condensed chromosome outer kinetochore(GO:0000940) |
| 0.0 | 0.2 | GO:0032444 | activin responsive factor complex(GO:0032444) |
| 0.0 | 2.1 | GO:0005747 | mitochondrial respiratory chain complex I(GO:0005747) NADH dehydrogenase complex(GO:0030964) respiratory chain complex I(GO:0045271) |
| 0.0 | 0.7 | GO:0001931 | uropod(GO:0001931) cell trailing edge(GO:0031254) |
| 0.0 | 0.7 | GO:0030056 | hemidesmosome(GO:0030056) |
| 0.0 | 0.7 | GO:0044615 | nuclear pore nuclear basket(GO:0044615) |
| 0.0 | 0.2 | GO:0033165 | interphotoreceptor matrix(GO:0033165) |
| 0.0 | 1.9 | GO:0031907 | peroxisomal matrix(GO:0005782) microbody lumen(GO:0031907) |
| 0.0 | 1.3 | GO:0005640 | nuclear outer membrane(GO:0005640) |
| 0.0 | 0.5 | GO:0017119 | Golgi transport complex(GO:0017119) |
| 0.0 | 1.1 | GO:0071564 | npBAF complex(GO:0071564) |
| 0.0 | 0.3 | GO:0072487 | MSL complex(GO:0072487) |
| 0.0 | 1.1 | GO:0035371 | microtubule plus-end(GO:0035371) |
| 0.0 | 0.2 | GO:1990812 | growth cone filopodium(GO:1990812) |
| 0.0 | 1.1 | GO:0002080 | acrosomal membrane(GO:0002080) |
| 0.0 | 0.5 | GO:0045277 | respiratory chain complex IV(GO:0045277) |
| 0.0 | 0.1 | GO:0034365 | discoidal high-density lipoprotein particle(GO:0034365) |
| 0.0 | 1.1 | GO:0035861 | site of double-strand break(GO:0035861) |
| 0.0 | 0.3 | GO:0000445 | THO complex(GO:0000347) THO complex part of transcription export complex(GO:0000445) |
| 0.0 | 0.5 | GO:0005922 | connexon complex(GO:0005922) |
| 0.0 | 0.1 | GO:0099569 | cytoskeleton of presynaptic active zone(GO:0048788) presynaptic active zone cytoplasmic component(GO:0098831) presynaptic cytoskeleton(GO:0099569) |
| 0.0 | 0.6 | GO:0097440 | apical dendrite(GO:0097440) |
| 0.0 | 0.1 | GO:1990393 | 3M complex(GO:1990393) |
| 0.0 | 1.3 | GO:0031941 | filamentous actin(GO:0031941) |
| 0.0 | 0.4 | GO:0048188 | Set1C/COMPASS complex(GO:0048188) |
| 0.0 | 0.2 | GO:0046581 | intercellular canaliculus(GO:0046581) |
| 0.0 | 0.4 | GO:0000786 | nucleosome(GO:0000786) |
| 0.0 | 0.1 | GO:0071942 | XPC complex(GO:0071942) |
| 0.0 | 1.1 | GO:0005844 | polysome(GO:0005844) |
| 0.0 | 1.0 | GO:0002102 | podosome(GO:0002102) |
| 0.0 | 0.1 | GO:0071204 | histone pre-mRNA 3'end processing complex(GO:0071204) |
| 0.0 | 0.5 | GO:0016327 | apicolateral plasma membrane(GO:0016327) |
| 0.0 | 0.1 | GO:0005664 | origin recognition complex(GO:0000808) nuclear origin of replication recognition complex(GO:0005664) |
| 0.0 | 0.4 | GO:0005839 | proteasome core complex(GO:0005839) |
| 0.0 | 0.2 | GO:0071439 | clathrin complex(GO:0071439) |
| 0.0 | 1.6 | GO:0000777 | condensed chromosome kinetochore(GO:0000777) |
| 0.0 | 0.2 | GO:0070552 | BRISC complex(GO:0070552) |
| 0.0 | 0.3 | GO:0005746 | mitochondrial respiratory chain(GO:0005746) |
| 0.0 | 0.1 | GO:0071541 | eukaryotic translation initiation factor 3 complex, eIF3m(GO:0071541) |
| 0.0 | 0.2 | GO:0043020 | NADPH oxidase complex(GO:0043020) |
| 0.0 | 0.3 | GO:0031231 | integral component of peroxisomal membrane(GO:0005779) intrinsic component of peroxisomal membrane(GO:0031231) |
| 0.0 | 2.9 | GO:0090575 | RNA polymerase II transcription factor complex(GO:0090575) |
| 0.0 | 0.3 | GO:0036038 | MKS complex(GO:0036038) |
| 0.0 | 0.9 | GO:0033017 | sarcoplasmic reticulum membrane(GO:0033017) |
| 0.0 | 0.5 | GO:0016592 | mediator complex(GO:0016592) |
| 0.0 | 0.3 | GO:0031932 | TORC2 complex(GO:0031932) |
Gene overrepresentation in molecular function category:
| Log-likelihood per target | Total log-likelihood | Term | Description |
|---|---|---|---|
| 0.9 | 2.7 | GO:0080130 | L-aspartate:2-oxoglutarate aminotransferase activity(GO:0004069) L-phenylalanine:2-oxoglutarate aminotransferase activity(GO:0080130) |
| 0.4 | 3.1 | GO:1990763 | arrestin family protein binding(GO:1990763) |
| 0.4 | 1.5 | GO:0004852 | uroporphyrinogen-III synthase activity(GO:0004852) |
| 0.4 | 1.1 | GO:0031626 | beta-endorphin binding(GO:0031626) |
| 0.3 | 1.0 | GO:0003826 | alpha-ketoacid dehydrogenase activity(GO:0003826) 3-methyl-2-oxobutanoate dehydrogenase (2-methylpropanoyl-transferring) activity(GO:0003863) |
| 0.3 | 0.8 | GO:0097363 | protein O-GlcNAc transferase activity(GO:0097363) |
| 0.3 | 2.7 | GO:0086083 | cell adhesive protein binding involved in bundle of His cell-Purkinje myocyte communication(GO:0086083) |
| 0.2 | 1.5 | GO:0030172 | troponin C binding(GO:0030172) |
| 0.2 | 3.2 | GO:0015288 | porin activity(GO:0015288) |
| 0.2 | 3.3 | GO:0051525 | NFAT protein binding(GO:0051525) |
| 0.2 | 1.5 | GO:0046624 | sphingolipid transporter activity(GO:0046624) ceramide binding(GO:0097001) |
| 0.2 | 0.9 | GO:0016418 | S-acetyltransferase activity(GO:0016418) |
| 0.2 | 0.9 | GO:0004733 | pyridoxamine-phosphate oxidase activity(GO:0004733) |
| 0.2 | 2.0 | GO:0004689 | phosphorylase kinase activity(GO:0004689) |
| 0.2 | 0.7 | GO:0052810 | 1-phosphatidylinositol-5-kinase activity(GO:0052810) |
| 0.2 | 0.5 | GO:0015218 | pyrimidine nucleotide transmembrane transporter activity(GO:0015218) |
| 0.2 | 1.5 | GO:0071253 | connexin binding(GO:0071253) |
| 0.2 | 0.8 | GO:0086020 | gap junction channel activity involved in SA node cell-atrial cardiac muscle cell electrical coupling(GO:0086020) |
| 0.2 | 0.5 | GO:1990699 | palmitoleyl hydrolase activity(GO:1990699) |
| 0.1 | 0.6 | GO:0004040 | amidase activity(GO:0004040) |
| 0.1 | 1.7 | GO:0070883 | pre-miRNA binding(GO:0070883) |
| 0.1 | 0.5 | GO:1904713 | beta-catenin destruction complex binding(GO:1904713) |
| 0.1 | 1.6 | GO:0031014 | troponin T binding(GO:0031014) |
| 0.1 | 0.9 | GO:0004366 | glycerol-3-phosphate O-acyltransferase activity(GO:0004366) |
| 0.1 | 1.5 | GO:0008046 | axon guidance receptor activity(GO:0008046) |
| 0.1 | 0.6 | GO:0047374 | methylumbelliferyl-acetate deacetylase activity(GO:0047374) |
| 0.1 | 0.4 | GO:0032090 | Pyrin domain binding(GO:0032090) |
| 0.1 | 2.0 | GO:0004089 | carbonate dehydratase activity(GO:0004089) |
| 0.1 | 0.4 | GO:0035939 | microsatellite binding(GO:0035939) |
| 0.1 | 3.0 | GO:0008510 | sodium:bicarbonate symporter activity(GO:0008510) |
| 0.1 | 0.7 | GO:0000179 | rRNA (adenine-N6,N6-)-dimethyltransferase activity(GO:0000179) |
| 0.1 | 1.0 | GO:0017176 | phosphatidylinositol N-acetylglucosaminyltransferase activity(GO:0017176) |
| 0.1 | 0.3 | GO:0052871 | tocopherol omega-hydroxylase activity(GO:0052870) alpha-tocopherol omega-hydroxylase activity(GO:0052871) 20-hydroxy-leukotriene B4 omega oxidase activity(GO:0097258) 20-aldehyde-leukotriene B4 20-monooxygenase activity(GO:0097259) |
| 0.1 | 0.9 | GO:0050833 | pyruvate transmembrane transporter activity(GO:0050833) |
| 0.1 | 0.1 | GO:0008988 | rRNA (adenine-N6-)-methyltransferase activity(GO:0008988) |
| 0.1 | 1.4 | GO:0004679 | AMP-activated protein kinase activity(GO:0004679) |
| 0.1 | 0.3 | GO:0005275 | amine transmembrane transporter activity(GO:0005275) |
| 0.1 | 0.2 | GO:0015182 | L-histidine transmembrane transporter activity(GO:0005290) L-asparagine transmembrane transporter activity(GO:0015182) |
| 0.1 | 1.5 | GO:1990459 | transferrin receptor binding(GO:1990459) |
| 0.1 | 0.4 | GO:0042954 | lipoprotein transporter activity(GO:0042954) |
| 0.1 | 0.4 | GO:0004616 | phosphogluconate dehydrogenase (decarboxylating) activity(GO:0004616) |
| 0.1 | 1.5 | GO:0009931 | calcium-dependent protein serine/threonine kinase activity(GO:0009931) |
| 0.1 | 0.3 | GO:0016838 | carbon-oxygen lyase activity, acting on phosphates(GO:0016838) |
| 0.1 | 0.7 | GO:0004677 | DNA-dependent protein kinase activity(GO:0004677) |
| 0.1 | 0.8 | GO:0035251 | UDP-glucosyltransferase activity(GO:0035251) |
| 0.1 | 0.5 | GO:0043515 | kinetochore binding(GO:0043515) |
| 0.1 | 2.7 | GO:0051371 | muscle alpha-actinin binding(GO:0051371) |
| 0.1 | 0.4 | GO:0070513 | death domain binding(GO:0070513) |
| 0.1 | 0.4 | GO:0043546 | molybdopterin cofactor binding(GO:0043546) |
| 0.1 | 0.3 | GO:0015526 | hexose phosphate transmembrane transporter activity(GO:0015119) organophosphate:inorganic phosphate antiporter activity(GO:0015315) hexose-phosphate:inorganic phosphate antiporter activity(GO:0015526) glucose 6-phosphate:inorganic phosphate antiporter activity(GO:0061513) |
| 0.1 | 2.5 | GO:0031418 | L-ascorbic acid binding(GO:0031418) |
| 0.1 | 0.2 | GO:0031687 | A2A adenosine receptor binding(GO:0031687) |
| 0.1 | 0.8 | GO:0047499 | calcium-independent phospholipase A2 activity(GO:0047499) |
| 0.1 | 0.2 | GO:1901375 | acetylcholine transmembrane transporter activity(GO:0005277) acetate ester transmembrane transporter activity(GO:1901375) |
| 0.1 | 0.4 | GO:0043141 | ATP-dependent 5'-3' DNA helicase activity(GO:0043141) |
| 0.1 | 1.4 | GO:0031432 | titin binding(GO:0031432) |
| 0.1 | 0.5 | GO:0008158 | hedgehog receptor activity(GO:0008158) |
| 0.1 | 0.2 | GO:0050146 | nucleoside phosphotransferase activity(GO:0050146) |
| 0.1 | 0.5 | GO:0046974 | histone methyltransferase activity (H3-K9 specific)(GO:0046974) |
| 0.1 | 0.2 | GO:0033746 | histone demethylase activity (H3-R2 specific)(GO:0033746) histone demethylase activity (H4-R3 specific)(GO:0033749) peptidyl-lysine 5-dioxygenase activity(GO:0070815) |
| 0.0 | 0.1 | GO:0046577 | long-chain-alcohol oxidase activity(GO:0046577) |
| 0.0 | 0.1 | GO:0000386 | second spliceosomal transesterification activity(GO:0000386) |
| 0.0 | 0.4 | GO:0070573 | metallodipeptidase activity(GO:0070573) |
| 0.0 | 0.3 | GO:0032422 | purine-rich negative regulatory element binding(GO:0032422) |
| 0.0 | 0.5 | GO:0070740 | tubulin-glutamic acid ligase activity(GO:0070740) |
| 0.0 | 0.4 | GO:0004111 | creatine kinase activity(GO:0004111) |
| 0.0 | 2.0 | GO:0051010 | microtubule plus-end binding(GO:0051010) |
| 0.0 | 2.0 | GO:0051393 | alpha-actinin binding(GO:0051393) |
| 0.0 | 1.1 | GO:0015467 | G-protein activated inward rectifier potassium channel activity(GO:0015467) |
| 0.0 | 0.6 | GO:0043142 | single-stranded DNA-dependent ATPase activity(GO:0043142) |
| 0.0 | 0.4 | GO:0015450 | P-P-bond-hydrolysis-driven protein transmembrane transporter activity(GO:0015450) |
| 0.0 | 0.2 | GO:0004347 | glucose-6-phosphate isomerase activity(GO:0004347) |
| 0.0 | 0.7 | GO:0019957 | C-C chemokine binding(GO:0019957) |
| 0.0 | 0.2 | GO:1902444 | riboflavin binding(GO:1902444) |
| 0.0 | 1.1 | GO:0008494 | translation activator activity(GO:0008494) |
| 0.0 | 0.8 | GO:0005391 | sodium:potassium-exchanging ATPase activity(GO:0005391) |
| 0.0 | 1.0 | GO:0008191 | metalloendopeptidase inhibitor activity(GO:0008191) |
| 0.0 | 2.2 | GO:0008137 | NADH dehydrogenase (ubiquinone) activity(GO:0008137) NADH dehydrogenase (quinone) activity(GO:0050136) |
| 0.0 | 0.2 | GO:0090554 | phosphatidylcholine-translocating ATPase activity(GO:0090554) |
| 0.0 | 0.8 | GO:0035497 | cAMP response element binding(GO:0035497) |
| 0.0 | 0.3 | GO:0047961 | glycine N-acyltransferase activity(GO:0047961) |
| 0.0 | 0.1 | GO:0004979 | beta-endorphin receptor activity(GO:0004979) morphine receptor activity(GO:0038047) |
| 0.0 | 2.9 | GO:0008138 | protein tyrosine/serine/threonine phosphatase activity(GO:0008138) |
| 0.0 | 0.6 | GO:0004596 | peptide alpha-N-acetyltransferase activity(GO:0004596) |
| 0.0 | 0.2 | GO:0034647 | histone demethylase activity (H3-trimethyl-K4 specific)(GO:0034647) |
| 0.0 | 0.9 | GO:0098748 | clathrin adaptor activity(GO:0035615) endocytic adaptor activity(GO:0098748) |
| 0.0 | 0.3 | GO:0001517 | N-acetylglucosamine 6-O-sulfotransferase activity(GO:0001517) |
| 0.0 | 0.1 | GO:0003955 | NAD(P)H dehydrogenase (quinone) activity(GO:0003955) 3-oxoacyl-[acyl-carrier-protein] reductase (NADH) activity(GO:0047025) |
| 0.0 | 0.3 | GO:0016416 | O-palmitoyltransferase activity(GO:0016416) |
| 0.0 | 0.3 | GO:0043995 | histone acetyltransferase activity (H4-K5 specific)(GO:0043995) histone acetyltransferase activity (H4-K8 specific)(GO:0043996) histone acetyltransferase activity (H4-K16 specific)(GO:0046972) |
| 0.0 | 0.8 | GO:0004000 | adenosine deaminase activity(GO:0004000) |
| 0.0 | 0.8 | GO:0005247 | voltage-gated chloride channel activity(GO:0005247) |
| 0.0 | 0.6 | GO:0050321 | tau-protein kinase activity(GO:0050321) |
| 0.0 | 0.1 | GO:0071566 | UFM1 activating enzyme activity(GO:0071566) |
| 0.0 | 0.3 | GO:0000405 | bubble DNA binding(GO:0000405) |
| 0.0 | 0.4 | GO:0071933 | Arp2/3 complex binding(GO:0071933) |
| 0.0 | 2.7 | GO:0051018 | protein kinase A binding(GO:0051018) |
| 0.0 | 1.2 | GO:0051539 | 4 iron, 4 sulfur cluster binding(GO:0051539) |
| 0.0 | 1.9 | GO:0030331 | estrogen receptor binding(GO:0030331) |
| 0.0 | 0.8 | GO:0008143 | poly(A) binding(GO:0008143) |
| 0.0 | 0.3 | GO:0098599 | palmitoyl-(protein) hydrolase activity(GO:0008474) palmitoyl hydrolase activity(GO:0098599) |
| 0.0 | 0.5 | GO:0005537 | mannose binding(GO:0005537) |
| 0.0 | 0.5 | GO:0051400 | BH domain binding(GO:0051400) |
| 0.0 | 0.6 | GO:0008195 | phosphatidate phosphatase activity(GO:0008195) |
| 0.0 | 0.3 | GO:0002161 | aminoacyl-tRNA editing activity(GO:0002161) |
| 0.0 | 0.8 | GO:0016676 | cytochrome-c oxidase activity(GO:0004129) heme-copper terminal oxidase activity(GO:0015002) oxidoreductase activity, acting on a heme group of donors, oxygen as acceptor(GO:0016676) |
| 0.0 | 0.2 | GO:0008508 | bile acid:sodium symporter activity(GO:0008508) |
| 0.0 | 0.9 | GO:0005184 | neuropeptide hormone activity(GO:0005184) |
| 0.0 | 0.3 | GO:0008569 | ATP-dependent microtubule motor activity, minus-end-directed(GO:0008569) |
| 0.0 | 0.2 | GO:0001025 | RNA polymerase III transcription factor binding(GO:0001025) |
| 0.0 | 0.2 | GO:0016402 | pristanoyl-CoA oxidase activity(GO:0016402) |
| 0.0 | 0.7 | GO:0001972 | retinoic acid binding(GO:0001972) |
| 0.0 | 0.8 | GO:0030506 | ankyrin binding(GO:0030506) |
| 0.0 | 0.2 | GO:0043199 | sulfate binding(GO:0043199) |
| 0.0 | 0.2 | GO:0030292 | protein tyrosine kinase inhibitor activity(GO:0030292) |
| 0.0 | 0.4 | GO:0004017 | adenylate kinase activity(GO:0004017) |
| 0.0 | 1.8 | GO:0016278 | lysine N-methyltransferase activity(GO:0016278) |
| 0.0 | 0.2 | GO:0016176 | superoxide-generating NADPH oxidase activator activity(GO:0016176) |
| 0.0 | 0.8 | GO:0005086 | ARF guanyl-nucleotide exchange factor activity(GO:0005086) |
| 0.0 | 0.5 | GO:0019992 | diacylglycerol binding(GO:0019992) |
| 0.0 | 0.2 | GO:0031386 | protein tag(GO:0031386) |
| 0.0 | 0.1 | GO:0003886 | DNA (cytosine-5-)-methyltransferase activity(GO:0003886) |
| 0.0 | 0.1 | GO:0051185 | coenzyme transporter activity(GO:0051185) |
| 0.0 | 0.2 | GO:0004565 | beta-galactosidase activity(GO:0004565) |
| 0.0 | 0.7 | GO:0051959 | dynein light intermediate chain binding(GO:0051959) |
| 0.0 | 0.0 | GO:0009383 | rRNA (cytosine-C5-)-methyltransferase activity(GO:0009383) |
| 0.0 | 0.5 | GO:0016881 | acid-amino acid ligase activity(GO:0016881) |
| 0.0 | 0.4 | GO:0004708 | MAP kinase kinase activity(GO:0004708) |
| 0.0 | 0.7 | GO:0030159 | receptor signaling complex scaffold activity(GO:0030159) |
| 0.0 | 0.2 | GO:0004075 | biotin carboxylase activity(GO:0004075) |
| 0.0 | 0.1 | GO:0044736 | acid-sensing ion channel activity(GO:0044736) |
| 0.0 | 0.9 | GO:0004385 | guanylate kinase activity(GO:0004385) |
| 0.0 | 0.1 | GO:0004351 | glutamate decarboxylase activity(GO:0004351) |
| 0.0 | 0.7 | GO:0005487 | nucleocytoplasmic transporter activity(GO:0005487) |
| 0.0 | 1.1 | GO:0001105 | RNA polymerase II transcription coactivator activity(GO:0001105) |
| 0.0 | 0.3 | GO:0045294 | alpha-catenin binding(GO:0045294) |
| 0.0 | 0.4 | GO:0005545 | 1-phosphatidylinositol binding(GO:0005545) |
| 0.0 | 0.2 | GO:0052629 | phosphatidylinositol-3,5-bisphosphate 3-phosphatase activity(GO:0052629) |
| 0.0 | 0.9 | GO:0001784 | phosphotyrosine binding(GO:0001784) |
| 0.0 | 0.2 | GO:0008568 | microtubule-severing ATPase activity(GO:0008568) |
| 0.0 | 0.8 | GO:0050681 | androgen receptor binding(GO:0050681) |
| 0.0 | 0.3 | GO:0097602 | cullin family protein binding(GO:0097602) |
| 0.0 | 0.1 | GO:0017056 | structural constituent of nuclear pore(GO:0017056) |
| 0.0 | 0.2 | GO:0043225 | anion transmembrane-transporting ATPase activity(GO:0043225) |
| 0.0 | 0.2 | GO:0000268 | peroxisome targeting sequence binding(GO:0000268) |
| 0.0 | 0.4 | GO:0008327 | methyl-CpG binding(GO:0008327) |
| 0.0 | 0.8 | GO:0030507 | spectrin binding(GO:0030507) |
| 0.0 | 0.1 | GO:0004720 | protein-lysine 6-oxidase activity(GO:0004720) |
| 0.0 | 0.2 | GO:0008253 | 5'-nucleotidase activity(GO:0008253) |
| 0.0 | 0.3 | GO:0005337 | nucleoside transmembrane transporter activity(GO:0005337) |
Gene overrepresentation in curated gene sets: canonical pathways category:
| Log-likelihood per target | Total log-likelihood | Term | Description |
|---|---|---|---|
| 0.1 | 4.7 | PID HES HEY PATHWAY | Notch-mediated HES/HEY network |
| 0.0 | 1.4 | PID ANTHRAX PATHWAY | Cellular roles of Anthrax toxin |
| 0.0 | 2.0 | PID LIS1 PATHWAY | Lissencephaly gene (LIS1) in neuronal migration and development |
| 0.0 | 1.1 | SA TRKA RECEPTOR | The TrkA receptor binds nerve growth factor to activate MAP kinase pathways and promote cell growth. |
| 0.0 | 0.8 | PID HIF1A PATHWAY | Hypoxic and oxygen homeostasis regulation of HIF-1-alpha |
| 0.0 | 2.7 | PID AJDISS 2PATHWAY | Posttranslational regulation of adherens junction stability and dissassembly |
| 0.0 | 1.4 | PID ATM PATHWAY | ATM pathway |
| 0.0 | 2.0 | PID CERAMIDE PATHWAY | Ceramide signaling pathway |
| 0.0 | 0.5 | PID DNA PK PATHWAY | DNA-PK pathway in nonhomologous end joining |
| 0.0 | 0.7 | PID WNT CANONICAL PATHWAY | Canonical Wnt signaling pathway |
| 0.0 | 0.9 | PID P38 MK2 PATHWAY | p38 signaling mediated by MAPKAP kinases |
| 0.0 | 1.0 | PID AURORA A PATHWAY | Aurora A signaling |
| 0.0 | 0.6 | PID BARD1 PATHWAY | BARD1 signaling events |
| 0.0 | 0.2 | PID RAC1 PATHWAY | RAC1 signaling pathway |
| 0.0 | 0.3 | PID NFAT 3PATHWAY | Role of Calcineurin-dependent NFAT signaling in lymphocytes |
| 0.0 | 0.7 | PID AURORA B PATHWAY | Aurora B signaling |
| 0.0 | 1.1 | PID AR TF PATHWAY | Regulation of Androgen receptor activity |
| 0.0 | 0.8 | SIG REGULATION OF THE ACTIN CYTOSKELETON BY RHO GTPASES | Genes related to regulation of the actin cytoskeleton |
| 0.0 | 0.3 | PID MYC PATHWAY | C-MYC pathway |
Gene overrepresentation in curated gene sets: REACTOME pathways category:
| Log-likelihood per target | Total log-likelihood | Term | Description |
|---|---|---|---|
| 0.2 | 3.3 | REACTOME METABOLISM OF POLYAMINES | Genes involved in Metabolism of polyamines |
| 0.1 | 2.0 | REACTOME REVERSIBLE HYDRATION OF CARBON DIOXIDE | Genes involved in Reversible Hydration of Carbon Dioxide |
| 0.1 | 3.1 | REACTOME SYNTHESIS SECRETION AND INACTIVATION OF GIP | Genes involved in Synthesis, Secretion, and Inactivation of Glucose-dependent Insulinotropic Polypeptide (GIP) |
| 0.1 | 2.0 | REACTOME GLYCOGEN BREAKDOWN GLYCOGENOLYSIS | Genes involved in Glycogen breakdown (glycogenolysis) |
| 0.1 | 1.2 | REACTOME PURINE RIBONUCLEOSIDE MONOPHOSPHATE BIOSYNTHESIS | Genes involved in Purine ribonucleoside monophosphate biosynthesis |
| 0.1 | 1.4 | REACTOME REGULATION OF RHEB GTPASE ACTIVITY BY AMPK | Genes involved in Regulation of Rheb GTPase activity by AMPK |
| 0.1 | 3.1 | REACTOME AMINE LIGAND BINDING RECEPTORS | Genes involved in Amine ligand-binding receptors |
| 0.1 | 0.9 | REACTOME ABACAVIR TRANSPORT AND METABOLISM | Genes involved in Abacavir transport and metabolism |
| 0.0 | 1.8 | REACTOME ACTIVATED TAK1 MEDIATES P38 MAPK ACTIVATION | Genes involved in activated TAK1 mediates p38 MAPK activation |
| 0.0 | 1.5 | REACTOME METABOLISM OF PORPHYRINS | Genes involved in Metabolism of porphyrins |
| 0.0 | 1.8 | REACTOME PEROXISOMAL LIPID METABOLISM | Genes involved in Peroxisomal lipid metabolism |
| 0.0 | 1.0 | REACTOME NFKB ACTIVATION THROUGH FADD RIP1 PATHWAY MEDIATED BY CASPASE 8 AND10 | Genes involved in NF-kB activation through FADD/RIP-1 pathway mediated by caspase-8 and -10 |
| 0.0 | 0.9 | REACTOME NEGATIVE REGULATION OF THE PI3K AKT NETWORK | Genes involved in Negative regulation of the PI3K/AKT network |
| 0.0 | 1.6 | REACTOME RAS ACTIVATION UOPN CA2 INFUX THROUGH NMDA RECEPTOR | Genes involved in Ras activation uopn Ca2+ infux through NMDA receptor |
| 0.0 | 0.8 | REACTOME REGULATION OF PYRUVATE DEHYDROGENASE PDH COMPLEX | Genes involved in Regulation of pyruvate dehydrogenase (PDH) complex |
| 0.0 | 1.0 | REACTOME BRANCHED CHAIN AMINO ACID CATABOLISM | Genes involved in Branched-chain amino acid catabolism |
| 0.0 | 0.8 | REACTOME ACYL CHAIN REMODELLING OF PI | Genes involved in Acyl chain remodelling of PI |
| 0.0 | 0.5 | REACTOME PYRUVATE METABOLISM | Genes involved in Pyruvate metabolism |
| 0.0 | 0.9 | REACTOME RETROGRADE NEUROTROPHIN SIGNALLING | Genes involved in Retrograde neurotrophin signalling |
| 0.0 | 2.6 | REACTOME NCAM1 INTERACTIONS | Genes involved in NCAM1 interactions |
| 0.0 | 0.8 | REACTOME DEPOSITION OF NEW CENPA CONTAINING NUCLEOSOMES AT THE CENTROMERE | Genes involved in Deposition of New CENPA-containing Nucleosomes at the Centromere |
| 0.0 | 0.0 | REACTOME CIRCADIAN REPRESSION OF EXPRESSION BY REV ERBA | Genes involved in Circadian Repression of Expression by REV-ERBA |
| 0.0 | 2.1 | REACTOME NETRIN1 SIGNALING | Genes involved in Netrin-1 signaling |
| 0.0 | 0.6 | REACTOME SYNTHESIS OF GLYCOSYLPHOSPHATIDYLINOSITOL GPI | Genes involved in Synthesis of glycosylphosphatidylinositol (GPI) |
| 0.0 | 0.8 | REACTOME CASPASE MEDIATED CLEAVAGE OF CYTOSKELETAL PROTEINS | Genes involved in Caspase-mediated cleavage of cytoskeletal proteins |
| 0.0 | 0.5 | REACTOME ERKS ARE INACTIVATED | Genes involved in ERKs are inactivated |
| 0.0 | 1.9 | REACTOME RESPIRATORY ELECTRON TRANSPORT | Genes involved in Respiratory electron transport |
| 0.0 | 0.9 | REACTOME TERMINATION OF O GLYCAN BIOSYNTHESIS | Genes involved in Termination of O-glycan biosynthesis |
| 0.0 | 0.5 | REACTOME REGULATION OF GENE EXPRESSION IN BETA CELLS | Genes involved in Regulation of gene expression in beta cells |
| 0.0 | 1.1 | REACTOME INHIBITION OF VOLTAGE GATED CA2 CHANNELS VIA GBETA GAMMA SUBUNITS | Genes involved in Inhibition of voltage gated Ca2+ channels via Gbeta/gamma subunits |
| 0.0 | 0.5 | REACTOME NGF SIGNALLING VIA TRKA FROM THE PLASMA MEMBRANE | Genes involved in NGF signalling via TRKA from the plasma membrane |
| 0.0 | 0.5 | REACTOME MITOCHONDRIAL TRNA AMINOACYLATION | Genes involved in Mitochondrial tRNA aminoacylation |
| 0.0 | 0.5 | REACTOME GAP JUNCTION ASSEMBLY | Genes involved in Gap junction assembly |
| 0.0 | 0.8 | REACTOME OXYGEN DEPENDENT PROLINE HYDROXYLATION OF HYPOXIA INDUCIBLE FACTOR ALPHA | Genes involved in Oxygen-dependent Proline Hydroxylation of Hypoxia-inducible Factor Alpha |
| 0.0 | 1.0 | REACTOME INTERACTION BETWEEN L1 AND ANKYRINS | Genes involved in Interaction between L1 and Ankyrins |
| 0.0 | 2.1 | REACTOME MITOTIC PROMETAPHASE | Genes involved in Mitotic Prometaphase |
| 0.0 | 0.7 | REACTOME GABA A RECEPTOR ACTIVATION | Genes involved in GABA A receptor activation |
| 0.0 | 0.6 | REACTOME SYNTHESIS AND INTERCONVERSION OF NUCLEOTIDE DI AND TRIPHOSPHATES | Genes involved in Synthesis and interconversion of nucleotide di- and triphosphates |
| 0.0 | 0.3 | REACTOME ORGANIC CATION ANION ZWITTERION TRANSPORT | Genes involved in Organic cation/anion/zwitterion transport |
| 0.0 | 0.3 | REACTOME NEF MEDIATED DOWNREGULATION OF MHC CLASS I COMPLEX CELL SURFACE EXPRESSION | Genes involved in Nef mediated downregulation of MHC class I complex cell surface expression |
| 0.0 | 2.8 | REACTOME TRANSPORT OF INORGANIC CATIONS ANIONS AND AMINO ACIDS OLIGOPEPTIDES | Genes involved in Transport of inorganic cations/anions and amino acids/oligopeptides |
| 0.0 | 0.4 | REACTOME INTRINSIC PATHWAY | Genes involved in Intrinsic Pathway |
| 0.0 | 0.5 | REACTOME HOMOLOGOUS RECOMBINATION REPAIR OF REPLICATION INDEPENDENT DOUBLE STRAND BREAKS | Genes involved in Homologous recombination repair of replication-independent double-strand breaks |
| 0.0 | 0.8 | REACTOME ION TRANSPORT BY P TYPE ATPASES | Genes involved in Ion transport by P-type ATPases |
| 0.0 | 0.5 | REACTOME SIGNALING BY NODAL | Genes involved in Signaling by NODAL |
| 0.0 | 1.0 | REACTOME GLUCOSE METABOLISM | Genes involved in Glucose metabolism |