Project
Illumina Body Map 2 (GSE30611)
Navigation
Downloads
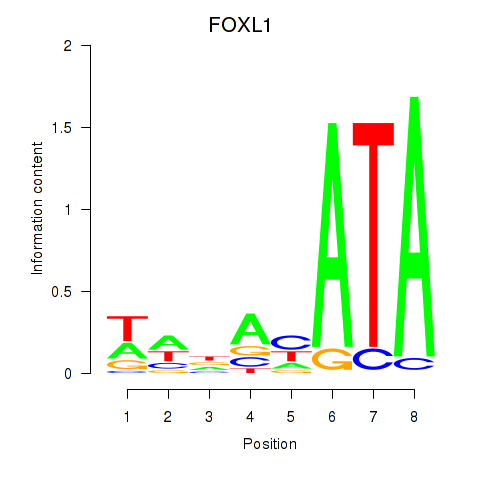
Results for FOXL1
Z-value: 2.78
Motif logo
Transcription factors associated with FOXL1
| Gene Symbol | Gene ID | Gene Info |
|---|---|---|
|
FOXL1
|
ENSG00000176678.6 | forkhead box L1 |
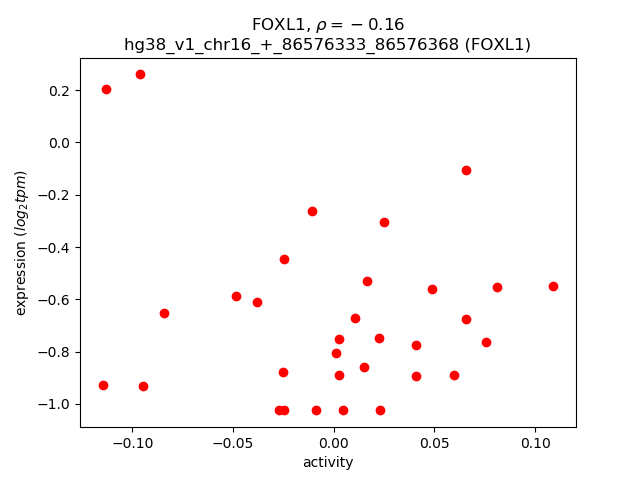
Activity-expression correlation:
| Gene | Promoter | Pearson corr. coef. | P-value | Plot |
|---|---|---|---|---|
| FOXL1 | hg38_v1_chr16_+_86576333_86576368 | -0.16 | 3.7e-01 | Click! |
Activity profile of FOXL1 motif
Sorted Z-values of FOXL1 motif
| Promoter | Log-likelihood | Transcript | Gene | Gene Info |
|---|---|---|---|---|
| chr14_-_106360320 | 17.66 |
ENST00000390615.2
|
IGHV3-33
|
immunoglobulin heavy variable 3-33 |
| chr2_-_89222461 | 12.85 |
ENST00000482769.1
|
IGKV2-28
|
immunoglobulin kappa variable 2-28 |
| chr4_-_99321362 | 12.62 |
ENST00000625860.2
ENST00000305046.13 ENST00000506651.5 |
ADH1B
|
alcohol dehydrogenase 1B (class I), beta polypeptide |
| chr4_-_70666961 | 12.57 |
ENST00000510437.5
|
JCHAIN
|
joining chain of multimeric IgA and IgM |
| chr4_-_70666492 | 10.99 |
ENST00000254801.9
ENST00000391614.7 |
JCHAIN
|
joining chain of multimeric IgA and IgM |
| chr4_-_99352730 | 10.92 |
ENST00000510055.5
ENST00000515683.6 ENST00000511397.3 |
ADH1C
|
alcohol dehydrogenase 1C (class I), gamma polypeptide |
| chr2_-_88947820 | 10.76 |
ENST00000496168.1
|
IGKV1-5
|
immunoglobulin kappa variable 1-5 |
| chr2_+_89936859 | 10.48 |
ENST00000474213.1
|
IGKV2D-30
|
immunoglobulin kappa variable 2D-30 |
| chr4_-_99352754 | 9.64 |
ENST00000639454.1
|
ADH1B
|
alcohol dehydrogenase 1B (class I), beta polypeptide |
| chr2_+_88885397 | 9.56 |
ENST00000390243.2
|
IGKV4-1
|
immunoglobulin kappa variable 4-1 |
| chr7_+_80626148 | 9.35 |
ENST00000428497.5
|
CD36
|
CD36 molecule |
| chr8_-_81483226 | 9.17 |
ENST00000256104.5
|
FABP4
|
fatty acid binding protein 4 |
| chr2_+_90220727 | 8.80 |
ENST00000471857.2
|
IGKV1D-8
|
immunoglobulin kappa variable 1D-8 |
| chr2_-_89320146 | 8.38 |
ENST00000498574.1
|
IGKV1-39
|
immunoglobulin kappa variable 1-39 |
| chr7_+_142791635 | 8.28 |
ENST00000633705.1
|
TRBC1
|
T cell receptor beta constant 1 |
| chr1_+_116754422 | 8.08 |
ENST00000369478.4
ENST00000369477.1 |
CD2
|
CD2 molecule |
| chr3_+_157436842 | 8.02 |
ENST00000295927.4
|
PTX3
|
pentraxin 3 |
| chr14_-_106062670 | 7.88 |
ENST00000390598.2
|
IGHV3-7
|
immunoglobulin heavy variable 3-7 |
| chr2_-_89245596 | 7.82 |
ENST00000468494.1
|
IGKV2-30
|
immunoglobulin kappa variable 2-30 |
| chr14_-_106675544 | 7.68 |
ENST00000390632.2
|
IGHV3-66
|
immunoglobulin heavy variable 3-66 |
| chr14_-_106511856 | 7.57 |
ENST00000390622.2
|
IGHV1-46
|
immunoglobulin heavy variable 1-46 |
| chr2_-_89160329 | 7.53 |
ENST00000390256.2
|
IGKV6-21
|
immunoglobulin kappa variable 6-21 (non-functional) |
| chr12_+_69348372 | 7.53 |
ENST00000261267.7
ENST00000549690.1 ENST00000548839.1 |
LYZ
|
lysozyme |
| chr14_-_106593319 | 7.52 |
ENST00000390627.3
|
IGHV3-53
|
immunoglobulin heavy variable 3-53 |
| chr2_+_89862438 | 7.44 |
ENST00000448155.2
|
IGKV1D-39
|
immunoglobulin kappa variable 1D-39 |
| chr14_-_105987068 | 7.00 |
ENST00000390594.3
|
IGHV1-2
|
immunoglobulin heavy variable 1-2 |
| chr22_+_22900976 | 6.85 |
ENST00000390323.2
|
IGLC2
|
immunoglobulin lambda constant 2 |
| chr14_-_106185387 | 6.67 |
ENST00000390605.2
|
IGHV1-18
|
immunoglobulin heavy variable 1-18 |
| chr2_+_90154073 | 6.54 |
ENST00000611391.1
|
IGKV1D-13
|
immunoglobulin kappa variable 1D-13 |
| chr14_-_106269133 | 6.49 |
ENST00000390609.3
|
IGHV3-23
|
immunoglobulin heavy variable 3-23 |
| chr9_-_92482499 | 6.45 |
ENST00000375544.7
|
ASPN
|
asporin |
| chr9_-_92482350 | 6.45 |
ENST00000375543.2
|
ASPN
|
asporin |
| chr14_-_106538331 | 6.44 |
ENST00000390624.3
|
IGHV3-48
|
immunoglobulin heavy variable 3-48 |
| chr22_+_22395005 | 6.39 |
ENST00000390298.2
|
IGLV7-43
|
immunoglobulin lambda variable 7-43 |
| chr3_+_151814102 | 6.35 |
ENST00000232892.12
|
AADAC
|
arylacetamide deacetylase |
| chr14_-_106803221 | 6.34 |
ENST00000390636.2
|
IGHV3-73
|
immunoglobulin heavy variable 3-73 |
| chr14_-_106025628 | 6.23 |
ENST00000631943.1
|
IGHV7-4-1
|
immunoglobulin heavy variable 7-4-1 |
| chr14_-_106335613 | 6.23 |
ENST00000603660.1
|
IGHV3-30
|
immunoglobulin heavy variable 3-30 |
| chr14_-_106005574 | 6.18 |
ENST00000390595.3
|
IGHV1-3
|
immunoglobulin heavy variable 1-3 |
| chr7_+_80646436 | 6.04 |
ENST00000419819.2
|
CD36
|
CD36 molecule |
| chr2_-_89100352 | 5.95 |
ENST00000479981.1
|
IGKV1-16
|
immunoglobulin kappa variable 1-16 |
| chr2_+_89913982 | 5.94 |
ENST00000390265.2
|
IGKV1D-33
|
immunoglobulin kappa variable 1D-33 |
| chr2_-_88992903 | 5.82 |
ENST00000495489.1
|
IGKV1-8
|
immunoglobulin kappa variable 1-8 |
| chr17_+_36064265 | 5.73 |
ENST00000616054.2
|
CCL18
|
C-C motif chemokine ligand 18 |
| chr2_-_89143133 | 5.68 |
ENST00000492167.1
|
IGKV3-20
|
immunoglobulin kappa variable 3-20 |
| chr16_+_56961942 | 5.66 |
ENST00000200676.8
ENST00000566128.1 |
CETP
|
cholesteryl ester transfer protein |
| chr5_+_157180816 | 5.63 |
ENST00000422843.8
|
ITK
|
IL2 inducible T cell kinase |
| chr5_+_55102635 | 5.43 |
ENST00000274306.7
|
GZMA
|
granzyme A |
| chr2_-_150487658 | 5.38 |
ENST00000375734.6
ENST00000263895.9 ENST00000454202.5 |
RND3
|
Rho family GTPase 3 |
| chr4_-_99290975 | 5.34 |
ENST00000209668.3
|
ADH1A
|
alcohol dehydrogenase 1A (class I), alpha polypeptide |
| chr4_-_70666884 | 5.34 |
ENST00000510614.5
|
JCHAIN
|
joining chain of multimeric IgA and IgM |
| chr2_-_89213917 | 5.11 |
ENST00000498435.1
|
IGKV1-27
|
immunoglobulin kappa variable 1-27 |
| chr14_-_106470788 | 5.08 |
ENST00000434710.1
|
IGHV3-43
|
immunoglobulin heavy variable 3-43 |
| chr5_-_43043170 | 5.08 |
ENST00000314890.3
|
ANXA2R
|
annexin A2 receptor |
| chr2_+_90004792 | 4.94 |
ENST00000462693.1
|
IGKV2D-24
|
immunoglobulin kappa variable 2D-24 (non-functional) |
| chr1_-_237945275 | 4.91 |
ENST00000604646.1
|
MTRNR2L11
|
MT-RNR2 like 11 |
| chr2_-_89268506 | 4.77 |
ENST00000473726.1
|
IGKV1-33
|
immunoglobulin kappa variable 1-33 |
| chr7_+_80624071 | 4.74 |
ENST00000438020.5
|
CD36
|
CD36 molecule |
| chr2_-_89117844 | 4.73 |
ENST00000490686.1
|
IGKV1-17
|
immunoglobulin kappa variable 1-17 |
| chr14_-_106349792 | 4.73 |
ENST00000438142.3
|
IGHV4-31
|
immunoglobulin heavy variable 4-31 |
| chr2_+_188974364 | 4.69 |
ENST00000304636.9
ENST00000317840.9 |
COL3A1
|
collagen type III alpha 1 chain |
| chr14_-_106811131 | 4.57 |
ENST00000424969.2
|
IGHV3-74
|
immunoglobulin heavy variable 3-74 |
| chr4_-_83114715 | 4.56 |
ENST00000426923.2
ENST00000311507.9 ENST00000509973.5 |
PLAC8
|
placenta associated 8 |
| chr22_+_22686724 | 4.55 |
ENST00000390305.2
|
IGLV3-25
|
immunoglobulin lambda variable 3-25 |
| chr22_+_22369601 | 4.43 |
ENST00000390295.3
|
IGLV7-46
|
immunoglobulin lambda variable 7-46 |
| chr9_-_92482461 | 4.41 |
ENST00000651738.1
|
ASPN
|
asporin |
| chr2_+_89959979 | 4.40 |
ENST00000453166.2
|
IGKV2D-28
|
immunoglobulin kappa variable 2D-28 |
| chr3_+_151814069 | 4.34 |
ENST00000488869.1
|
AADAC
|
arylacetamide deacetylase |
| chr11_-_5227063 | 4.23 |
ENST00000335295.4
ENST00000485743.1 ENST00000647020.1 |
HBB
|
hemoglobin subunit beta |
| chr2_+_90114838 | 4.19 |
ENST00000417279.3
|
IGKV3D-15
|
immunoglobulin kappa variable 3D-15 |
| chr14_-_106557465 | 4.16 |
ENST00000390625.3
|
IGHV3-49
|
immunoglobulin heavy variable 3-49 |
| chr13_-_37598750 | 4.16 |
ENST00000379743.8
ENST00000379742.4 ENST00000379749.8 ENST00000379747.9 ENST00000541179.5 ENST00000541481.5 |
POSTN
|
periostin |
| chr14_-_106235582 | 4.08 |
ENST00000390607.2
|
IGHV3-21
|
immunoglobulin heavy variable 3-21 |
| chr22_+_22380766 | 4.08 |
ENST00000390297.3
|
IGLV1-44
|
immunoglobulin lambda variable 1-44 |
| chr17_-_445939 | 4.07 |
ENST00000329099.4
|
RFLNB
|
refilin B |
| chr16_-_3372666 | 4.01 |
ENST00000399974.5
|
MTRNR2L4
|
MT-RNR2 like 4 |
| chr7_+_134843884 | 3.96 |
ENST00000445569.6
|
CALD1
|
caldesmon 1 |
| chr22_+_22322452 | 3.96 |
ENST00000390290.3
|
IGLV1-51
|
immunoglobulin lambda variable 1-51 |
| chr1_+_160739265 | 3.85 |
ENST00000368042.7
|
SLAMF7
|
SLAM family member 7 |
| chr12_+_59689337 | 3.85 |
ENST00000261187.8
|
SLC16A7
|
solute carrier family 16 member 7 |
| chr14_-_106422175 | 3.77 |
ENST00000390619.2
|
IGHV4-39
|
immunoglobulin heavy variable 4-39 |
| chr14_-_106791226 | 3.77 |
ENST00000433072.2
|
IGHV3-72
|
immunoglobulin heavy variable 3-72 |
| chr2_-_89177160 | 3.68 |
ENST00000484817.1
|
IGKV2-24
|
immunoglobulin kappa variable 2-24 |
| chr6_-_130890393 | 3.68 |
ENST00000456097.6
|
EPB41L2
|
erythrocyte membrane protein band 4.1 like 2 |
| chr7_-_38249572 | 3.67 |
ENST00000436911.6
|
TRGC2
|
T cell receptor gamma constant 2 |
| chr2_+_89947508 | 3.66 |
ENST00000491977.1
|
IGKV2D-29
|
immunoglobulin kappa variable 2D-29 |
| chr14_-_106639589 | 3.66 |
ENST00000390630.3
|
IGHV4-61
|
immunoglobulin heavy variable 4-61 |
| chr1_+_160739286 | 3.65 |
ENST00000359331.8
ENST00000495334.1 |
SLAMF7
|
SLAM family member 7 |
| chr12_-_9116223 | 3.62 |
ENST00000404455.2
|
A2M
|
alpha-2-macroglobulin |
| chr7_+_80646305 | 3.60 |
ENST00000426978.5
ENST00000432207.5 |
CD36
|
CD36 molecule |
| chr8_-_85378105 | 3.60 |
ENST00000521846.5
ENST00000523022.6 ENST00000524324.5 ENST00000519991.5 ENST00000520663.5 ENST00000517590.5 ENST00000522579.5 ENST00000522814.5 ENST00000522662.5 ENST00000523858.5 ENST00000519129.5 |
CA1
|
carbonic anhydrase 1 |
| chr14_-_106324743 | 3.59 |
ENST00000390612.3
|
IGHV4-28
|
immunoglobulin heavy variable 4-28 |
| chr12_-_11310420 | 3.50 |
ENST00000621732.4
ENST00000445719.2 ENST00000279575.7 |
PRB4
|
proline rich protein BstNI subfamily 4 |
| chr2_-_187554351 | 3.49 |
ENST00000437725.5
ENST00000409676.5 ENST00000233156.9 ENST00000339091.8 ENST00000420747.1 |
TFPI
|
tissue factor pathway inhibitor |
| chr2_+_90159840 | 3.43 |
ENST00000377032.5
|
IGKV1D-12
|
immunoglobulin kappa variable 1D-12 |
| chr10_-_5003850 | 3.39 |
ENST00000421196.7
ENST00000455190.2 ENST00000380753.8 |
AKR1C2
|
aldo-keto reductase family 1 member C2 |
| chr9_-_115091018 | 3.38 |
ENST00000542877.5
ENST00000537320.5 ENST00000341037.8 |
TNC
|
tenascin C |
| chr13_-_110242694 | 3.38 |
ENST00000648989.1
ENST00000647797.1 ENST00000648966.1 ENST00000649484.1 ENST00000648695.1 ENST00000650115.1 ENST00000650566.1 |
COL4A1
|
collagen type IV alpha 1 chain |
| chr12_-_91180365 | 3.31 |
ENST00000547937.5
|
DCN
|
decorin |
| chr14_-_106154113 | 3.29 |
ENST00000390603.2
|
IGHV3-15
|
immunoglobulin heavy variable 3-15 |
| chr1_+_207770322 | 3.28 |
ENST00000462968.2
|
CD46
|
CD46 molecule |
| chr1_+_158931539 | 3.27 |
ENST00000368140.6
ENST00000368138.7 ENST00000392254.6 ENST00000392252.7 ENST00000368135.4 |
PYHIN1
|
pyrin and HIN domain family member 1 |
| chr3_-_146528750 | 3.27 |
ENST00000483300.5
|
PLSCR1
|
phospholipid scramblase 1 |
| chr14_-_106277039 | 3.22 |
ENST00000390610.2
|
IGHV1-24
|
immunoglobulin heavy variable 1-24 |
| chr12_-_91179472 | 3.14 |
ENST00000550099.5
ENST00000546391.5 |
DCN
|
decorin |
| chr2_-_227717981 | 3.09 |
ENST00000409456.2
ENST00000409287.5 ENST00000644224.2 ENST00000456524.6 |
SLC19A3
|
solute carrier family 19 member 3 |
| chr1_-_160523204 | 3.09 |
ENST00000368055.1
ENST00000368057.8 ENST00000368059.7 |
SLAMF6
|
SLAM family member 6 |
| chr9_+_110048598 | 3.07 |
ENST00000434623.6
ENST00000374525.5 |
PALM2AKAP2
|
PALM2 and AKAP2 fusion |
| chr2_+_113406368 | 3.07 |
ENST00000453673.3
|
IGKV1OR2-108
|
immunoglobulin kappa variable 1/OR2-108 (non-functional) |
| chr2_+_188991663 | 3.05 |
ENST00000450867.1
|
COL3A1
|
collagen type III alpha 1 chain |
| chr2_+_90021567 | 3.05 |
ENST00000436451.2
|
IGKV6D-21
|
immunoglobulin kappa variable 6D-21 (non-functional) |
| chr8_+_24384455 | 3.02 |
ENST00000522298.1
|
ADAMDEC1
|
ADAM like decysin 1 |
| chr1_-_79188467 | 3.02 |
ENST00000656300.1
|
ADGRL4
|
adhesion G protein-coupled receptor L4 |
| chr14_-_106658251 | 3.02 |
ENST00000454421.2
|
IGHV3-64
|
immunoglobulin heavy variable 3-64 |
| chr12_-_91153149 | 3.02 |
ENST00000550758.1
|
DCN
|
decorin |
| chr3_-_172523460 | 2.97 |
ENST00000420541.6
|
TNFSF10
|
TNF superfamily member 10 |
| chr14_-_105940235 | 2.95 |
ENST00000390593.2
|
IGHV6-1
|
immunoglobulin heavy variable 6-1 |
| chr12_-_10388976 | 2.94 |
ENST00000540818.5
|
KLRK1
|
killer cell lectin like receptor K1 |
| chr15_-_79971164 | 2.90 |
ENST00000335661.6
ENST00000267953.4 ENST00000677151.1 |
BCL2A1
|
BCL2 related protein A1 |
| chr2_+_90234809 | 2.89 |
ENST00000443397.5
|
IGKV3D-7
|
immunoglobulin kappa variable 3D-7 |
| chr15_-_21718245 | 2.88 |
ENST00000630556.1
|
ENSG00000281179.1
|
novel gene identicle to IGHV1OR15-1 |
| chr1_-_157552455 | 2.87 |
ENST00000368190.7
ENST00000368189.3 |
FCRL5
|
Fc receptor like 5 |
| chr6_+_32741382 | 2.85 |
ENST00000374940.4
|
HLA-DQA2
|
major histocompatibility complex, class II, DQ alpha 2 |
| chr3_-_172523423 | 2.84 |
ENST00000241261.7
|
TNFSF10
|
TNF superfamily member 10 |
| chr16_+_56961917 | 2.83 |
ENST00000379780.6
|
CETP
|
cholesteryl ester transfer protein |
| chr3_+_8501846 | 2.83 |
ENST00000454244.4
|
LMCD1
|
LIM and cysteine rich domains 1 |
| chr6_+_33080445 | 2.82 |
ENST00000428835.5
|
HLA-DPB1
|
major histocompatibility complex, class II, DP beta 1 |
| chr21_-_14658812 | 2.81 |
ENST00000647101.1
|
SAMSN1
|
SAM domain, SH3 domain and nuclear localization signals 1 |
| chr16_+_72056153 | 2.80 |
ENST00000576168.6
ENST00000567185.7 ENST00000567612.2 |
HP
|
haptoglobin |
| chr11_-_105035113 | 2.79 |
ENST00000526568.5
ENST00000531166.5 ENST00000534497.5 ENST00000527979.5 ENST00000533400.6 ENST00000528974.1 ENST00000525825.5 ENST00000353247.9 ENST00000446369.5 ENST00000436863.7 |
CASP1
|
caspase 1 |
| chr8_-_85341705 | 2.73 |
ENST00000517618.5
|
CA1
|
carbonic anhydrase 1 |
| chr7_-_93890744 | 2.72 |
ENST00000650573.1
ENST00000222543.11 ENST00000649913.1 ENST00000647793.1 |
TFPI2
|
tissue factor pathway inhibitor 2 |
| chr13_-_44474250 | 2.72 |
ENST00000472477.1
|
TSC22D1
|
TSC22 domain family member 1 |
| chr4_+_67558719 | 2.70 |
ENST00000265404.7
ENST00000396225.1 |
STAP1
|
signal transducing adaptor family member 1 |
| chr13_+_110305806 | 2.69 |
ENST00000400163.7
|
COL4A2
|
collagen type IV alpha 2 chain |
| chr14_+_21868822 | 2.69 |
ENST00000390436.2
|
TRAV13-1
|
T cell receptor alpha variable 13-1 |
| chr8_+_24384275 | 2.68 |
ENST00000256412.8
|
ADAMDEC1
|
ADAM like decysin 1 |
| chr3_-_183555696 | 2.67 |
ENST00000341319.8
|
KLHL6
|
kelch like family member 6 |
| chr3_-_149377637 | 2.65 |
ENST00000305366.8
|
TM4SF1
|
transmembrane 4 L six family member 1 |
| chr1_-_157777124 | 2.65 |
ENST00000361516.8
ENST00000368181.4 |
FCRL2
|
Fc receptor like 2 |
| chr19_+_3762705 | 2.63 |
ENST00000589174.1
|
MRPL54
|
mitochondrial ribosomal protein L54 |
| chr7_+_142469521 | 2.62 |
ENST00000390371.3
|
TRBV6-6
|
T cell receptor beta variable 6-6 |
| chr3_+_12351493 | 2.62 |
ENST00000683699.1
|
PPARG
|
peroxisome proliferator activated receptor gamma |
| chr16_-_33845229 | 2.61 |
ENST00000569103.2
|
IGHV3OR16-17
|
immunoglobulin heavy variable 3/OR16-17 (non-functional) |
| chr3_+_12351470 | 2.61 |
ENST00000287820.10
|
PPARG
|
peroxisome proliferator activated receptor gamma |
| chr7_+_80638662 | 2.60 |
ENST00000394788.7
|
CD36
|
CD36 molecule |
| chr7_+_142529268 | 2.58 |
ENST00000612787.1
|
TRBV7-9
|
T cell receptor beta variable 7-9 |
| chr1_+_86468902 | 2.58 |
ENST00000394711.2
|
CLCA1
|
chloride channel accessory 1 |
| chr1_+_196819731 | 2.58 |
ENST00000320493.10
ENST00000367424.4 |
CFHR1
|
complement factor H related 1 |
| chr2_-_227714589 | 2.57 |
ENST00000258403.8
|
SLC19A3
|
solute carrier family 19 member 3 |
| chr2_-_162152404 | 2.56 |
ENST00000375497.3
|
GCG
|
glucagon |
| chr14_-_106165730 | 2.54 |
ENST00000390604.2
|
IGHV3-16
|
immunoglobulin heavy variable 3-16 (non-functional) |
| chr14_-_106622837 | 2.54 |
ENST00000390628.3
|
IGHV1-58
|
immunoglobulin heavy variable 1-58 |
| chr8_-_85341659 | 2.52 |
ENST00000522389.5
|
CA1
|
carbonic anhydrase 1 |
| chr4_-_80073057 | 2.52 |
ENST00000681710.1
|
ANTXR2
|
ANTXR cell adhesion molecule 2 |
| chr19_-_11577632 | 2.51 |
ENST00000590420.1
ENST00000648477.1 |
ACP5
|
acid phosphatase 5, tartrate resistant |
| chr22_+_39901075 | 2.49 |
ENST00000344138.9
|
GRAP2
|
GRB2 related adaptor protein 2 |
| chrX_+_100584928 | 2.46 |
ENST00000373031.5
|
TNMD
|
tenomodulin |
| chr15_-_21742799 | 2.46 |
ENST00000622410.2
|
ENSG00000278263.2
|
novel protein, identical to IGHV4-4 |
| chr14_+_21841182 | 2.45 |
ENST00000390433.1
|
TRAV12-1
|
T cell receptor alpha variable 12-1 |
| chr7_-_20217342 | 2.42 |
ENST00000400331.10
ENST00000332878.8 |
MACC1
|
MET transcriptional regulator MACC1 |
| chr17_+_42854078 | 2.42 |
ENST00000591562.1
ENST00000588033.1 |
AOC3
|
amine oxidase copper containing 3 |
| chr3_-_149221811 | 2.42 |
ENST00000455472.3
ENST00000264613.11 |
CP
|
ceruloplasmin |
| chr1_+_206897435 | 2.41 |
ENST00000391929.7
ENST00000294984.7 ENST00000611909.4 ENST00000367093.3 |
IL24
|
interleukin 24 |
| chr9_-_14180779 | 2.41 |
ENST00000380924.1
ENST00000543693.5 |
NFIB
|
nuclear factor I B |
| chr2_-_215375663 | 2.41 |
ENST00000438981.1
|
FN1
|
fibronectin 1 |
| chr17_+_56978111 | 2.41 |
ENST00000262288.8
ENST00000572710.5 ENST00000575395.5 ENST00000631024.1 |
SCPEP1
|
serine carboxypeptidase 1 |
| chr7_-_38300288 | 2.40 |
ENST00000390341.2
|
TRGV10
|
T cell receptor gamma variable 10 (non-functional) |
| chr3_+_108822778 | 2.38 |
ENST00000295756.11
|
TRAT1
|
T cell receptor associated transmembrane adaptor 1 |
| chr3_+_8501807 | 2.36 |
ENST00000426878.2
ENST00000397386.7 ENST00000415597.5 ENST00000157600.8 |
LMCD1
|
LIM and cysteine rich domains 1 |
| chr1_+_186296267 | 2.36 |
ENST00000533951.5
ENST00000367482.8 ENST00000635041.1 ENST00000367483.8 ENST00000367485.4 ENST00000445192.7 |
PRG4
|
proteoglycan 4 |
| chr1_-_89126066 | 2.35 |
ENST00000370466.4
|
GBP2
|
guanylate binding protein 2 |
| chr12_-_91178520 | 2.34 |
ENST00000425043.5
ENST00000420120.6 ENST00000441303.6 ENST00000456569.2 |
DCN
|
decorin |
| chr14_-_106737547 | 2.31 |
ENST00000632209.1
|
IGHV1-69-2
|
immunoglobulin heavy variable 1-69-2 |
| chr2_-_187554473 | 2.31 |
ENST00000453013.5
ENST00000417013.5 |
TFPI
|
tissue factor pathway inhibitor |
| chr6_-_132763424 | 2.27 |
ENST00000532012.1
ENST00000525270.5 ENST00000530536.5 ENST00000524919.5 |
VNN2
|
vanin 2 |
| chr4_-_80073465 | 2.26 |
ENST00000404191.5
|
ANTXR2
|
ANTXR cell adhesion molecule 2 |
| chr2_+_90082635 | 2.26 |
ENST00000483379.1
|
IGKV1D-17
|
immunoglobulin kappa variable 1D-17 |
| chr7_+_80646347 | 2.25 |
ENST00000413265.5
|
CD36
|
CD36 molecule |
| chr1_+_171090892 | 2.24 |
ENST00000367755.9
ENST00000479749.1 |
FMO3
|
flavin containing dimethylaniline monoxygenase 3 |
| chr4_+_77605807 | 2.24 |
ENST00000682537.1
|
CXCL13
|
C-X-C motif chemokine ligand 13 |
| chr11_-_5234475 | 2.24 |
ENST00000292901.7
ENST00000650601.1 ENST00000417377.1 |
HBD
|
hemoglobin subunit delta |
| chr2_-_88128049 | 2.21 |
ENST00000393750.3
ENST00000295834.8 |
FABP1
|
fatty acid binding protein 1 |
| chr11_-_59866478 | 2.20 |
ENST00000257264.4
|
TCN1
|
transcobalamin 1 |
| chr22_+_22162155 | 2.19 |
ENST00000390284.2
|
IGLV4-60
|
immunoglobulin lambda variable 4-60 |
| chr12_-_10098940 | 2.16 |
ENST00000420265.2
|
CLEC1A
|
C-type lectin domain family 1 member A |
| chr14_+_22163226 | 2.16 |
ENST00000390458.3
|
TRAV29DV5
|
T cell receptor alpha variable 29/delta variable 5 |
| chr18_+_44680093 | 2.15 |
ENST00000426838.8
ENST00000677068.1 |
SETBP1
|
SET binding protein 1 |
| chr4_+_168497044 | 2.15 |
ENST00000505667.6
|
PALLD
|
palladin, cytoskeletal associated protein |
| chr4_+_40197023 | 2.14 |
ENST00000381799.10
|
RHOH
|
ras homolog family member H |
| chr10_+_5048748 | 2.13 |
ENST00000602997.5
ENST00000439082.7 |
AKR1C3
|
aldo-keto reductase family 1 member C3 |
| chr7_+_142615710 | 2.13 |
ENST00000611520.1
|
TRBV18
|
T cell receptor beta variable 18 |
| chr1_+_196652022 | 2.12 |
ENST00000367429.9
ENST00000630130.2 ENST00000359637.2 |
CFH
|
complement factor H |
| chr6_-_169253835 | 2.11 |
ENST00000649844.1
ENST00000617924.6 |
THBS2
|
thrombospondin 2 |
| chr12_+_9827472 | 2.11 |
ENST00000617793.4
ENST00000617889.5 ENST00000354855.7 ENST00000279545.7 |
KLRF1
|
killer cell lectin like receptor F1 |
| chr5_-_147831663 | 2.08 |
ENST00000296695.10
|
SPINK1
|
serine peptidase inhibitor Kazal type 1 |
| chr4_+_36281591 | 2.08 |
ENST00000639862.2
ENST00000357504.7 |
DTHD1
|
death domain containing 1 |
| chr16_+_33827140 | 2.07 |
ENST00000562905.2
|
IGHV3OR16-13
|
immunoglobulin heavy variable 3/OR16-13 (non-functional) |
| chr1_-_79188390 | 2.07 |
ENST00000662530.1
|
ADGRL4
|
adhesion G protein-coupled receptor L4 |
| chr4_-_154612635 | 2.07 |
ENST00000407946.5
ENST00000405164.5 ENST00000336098.8 ENST00000393846.6 ENST00000404648.7 ENST00000443553.5 |
FGG
|
fibrinogen gamma chain |
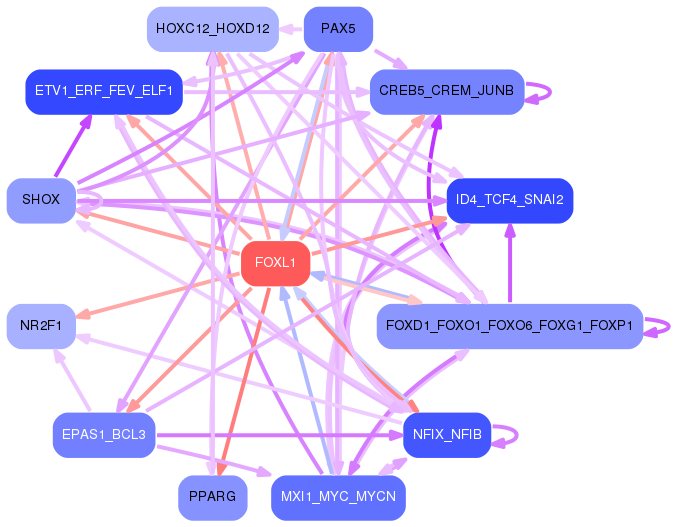
Network of associatons between targets according to the STRING database.

First level regulatory network of FOXL1
Gene Ontology Analysis
Gene overrepresentation in biological process category:
| Log-likelihood per target | Total log-likelihood | Term | Description |
|---|---|---|---|
| 2.7 | 8.0 | GO:1903015 | regulation of exo-alpha-sialidase activity(GO:1903015) |
| 2.6 | 28.9 | GO:0060267 | positive regulation of respiratory burst(GO:0060267) |
| 2.2 | 28.6 | GO:2000334 | response to linoleic acid(GO:0070543) blood microparticle formation(GO:0072564) regulation of blood microparticle formation(GO:2000332) positive regulation of blood microparticle formation(GO:2000334) |
| 2.2 | 17.3 | GO:0070171 | negative regulation of tooth mineralization(GO:0070171) |
| 1.8 | 36.9 | GO:0006069 | ethanol oxidation(GO:0006069) |
| 1.8 | 3.6 | GO:0001868 | regulation of complement activation, lectin pathway(GO:0001868) negative regulation of complement activation, lectin pathway(GO:0001869) |
| 1.8 | 10.8 | GO:0034196 | acylglycerol transport(GO:0034196) triglyceride transport(GO:0034197) |
| 1.8 | 294.3 | GO:0006958 | complement activation, classical pathway(GO:0006958) |
| 1.7 | 1.7 | GO:0035378 | carbon dioxide transmembrane transport(GO:0035378) |
| 1.4 | 4.1 | GO:0061182 | negative regulation of chondrocyte development(GO:0061182) |
| 1.3 | 7.9 | GO:0009753 | response to jasmonic acid(GO:0009753) cellular response to jasmonic acid stimulus(GO:0071395) |
| 1.1 | 5.7 | GO:0071934 | thiamine transmembrane transport(GO:0071934) |
| 1.1 | 3.4 | GO:0060739 | mesenchymal-epithelial cell signaling involved in prostate gland development(GO:0060739) |
| 1.1 | 4.2 | GO:0030185 | nitric oxide transport(GO:0030185) |
| 1.0 | 2.9 | GO:2000502 | negative regulation of natural killer cell chemotaxis(GO:2000502) |
| 0.9 | 2.8 | GO:2000296 | negative regulation of hydrogen peroxide catabolic process(GO:2000296) |
| 0.9 | 2.8 | GO:0050717 | positive regulation of interleukin-1 alpha secretion(GO:0050717) |
| 0.9 | 9.2 | GO:0030885 | regulation of myeloid dendritic cell activation(GO:0030885) |
| 0.9 | 2.7 | GO:1903970 | negative regulation of macrophage colony-stimulating factor signaling pathway(GO:1902227) negative regulation of response to macrophage colony-stimulating factor(GO:1903970) negative regulation of cellular response to macrophage colony-stimulating factor stimulus(GO:1903973) |
| 0.9 | 7.7 | GO:0060414 | aorta smooth muscle tissue morphogenesis(GO:0060414) |
| 0.8 | 4.2 | GO:1990523 | bone regeneration(GO:1990523) |
| 0.8 | 1.7 | GO:0002581 | negative regulation of antigen processing and presentation of peptide or polysaccharide antigen via MHC class II(GO:0002581) |
| 0.8 | 2.4 | GO:1904237 | regulation of substrate-dependent cell migration, cell attachment to substrate(GO:1904235) positive regulation of substrate-dependent cell migration, cell attachment to substrate(GO:1904237) |
| 0.8 | 15.1 | GO:1900747 | negative regulation of vascular endothelial growth factor signaling pathway(GO:1900747) |
| 0.8 | 4.6 | GO:0035948 | positive regulation of gluconeogenesis by positive regulation of transcription from RNA polymerase II promoter(GO:0035948) |
| 0.8 | 3.8 | GO:0010751 | negative regulation of nitric oxide mediated signal transduction(GO:0010751) |
| 0.8 | 10.7 | GO:0010898 | positive regulation of triglyceride catabolic process(GO:0010898) |
| 0.8 | 6.1 | GO:2000230 | negative regulation of pancreatic stellate cell proliferation(GO:2000230) |
| 0.7 | 2.2 | GO:2001027 | negative regulation of endothelial cell chemotaxis(GO:2001027) |
| 0.7 | 6.9 | GO:0007598 | blood coagulation, extrinsic pathway(GO:0007598) |
| 0.7 | 3.4 | GO:0061304 | retinal blood vessel morphogenesis(GO:0061304) |
| 0.7 | 3.3 | GO:2000471 | regulation of hematopoietic stem cell migration(GO:2000471) positive regulation of hematopoietic stem cell migration(GO:2000473) |
| 0.7 | 3.9 | GO:0071461 | cellular response to redox state(GO:0071461) |
| 0.6 | 1.2 | GO:0019836 | hemolysis by symbiont of host erythrocytes(GO:0019836) hemolysis in other organism(GO:0044179) hemolysis in other organism involved in symbiotic interaction(GO:0052331) |
| 0.6 | 4.3 | GO:0001920 | negative regulation of receptor recycling(GO:0001920) |
| 0.6 | 1.2 | GO:0046110 | xanthine metabolic process(GO:0046110) |
| 0.6 | 5.2 | GO:0006659 | phosphatidylserine biosynthetic process(GO:0006659) |
| 0.6 | 2.3 | GO:0002399 | MHC class II protein complex assembly(GO:0002399) |
| 0.6 | 8.1 | GO:1900623 | regulation of monocyte aggregation(GO:1900623) positive regulation of monocyte aggregation(GO:1900625) |
| 0.6 | 0.6 | GO:0032701 | negative regulation of interleukin-18 production(GO:0032701) |
| 0.6 | 1.7 | GO:0070175 | positive regulation of enamel mineralization(GO:0070175) |
| 0.6 | 1.7 | GO:0045082 | positive regulation of interleukin-10 biosynthetic process(GO:0045082) |
| 0.5 | 2.2 | GO:0060708 | spongiotrophoblast differentiation(GO:0060708) |
| 0.5 | 1.6 | GO:1904328 | regulation of myofibroblast contraction(GO:1904328) myofibroblast contraction(GO:1990764) |
| 0.5 | 2.6 | GO:1904073 | regulation of trophectodermal cell proliferation(GO:1904073) positive regulation of trophectodermal cell proliferation(GO:1904075) |
| 0.5 | 4.1 | GO:0010710 | regulation of collagen catabolic process(GO:0010710) |
| 0.5 | 0.5 | GO:0035711 | T-helper 1 cell activation(GO:0035711) |
| 0.5 | 5.0 | GO:0006848 | pyruvate transport(GO:0006848) pyruvate transmembrane transport(GO:1901475) |
| 0.5 | 3.9 | GO:0019732 | antifungal humoral response(GO:0019732) |
| 0.5 | 1.5 | GO:0002314 | germinal center B cell differentiation(GO:0002314) |
| 0.5 | 1.4 | GO:0070563 | negative regulation of vitamin D receptor signaling pathway(GO:0070563) |
| 0.5 | 3.8 | GO:0038172 | interleukin-33-mediated signaling pathway(GO:0038172) |
| 0.5 | 0.9 | GO:0090271 | positive regulation of fibroblast growth factor production(GO:0090271) |
| 0.5 | 1.9 | GO:0043091 | L-arginine import(GO:0043091) arginine import(GO:0090467) |
| 0.5 | 1.9 | GO:2000255 | negative regulation of male germ cell proliferation(GO:2000255) |
| 0.5 | 2.3 | GO:0035026 | leading edge cell differentiation(GO:0035026) |
| 0.5 | 4.1 | GO:0048014 | Tie signaling pathway(GO:0048014) |
| 0.4 | 9.0 | GO:0071285 | cellular response to lithium ion(GO:0071285) |
| 0.4 | 2.6 | GO:2000661 | positive regulation of interleukin-1-mediated signaling pathway(GO:2000661) |
| 0.4 | 5.1 | GO:0060665 | regulation of branching involved in salivary gland morphogenesis by mesenchymal-epithelial signaling(GO:0060665) |
| 0.4 | 1.3 | GO:0002361 | CD4-positive, CD25-positive, alpha-beta regulatory T cell differentiation(GO:0002361) |
| 0.4 | 1.7 | GO:0090119 | vesicle-mediated cholesterol transport(GO:0090119) |
| 0.4 | 0.8 | GO:0036518 | chemorepulsion of dopaminergic neuron axon(GO:0036518) |
| 0.4 | 2.4 | GO:1902283 | negative regulation of primary amine oxidase activity(GO:1902283) |
| 0.4 | 1.2 | GO:0019442 | tryptophan catabolic process to acetyl-CoA(GO:0019442) |
| 0.4 | 1.2 | GO:0043309 | regulation of eosinophil degranulation(GO:0043309) positive regulation of eosinophil degranulation(GO:0043311) positive regulation of eosinophil activation(GO:1902568) |
| 0.4 | 1.6 | GO:0000738 | DNA catabolic process, exonucleolytic(GO:0000738) |
| 0.4 | 2.7 | GO:0016098 | monoterpenoid metabolic process(GO:0016098) |
| 0.4 | 2.2 | GO:0090362 | positive regulation of platelet-derived growth factor production(GO:0090362) |
| 0.4 | 1.9 | GO:0038155 | interleukin-23-mediated signaling pathway(GO:0038155) |
| 0.4 | 0.7 | GO:0044407 | biofilm formation(GO:0042710) single-species biofilm formation(GO:0044010) single-species biofilm formation in or on host organism(GO:0044407) regulation of single-species biofilm formation(GO:1900190) negative regulation of single-species biofilm formation(GO:1900191) regulation of single-species biofilm formation in or on host organism(GO:1900228) negative regulation of single-species biofilm formation in or on host organism(GO:1900229) |
| 0.4 | 1.1 | GO:1900135 | positive regulation of renin secretion into blood stream(GO:1900135) |
| 0.4 | 5.4 | GO:0032071 | regulation of endodeoxyribonuclease activity(GO:0032071) negative regulation of nuclease activity(GO:0032074) |
| 0.4 | 1.1 | GO:0014016 | neuroblast differentiation(GO:0014016) |
| 0.4 | 5.6 | GO:0001865 | NK T cell differentiation(GO:0001865) |
| 0.3 | 72.6 | GO:0002377 | immunoglobulin production(GO:0002377) |
| 0.3 | 5.7 | GO:0016998 | cell wall macromolecule catabolic process(GO:0016998) |
| 0.3 | 1.0 | GO:2000438 | CD24 biosynthetic process(GO:0035724) activation of meiosis involved in egg activation(GO:0060466) negative regulation of monocyte extravasation(GO:2000438) regulation of CD24 biosynthetic process(GO:2000559) positive regulation of CD24 biosynthetic process(GO:2000560) |
| 0.3 | 1.3 | GO:0097045 | activation of blood coagulation via clotting cascade(GO:0002543) phosphatidylserine exposure on blood platelet(GO:0097045) |
| 0.3 | 1.0 | GO:1990637 | response to prolactin(GO:1990637) |
| 0.3 | 1.2 | GO:0052360 | multi-organism catabolic process(GO:0044035) development of symbiont involved in interaction with host(GO:0044115) modulation of development of symbiont involved in interaction with host(GO:0044145) negative regulation of development of symbiont involved in interaction with host(GO:0044147) metabolism of substance in other organism involved in symbiotic interaction(GO:0052214) catabolism of substance in other organism involved in symbiotic interaction(GO:0052227) metabolism of macromolecule in other organism involved in symbiotic interaction(GO:0052229) catabolism by host of symbiont macromolecule(GO:0052360) catabolism by organism of macromolecule in other organism involved in symbiotic interaction(GO:0052361) catabolism by host of symbiont protein(GO:0052362) catabolism by organism of protein in other organism involved in symbiotic interaction(GO:0052363) catabolism by host of substance in symbiont(GO:0052364) metabolism by host of symbiont macromolecule(GO:0052416) metabolism by host of symbiont protein(GO:0052417) metabolism by organism of protein in other organism involved in symbiotic interaction(GO:0052418) metabolism by host of substance in symbiont(GO:0052419) |
| 0.3 | 2.5 | GO:1903026 | negative regulation of RNA polymerase II regulatory region sequence-specific DNA binding(GO:1903026) |
| 0.3 | 2.5 | GO:0035990 | tendon cell differentiation(GO:0035990) tendon formation(GO:0035992) |
| 0.3 | 0.9 | GO:0035397 | helper T cell enhancement of adaptive immune response(GO:0035397) |
| 0.3 | 1.2 | GO:0086097 | phospholipase C-activating angiotensin-activated signaling pathway(GO:0086097) |
| 0.3 | 1.2 | GO:0034147 | regulation of toll-like receptor 5 signaling pathway(GO:0034147) negative regulation of toll-like receptor 5 signaling pathway(GO:0034148) negative regulation of nucleotide-binding oligomerization domain containing 1 signaling pathway(GO:0070429) |
| 0.3 | 1.8 | GO:0046103 | adenosine catabolic process(GO:0006154) inosine biosynthetic process(GO:0046103) |
| 0.3 | 1.5 | GO:0045356 | positive regulation of interferon-alpha biosynthetic process(GO:0045356) |
| 0.3 | 1.5 | GO:0002678 | positive regulation of chronic inflammatory response(GO:0002678) |
| 0.3 | 1.7 | GO:0050904 | diapedesis(GO:0050904) |
| 0.3 | 2.5 | GO:0032929 | negative regulation of superoxide anion generation(GO:0032929) |
| 0.3 | 0.8 | GO:0038178 | complement component C5a signaling pathway(GO:0038178) |
| 0.3 | 1.1 | GO:0050705 | negative regulation of interleukin-1 alpha production(GO:0032690) regulation of interleukin-1 alpha secretion(GO:0050705) negative regulation of interleukin-1 alpha secretion(GO:0050712) |
| 0.3 | 6.8 | GO:0097296 | activation of cysteine-type endopeptidase activity involved in apoptotic signaling pathway(GO:0097296) |
| 0.3 | 1.3 | GO:0035106 | operant conditioning(GO:0035106) |
| 0.3 | 1.3 | GO:0003366 | cell-matrix adhesion involved in ameboidal cell migration(GO:0003366) |
| 0.3 | 0.5 | GO:0043605 | cellular amide catabolic process(GO:0043605) |
| 0.3 | 0.8 | GO:0002769 | natural killer cell inhibitory signaling pathway(GO:0002769) |
| 0.3 | 0.8 | GO:1904844 | response to L-glutamine(GO:1904844) cellular response to L-glutamine(GO:1904845) |
| 0.2 | 1.5 | GO:0048050 | post-embryonic eye morphogenesis(GO:0048050) |
| 0.2 | 4.1 | GO:0046449 | creatinine metabolic process(GO:0046449) |
| 0.2 | 3.4 | GO:0043152 | induction of bacterial agglutination(GO:0043152) |
| 0.2 | 1.9 | GO:0043615 | astrocyte cell migration(GO:0043615) |
| 0.2 | 2.1 | GO:0006957 | complement activation, alternative pathway(GO:0006957) |
| 0.2 | 0.7 | GO:0014810 | positive regulation of skeletal muscle contraction by regulation of release of sequestered calcium ion(GO:0014810) |
| 0.2 | 0.9 | GO:0005986 | sucrose biosynthetic process(GO:0005986) |
| 0.2 | 0.7 | GO:0035038 | female pronucleus assembly(GO:0035038) |
| 0.2 | 2.8 | GO:0045919 | positive regulation of cytolysis(GO:0045919) |
| 0.2 | 1.4 | GO:0060332 | positive regulation of response to interferon-gamma(GO:0060332) positive regulation of interferon-gamma-mediated signaling pathway(GO:0060335) |
| 0.2 | 0.7 | GO:0098976 | excitatory chemical synaptic transmission(GO:0098976) regulation of AMPA glutamate receptor clustering(GO:1904717) positive regulation of AMPA glutamate receptor clustering(GO:1904719) |
| 0.2 | 3.1 | GO:0072540 | T-helper 17 cell lineage commitment(GO:0072540) |
| 0.2 | 2.4 | GO:2000795 | negative regulation of epithelial cell proliferation involved in lung morphogenesis(GO:2000795) |
| 0.2 | 3.0 | GO:2000623 | regulation of nuclear-transcribed mRNA catabolic process, nonsense-mediated decay(GO:2000622) negative regulation of nuclear-transcribed mRNA catabolic process, nonsense-mediated decay(GO:2000623) |
| 0.2 | 1.1 | GO:0038043 | interleukin-5-mediated signaling pathway(GO:0038043) |
| 0.2 | 0.6 | GO:0003099 | positive regulation of the force of heart contraction by chemical signal(GO:0003099) |
| 0.2 | 0.8 | GO:0034443 | negative regulation of lipoprotein oxidation(GO:0034443) regulation of smooth muscle cell-matrix adhesion(GO:2000097) |
| 0.2 | 0.2 | GO:1903721 | regulation of I-kappaB phosphorylation(GO:1903719) positive regulation of I-kappaB phosphorylation(GO:1903721) |
| 0.2 | 3.5 | GO:0015939 | pantothenate metabolic process(GO:0015939) |
| 0.2 | 3.3 | GO:0015889 | cobalamin transport(GO:0015889) |
| 0.2 | 6.5 | GO:0050869 | negative regulation of B cell activation(GO:0050869) |
| 0.2 | 1.4 | GO:0070358 | actin polymerization-dependent cell motility(GO:0070358) |
| 0.2 | 4.7 | GO:0072378 | blood coagulation, fibrin clot formation(GO:0072378) |
| 0.2 | 1.0 | GO:0046671 | negative regulation of cellular pH reduction(GO:0032848) CD8-positive, alpha-beta T cell lineage commitment(GO:0043375) negative regulation of retinal cell programmed cell death(GO:0046671) |
| 0.2 | 0.6 | GO:0035752 | lysosomal lumen pH elevation(GO:0035752) |
| 0.2 | 1.0 | GO:0072717 | cellular response to actinomycin D(GO:0072717) |
| 0.2 | 4.7 | GO:0051044 | positive regulation of membrane protein ectodomain proteolysis(GO:0051044) |
| 0.2 | 0.9 | GO:0070885 | negative regulation of calcineurin-NFAT signaling cascade(GO:0070885) |
| 0.2 | 0.7 | GO:0097156 | fasciculation of motor neuron axon(GO:0097156) |
| 0.2 | 12.6 | GO:0048247 | lymphocyte chemotaxis(GO:0048247) |
| 0.2 | 1.3 | GO:0050916 | sensory perception of sweet taste(GO:0050916) |
| 0.2 | 0.5 | GO:0090080 | positive regulation of MAPKKK cascade by fibroblast growth factor receptor signaling pathway(GO:0090080) |
| 0.2 | 3.1 | GO:0035372 | protein localization to microtubule(GO:0035372) |
| 0.2 | 2.5 | GO:0010886 | positive regulation of cholesterol storage(GO:0010886) |
| 0.2 | 1.2 | GO:0072734 | response to staurosporine(GO:0072733) cellular response to staurosporine(GO:0072734) |
| 0.2 | 1.1 | GO:2000158 | positive regulation of ubiquitin-specific protease activity(GO:2000158) |
| 0.2 | 0.5 | GO:0003430 | growth plate cartilage chondrocyte growth(GO:0003430) |
| 0.2 | 1.2 | GO:0060750 | epithelial cell proliferation involved in mammary gland duct elongation(GO:0060750) branch elongation involved in mammary gland duct branching(GO:0060751) |
| 0.2 | 2.4 | GO:0010572 | positive regulation of platelet activation(GO:0010572) |
| 0.2 | 0.5 | GO:0030505 | inorganic diphosphate transport(GO:0030505) |
| 0.2 | 5.2 | GO:0070886 | positive regulation of calcineurin-NFAT signaling cascade(GO:0070886) |
| 0.2 | 0.5 | GO:0033076 | isoquinoline alkaloid metabolic process(GO:0033076) serotonin biosynthetic process(GO:0042427) phytoalexin metabolic process(GO:0052314) |
| 0.2 | 1.1 | GO:1903435 | positive regulation of constitutive secretory pathway(GO:1903435) |
| 0.2 | 1.8 | GO:0001957 | intramembranous ossification(GO:0001957) direct ossification(GO:0036072) |
| 0.2 | 0.5 | GO:0036451 | cap mRNA methylation(GO:0036451) |
| 0.2 | 2.9 | GO:1900017 | positive regulation of cytokine production involved in inflammatory response(GO:1900017) |
| 0.2 | 0.5 | GO:2000469 | regulation of thioredoxin peroxidase activity(GO:1903123) negative regulation of thioredoxin peroxidase activity(GO:1903124) negative regulation of thioredoxin peroxidase activity by peptidyl-threonine phosphorylation(GO:1903125) Wnt signalosome assembly(GO:1904887) negative regulation of peroxidase activity(GO:2000469) |
| 0.1 | 0.7 | GO:0010757 | negative regulation of plasminogen activation(GO:0010757) |
| 0.1 | 0.3 | GO:0010652 | regulation of cell communication by chemical coupling(GO:0010645) positive regulation of cell communication by chemical coupling(GO:0010652) |
| 0.1 | 0.4 | GO:0048058 | compound eye corneal lens development(GO:0048058) |
| 0.1 | 1.1 | GO:2000490 | negative regulation of hepatic stellate cell activation(GO:2000490) |
| 0.1 | 3.5 | GO:0040015 | negative regulation of multicellular organism growth(GO:0040015) |
| 0.1 | 0.5 | GO:0033319 | UDP-D-xylose metabolic process(GO:0033319) UDP-D-xylose biosynthetic process(GO:0033320) |
| 0.1 | 0.4 | GO:0090118 | receptor-mediated endocytosis of low-density lipoprotein particle involved in cholesterol transport(GO:0090118) |
| 0.1 | 0.4 | GO:0016999 | antibiotic metabolic process(GO:0016999) |
| 0.1 | 0.5 | GO:0010607 | negative regulation of cytoplasmic mRNA processing body assembly(GO:0010607) |
| 0.1 | 2.4 | GO:0042340 | keratan sulfate catabolic process(GO:0042340) |
| 0.1 | 1.2 | GO:0010940 | positive regulation of necrotic cell death(GO:0010940) |
| 0.1 | 1.2 | GO:2000124 | regulation of endocannabinoid signaling pathway(GO:2000124) |
| 0.1 | 3.0 | GO:0071498 | cellular response to fluid shear stress(GO:0071498) |
| 0.1 | 0.8 | GO:0019050 | suppression by virus of host apoptotic process(GO:0019050) modulation by virus of host apoptotic process(GO:0039526) |
| 0.1 | 0.5 | GO:0035377 | transepithelial water transport(GO:0035377) positive regulation of cyclic nucleotide-gated ion channel activity(GO:1902161) |
| 0.1 | 0.6 | GO:0030573 | bile acid catabolic process(GO:0030573) |
| 0.1 | 8.2 | GO:1901998 | toxin transport(GO:1901998) |
| 0.1 | 0.5 | GO:2000435 | regulation of protein neddylation(GO:2000434) negative regulation of protein neddylation(GO:2000435) |
| 0.1 | 0.4 | GO:0002304 | gamma-delta intraepithelial T cell differentiation(GO:0002304) CD8-positive, gamma-delta intraepithelial T cell differentiation(GO:0002305) |
| 0.1 | 10.3 | GO:0015701 | bicarbonate transport(GO:0015701) |
| 0.1 | 1.7 | GO:0060391 | positive regulation of SMAD protein import into nucleus(GO:0060391) |
| 0.1 | 11.2 | GO:0002228 | natural killer cell mediated immunity(GO:0002228) |
| 0.1 | 0.2 | GO:1902358 | sulfate transmembrane transport(GO:1902358) |
| 0.1 | 0.4 | GO:0061011 | hepatic duct development(GO:0061011) |
| 0.1 | 0.4 | GO:0006097 | glyoxylate cycle(GO:0006097) |
| 0.1 | 0.7 | GO:0044339 | canonical Wnt signaling pathway involved in osteoblast differentiation(GO:0044339) |
| 0.1 | 2.2 | GO:0032000 | positive regulation of fatty acid beta-oxidation(GO:0032000) |
| 0.1 | 4.2 | GO:0006825 | copper ion transport(GO:0006825) |
| 0.1 | 0.8 | GO:0042264 | peptidyl-aspartic acid hydroxylation(GO:0042264) |
| 0.1 | 0.4 | GO:2000630 | positive regulation of miRNA metabolic process(GO:2000630) |
| 0.1 | 0.4 | GO:0015842 | aminergic neurotransmitter loading into synaptic vesicle(GO:0015842) |
| 0.1 | 3.4 | GO:0003334 | keratinocyte development(GO:0003334) |
| 0.1 | 0.7 | GO:0002277 | myeloid dendritic cell activation involved in immune response(GO:0002277) |
| 0.1 | 0.5 | GO:0070317 | negative regulation of G0 to G1 transition(GO:0070317) |
| 0.1 | 0.2 | GO:0060278 | regulation of ovulation(GO:0060278) |
| 0.1 | 1.9 | GO:0050930 | induction of positive chemotaxis(GO:0050930) |
| 0.1 | 1.5 | GO:0015747 | urate transport(GO:0015747) |
| 0.1 | 0.3 | GO:0070377 | negative regulation of ERK5 cascade(GO:0070377) |
| 0.1 | 0.6 | GO:0043686 | co-translational protein modification(GO:0043686) |
| 0.1 | 1.3 | GO:1901409 | positive regulation of phosphorylation of RNA polymerase II C-terminal domain(GO:1901409) |
| 0.1 | 0.5 | GO:0030070 | insulin processing(GO:0030070) |
| 0.1 | 1.3 | GO:0034465 | response to carbon monoxide(GO:0034465) |
| 0.1 | 0.5 | GO:0086021 | SA node cell to atrial cardiac muscle cell communication by electrical coupling(GO:0086021) |
| 0.1 | 0.8 | GO:0039663 | fusion of virus membrane with host plasma membrane(GO:0019064) membrane fusion involved in viral entry into host cell(GO:0039663) multi-organism membrane fusion(GO:0044800) |
| 0.1 | 0.5 | GO:1903575 | cornified envelope assembly(GO:1903575) |
| 0.1 | 1.6 | GO:0002467 | germinal center formation(GO:0002467) |
| 0.1 | 1.4 | GO:1902857 | positive regulation of nonmotile primary cilium assembly(GO:1902857) |
| 0.1 | 0.4 | GO:0097032 | respiratory chain complex II assembly(GO:0034552) mitochondrial respiratory chain complex II assembly(GO:0034553) mitochondrial respiratory chain complex II biogenesis(GO:0097032) |
| 0.1 | 0.7 | GO:0043126 | regulation of 1-phosphatidylinositol 4-kinase activity(GO:0043126) positive regulation of 1-phosphatidylinositol 4-kinase activity(GO:0043128) |
| 0.1 | 1.1 | GO:0032693 | negative regulation of interleukin-10 production(GO:0032693) |
| 0.1 | 1.3 | GO:1903944 | regulation of hepatocyte apoptotic process(GO:1903943) negative regulation of hepatocyte apoptotic process(GO:1903944) |
| 0.1 | 0.4 | GO:0042640 | anagen(GO:0042640) |
| 0.1 | 8.2 | GO:0035987 | endodermal cell differentiation(GO:0035987) |
| 0.1 | 0.5 | GO:0071724 | toll-like receptor TLR6:TLR2 signaling pathway(GO:0038124) response to diacyl bacterial lipopeptide(GO:0071724) cellular response to diacyl bacterial lipopeptide(GO:0071726) |
| 0.1 | 1.9 | GO:1900745 | positive regulation of p38MAPK cascade(GO:1900745) |
| 0.1 | 3.0 | GO:1904778 | regulation of protein localization to cell cortex(GO:1904776) positive regulation of protein localization to cell cortex(GO:1904778) |
| 0.1 | 3.3 | GO:0030947 | regulation of vascular endothelial growth factor receptor signaling pathway(GO:0030947) |
| 0.1 | 0.9 | GO:0002430 | complement receptor mediated signaling pathway(GO:0002430) |
| 0.1 | 0.5 | GO:0001880 | Mullerian duct regression(GO:0001880) |
| 0.1 | 0.4 | GO:0009436 | glyoxylate catabolic process(GO:0009436) |
| 0.1 | 1.1 | GO:0035965 | cardiolipin acyl-chain remodeling(GO:0035965) |
| 0.1 | 0.3 | GO:0061760 | antifungal innate immune response(GO:0061760) |
| 0.1 | 0.2 | GO:0009085 | lysine biosynthetic process(GO:0009085) lysine biosynthetic process via aminoadipic acid(GO:0019878) |
| 0.1 | 0.8 | GO:0045651 | positive regulation of macrophage differentiation(GO:0045651) |
| 0.1 | 1.3 | GO:0015014 | heparan sulfate proteoglycan biosynthetic process, polysaccharide chain biosynthetic process(GO:0015014) |
| 0.1 | 0.8 | GO:0002318 | myeloid progenitor cell differentiation(GO:0002318) |
| 0.1 | 1.9 | GO:0006068 | ethanol catabolic process(GO:0006068) |
| 0.1 | 0.2 | GO:0035425 | autocrine signaling(GO:0035425) |
| 0.1 | 2.2 | GO:0015671 | oxygen transport(GO:0015671) |
| 0.1 | 0.7 | GO:0060005 | vestibular reflex(GO:0060005) |
| 0.1 | 0.6 | GO:1903936 | cellular response to sodium arsenite(GO:1903936) |
| 0.1 | 1.1 | GO:0006828 | manganese ion transport(GO:0006828) |
| 0.1 | 0.2 | GO:0042495 | toll-like receptor 1 signaling pathway(GO:0034130) detection of triacyl bacterial lipopeptide(GO:0042495) detection of bacterial lipopeptide(GO:0070340) |
| 0.1 | 1.9 | GO:0071803 | positive regulation of podosome assembly(GO:0071803) |
| 0.1 | 0.6 | GO:0046086 | AMP catabolic process(GO:0006196) adenosine biosynthetic process(GO:0046086) |
| 0.1 | 0.3 | GO:0050883 | musculoskeletal movement, spinal reflex action(GO:0050883) |
| 0.1 | 0.6 | GO:0019530 | taurine metabolic process(GO:0019530) |
| 0.1 | 1.4 | GO:0015693 | magnesium ion transport(GO:0015693) |
| 0.1 | 0.8 | GO:0010739 | positive regulation of protein kinase A signaling(GO:0010739) |
| 0.1 | 0.2 | GO:1904823 | pyrimidine nucleobase transport(GO:0015855) purine nucleobase transmembrane transport(GO:1904823) |
| 0.1 | 0.3 | GO:0038018 | Wnt receptor catabolic process(GO:0038018) |
| 0.1 | 3.5 | GO:0051482 | positive regulation of cytosolic calcium ion concentration involved in phospholipase C-activating G-protein coupled signaling pathway(GO:0051482) |
| 0.1 | 9.9 | GO:0031295 | lymphocyte costimulation(GO:0031294) T cell costimulation(GO:0031295) |
| 0.1 | 0.2 | GO:2000403 | positive regulation of lymphocyte migration(GO:2000403) |
| 0.1 | 0.3 | GO:1900738 | positive regulation of phospholipase C-activating G-protein coupled receptor signaling pathway(GO:1900738) |
| 0.1 | 0.8 | GO:0060242 | contact inhibition(GO:0060242) |
| 0.1 | 0.7 | GO:0097475 | motor neuron migration(GO:0097475) |
| 0.1 | 0.9 | GO:0016554 | cytidine to uridine editing(GO:0016554) |
| 0.1 | 1.4 | GO:0090050 | positive regulation of cell migration involved in sprouting angiogenesis(GO:0090050) |
| 0.1 | 0.1 | GO:0046878 | regulation of saliva secretion(GO:0046877) positive regulation of saliva secretion(GO:0046878) |
| 0.1 | 0.3 | GO:0042776 | mitochondrial ATP synthesis coupled proton transport(GO:0042776) |
| 0.1 | 1.5 | GO:0019731 | antibacterial humoral response(GO:0019731) |
| 0.1 | 0.2 | GO:0009644 | response to high light intensity(GO:0009644) |
| 0.1 | 4.2 | GO:0070098 | chemokine-mediated signaling pathway(GO:0070098) |
| 0.1 | 1.9 | GO:0050832 | defense response to fungus(GO:0050832) |
| 0.1 | 0.7 | GO:0007168 | receptor guanylyl cyclase signaling pathway(GO:0007168) |
| 0.1 | 0.5 | GO:0060390 | regulation of SMAD protein import into nucleus(GO:0060390) |
| 0.1 | 0.6 | GO:0046541 | saliva secretion(GO:0046541) |
| 0.1 | 0.8 | GO:0031119 | tRNA pseudouridine synthesis(GO:0031119) |
| 0.1 | 0.2 | GO:0070309 | lens fiber cell morphogenesis(GO:0070309) |
| 0.1 | 0.1 | GO:2000254 | regulation of male germ cell proliferation(GO:2000254) |
| 0.1 | 0.3 | GO:0002329 | pre-B cell differentiation(GO:0002329) |
| 0.1 | 0.6 | GO:0051026 | chiasma assembly(GO:0051026) |
| 0.1 | 0.2 | GO:0031443 | fast-twitch skeletal muscle fiber contraction(GO:0031443) |
| 0.1 | 0.3 | GO:0033383 | geranyl diphosphate metabolic process(GO:0033383) geranyl diphosphate biosynthetic process(GO:0033384) farnesyl diphosphate biosynthetic process(GO:0045337) |
| 0.1 | 0.4 | GO:1904139 | microglial cell migration(GO:1904124) regulation of microglial cell migration(GO:1904139) |
| 0.1 | 0.3 | GO:0015722 | canalicular bile acid transport(GO:0015722) |
| 0.1 | 0.4 | GO:0060574 | intestinal epithelial cell maturation(GO:0060574) |
| 0.1 | 0.2 | GO:0007089 | traversing start control point of mitotic cell cycle(GO:0007089) |
| 0.1 | 0.8 | GO:0006265 | DNA topological change(GO:0006265) |
| 0.1 | 3.5 | GO:0006968 | cellular defense response(GO:0006968) |
| 0.1 | 16.2 | GO:0002250 | adaptive immune response(GO:0002250) |
| 0.1 | 2.3 | GO:0050855 | regulation of B cell receptor signaling pathway(GO:0050855) |
| 0.1 | 0.6 | GO:0018230 | peptidyl-L-cysteine S-palmitoylation(GO:0018230) peptidyl-S-diacylglycerol-L-cysteine biosynthetic process from peptidyl-cysteine(GO:0018231) |
| 0.1 | 2.4 | GO:0071353 | cellular response to interleukin-4(GO:0071353) |
| 0.1 | 3.7 | GO:0045576 | mast cell activation(GO:0045576) |
| 0.1 | 0.4 | GO:0021943 | formation of radial glial scaffolds(GO:0021943) |
| 0.1 | 1.1 | GO:0042730 | fibrinolysis(GO:0042730) |
| 0.1 | 0.4 | GO:0070973 | protein localization to endoplasmic reticulum exit site(GO:0070973) |
| 0.1 | 1.7 | GO:0030728 | ovulation(GO:0030728) |
| 0.1 | 2.8 | GO:0010761 | fibroblast migration(GO:0010761) |
| 0.1 | 2.7 | GO:0032233 | positive regulation of actin filament bundle assembly(GO:0032233) |
| 0.1 | 0.5 | GO:0002051 | osteoblast fate commitment(GO:0002051) |
| 0.1 | 0.4 | GO:0018032 | protein amidation(GO:0018032) |
| 0.1 | 0.8 | GO:1900028 | negative regulation of ruffle assembly(GO:1900028) |
| 0.1 | 0.2 | GO:0002949 | tRNA threonylcarbamoyladenosine modification(GO:0002949) |
| 0.1 | 1.0 | GO:0010578 | regulation of adenylate cyclase activity involved in G-protein coupled receptor signaling pathway(GO:0010578) positive regulation of adenylate cyclase activity involved in G-protein coupled receptor signaling pathway(GO:0010579) |
| 0.1 | 0.5 | GO:0032534 | regulation of microvillus assembly(GO:0032534) |
| 0.1 | 0.3 | GO:0044778 | meiotic DNA integrity checkpoint(GO:0044778) |
| 0.1 | 0.9 | GO:2000096 | positive regulation of Wnt signaling pathway, planar cell polarity pathway(GO:2000096) |
| 0.1 | 0.4 | GO:0019236 | response to pheromone(GO:0019236) |
| 0.1 | 1.6 | GO:0043029 | T cell homeostasis(GO:0043029) |
| 0.1 | 2.0 | GO:0000027 | ribosomal large subunit assembly(GO:0000027) |
| 0.1 | 1.4 | GO:0019511 | peptidyl-proline hydroxylation(GO:0019511) |
| 0.1 | 0.5 | GO:0035878 | nail development(GO:0035878) |
| 0.1 | 0.7 | GO:0010623 | programmed cell death involved in cell development(GO:0010623) |
| 0.1 | 17.7 | GO:0050911 | detection of chemical stimulus involved in sensory perception of smell(GO:0050911) |
| 0.0 | 0.2 | GO:0097498 | endothelial tube lumen extension(GO:0097498) |
| 0.0 | 1.6 | GO:0006491 | N-glycan processing(GO:0006491) |
| 0.0 | 2.0 | GO:0008053 | mitochondrial fusion(GO:0008053) |
| 0.0 | 1.2 | GO:0031581 | hemidesmosome assembly(GO:0031581) |
| 0.0 | 0.3 | GO:1902713 | interferon-gamma secretion(GO:0072643) regulation of interferon-gamma secretion(GO:1902713) |
| 0.0 | 0.2 | GO:0019805 | quinolinate biosynthetic process(GO:0019805) |
| 0.0 | 1.7 | GO:0046339 | diacylglycerol metabolic process(GO:0046339) |
| 0.0 | 0.3 | GO:0014038 | regulation of Schwann cell differentiation(GO:0014038) |
| 0.0 | 0.2 | GO:1904977 | lymphatic endothelial cell migration(GO:1904977) |
| 0.0 | 0.2 | GO:2000866 | positive regulation of estrogen secretion(GO:2000863) positive regulation of estradiol secretion(GO:2000866) |
| 0.0 | 0.3 | GO:0008218 | bioluminescence(GO:0008218) |
| 0.0 | 3.1 | GO:0030574 | collagen catabolic process(GO:0030574) |
| 0.0 | 1.5 | GO:0098743 | cell aggregation(GO:0098743) |
| 0.0 | 0.0 | GO:2000482 | regulation of interleukin-8 secretion(GO:2000482) |
| 0.0 | 0.9 | GO:0007175 | negative regulation of epidermal growth factor-activated receptor activity(GO:0007175) |
| 0.0 | 1.5 | GO:1900047 | negative regulation of blood coagulation(GO:0030195) negative regulation of hemostasis(GO:1900047) |
| 0.0 | 7.1 | GO:0010811 | positive regulation of cell-substrate adhesion(GO:0010811) |
| 0.0 | 1.0 | GO:0007213 | G-protein coupled acetylcholine receptor signaling pathway(GO:0007213) |
| 0.0 | 0.3 | GO:1904800 | regulation of neuron remodeling(GO:1904799) negative regulation of neuron remodeling(GO:1904800) negative regulation of branching morphogenesis of a nerve(GO:2000173) |
| 0.0 | 0.3 | GO:1901529 | positive regulation of anion channel activity(GO:1901529) positive regulation of anion transmembrane transport(GO:1903961) |
| 0.0 | 0.8 | GO:0048935 | peripheral nervous system neuron differentiation(GO:0048934) peripheral nervous system neuron development(GO:0048935) |
| 0.0 | 1.1 | GO:0006054 | N-acetylneuraminate metabolic process(GO:0006054) |
| 0.0 | 0.1 | GO:0010713 | negative regulation of collagen metabolic process(GO:0010713) negative regulation of collagen biosynthetic process(GO:0032966) |
| 0.0 | 2.2 | GO:0035666 | TRIF-dependent toll-like receptor signaling pathway(GO:0035666) |
| 0.0 | 0.9 | GO:0000028 | ribosomal small subunit assembly(GO:0000028) |
| 0.0 | 0.2 | GO:1901350 | cell-cell signaling involved in cell-cell junction organization(GO:1901350) |
| 0.0 | 0.3 | GO:0006707 | cholesterol catabolic process(GO:0006707) sterol catabolic process(GO:0016127) |
| 0.0 | 2.1 | GO:0090162 | establishment of epithelial cell polarity(GO:0090162) |
| 0.0 | 0.4 | GO:0046149 | porphyrin-containing compound catabolic process(GO:0006787) tetrapyrrole catabolic process(GO:0033015) heme catabolic process(GO:0042167) pigment catabolic process(GO:0046149) |
| 0.0 | 0.3 | GO:0006741 | NADP biosynthetic process(GO:0006741) |
| 0.0 | 0.3 | GO:0048312 | intracellular distribution of mitochondria(GO:0048312) |
| 0.0 | 0.3 | GO:0070170 | regulation of tooth mineralization(GO:0070170) |
| 0.0 | 0.5 | GO:0005981 | regulation of glycogen catabolic process(GO:0005981) |
| 0.0 | 0.1 | GO:0071500 | cellular response to nitrosative stress(GO:0071500) |
| 0.0 | 1.8 | GO:0045776 | negative regulation of blood pressure(GO:0045776) |
| 0.0 | 0.7 | GO:0030277 | maintenance of gastrointestinal epithelium(GO:0030277) |
| 0.0 | 0.5 | GO:0051016 | barbed-end actin filament capping(GO:0051016) |
| 0.0 | 0.1 | GO:0034310 | primary alcohol catabolic process(GO:0034310) |
| 0.0 | 0.1 | GO:0006931 | substrate-dependent cell migration, cell attachment to substrate(GO:0006931) |
| 0.0 | 0.4 | GO:0070995 | NADPH oxidation(GO:0070995) |
| 0.0 | 0.2 | GO:1990668 | vesicle fusion with endoplasmic reticulum-Golgi intermediate compartment (ERGIC) membrane(GO:1990668) |
| 0.0 | 1.2 | GO:0003301 | physiological muscle hypertrophy(GO:0003298) physiological cardiac muscle hypertrophy(GO:0003301) cell growth involved in cardiac muscle cell development(GO:0061049) |
| 0.0 | 0.2 | GO:0036233 | glycine import(GO:0036233) |
| 0.0 | 4.3 | GO:0006614 | SRP-dependent cotranslational protein targeting to membrane(GO:0006614) |
| 0.0 | 1.4 | GO:0032402 | melanosome transport(GO:0032402) |
| 0.0 | 0.8 | GO:0097264 | self proteolysis(GO:0097264) |
| 0.0 | 1.2 | GO:0010842 | retina layer formation(GO:0010842) |
| 0.0 | 0.6 | GO:0009235 | cobalamin metabolic process(GO:0009235) |
| 0.0 | 0.3 | GO:0006621 | protein retention in ER lumen(GO:0006621) maintenance of protein localization in endoplasmic reticulum(GO:0035437) |
| 0.0 | 2.3 | GO:2000181 | negative regulation of angiogenesis(GO:0016525) negative regulation of blood vessel morphogenesis(GO:2000181) |
| 0.0 | 0.2 | GO:0035507 | regulation of myosin-light-chain-phosphatase activity(GO:0035507) |
| 0.0 | 0.8 | GO:0036152 | phosphatidylethanolamine acyl-chain remodeling(GO:0036152) |
| 0.0 | 0.8 | GO:0034356 | NAD biosynthesis via nicotinamide riboside salvage pathway(GO:0034356) |
| 0.0 | 0.9 | GO:0071712 | ER-associated misfolded protein catabolic process(GO:0071712) |
| 0.0 | 0.3 | GO:0048569 | post-embryonic organ development(GO:0048569) |
| 0.0 | 3.3 | GO:0060333 | interferon-gamma-mediated signaling pathway(GO:0060333) |
| 0.0 | 1.0 | GO:0030011 | maintenance of cell polarity(GO:0030011) |
| 0.0 | 0.4 | GO:0070327 | thyroid hormone transport(GO:0070327) |
| 0.0 | 0.1 | GO:0070836 | caveola assembly(GO:0070836) |
| 0.0 | 0.1 | GO:0000451 | rRNA 2'-O-methylation(GO:0000451) |
| 0.0 | 0.2 | GO:0071883 | activation of MAPK activity by adrenergic receptor signaling pathway(GO:0071883) regulation of glucocorticoid mediated signaling pathway(GO:1900169) |
| 0.0 | 0.3 | GO:0072592 | oxygen metabolic process(GO:0072592) |
| 0.0 | 1.5 | GO:0031103 | axon regeneration(GO:0031103) |
| 0.0 | 0.1 | GO:0019049 | evasion or tolerance of host defenses by virus(GO:0019049) evasion or tolerance of host immune response(GO:0020012) evasion or tolerance of host defense response(GO:0030682) evasion or tolerance by virus of host immune response(GO:0030683) avoidance of host defenses(GO:0044413) evasion or tolerance of host defenses(GO:0044415) evasion or tolerance of immune response of other organism involved in symbiotic interaction(GO:0051805) evasion or tolerance of defense response of other organism involved in symbiotic interaction(GO:0051807) avoidance of defenses of other organism involved in symbiotic interaction(GO:0051832) evasion or tolerance of defenses of other organism involved in symbiotic interaction(GO:0051834) |
| 0.0 | 0.6 | GO:0006123 | mitochondrial electron transport, cytochrome c to oxygen(GO:0006123) |
| 0.0 | 0.6 | GO:0050710 | negative regulation of cytokine secretion(GO:0050710) |
| 0.0 | 0.3 | GO:0032020 | ISG15-protein conjugation(GO:0032020) |
| 0.0 | 0.4 | GO:0016576 | histone dephosphorylation(GO:0016576) |
| 0.0 | 0.3 | GO:0090315 | negative regulation of protein targeting to membrane(GO:0090315) |
| 0.0 | 0.8 | GO:0010659 | cardiac muscle cell apoptotic process(GO:0010659) |
| 0.0 | 0.3 | GO:0017183 | peptidyl-diphthamide metabolic process(GO:0017182) peptidyl-diphthamide biosynthetic process from peptidyl-histidine(GO:0017183) |
| 0.0 | 0.2 | GO:0031284 | positive regulation of guanylate cyclase activity(GO:0031284) |
| 0.0 | 0.2 | GO:1903800 | positive regulation of production of miRNAs involved in gene silencing by miRNA(GO:1903800) |
| 0.0 | 0.4 | GO:0006309 | apoptotic DNA fragmentation(GO:0006309) |
| 0.0 | 0.0 | GO:0038162 | erythropoietin-mediated signaling pathway(GO:0038162) |
| 0.0 | 0.2 | GO:0097500 | receptor localization to nonmotile primary cilium(GO:0097500) protein localization to photoreceptor outer segment(GO:1903546) |
| 0.0 | 0.3 | GO:2001214 | positive regulation of vasculogenesis(GO:2001214) |
| 0.0 | 0.2 | GO:0022417 | protein maturation by protein folding(GO:0022417) |
| 0.0 | 0.1 | GO:0089700 | protein kinase D signaling(GO:0089700) |
| 0.0 | 0.5 | GO:0090527 | actin filament reorganization(GO:0090527) |
| 0.0 | 0.3 | GO:0001833 | inner cell mass cell proliferation(GO:0001833) |
| 0.0 | 1.9 | GO:0036498 | IRE1-mediated unfolded protein response(GO:0036498) |
| 0.0 | 0.5 | GO:0050651 | dermatan sulfate proteoglycan biosynthetic process(GO:0050651) |
| 0.0 | 0.2 | GO:1904751 | positive regulation of protein localization to nucleolus(GO:1904751) |
| 0.0 | 0.6 | GO:0035456 | response to interferon-beta(GO:0035456) |
| 0.0 | 0.5 | GO:0032728 | positive regulation of interferon-beta production(GO:0032728) |
| 0.0 | 0.9 | GO:0050715 | positive regulation of cytokine secretion(GO:0050715) |
| 0.0 | 0.1 | GO:0044205 | 'de novo' UMP biosynthetic process(GO:0044205) |
| 0.0 | 0.5 | GO:0043403 | skeletal muscle tissue regeneration(GO:0043403) |
| 0.0 | 0.2 | GO:1900119 | positive regulation of execution phase of apoptosis(GO:1900119) |
| 0.0 | 0.3 | GO:2001224 | positive regulation of neuron migration(GO:2001224) |
| 0.0 | 0.3 | GO:0035589 | G-protein coupled purinergic nucleotide receptor signaling pathway(GO:0035589) |
| 0.0 | 0.1 | GO:0055014 | atrial cardiac muscle cell differentiation(GO:0055011) atrial cardiac muscle cell development(GO:0055014) |
| 0.0 | 0.1 | GO:0010891 | negative regulation of sequestering of triglyceride(GO:0010891) |
| 0.0 | 0.1 | GO:0097026 | dendritic cell dendrite assembly(GO:0097026) |
| 0.0 | 0.1 | GO:1905150 | regulation of voltage-gated sodium channel activity(GO:1905150) |
| 0.0 | 0.3 | GO:0099514 | anterograde synaptic vesicle transport(GO:0048490) synaptic vesicle cytoskeletal transport(GO:0099514) synaptic vesicle transport along microtubule(GO:0099517) |
| 0.0 | 0.7 | GO:0061641 | CENP-A containing nucleosome assembly(GO:0034080) CENP-A containing chromatin organization(GO:0061641) |
| 0.0 | 0.1 | GO:0048861 | leukemia inhibitory factor signaling pathway(GO:0048861) |
| 0.0 | 0.7 | GO:0000413 | protein peptidyl-prolyl isomerization(GO:0000413) |
| 0.0 | 0.4 | GO:0032515 | negative regulation of phosphoprotein phosphatase activity(GO:0032515) |
| 0.0 | 0.6 | GO:0045599 | negative regulation of fat cell differentiation(GO:0045599) |
| 0.0 | 1.3 | GO:0006487 | protein N-linked glycosylation(GO:0006487) |
| 0.0 | 0.1 | GO:1903608 | protein localization to cytoplasmic stress granule(GO:1903608) |
| 0.0 | 1.3 | GO:0007218 | neuropeptide signaling pathway(GO:0007218) |
| 0.0 | 0.2 | GO:0006122 | mitochondrial electron transport, ubiquinol to cytochrome c(GO:0006122) |
| 0.0 | 0.1 | GO:0060666 | pulmonary myocardium development(GO:0003350) dichotomous subdivision of terminal units involved in salivary gland branching(GO:0060666) |
| 0.0 | 1.0 | GO:0000184 | nuclear-transcribed mRNA catabolic process, nonsense-mediated decay(GO:0000184) |
| 0.0 | 0.2 | GO:0015781 | pyrimidine nucleotide-sugar transport(GO:0015781) |
| 0.0 | 0.3 | GO:0009651 | response to salt stress(GO:0009651) |
| 0.0 | 0.1 | GO:1904707 | positive regulation of vascular smooth muscle cell proliferation(GO:1904707) |
| 0.0 | 1.3 | GO:0070126 | mitochondrial translational termination(GO:0070126) |
| 0.0 | 0.3 | GO:0030220 | platelet formation(GO:0030220) |
| 0.0 | 1.7 | GO:1902476 | chloride transmembrane transport(GO:1902476) |
| 0.0 | 0.1 | GO:0009052 | pentose-phosphate shunt, non-oxidative branch(GO:0009052) |
| 0.0 | 0.2 | GO:0060914 | heart formation(GO:0060914) |
Gene overrepresentation in cellular component category:
| Log-likelihood per target | Total log-likelihood | Term | Description |
|---|---|---|---|
| 7.2 | 28.9 | GO:0071757 | hexameric IgM immunoglobulin complex(GO:0071757) |
| 5.7 | 5.7 | GO:0071756 | IgM immunoglobulin complex(GO:0071753) IgM immunoglobulin complex, circulating(GO:0071754) pentameric IgM immunoglobulin complex(GO:0071756) |
| 1.8 | 97.6 | GO:0042571 | immunoglobulin complex, circulating(GO:0042571) |
| 1.8 | 7.0 | GO:0031838 | haptoglobin-hemoglobin complex(GO:0031838) |
| 1.2 | 15.1 | GO:0098647 | collagen type VI trimer(GO:0005589) collagen beaded filament(GO:0098647) |
| 1.0 | 6.3 | GO:0034680 | integrin alpha10-beta1 complex(GO:0034680) |
| 0.6 | 31.9 | GO:0031092 | platelet alpha granule membrane(GO:0031092) |
| 0.6 | 1.9 | GO:0070195 | growth hormone receptor complex(GO:0070195) |
| 0.6 | 6.7 | GO:0035692 | macrophage migration inhibitory factor receptor complex(GO:0035692) |
| 0.6 | 3.6 | GO:0072557 | IPAF inflammasome complex(GO:0072557) AIM2 inflammasome complex(GO:0097169) |
| 0.6 | 8.0 | GO:0005587 | collagen type IV trimer(GO:0005587) |
| 0.6 | 11.4 | GO:0042613 | MHC class II protein complex(GO:0042613) |
| 0.5 | 3.3 | GO:0002079 | inner acrosomal membrane(GO:0002079) |
| 0.5 | 5.3 | GO:0030478 | actin cap(GO:0030478) |
| 0.5 | 1.5 | GO:0042022 | interleukin-12 receptor complex(GO:0042022) |
| 0.5 | 6.2 | GO:0005577 | fibrinogen complex(GO:0005577) |
| 0.5 | 92.7 | GO:0072562 | blood microparticle(GO:0072562) |
| 0.5 | 7.7 | GO:0098643 | fibrillar collagen trimer(GO:0005583) banded collagen fibril(GO:0098643) |
| 0.4 | 1.7 | GO:0033257 | Bcl3/NF-kappaB2 complex(GO:0033257) |
| 0.4 | 2.3 | GO:0070022 | transforming growth factor beta receptor homodimeric complex(GO:0070022) |
| 0.4 | 1.8 | GO:0005595 | collagen type XII trimer(GO:0005595) |
| 0.3 | 12.9 | GO:0005614 | interstitial matrix(GO:0005614) |
| 0.3 | 11.4 | GO:0034364 | high-density lipoprotein particle(GO:0034364) |
| 0.3 | 1.0 | GO:0098651 | basement membrane collagen trimer(GO:0098651) |
| 0.3 | 2.6 | GO:0035867 | alphav-beta3 integrin-IGF-1-IGF1R complex(GO:0035867) |
| 0.3 | 0.8 | GO:0034684 | integrin alphav-beta5 complex(GO:0034684) |
| 0.3 | 1.3 | GO:0034669 | integrin alpha4-beta7 complex(GO:0034669) |
| 0.3 | 1.5 | GO:0005579 | membrane attack complex(GO:0005579) |
| 0.3 | 1.8 | GO:0036021 | endolysosome lumen(GO:0036021) |
| 0.2 | 1.2 | GO:1990667 | PCSK9-AnxA2 complex(GO:1990667) |
| 0.2 | 24.0 | GO:0035580 | specific granule lumen(GO:0035580) |
| 0.2 | 0.9 | GO:0030895 | apolipoprotein B mRNA editing enzyme complex(GO:0030895) |
| 0.2 | 4.3 | GO:0008091 | spectrin(GO:0008091) |
| 0.2 | 1.7 | GO:0043196 | varicosity(GO:0043196) |
| 0.2 | 0.4 | GO:0097209 | epidermal lamellar body(GO:0097209) |
| 0.2 | 1.2 | GO:0036398 | TCR signalosome(GO:0036398) |
| 0.2 | 0.4 | GO:0072536 | interleukin-23 receptor complex(GO:0072536) |
| 0.2 | 1.9 | GO:0032010 | phagolysosome(GO:0032010) |
| 0.2 | 1.2 | GO:0043541 | UDP-N-acetylglucosamine transferase complex(GO:0043541) |
| 0.2 | 5.2 | GO:0042101 | T cell receptor complex(GO:0042101) |
| 0.2 | 3.0 | GO:0008250 | oligosaccharyltransferase complex(GO:0008250) |
| 0.2 | 3.3 | GO:0042589 | zymogen granule membrane(GO:0042589) |
| 0.2 | 2.5 | GO:0031089 | platelet dense granule lumen(GO:0031089) |
| 0.2 | 0.3 | GO:0097679 | other organism cytoplasm(GO:0097679) |
| 0.2 | 1.1 | GO:0030485 | smooth muscle contractile fiber(GO:0030485) |
| 0.2 | 0.8 | GO:0071148 | TEAD-1-YAP complex(GO:0071148) TEAD-2-YAP complex(GO:0071149) |
| 0.2 | 0.5 | GO:0032473 | cytoplasmic side of mitochondrial outer membrane(GO:0032473) caveola neck(GO:0099400) |
| 0.1 | 8.6 | GO:0046658 | anchored component of plasma membrane(GO:0046658) |
| 0.1 | 1.2 | GO:0031673 | H zone(GO:0031673) |
| 0.1 | 2.5 | GO:0045179 | apical cortex(GO:0045179) |
| 0.1 | 0.4 | GO:0032998 | Fc receptor complex(GO:0032997) Fc-epsilon receptor I complex(GO:0032998) |
| 0.1 | 0.6 | GO:0005899 | insulin receptor complex(GO:0005899) |
| 0.1 | 11.6 | GO:0031091 | platelet alpha granule(GO:0031091) |
| 0.1 | 1.2 | GO:0043219 | lateral loop(GO:0043219) |
| 0.1 | 1.4 | GO:0097197 | tetraspanin-enriched microdomain(GO:0097197) |
| 0.1 | 2.5 | GO:0031265 | CD95 death-inducing signaling complex(GO:0031265) |
| 0.1 | 1.0 | GO:0098554 | cytoplasmic side of endoplasmic reticulum membrane(GO:0098554) |
| 0.1 | 0.5 | GO:0031205 | endoplasmic reticulum Sec complex(GO:0031205) |
| 0.1 | 0.8 | GO:0043020 | NADPH oxidase complex(GO:0043020) |
| 0.1 | 5.8 | GO:0001772 | immunological synapse(GO:0001772) |
| 0.1 | 1.3 | GO:0071438 | invadopodium membrane(GO:0071438) |
| 0.1 | 4.9 | GO:0009925 | basal plasma membrane(GO:0009925) |
| 0.1 | 2.4 | GO:0044300 | cerebellar mossy fiber(GO:0044300) |
| 0.1 | 0.4 | GO:0036501 | UFD1-NPL4 complex(GO:0036501) |
| 0.1 | 2.0 | GO:0031932 | TORC2 complex(GO:0031932) |
| 0.1 | 2.4 | GO:0005605 | basal lamina(GO:0005605) |
| 0.1 | 0.3 | GO:0005753 | mitochondrial proton-transporting ATP synthase complex(GO:0005753) proton-transporting ATP synthase complex(GO:0045259) |
| 0.1 | 9.8 | GO:0035578 | azurophil granule lumen(GO:0035578) |
| 0.1 | 0.4 | GO:0070557 | PCNA-p21 complex(GO:0070557) |
| 0.1 | 0.9 | GO:0097550 | transcriptional preinitiation complex(GO:0097550) |
| 0.1 | 0.3 | GO:0097125 | cyclin B1-CDK1 complex(GO:0097125) |
| 0.1 | 8.6 | GO:0005811 | lipid particle(GO:0005811) |
| 0.1 | 123.6 | GO:0005615 | extracellular space(GO:0005615) |
| 0.1 | 21.1 | GO:0009897 | external side of plasma membrane(GO:0009897) |
| 0.1 | 15.6 | GO:0005578 | proteinaceous extracellular matrix(GO:0005578) |
| 0.1 | 0.4 | GO:0097524 | sperm plasma membrane(GO:0097524) |
| 0.1 | 1.0 | GO:0046930 | pore complex(GO:0046930) |
| 0.1 | 0.8 | GO:0097136 | Bcl-2 family protein complex(GO:0097136) |
| 0.1 | 1.1 | GO:0036057 | filtration diaphragm(GO:0036056) slit diaphragm(GO:0036057) |
| 0.1 | 0.4 | GO:1990726 | Lsm1-7-Pat1 complex(GO:1990726) |
| 0.1 | 0.7 | GO:0046581 | intercellular canaliculus(GO:0046581) |
| 0.1 | 0.8 | GO:0032541 | cortical endoplasmic reticulum(GO:0032541) |
| 0.1 | 0.2 | GO:0016590 | ACF complex(GO:0016590) |
| 0.1 | 2.0 | GO:1990124 | messenger ribonucleoprotein complex(GO:1990124) |
| 0.1 | 5.5 | GO:0022625 | cytosolic large ribosomal subunit(GO:0022625) |
| 0.1 | 0.6 | GO:0043190 | ATP-binding cassette (ABC) transporter complex(GO:0043190) |
| 0.0 | 0.2 | GO:0060053 | neurofilament cytoskeleton(GO:0060053) |
| 0.0 | 0.6 | GO:0031466 | Cul5-RING ubiquitin ligase complex(GO:0031466) |
| 0.0 | 0.6 | GO:0071541 | eukaryotic translation initiation factor 3 complex, eIF3m(GO:0071541) |
| 0.0 | 1.1 | GO:0000164 | protein phosphatase type 1 complex(GO:0000164) |
| 0.0 | 4.3 | GO:0101003 | ficolin-1-rich granule membrane(GO:0101003) |
| 0.0 | 1.2 | GO:0030057 | desmosome(GO:0030057) |
| 0.0 | 0.2 | GO:0035354 | Toll-like receptor 1-Toll-like receptor 2 protein complex(GO:0035354) |
| 0.0 | 3.2 | GO:0001917 | photoreceptor inner segment(GO:0001917) |
| 0.0 | 2.9 | GO:0005762 | organellar large ribosomal subunit(GO:0000315) mitochondrial large ribosomal subunit(GO:0005762) |
| 0.0 | 0.8 | GO:0033276 | transcription factor TFTC complex(GO:0033276) |
| 0.0 | 0.7 | GO:0008074 | guanylate cyclase complex, soluble(GO:0008074) |
| 0.0 | 1.6 | GO:1902711 | GABA-A receptor complex(GO:1902711) |
| 0.0 | 0.7 | GO:0017146 | NMDA selective glutamate receptor complex(GO:0017146) |
| 0.0 | 2.2 | GO:0002102 | podosome(GO:0002102) |
| 0.0 | 1.0 | GO:0071141 | SMAD protein complex(GO:0071141) |
| 0.0 | 4.0 | GO:0005901 | caveola(GO:0005901) |
| 0.0 | 0.3 | GO:0030896 | checkpoint clamp complex(GO:0030896) |
| 0.0 | 0.2 | GO:0000120 | RNA polymerase I transcription factor complex(GO:0000120) |
| 0.0 | 0.1 | GO:0034274 | Atg12-Atg5-Atg16 complex(GO:0034274) |
| 0.0 | 0.3 | GO:0000836 | ER ubiquitin ligase complex(GO:0000835) Hrd1p ubiquitin ligase complex(GO:0000836) |
| 0.0 | 5.3 | GO:0090575 | RNA polymerase II transcription factor complex(GO:0090575) |
| 0.0 | 0.2 | GO:0034388 | Pwp2p-containing subcomplex of 90S preribosome(GO:0034388) |
| 0.0 | 0.2 | GO:0042406 | extrinsic component of endoplasmic reticulum membrane(GO:0042406) |
| 0.0 | 0.2 | GO:0002177 | manchette(GO:0002177) |
| 0.0 | 1.7 | GO:0005791 | rough endoplasmic reticulum(GO:0005791) |
| 0.0 | 1.2 | GO:0035577 | azurophil granule membrane(GO:0035577) |
| 0.0 | 1.2 | GO:0000307 | cyclin-dependent protein kinase holoenzyme complex(GO:0000307) |
| 0.0 | 14.4 | GO:0005925 | focal adhesion(GO:0005925) |
| 0.0 | 0.2 | GO:0000408 | EKC/KEOPS complex(GO:0000408) |
| 0.0 | 1.4 | GO:0043202 | lysosomal lumen(GO:0043202) |
| 0.0 | 0.7 | GO:0005790 | smooth endoplasmic reticulum(GO:0005790) |
| 0.0 | 1.3 | GO:0034707 | chloride channel complex(GO:0034707) |
| 0.0 | 5.3 | GO:0031234 | extrinsic component of cytoplasmic side of plasma membrane(GO:0031234) |
| 0.0 | 0.3 | GO:1904724 | tertiary granule lumen(GO:1904724) |
| 0.0 | 1.8 | GO:0031012 | extracellular matrix(GO:0031012) |
| 0.0 | 0.6 | GO:0005689 | U12-type spliceosomal complex(GO:0005689) |
| 0.0 | 0.1 | GO:0017071 | intracellular cyclic nucleotide activated cation channel complex(GO:0017071) |
| 0.0 | 0.1 | GO:0034457 | Mpp10 complex(GO:0034457) |
| 0.0 | 0.1 | GO:0005686 | U2 snRNP(GO:0005686) |
| 0.0 | 0.3 | GO:0014731 | spectrin-associated cytoskeleton(GO:0014731) |
| 0.0 | 0.4 | GO:0005685 | U1 snRNP(GO:0005685) |
| 0.0 | 0.1 | GO:1990130 | Iml1 complex(GO:1990130) |
| 0.0 | 1.4 | GO:0042581 | specific granule(GO:0042581) |
| 0.0 | 0.7 | GO:0005782 | peroxisomal matrix(GO:0005782) microbody lumen(GO:0031907) |
| 0.0 | 0.2 | GO:0005751 | mitochondrial respiratory chain complex IV(GO:0005751) |
| 0.0 | 2.0 | GO:0005788 | endoplasmic reticulum lumen(GO:0005788) |
| 0.0 | 3.8 | GO:0005667 | transcription factor complex(GO:0005667) |
| 0.0 | 0.1 | GO:0044322 | endoplasmic reticulum quality control compartment(GO:0044322) |
| 0.0 | 0.1 | GO:0035253 | ciliary rootlet(GO:0035253) |
| 0.0 | 1.2 | GO:0031225 | anchored component of membrane(GO:0031225) |
Gene overrepresentation in molecular function category:
| Log-likelihood per target | Total log-likelihood | Term | Description |
|---|---|---|---|
| 4.4 | 31.1 | GO:0019862 | IgA binding(GO:0019862) |
| 4.1 | 36.9 | GO:0004024 | alcohol dehydrogenase activity, zinc-dependent(GO:0004024) |
| 2.8 | 8.5 | GO:0017129 | triglyceride binding(GO:0017129) |
| 2.4 | 28.6 | GO:0070892 | lipoteichoic acid receptor activity(GO:0070892) |
| 1.9 | 5.7 | GO:0015403 | thiamine uptake transmembrane transporter activity(GO:0015403) |
| 1.4 | 97.6 | GO:0034987 | immunoglobulin receptor binding(GO:0034987) |
| 1.3 | 6.7 | GO:0047086 | phenanthrene 9,10-monooxygenase activity(GO:0018636) ketosteroid monooxygenase activity(GO:0047086) |
| 1.3 | 280.6 | GO:0003823 | antigen binding(GO:0003823) |
| 1.3 | 1.3 | GO:0047023 | androsterone dehydrogenase activity(GO:0047023) |
| 1.3 | 5.0 | GO:0005477 | pyruvate secondary active transmembrane transporter activity(GO:0005477) |
| 1.2 | 1.2 | GO:0004031 | aldehyde oxidase activity(GO:0004031) |
| 1.0 | 7.0 | GO:0030492 | hemoglobin binding(GO:0030492) |
| 1.0 | 2.9 | GO:0002113 | interleukin-33 binding(GO:0002113) |
| 0.9 | 0.9 | GO:0042289 | MHC class II protein binding(GO:0042289) |
| 0.9 | 8.8 | GO:0004064 | arylesterase activity(GO:0004064) |
| 0.9 | 3.5 | GO:0017159 | pantetheine hydrolase activity(GO:0017159) |
| 0.8 | 7.5 | GO:0001849 | complement component C1q binding(GO:0001849) |
| 0.7 | 6.3 | GO:0098639 | collagen binding involved in cell-matrix adhesion(GO:0098639) |
| 0.7 | 3.5 | GO:0048248 | CXCR3 chemokine receptor binding(GO:0048248) |
| 0.6 | 3.2 | GO:0070052 | collagen V binding(GO:0070052) |
| 0.6 | 1.7 | GO:0036487 | nitric-oxide synthase inhibitor activity(GO:0036487) |
| 0.6 | 1.7 | GO:0035379 | carbon dioxide transmembrane transporter activity(GO:0035379) |
| 0.6 | 11.1 | GO:0048407 | platelet-derived growth factor binding(GO:0048407) |
| 0.5 | 0.5 | GO:0004667 | prostaglandin-D synthase activity(GO:0004667) |
| 0.5 | 1.6 | GO:0008859 | exoribonuclease II activity(GO:0008859) |
| 0.5 | 1.5 | GO:0050528 | acyloxyacyl hydrolase activity(GO:0050528) |
| 0.5 | 1.5 | GO:0016517 | interleukin-12 receptor activity(GO:0016517) |
| 0.5 | 2.4 | GO:0052594 | tryptamine:oxygen oxidoreductase (deaminating) activity(GO:0052593) aminoacetone:oxygen oxidoreductase(deaminating) activity(GO:0052594) aliphatic-amine oxidase activity(GO:0052595) phenethylamine:oxygen oxidoreductase (deaminating) activity(GO:0052596) |
| 0.5 | 6.1 | GO:0050692 | DBD domain binding(GO:0050692) |
| 0.5 | 3.6 | GO:0043120 | interleukin-8 binding(GO:0019959) tumor necrosis factor binding(GO:0043120) |
| 0.4 | 1.3 | GO:0016497 | substance K receptor activity(GO:0016497) |
| 0.4 | 2.9 | GO:0032395 | MHC class II receptor activity(GO:0032395) |
| 0.4 | 1.2 | GO:0001596 | angiotensin type I receptor activity(GO:0001596) |
| 0.4 | 3.9 | GO:0005094 | Rho GDP-dissociation inhibitor activity(GO:0005094) |
| 0.4 | 2.3 | GO:0060230 | lipoprotein lipase activator activity(GO:0060230) |
| 0.4 | 1.2 | GO:0050509 | N-acetylglucosaminyl-proteoglycan 4-beta-glucuronosyltransferase activity(GO:0050509) |
| 0.4 | 2.3 | GO:0004833 | tryptophan 2,3-dioxygenase activity(GO:0004833) |
| 0.4 | 3.4 | GO:0045545 | syndecan binding(GO:0045545) |
| 0.4 | 2.6 | GO:0004909 | interleukin-1, Type I, activating receptor activity(GO:0004909) |
| 0.4 | 1.1 | GO:0015322 | proton-dependent oligopeptide secondary active transmembrane transporter activity(GO:0005427) secondary active oligopeptide transmembrane transporter activity(GO:0015322) |
| 0.4 | 2.6 | GO:0004499 | N,N-dimethylaniline monooxygenase activity(GO:0004499) |
| 0.4 | 11.6 | GO:0004806 | triglyceride lipase activity(GO:0004806) |
| 0.4 | 2.8 | GO:0004771 | sterol esterase activity(GO:0004771) |
| 0.4 | 1.1 | GO:0033265 | choline binding(GO:0033265) |
| 0.3 | 1.0 | GO:0046848 | hydroxyapatite binding(GO:0046848) |
| 0.3 | 1.4 | GO:0002046 | opsin binding(GO:0002046) |
| 0.3 | 3.5 | GO:0016724 | ferroxidase activity(GO:0004322) oxidoreductase activity, oxidizing metal ions, oxygen as acceptor(GO:0016724) |
| 0.3 | 2.7 | GO:0005157 | macrophage colony-stimulating factor receptor binding(GO:0005157) |
| 0.3 | 1.3 | GO:0047888 | fatty acid peroxidase activity(GO:0047888) |
| 0.3 | 8.7 | GO:0042609 | CD4 receptor binding(GO:0042609) |
| 0.3 | 4.2 | GO:0042731 | PH domain binding(GO:0042731) |
| 0.3 | 2.2 | GO:0005324 | long-chain fatty acid transporter activity(GO:0005324) |
| 0.3 | 5.7 | GO:0003796 | lysozyme activity(GO:0003796) |
| 0.3 | 1.5 | GO:0005006 | epidermal growth factor-activated receptor activity(GO:0005006) |
| 0.3 | 2.4 | GO:0043208 | glycosphingolipid binding(GO:0043208) |
| 0.3 | 13.5 | GO:0048020 | CCR chemokine receptor binding(GO:0048020) |
| 0.3 | 1.8 | GO:0070915 | lysophosphatidic acid receptor activity(GO:0070915) |
| 0.3 | 1.7 | GO:0035614 | snRNA stem-loop binding(GO:0035614) |
| 0.3 | 1.4 | GO:0019797 | procollagen-proline 3-dioxygenase activity(GO:0019797) |
| 0.3 | 0.8 | GO:0004878 | complement component C5a receptor activity(GO:0004878) |
| 0.3 | 1.3 | GO:0050501 | hyaluronan synthase activity(GO:0050501) |
| 0.3 | 43.8 | GO:0005518 | collagen binding(GO:0005518) |
| 0.3 | 3.8 | GO:0032393 | MHC class I receptor activity(GO:0032393) |
| 0.2 | 1.2 | GO:0016230 | sphingomyelin phosphodiesterase activator activity(GO:0016230) |
| 0.2 | 3.3 | GO:0031419 | cobalamin binding(GO:0031419) |
| 0.2 | 6.5 | GO:0001848 | complement binding(GO:0001848) |
| 0.2 | 0.9 | GO:0042132 | fructose 1,6-bisphosphate 1-phosphatase activity(GO:0042132) |
| 0.2 | 1.2 | GO:0016524 | latrotoxin receptor activity(GO:0016524) |
| 0.2 | 1.1 | GO:0004905 | type I interferon receptor activity(GO:0004905) |
| 0.2 | 0.7 | GO:0035375 | zymogen binding(GO:0035375) |
| 0.2 | 1.1 | GO:0004910 | interleukin-1, Type II, blocking receptor activity(GO:0004910) |
| 0.2 | 1.1 | GO:0004914 | interleukin-5 receptor activity(GO:0004914) |
| 0.2 | 3.0 | GO:0004579 | dolichyl-diphosphooligosaccharide-protein glycotransferase activity(GO:0004579) |
| 0.2 | 0.6 | GO:0052816 | medium-chain acyl-CoA hydrolase activity(GO:0052815) long-chain acyl-CoA hydrolase activity(GO:0052816) |
| 0.2 | 1.2 | GO:0030235 | nitric-oxide synthase regulator activity(GO:0030235) |
| 0.2 | 1.0 | GO:0002114 | interleukin-33 receptor activity(GO:0002114) |
| 0.2 | 1.7 | GO:0019834 | phospholipase A2 inhibitor activity(GO:0019834) |
| 0.2 | 0.6 | GO:0043849 | Ras palmitoyltransferase activity(GO:0043849) |
| 0.2 | 1.3 | GO:0015189 | L-lysine transmembrane transporter activity(GO:0015189) |
| 0.2 | 3.9 | GO:0042288 | MHC class I protein binding(GO:0042288) |
| 0.2 | 0.9 | GO:0030197 | extracellular matrix constituent, lubricant activity(GO:0030197) |
| 0.2 | 5.3 | GO:0005523 | tropomyosin binding(GO:0005523) |
| 0.2 | 0.4 | GO:0042020 | interleukin-23 binding(GO:0042019) interleukin-23 receptor activity(GO:0042020) |
| 0.2 | 1.8 | GO:0003835 | beta-galactoside alpha-2,6-sialyltransferase activity(GO:0003835) |
| 0.2 | 1.1 | GO:0035800 | deubiquitinase activator activity(GO:0035800) |
| 0.2 | 0.9 | GO:0070180 | large ribosomal subunit rRNA binding(GO:0070180) |
| 0.2 | 3.7 | GO:0051400 | BH domain binding(GO:0051400) |
| 0.2 | 2.5 | GO:0008199 | ferric iron binding(GO:0008199) |
| 0.2 | 1.2 | GO:0097199 | cysteine-type endopeptidase activity involved in apoptotic signaling pathway(GO:0097199) |
| 0.2 | 1.8 | GO:0031685 | adenosine receptor binding(GO:0031685) |
| 0.2 | 9.8 | GO:0005504 | fatty acid binding(GO:0005504) |
| 0.2 | 0.5 | GO:0004483 | mRNA (nucleoside-2'-O-)-methyltransferase activity(GO:0004483) |
| 0.2 | 0.9 | GO:0004522 | ribonuclease A activity(GO:0004522) |
| 0.2 | 0.8 | GO:0004556 | alpha-amylase activity(GO:0004556) |
| 0.2 | 1.1 | GO:0047184 | 1-acylglycerophosphocholine O-acyltransferase activity(GO:0047184) |
| 0.2 | 0.5 | GO:0036479 | GTP-dependent protein kinase activity(GO:0034211) peroxidase inhibitor activity(GO:0036479) |
| 0.2 | 0.6 | GO:0008431 | vitamin E binding(GO:0008431) |
| 0.2 | 0.8 | GO:0047280 | nicotinamide phosphoribosyltransferase activity(GO:0047280) |
| 0.1 | 1.9 | GO:0016176 | superoxide-generating NADPH oxidase activator activity(GO:0016176) |
| 0.1 | 1.9 | GO:0008142 | oxysterol binding(GO:0008142) |
| 0.1 | 2.6 | GO:0050700 | CARD domain binding(GO:0050700) |
| 0.1 | 1.3 | GO:0008379 | thioredoxin peroxidase activity(GO:0008379) |
| 0.1 | 2.2 | GO:0005344 | oxygen transporter activity(GO:0005344) |
| 0.1 | 0.8 | GO:0004597 | peptide-aspartate beta-dioxygenase activity(GO:0004597) |
| 0.1 | 0.4 | GO:0016503 | pheromone receptor activity(GO:0016503) |
| 0.1 | 0.6 | GO:0061752 | telomeric repeat-containing RNA binding(GO:0061752) |
| 0.1 | 0.5 | GO:0048040 | UDP-glucuronate decarboxylase activity(GO:0048040) |
| 0.1 | 1.0 | GO:0004982 | N-formyl peptide receptor activity(GO:0004982) |
| 0.1 | 0.4 | GO:0004531 | deoxyribonuclease II activity(GO:0004531) |
| 0.1 | 1.2 | GO:0001594 | trace-amine receptor activity(GO:0001594) |
| 0.1 | 0.5 | GO:0005260 | channel-conductance-controlling ATPase activity(GO:0005260) |
| 0.1 | 0.5 | GO:0004937 | alpha1-adrenergic receptor activity(GO:0004937) |
| 0.1 | 1.7 | GO:0046625 | sphingolipid binding(GO:0046625) |
| 0.1 | 2.0 | GO:0039706 | co-receptor binding(GO:0039706) |
| 0.1 | 0.5 | GO:0001847 | opsonin receptor activity(GO:0001847) |
| 0.1 | 5.3 | GO:0042056 | chemoattractant activity(GO:0042056) |
| 0.1 | 1.8 | GO:0030020 | extracellular matrix structural constituent conferring tensile strength(GO:0030020) |
| 0.1 | 3.5 | GO:0004185 | serine-type carboxypeptidase activity(GO:0004185) |
| 0.1 | 1.9 | GO:0001135 | transcription factor activity, RNA polymerase II transcription factor recruiting(GO:0001135) |
| 0.1 | 4.4 | GO:0019956 | chemokine binding(GO:0019956) |
| 0.1 | 0.7 | GO:0008823 | cupric reductase activity(GO:0008823) ferric-chelate reductase (NADPH) activity(GO:0052851) |
| 0.1 | 8.4 | GO:0005549 | odorant binding(GO:0005549) |
| 0.1 | 0.4 | GO:0051990 | isocitrate dehydrogenase (NADP+) activity(GO:0004450) (R)-2-hydroxyglutarate dehydrogenase activity(GO:0051990) |
| 0.1 | 0.7 | GO:0031013 | troponin I binding(GO:0031013) |
| 0.1 | 3.4 | GO:0043395 | heparan sulfate proteoglycan binding(GO:0043395) |
| 0.1 | 3.5 | GO:0008494 | translation activator activity(GO:0008494) |
| 0.1 | 1.7 | GO:0031386 | protein tag(GO:0031386) |
| 0.1 | 0.4 | GO:0008441 | 3'(2'),5'-bisphosphate nucleotidase activity(GO:0008441) |
| 0.1 | 1.1 | GO:0015057 | thrombin receptor activity(GO:0015057) |
| 0.1 | 0.7 | GO:0045174 | glutathione dehydrogenase (ascorbate) activity(GO:0045174) methylarsonate reductase activity(GO:0050610) |
| 0.1 | 2.3 | GO:0008140 | cAMP response element binding protein binding(GO:0008140) |
| 0.1 | 1.9 | GO:0016813 | hydrolase activity, acting on carbon-nitrogen (but not peptide) bonds, in linear amidines(GO:0016813) |
| 0.1 | 0.5 | GO:0086020 | gap junction channel activity involved in SA node cell-atrial cardiac muscle cell electrical coupling(GO:0086020) |
| 0.1 | 0.3 | GO:0032428 | sphingolipid activator protein activity(GO:0030290) beta-N-acetylgalactosaminidase activity(GO:0032428) |
| 0.1 | 0.1 | GO:0016623 | oxidoreductase activity, acting on the aldehyde or oxo group of donors, oxygen as acceptor(GO:0016623) |
| 0.1 | 2.8 | GO:0030247 | pattern binding(GO:0001871) polysaccharide binding(GO:0030247) |
| 0.1 | 1.8 | GO:0045125 | bioactive lipid receptor activity(GO:0045125) |
| 0.1 | 0.8 | GO:0003917 | DNA topoisomerase type I activity(GO:0003917) |
| 0.1 | 0.3 | GO:0015432 | bile acid-exporting ATPase activity(GO:0015432) |
| 0.1 | 1.1 | GO:0047144 | 2-acylglycerol-3-phosphate O-acyltransferase activity(GO:0047144) |
| 0.1 | 3.0 | GO:0005092 | GDP-dissociation inhibitor activity(GO:0005092) |
| 0.1 | 0.5 | GO:0050115 | myosin-light-chain-phosphatase activity(GO:0050115) |
| 0.1 | 1.5 | GO:1901702 | urate transmembrane transporter activity(GO:0015143) salt transmembrane transporter activity(GO:1901702) |
| 0.1 | 0.5 | GO:0034875 | oxidoreductase activity, acting on CH or CH2 groups, quinone or similar compound as acceptor(GO:0033695) caffeine oxidase activity(GO:0034875) |
| 0.1 | 0.8 | GO:1904929 | coreceptor activity involved in Wnt signaling pathway, planar cell polarity pathway(GO:1904929) |
| 0.1 | 0.5 | GO:0008422 | beta-glucosidase activity(GO:0008422) |
| 0.1 | 5.4 | GO:0001784 | phosphotyrosine binding(GO:0001784) |
| 0.1 | 2.7 | GO:0098748 | clathrin adaptor activity(GO:0035615) endocytic adaptor activity(GO:0098748) |
| 0.1 | 2.1 | GO:0004062 | aryl sulfotransferase activity(GO:0004062) |
| 0.1 | 0.9 | GO:0036435 | K48-linked polyubiquitin binding(GO:0036435) |
| 0.1 | 0.4 | GO:0015222 | serotonin transmembrane transporter activity(GO:0015222) |
| 0.1 | 0.7 | GO:0042608 | T cell receptor binding(GO:0042608) |
| 0.1 | 2.4 | GO:0005068 | transmembrane receptor protein tyrosine kinase adaptor activity(GO:0005068) |
| 0.1 | 1.1 | GO:0015279 | store-operated calcium channel activity(GO:0015279) |
| 0.1 | 1.2 | GO:0016290 | palmitoyl-CoA hydrolase activity(GO:0016290) |
| 0.1 | 1.0 | GO:0070290 | N-acylphosphatidylethanolamine-specific phospholipase D activity(GO:0070290) |
| 0.1 | 0.4 | GO:0016749 | 5-aminolevulinate synthase activity(GO:0003870) N-succinyltransferase activity(GO:0016749) |
| 0.1 | 1.0 | GO:0030618 | transforming growth factor beta receptor, pathway-specific cytoplasmic mediator activity(GO:0030618) |
| 0.1 | 7.3 | GO:0004715 | non-membrane spanning protein tyrosine kinase activity(GO:0004715) |
| 0.1 | 3.2 | GO:0005001 | transmembrane receptor protein tyrosine phosphatase activity(GO:0005001) transmembrane receptor protein phosphatase activity(GO:0019198) |
| 0.1 | 4.9 | GO:0005044 | scavenger receptor activity(GO:0005044) |
| 0.1 | 0.2 | GO:0015389 | pyrimidine- and adenine-specific:sodium symporter activity(GO:0015389) |
| 0.1 | 1.3 | GO:0005540 | hyaluronic acid binding(GO:0005540) |
| 0.1 | 2.6 | GO:0031005 | filamin binding(GO:0031005) |
| 0.1 | 0.9 | GO:0004459 | L-lactate dehydrogenase activity(GO:0004459) |
| 0.1 | 1.3 | GO:0015037 | peptide disulfide oxidoreductase activity(GO:0015037) |
| 0.1 | 0.5 | GO:0030021 | extracellular matrix structural constituent conferring compression resistance(GO:0030021) structural constituent of tooth enamel(GO:0030345) |
| 0.1 | 0.5 | GO:0015018 | galactosylgalactosylxylosylprotein 3-beta-glucuronosyltransferase activity(GO:0015018) |
| 0.1 | 2.1 | GO:0097153 | cysteine-type endopeptidase activity involved in apoptotic process(GO:0097153) |
| 0.1 | 0.3 | GO:0086075 | gap junction channel activity involved in cardiac conduction electrical coupling(GO:0086075) |
| 0.1 | 0.4 | GO:0015562 | efflux transmembrane transporter activity(GO:0015562) |
| 0.1 | 0.4 | GO:0019912 | cyclin-dependent protein kinase activating kinase activity(GO:0019912) |
| 0.1 | 6.5 | GO:0005201 | extracellular matrix structural constituent(GO:0005201) |
| 0.1 | 2.5 | GO:0005229 | intracellular calcium activated chloride channel activity(GO:0005229) |
| 0.1 | 1.7 | GO:0015467 | G-protein activated inward rectifier potassium channel activity(GO:0015467) |
| 0.1 | 2.1 | GO:0001087 | transcription factor activity, sequence-specific DNA binding, RNA polymerase recruiting(GO:0001011) transcription factor activity, TFIIB-class binding(GO:0001087) |
| 0.1 | 2.6 | GO:0070064 | proline-rich region binding(GO:0070064) |
| 0.1 | 3.1 | GO:0005158 | insulin receptor binding(GO:0005158) |
| 0.1 | 1.2 | GO:0061578 | Lys63-specific deubiquitinase activity(GO:0061578) |
| 0.1 | 0.6 | GO:0004677 | DNA-dependent protein kinase activity(GO:0004677) |
| 0.1 | 0.3 | GO:0004337 | dimethylallyltranstransferase activity(GO:0004161) geranyltranstransferase activity(GO:0004337) |
| 0.1 | 2.9 | GO:0003785 | actin monomer binding(GO:0003785) |
| 0.1 | 0.5 | GO:1990948 | ligase inhibitor activity(GO:0055104) ubiquitin ligase inhibitor activity(GO:1990948) |
| 0.1 | 0.4 | GO:0004504 | peptidylglycine monooxygenase activity(GO:0004504) peptidylamidoglycolate lyase activity(GO:0004598) |
| 0.1 | 1.6 | GO:0008510 | sodium:bicarbonate symporter activity(GO:0008510) |
| 0.1 | 1.7 | GO:0005031 | tumor necrosis factor-activated receptor activity(GO:0005031) death receptor activity(GO:0005035) |
| 0.1 | 0.8 | GO:0001075 | transcription factor activity, RNA polymerase II core promoter sequence-specific binding involved in preinitiation complex assembly(GO:0001075) |
| 0.1 | 1.1 | GO:0001206 | transcriptional repressor activity, RNA polymerase II distal enhancer sequence-specific binding(GO:0001206) |
| 0.1 | 0.7 | GO:0008420 | CTD phosphatase activity(GO:0008420) |
| 0.1 | 0.7 | GO:0001591 | dopamine neurotransmitter receptor activity, coupled via Gi/Go(GO:0001591) |
| 0.1 | 7.9 | GO:0004867 | serine-type endopeptidase inhibitor activity(GO:0004867) |
| 0.1 | 5.3 | GO:0005070 | SH3/SH2 adaptor activity(GO:0005070) |
| 0.0 | 0.7 | GO:0005004 | GPI-linked ephrin receptor activity(GO:0005004) |
| 0.0 | 0.6 | GO:0035251 | UDP-glucosyltransferase activity(GO:0035251) |
| 0.0 | 0.8 | GO:0001730 | 2'-5'-oligoadenylate synthetase activity(GO:0001730) |
| 0.0 | 0.1 | GO:0008988 | rRNA (adenine-N6-)-methyltransferase activity(GO:0008988) |
| 0.0 | 0.3 | GO:1902122 | chenodeoxycholic acid binding(GO:1902122) |
| 0.0 | 0.2 | GO:0035500 | MH2 domain binding(GO:0035500) |
| 0.0 | 0.8 | GO:0016175 | superoxide-generating NADPH oxidase activity(GO:0016175) |
| 0.0 | 0.2 | GO:0035663 | Toll-like receptor 2 binding(GO:0035663) |
| 0.0 | 3.5 | GO:0019843 | rRNA binding(GO:0019843) |
| 0.0 | 4.9 | GO:0004896 | cytokine receptor activity(GO:0004896) |
| 0.0 | 7.1 | GO:0004222 | metalloendopeptidase activity(GO:0004222) |
| 0.0 | 1.4 | GO:0032041 | histone deacetylase activity (H3-K14 specific)(GO:0031078) NAD-dependent histone deacetylase activity (H3-K14 specific)(GO:0032041) |
| 0.0 | 0.5 | GO:0030976 | thiamine pyrophosphate binding(GO:0030976) |
| 0.0 | 0.4 | GO:0015349 | thyroid hormone transmembrane transporter activity(GO:0015349) |
| 0.0 | 1.9 | GO:0005164 | tumor necrosis factor receptor binding(GO:0005164) |
| 0.0 | 0.8 | GO:0009982 | pseudouridine synthase activity(GO:0009982) |
| 0.0 | 1.4 | GO:0008395 | steroid hydroxylase activity(GO:0008395) |
| 0.0 | 0.1 | GO:0070039 | rRNA (guanosine-2'-O-)-methyltransferase activity(GO:0070039) |
| 0.0 | 1.2 | GO:0008093 | cytoskeletal adaptor activity(GO:0008093) |
| 0.0 | 0.3 | GO:0004473 | malate dehydrogenase (decarboxylating) (NAD+) activity(GO:0004471) malate dehydrogenase (decarboxylating) (NADP+) activity(GO:0004473) |
| 0.0 | 0.4 | GO:0004983 | neuropeptide Y receptor activity(GO:0004983) |
| 0.0 | 0.6 | GO:0004865 | protein serine/threonine phosphatase inhibitor activity(GO:0004865) |
| 0.0 | 9.9 | GO:0004984 | olfactory receptor activity(GO:0004984) |
| 0.0 | 0.7 | GO:0015643 | guanylate cyclase activity(GO:0004383) toxic substance binding(GO:0015643) |
| 0.0 | 4.8 | GO:0005178 | integrin binding(GO:0005178) |
| 0.0 | 5.4 | GO:0008201 | heparin binding(GO:0008201) |
| 0.0 | 0.2 | GO:1990050 | phosphatidic acid transporter activity(GO:1990050) |
| 0.0 | 0.8 | GO:0005522 | profilin binding(GO:0005522) |
| 0.0 | 1.6 | GO:0004890 | GABA-A receptor activity(GO:0004890) |
| 0.0 | 4.1 | GO:0019838 | growth factor binding(GO:0019838) |
| 0.0 | 0.2 | GO:0042328 | heparan sulfate N-acetylglucosaminyltransferase activity(GO:0042328) |
| 0.0 | 0.3 | GO:0042296 | ISG15 transferase activity(GO:0042296) |
| 0.0 | 0.4 | GO:0001609 | G-protein coupled adenosine receptor activity(GO:0001609) |
| 0.0 | 0.1 | GO:0017153 | sodium:dicarboxylate symporter activity(GO:0017153) |
| 0.0 | 0.7 | GO:0001530 | lipopolysaccharide binding(GO:0001530) |
| 0.0 | 0.1 | GO:0034711 | inhibin binding(GO:0034711) |
| 0.0 | 0.1 | GO:0019776 | Atg8 ligase activity(GO:0019776) |
| 0.0 | 1.0 | GO:0005527 | macrolide binding(GO:0005527) FK506 binding(GO:0005528) |
| 0.0 | 1.3 | GO:0016538 | cyclin-dependent protein serine/threonine kinase regulator activity(GO:0016538) |
| 0.0 | 0.3 | GO:0008046 | axon guidance receptor activity(GO:0008046) |
| 0.0 | 1.2 | GO:0043027 | cysteine-type endopeptidase inhibitor activity involved in apoptotic process(GO:0043027) |
| 0.0 | 0.2 | GO:0045029 | UDP-activated nucleotide receptor activity(GO:0045029) |
| 0.0 | 0.4 | GO:0043225 | anion transmembrane-transporting ATPase activity(GO:0043225) |
| 0.0 | 5.2 | GO:0004252 | serine-type endopeptidase activity(GO:0004252) |
| 0.0 | 0.8 | GO:0004653 | polypeptide N-acetylgalactosaminyltransferase activity(GO:0004653) |
| 0.0 | 0.3 | GO:0008381 | mechanically-gated ion channel activity(GO:0008381) mechanically gated channel activity(GO:0022833) |
| 0.0 | 0.1 | GO:0004750 | ribulose-phosphate 3-epimerase activity(GO:0004750) |
| 0.0 | 1.5 | GO:0051219 | phosphoprotein binding(GO:0051219) |
| 0.0 | 0.2 | GO:0047756 | chondroitin 4-sulfotransferase activity(GO:0047756) |
| 0.0 | 0.2 | GO:0008121 | ubiquinol-cytochrome-c reductase activity(GO:0008121) oxidoreductase activity, acting on diphenols and related substances as donors, cytochrome as acceptor(GO:0016681) |
| 0.0 | 0.2 | GO:0008048 | calcium sensitive guanylate cyclase activator activity(GO:0008048) |
| 0.0 | 0.4 | GO:0017070 | U6 snRNA binding(GO:0017070) |
| 0.0 | 1.2 | GO:0061631 | ubiquitin conjugating enzyme activity(GO:0061631) |
| 0.0 | 0.5 | GO:0005351 | sugar:proton symporter activity(GO:0005351) cation:sugar symporter activity(GO:0005402) |
| 0.0 | 10.7 | GO:0003924 | GTPase activity(GO:0003924) |
| 0.0 | 0.5 | GO:0030742 | GTP-dependent protein binding(GO:0030742) |
| 0.0 | 0.2 | GO:0050664 | oxidoreductase activity, acting on NAD(P)H, oxygen as acceptor(GO:0050664) |
| 0.0 | 0.2 | GO:0030280 | structural constituent of epidermis(GO:0030280) |
| 0.0 | 0.7 | GO:0003951 | NAD+ kinase activity(GO:0003951) |
| 0.0 | 0.5 | GO:0017166 | vinculin binding(GO:0017166) |
| 0.0 | 0.1 | GO:0003976 | UDP-N-acetylglucosamine-lysosomal-enzyme N-acetylglucosaminephosphotransferase activity(GO:0003976) |
| 0.0 | 0.4 | GO:0042813 | Wnt-activated receptor activity(GO:0042813) |
| 0.0 | 0.7 | GO:0005109 | frizzled binding(GO:0005109) |
| 0.0 | 0.6 | GO:0015002 | cytochrome-c oxidase activity(GO:0004129) heme-copper terminal oxidase activity(GO:0015002) oxidoreductase activity, acting on a heme group of donors, oxygen as acceptor(GO:0016676) |
| 0.0 | 0.3 | GO:1990825 | sequence-specific mRNA binding(GO:1990825) |
| 0.0 | 0.2 | GO:0008009 | chemokine activity(GO:0008009) |
| 0.0 | 0.4 | GO:0008190 | eukaryotic initiation factor 4E binding(GO:0008190) |
| 0.0 | 0.7 | GO:0038191 | neuropilin binding(GO:0038191) |
| 0.0 | 0.3 | GO:0019841 | retinol binding(GO:0019841) |
| 0.0 | 1.1 | GO:0015485 | cholesterol binding(GO:0015485) |
| 0.0 | 0.5 | GO:0004181 | metallocarboxypeptidase activity(GO:0004181) |
| 0.0 | 0.4 | GO:0030296 | protein tyrosine kinase activator activity(GO:0030296) |
| 0.0 | 0.4 | GO:0019992 | diacylglycerol binding(GO:0019992) |
| 0.0 | 0.3 | GO:0015248 | sterol transporter activity(GO:0015248) |
| 0.0 | 0.3 | GO:0008353 | RNA polymerase II carboxy-terminal domain kinase activity(GO:0008353) |
| 0.0 | 0.4 | GO:0017049 | GTP-Rho binding(GO:0017049) |
| 0.0 | 0.3 | GO:0016500 | protein-hormone receptor activity(GO:0016500) |
| 0.0 | 0.1 | GO:0005223 | intracellular cGMP activated cation channel activity(GO:0005223) |
| 0.0 | 0.1 | GO:0001512 | dihydronicotinamide riboside quinone reductase activity(GO:0001512) melatonin binding(GO:1904408) |
| 0.0 | 0.2 | GO:0043023 | ribosomal large subunit binding(GO:0043023) |
| 0.0 | 0.3 | GO:0008198 | ferrous iron binding(GO:0008198) |
| 0.0 | 0.3 | GO:0102391 | decanoate--CoA ligase activity(GO:0102391) |
| 0.0 | 0.0 | GO:0004421 | hydroxymethylglutaryl-CoA synthase activity(GO:0004421) |
| 0.0 | 0.1 | GO:0099580 | ion antiporter activity involved in regulation of postsynaptic membrane potential(GO:0099580) |
| 0.0 | 0.3 | GO:0004012 | phospholipid-translocating ATPase activity(GO:0004012) |
Gene overrepresentation in curated gene sets: canonical pathways category:
| Log-likelihood per target | Total log-likelihood | Term | Description |
|---|---|---|---|
| 0.5 | 31.3 | NABA PROTEOGLYCANS | Genes encoding proteoglycans |
| 0.3 | 9.9 | PID ANTHRAX PATHWAY | Cellular roles of Anthrax toxin |
| 0.2 | 13.9 | PID INTEGRIN A9B1 PATHWAY | Alpha9 beta1 integrin signaling events |
| 0.2 | 19.7 | NABA COLLAGENS | Genes encoding collagen proteins |
| 0.2 | 8.1 | SA MMP CYTOKINE CONNECTION | Cytokines can induce activation of matrix metalloproteinases, which degrade extracellular matrix. |
| 0.2 | 5.1 | PID SYNDECAN 1 PATHWAY | Syndecan-1-mediated signaling events |
| 0.2 | 2.0 | PID AR NONGENOMIC PATHWAY | Nongenotropic Androgen signaling |
| 0.2 | 2.5 | PID IL23 PATHWAY | IL23-mediated signaling events |
| 0.1 | 12.3 | PID INTEGRIN1 PATHWAY | Beta1 integrin cell surface interactions |
| 0.1 | 16.1 | PID IL12 2PATHWAY | IL12-mediated signaling events |
| 0.1 | 1.1 | PID IL5 PATHWAY | IL5-mediated signaling events |
| 0.1 | 2.1 | PID INTEGRIN5 PATHWAY | Beta5 beta6 beta7 and beta8 integrin cell surface interactions |
| 0.1 | 7.5 | ST MYOCYTE AD PATHWAY | Myocyte Adrenergic Pathway is a specific case of the generalized Adrenergic Pathway. |
| 0.1 | 1.0 | SA REG CASCADE OF CYCLIN EXPR | Expression of cyclins regulates progression through the cell cycle by activating cyclin-dependent kinases. |
| 0.1 | 1.2 | PID EPO PATHWAY | EPO signaling pathway |
| 0.1 | 3.4 | SA PROGRAMMED CELL DEATH | Programmed cell death, or apoptosis, eliminates damaged or unneeded cells. |
| 0.1 | 11.4 | ST T CELL SIGNAL TRANSDUCTION | T Cell Signal Transduction |
| 0.1 | 7.4 | PID TRAIL PATHWAY | TRAIL signaling pathway |
| 0.1 | 1.9 | PID FRA PATHWAY | Validated transcriptional targets of AP1 family members Fra1 and Fra2 |
| 0.1 | 7.8 | PID ANGIOPOIETIN RECEPTOR PATHWAY | Angiopoietin receptor Tie2-mediated signaling |
| 0.1 | 0.4 | SA PTEN PATHWAY | PTEN is a tumor suppressor that dephosphorylates the lipid messenger phosphatidylinositol triphosphate. |
| 0.1 | 4.6 | PID IL6 7 PATHWAY | IL6-mediated signaling events |
| 0.1 | 8.9 | PID AP1 PATHWAY | AP-1 transcription factor network |
| 0.1 | 10.1 | PID NFAT TFPATHWAY | Calcineurin-regulated NFAT-dependent transcription in lymphocytes |
| 0.1 | 7.0 | PID IL4 2PATHWAY | IL4-mediated signaling events |
| 0.1 | 1.7 | PID NFKAPPAB ATYPICAL PATHWAY | Atypical NF-kappaB pathway |
| 0.1 | 14.6 | PID CMYB PATHWAY | C-MYB transcription factor network |
| 0.1 | 2.4 | ST GA12 PATHWAY | G alpha 12 Pathway |
| 0.1 | 4.8 | PID SYNDECAN 4 PATHWAY | Syndecan-4-mediated signaling events |
| 0.1 | 3.8 | PID NFKAPPAB CANONICAL PATHWAY | Canonical NF-kappaB pathway |
| 0.1 | 4.0 | PID KIT PATHWAY | Signaling events mediated by Stem cell factor receptor (c-Kit) |
| 0.1 | 2.2 | PID IGF1 PATHWAY | IGF1 pathway |
| 0.1 | 5.9 | PID HNF3A PATHWAY | FOXA1 transcription factor network |
| 0.1 | 2.0 | PID IL1 PATHWAY | IL1-mediated signaling events |
| 0.1 | 1.9 | PID BCR 5PATHWAY | BCR signaling pathway |
| 0.1 | 16.6 | NABA ECM GLYCOPROTEINS | Genes encoding structural ECM glycoproteins |
| 0.0 | 2.0 | PID CXCR3 PATHWAY | CXCR3-mediated signaling events |
| 0.0 | 2.1 | PID CXCR4 PATHWAY | CXCR4-mediated signaling events |
| 0.0 | 1.0 | PID ALK2 PATHWAY | ALK2 signaling events |
| 0.0 | 2.0 | PID PS1 PATHWAY | Presenilin action in Notch and Wnt signaling |
| 0.0 | 2.6 | PID VEGFR1 2 PATHWAY | Signaling events mediated by VEGFR1 and VEGFR2 |
| 0.0 | 0.6 | SIG BCR SIGNALING PATHWAY | Members of the BCR signaling pathway |
| 0.0 | 0.8 | PID P38 MK2 PATHWAY | p38 signaling mediated by MAPKAP kinases |
| 0.0 | 12.8 | NABA ECM REGULATORS | Genes encoding enzymes and their regulators involved in the remodeling of the extracellular matrix |
| 0.0 | 1.0 | PID UPA UPAR PATHWAY | Urokinase-type plasminogen activator (uPA) and uPAR-mediated signaling |
| 0.0 | 0.8 | PID INTEGRIN2 PATHWAY | Beta2 integrin cell surface interactions |
| 0.0 | 2.2 | PID RAC1 PATHWAY | RAC1 signaling pathway |
| 0.0 | 3.2 | PID HIF1 TFPATHWAY | HIF-1-alpha transcription factor network |
| 0.0 | 0.8 | PID WNT SIGNALING PATHWAY | Wnt signaling network |
| 0.0 | 1.5 | PID HES HEY PATHWAY | Notch-mediated HES/HEY network |
| 0.0 | 1.1 | PID INSULIN GLUCOSE PATHWAY | Insulin-mediated glucose transport |
| 0.0 | 2.8 | PID CASPASE PATHWAY | Caspase cascade in apoptosis |
| 0.0 | 0.1 | ST PHOSPHOINOSITIDE 3 KINASE PATHWAY | PI3K Pathway |
| 0.0 | 0.3 | PID HIF1A PATHWAY | Hypoxic and oxygen homeostasis regulation of HIF-1-alpha |
| 0.0 | 0.3 | PID SYNDECAN 2 PATHWAY | Syndecan-2-mediated signaling events |
| 0.0 | 0.2 | PID NEPHRIN NEPH1 PATHWAY | Nephrin/Neph1 signaling in the kidney podocyte |
| 0.0 | 0.1 | SA G1 AND S PHASES | Cdk2, 4, and 6 bind cyclin D in G1, while cdk2/cyclin E promotes the G1/S transition. |
| 0.0 | 0.5 | PID RETINOIC ACID PATHWAY | Retinoic acid receptors-mediated signaling |
| 0.0 | 1.1 | PID HNF3B PATHWAY | FOXA2 and FOXA3 transcription factor networks |
| 0.0 | 0.5 | PID INTEGRIN3 PATHWAY | Beta3 integrin cell surface interactions |
| 0.0 | 0.6 | SIG INSULIN RECEPTOR PATHWAY IN CARDIAC MYOCYTES | Genes related to the insulin receptor pathway |
| 0.0 | 1.3 | PID DELTA NP63 PATHWAY | Validated transcriptional targets of deltaNp63 isoforms |
| 0.0 | 1.2 | PID TAP63 PATHWAY | Validated transcriptional targets of TAp63 isoforms |
| 0.0 | 0.2 | PID BARD1 PATHWAY | BARD1 signaling events |
| 0.0 | 0.3 | ST ADRENERGIC | Adrenergic Pathway |
| 0.0 | 0.5 | PID SMAD2 3PATHWAY | Regulation of cytoplasmic and nuclear SMAD2/3 signaling |
| 0.0 | 0.1 | PID TCPTP PATHWAY | Signaling events mediated by TCPTP |
| 0.0 | 0.2 | PID TOLL ENDOGENOUS PATHWAY | Endogenous TLR signaling |
| 0.0 | 0.7 | PID E2F PATHWAY | E2F transcription factor network |
| 0.0 | 0.9 | WNT SIGNALING | Genes related to Wnt-mediated signal transduction |
Gene overrepresentation in curated gene sets: REACTOME pathways category:
| Log-likelihood per target | Total log-likelihood | Term | Description |
|---|---|---|---|
| 2.0 | 36.9 | REACTOME ETHANOL OXIDATION | Genes involved in Ethanol oxidation |
| 0.5 | 13.3 | REACTOME HDL MEDIATED LIPID TRANSPORT | Genes involved in HDL-mediated lipid transport |
| 0.5 | 8.8 | REACTOME REVERSIBLE HYDRATION OF CARBON DIOXIDE | Genes involved in Reversible Hydration of Carbon Dioxide |
| 0.5 | 15.1 | REACTOME CS DS DEGRADATION | Genes involved in CS/DS degradation |
| 0.5 | 10.0 | REACTOME TRANSLOCATION OF ZAP 70 TO IMMUNOLOGICAL SYNAPSE | Genes involved in Translocation of ZAP-70 to Immunological synapse |
| 0.3 | 2.7 | REACTOME PHOSPHORYLATION OF CD3 AND TCR ZETA CHAINS | Genes involved in Phosphorylation of CD3 and TCR zeta chains |
| 0.3 | 9.3 | REACTOME REGULATION OF COMPLEMENT CASCADE | Genes involved in Regulation of Complement cascade |
| 0.3 | 10.5 | REACTOME GENERATION OF SECOND MESSENGER MOLECULES | Genes involved in Generation of second messenger molecules |
| 0.3 | 6.7 | REACTOME HYALURONAN UPTAKE AND DEGRADATION | Genes involved in Hyaluronan uptake and degradation |
| 0.3 | 13.5 | REACTOME FORMATION OF FIBRIN CLOT CLOTTING CASCADE | Genes involved in Formation of Fibrin Clot (Clotting Cascade) |
| 0.3 | 1.3 | REACTOME HYALURONAN METABOLISM | Genes involved in Hyaluronan metabolism |
| 0.3 | 43.8 | REACTOME RESPONSE TO ELEVATED PLATELET CYTOSOLIC CA2 | Genes involved in Response to elevated platelet cytosolic Ca2+ |
| 0.3 | 0.8 | REACTOME BINDING AND ENTRY OF HIV VIRION | Genes involved in Binding and entry of HIV virion |
| 0.3 | 3.3 | REACTOME PLATELET ADHESION TO EXPOSED COLLAGEN | Genes involved in Platelet Adhesion to exposed collagen |
| 0.2 | 5.7 | REACTOME SYNTHESIS SECRETION AND DEACYLATION OF GHRELIN | Genes involved in Synthesis, Secretion, and Deacylation of Ghrelin |
| 0.2 | 5.4 | REACTOME BILE SALT AND ORGANIC ANION SLC TRANSPORTERS | Genes involved in Bile salt and organic anion SLC transporters |
| 0.2 | 8.3 | REACTOME EXTRINSIC PATHWAY FOR APOPTOSIS | Genes involved in Extrinsic Pathway for Apoptosis |
| 0.2 | 1.1 | REACTOME TRAF6 MEDIATED IRF7 ACTIVATION | Genes involved in TRAF6 mediated IRF7 activation |
| 0.2 | 21.5 | REACTOME COLLAGEN FORMATION | Genes involved in Collagen formation |
| 0.2 | 2.1 | REACTOME SIGNAL REGULATORY PROTEIN SIRP FAMILY INTERACTIONS | Genes involved in Signal regulatory protein (SIRP) family interactions |
| 0.2 | 3.2 | REACTOME TRAFFICKING AND PROCESSING OF ENDOSOMAL TLR | Genes involved in Trafficking and processing of endosomal TLR |
| 0.2 | 7.3 | REACTOME AMYLOIDS | Genes involved in Amyloids |
| 0.2 | 2.5 | REACTOME TRYPTOPHAN CATABOLISM | Genes involved in Tryptophan catabolism |
| 0.2 | 2.8 | REACTOME THE NLRP3 INFLAMMASOME | Genes involved in The NLRP3 inflammasome |
| 0.2 | 1.1 | REACTOME PD1 SIGNALING | Genes involved in PD-1 signaling |
| 0.1 | 2.4 | REACTOME KERATAN SULFATE DEGRADATION | Genes involved in Keratan sulfate degradation |
| 0.1 | 4.1 | REACTOME SYNTHESIS OF BILE ACIDS AND BILE SALTS | Genes involved in Synthesis of bile acids and bile salts |
| 0.1 | 0.9 | REACTOME NFKB ACTIVATION THROUGH FADD RIP1 PATHWAY MEDIATED BY CASPASE 8 AND10 | Genes involved in NF-kB activation through FADD/RIP-1 pathway mediated by caspase-8 and -10 |
| 0.1 | 3.0 | REACTOME COMPLEMENT CASCADE | Genes involved in Complement cascade |
| 0.1 | 7.2 | REACTOME SMOOTH MUSCLE CONTRACTION | Genes involved in Smooth Muscle Contraction |
| 0.1 | 2.3 | REACTOME XENOBIOTICS | Genes involved in Xenobiotics |
| 0.1 | 4.5 | REACTOME IL RECEPTOR SHC SIGNALING | Genes involved in Interleukin receptor SHC signaling |
| 0.1 | 2.1 | REACTOME ACYL CHAIN REMODELLING OF PS | Genes involved in Acyl chain remodelling of PS |
| 0.1 | 2.6 | REACTOME P2Y RECEPTORS | Genes involved in P2Y receptors |
| 0.1 | 1.8 | REACTOME INFLAMMASOMES | Genes involved in Inflammasomes |
| 0.1 | 4.6 | REACTOME HORMONE SENSITIVE LIPASE HSL MEDIATED TRIACYLGLYCEROL HYDROLYSIS | Genes involved in Hormone-sensitive lipase (HSL)-mediated triacylglycerol hydrolysis |
| 0.1 | 7.6 | REACTOME CHEMOKINE RECEPTORS BIND CHEMOKINES | Genes involved in Chemokine receptors bind chemokines |
| 0.1 | 0.8 | REACTOME PEPTIDE CHAIN ELONGATION | Genes involved in Peptide chain elongation |
| 0.1 | 1.4 | REACTOME DIGESTION OF DIETARY CARBOHYDRATE | Genes involved in Digestion of dietary carbohydrate |
| 0.1 | 10.1 | REACTOME IMMUNOREGULATORY INTERACTIONS BETWEEN A LYMPHOID AND A NON LYMPHOID CELL | Genes involved in Immunoregulatory interactions between a Lymphoid and a non-Lymphoid cell |
| 0.1 | 2.9 | REACTOME DOWNSTREAM TCR SIGNALING | Genes involved in Downstream TCR signaling |
| 0.1 | 1.1 | REACTOME ELEVATION OF CYTOSOLIC CA2 LEVELS | Genes involved in Elevation of cytosolic Ca2+ levels |
| 0.1 | 1.9 | REACTOME PROLACTIN RECEPTOR SIGNALING | Genes involved in Prolactin receptor signaling |
| 0.1 | 8.6 | REACTOME METABOLISM OF VITAMINS AND COFACTORS | Genes involved in Metabolism of vitamins and cofactors |
| 0.1 | 2.3 | REACTOME CYTOSOLIC SULFONATION OF SMALL MOLECULES | Genes involved in Cytosolic sulfonation of small molecules |
| 0.1 | 9.9 | REACTOME CELL SURFACE INTERACTIONS AT THE VASCULAR WALL | Genes involved in Cell surface interactions at the vascular wall |
| 0.1 | 6.4 | REACTOME INTEGRIN CELL SURFACE INTERACTIONS | Genes involved in Integrin cell surface interactions |
| 0.1 | 2.0 | REACTOME ADVANCED GLYCOSYLATION ENDPRODUCT RECEPTOR SIGNALING | Genes involved in Advanced glycosylation endproduct receptor signaling |
| 0.1 | 3.2 | REACTOME DEFENSINS | Genes involved in Defensins |
| 0.1 | 19.1 | REACTOME OLFACTORY SIGNALING PATHWAY | Genes involved in Olfactory Signaling Pathway |
| 0.1 | 1.0 | REACTOME N GLYCAN TRIMMING IN THE ER AND CALNEXIN CALRETICULIN CYCLE | Genes involved in N-glycan trimming in the ER and Calnexin/Calreticulin cycle |
| 0.1 | 0.9 | REACTOME SIGNALING BY CONSTITUTIVELY ACTIVE EGFR | Genes involved in Signaling by constitutively active EGFR |
| 0.1 | 2.9 | REACTOME SIGNALING BY BMP | Genes involved in Signaling by BMP |
| 0.1 | 0.8 | REACTOME REGULATION OF INSULIN SECRETION BY ACETYLCHOLINE | Genes involved in Regulation of Insulin Secretion by Acetylcholine |
| 0.1 | 1.1 | REACTOME THROMBIN SIGNALLING THROUGH PROTEINASE ACTIVATED RECEPTORS PARS | Genes involved in Thrombin signalling through proteinase activated receptors (PARs) |
| 0.1 | 0.6 | REACTOME REGULATION OF THE FANCONI ANEMIA PATHWAY | Genes involved in Regulation of the Fanconi anemia pathway |
| 0.1 | 0.5 | REACTOME IKK COMPLEX RECRUITMENT MEDIATED BY RIP1 | Genes involved in IKK complex recruitment mediated by RIP1 |
| 0.1 | 3.5 | REACTOME IL1 SIGNALING | Genes involved in Interleukin-1 signaling |
| 0.1 | 0.3 | REACTOME RAF MAP KINASE CASCADE | Genes involved in RAF/MAP kinase cascade |
| 0.1 | 1.0 | REACTOME PYRIMIDINE CATABOLISM | Genes involved in Pyrimidine catabolism |
| 0.1 | 7.2 | REACTOME NUCLEAR RECEPTOR TRANSCRIPTION PATHWAY | Genes involved in Nuclear Receptor transcription pathway |
| 0.1 | 10.6 | REACTOME 3 UTR MEDIATED TRANSLATIONAL REGULATION | Genes involved in 3' -UTR-mediated translational regulation |
| 0.1 | 1.4 | REACTOME APOPTOTIC CLEAVAGE OF CELL ADHESION PROTEINS | Genes involved in Apoptotic cleavage of cell adhesion proteins |
| 0.1 | 2.5 | REACTOME ABC FAMILY PROTEINS MEDIATED TRANSPORT | Genes involved in ABC-family proteins mediated transport |
| 0.0 | 2.3 | REACTOME METAL ION SLC TRANSPORTERS | Genes involved in Metal ion SLC transporters |
| 0.0 | 4.5 | REACTOME INTERFERON GAMMA SIGNALING | Genes involved in Interferon gamma signaling |
| 0.0 | 1.8 | REACTOME RNA POL III TRANSCRIPTION TERMINATION | Genes involved in RNA Polymerase III Transcription Termination |
| 0.0 | 1.2 | REACTOME SIGNALING BY HIPPO | Genes involved in Signaling by Hippo |
| 0.0 | 1.3 | REACTOME N GLYCAN ANTENNAE ELONGATION | Genes involved in N-Glycan antennae elongation |
| 0.0 | 0.5 | REACTOME G ALPHA S SIGNALLING EVENTS | Genes involved in G alpha (s) signalling events |
| 0.0 | 0.5 | REACTOME A TETRASACCHARIDE LINKER SEQUENCE IS REQUIRED FOR GAG SYNTHESIS | Genes involved in A tetrasaccharide linker sequence is required for GAG synthesis |
| 0.0 | 1.4 | REACTOME EXTRACELLULAR MATRIX ORGANIZATION | Genes involved in Extracellular matrix organization |
| 0.0 | 1.0 | REACTOME NUCLEOTIDE BINDING DOMAIN LEUCINE RICH REPEAT CONTAINING RECEPTOR NLR SIGNALING PATHWAYS | Genes involved in Nucleotide-binding domain, leucine rich repeat containing receptor (NLR) signaling pathways |
| 0.0 | 1.6 | REACTOME HS GAG BIOSYNTHESIS | Genes involved in HS-GAG biosynthesis |
| 0.0 | 1.0 | REACTOME GAP JUNCTION DEGRADATION | Genes involved in Gap junction degradation |
| 0.0 | 0.4 | REACTOME CHYLOMICRON MEDIATED LIPID TRANSPORT | Genes involved in Chylomicron-mediated lipid transport |
| 0.0 | 1.7 | REACTOME INHIBITION OF VOLTAGE GATED CA2 CHANNELS VIA GBETA GAMMA SUBUNITS | Genes involved in Inhibition of voltage gated Ca2+ channels via Gbeta/gamma subunits |
| 0.0 | 1.0 | REACTOME NONSENSE MEDIATED DECAY ENHANCED BY THE EXON JUNCTION COMPLEX | Genes involved in Nonsense Mediated Decay Enhanced by the Exon Junction Complex |
| 0.0 | 2.3 | REACTOME ACTIVATION OF CHAPERONE GENES BY XBP1S | Genes involved in Activation of Chaperone Genes by XBP1(S) |
| 0.0 | 0.3 | REACTOME ERKS ARE INACTIVATED | Genes involved in ERKs are inactivated |
| 0.0 | 2.2 | REACTOME GOLGI ASSOCIATED VESICLE BIOGENESIS | Genes involved in Golgi Associated Vesicle Biogenesis |
| 0.0 | 0.2 | REACTOME REGULATION OF IFNA SIGNALING | Genes involved in Regulation of IFNA signaling |
| 0.0 | 0.8 | REACTOME INTERFERON ALPHA BETA SIGNALING | Genes involved in Interferon alpha/beta signaling |
| 0.0 | 1.1 | REACTOME AMINE COMPOUND SLC TRANSPORTERS | Genes involved in Amine compound SLC transporters |
| 0.0 | 1.3 | REACTOME MRNA 3 END PROCESSING | Genes involved in mRNA 3'-end processing |
| 0.0 | 0.2 | REACTOME ADP SIGNALLING THROUGH P2RY12 | Genes involved in ADP signalling through P2Y purinoceptor 12 |
| 0.0 | 0.6 | REACTOME SYNTHESIS OF PA | Genes involved in Synthesis of PA |
| 0.0 | 0.4 | REACTOME PEROXISOMAL LIPID METABOLISM | Genes involved in Peroxisomal lipid metabolism |
| 0.0 | 0.4 | REACTOME MRNA DECAY BY 5 TO 3 EXORIBONUCLEASE | Genes involved in mRNA Decay by 5' to 3' Exoribonuclease |
| 0.0 | 0.4 | REACTOME CLASS C 3 METABOTROPIC GLUTAMATE PHEROMONE RECEPTORS | Genes involved in Class C/3 (Metabotropic glutamate/pheromone receptors) |
| 0.0 | 0.1 | REACTOME PEPTIDE HORMONE BIOSYNTHESIS | Genes involved in Peptide hormone biosynthesis |
| 0.0 | 0.3 | REACTOME ACTIVATION OF RAC | Genes involved in Activation of Rac |
| 0.0 | 0.4 | REACTOME EFFECTS OF PIP2 HYDROLYSIS | Genes involved in Effects of PIP2 hydrolysis |
| 0.0 | 0.3 | REACTOME INSULIN SYNTHESIS AND PROCESSING | Genes involved in Insulin Synthesis and Processing |
| 0.0 | 0.5 | REACTOME AMINE LIGAND BINDING RECEPTORS | Genes involved in Amine ligand-binding receptors |
| 0.0 | 0.4 | REACTOME RNA POL II TRANSCRIPTION PRE INITIATION AND PROMOTER OPENING | Genes involved in RNA Polymerase II Transcription Pre-Initiation And Promoter Opening |
| 0.0 | 0.3 | REACTOME SYNTHESIS SECRETION AND INACTIVATION OF GLP1 | Genes involved in Synthesis, Secretion, and Inactivation of Glucagon-like Peptide-1 (GLP-1) |
| 0.0 | 0.2 | REACTOME CDC6 ASSOCIATION WITH THE ORC ORIGIN COMPLEX | Genes involved in CDC6 association with the ORC:origin complex |
| 0.0 | 0.0 | REACTOME BILE ACID AND BILE SALT METABOLISM | Genes involved in Bile acid and bile salt metabolism |