Project
Illumina Body Map 2 (GSE30611)
Navigation
Downloads
Results for FOXM1_TBL1XR1
Z-value: 2.52
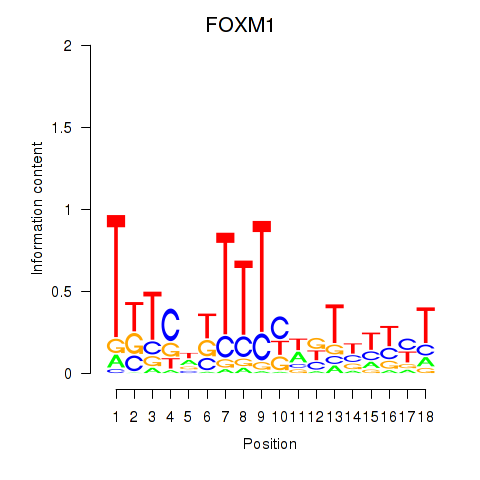
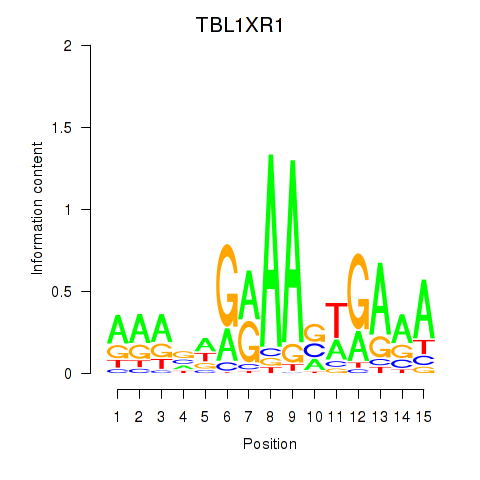
Motif logo
Transcription factors associated with FOXM1_TBL1XR1
| Gene Symbol | Gene ID | Gene Info |
|---|---|---|
|
FOXM1
|
ENSG00000111206.13 | forkhead box M1 |
|
TBL1XR1
|
ENSG00000177565.18 | TBL1X receptor 1 |
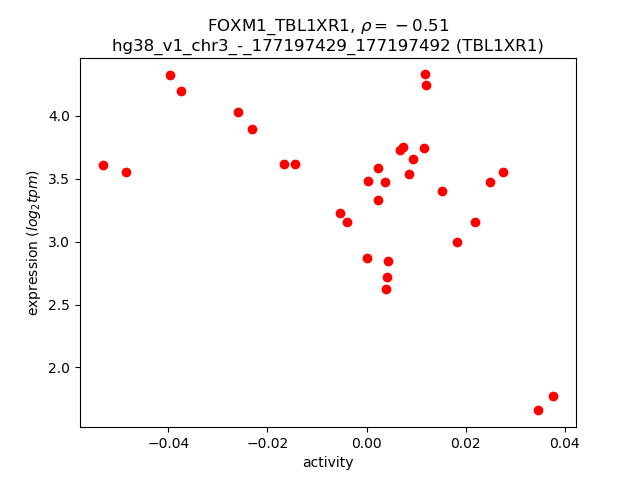
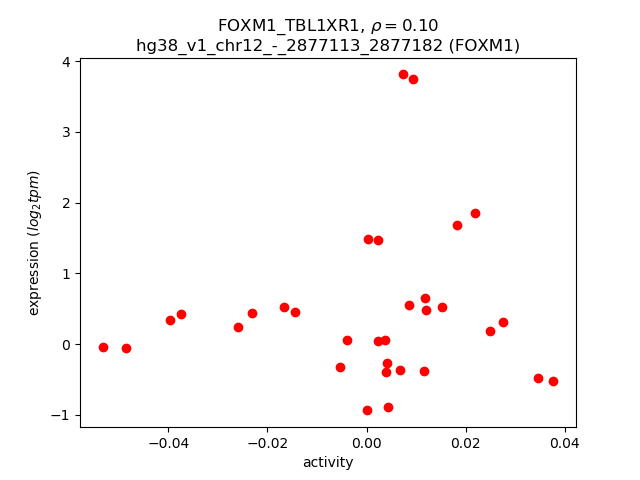
Activity-expression correlation:
| Gene | Promoter | Pearson corr. coef. | P-value | Plot |
|---|---|---|---|---|
| TBL1XR1 | hg38_v1_chr3_-_177197429_177197492 | -0.51 | 3.1e-03 | Click! |
| FOXM1 | hg38_v1_chr12_-_2877113_2877182 | 0.10 | 6.0e-01 | Click! |
Activity profile of FOXM1_TBL1XR1 motif
Sorted Z-values of FOXM1_TBL1XR1 motif
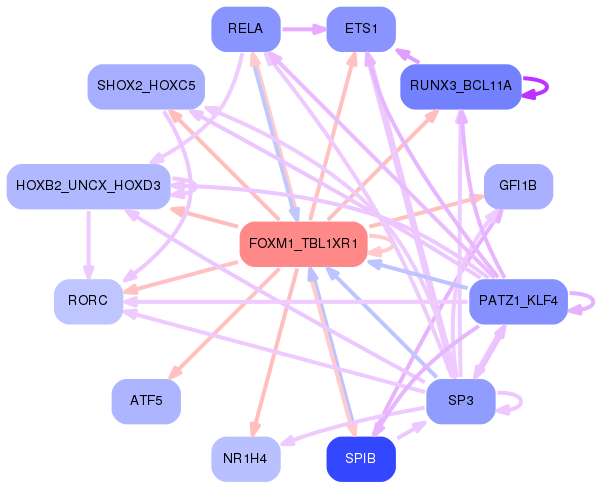
Network of associatons between targets according to the STRING database.

First level regulatory network of FOXM1_TBL1XR1
Gene Ontology Analysis
Gene overrepresentation in biological process category:
| Log-likelihood per target | Total log-likelihood | Term | Description |
|---|---|---|---|
| 3.0 | 12.0 | GO:0032690 | negative regulation of interleukin-1 alpha production(GO:0032690) negative regulation of interleukin-1 alpha secretion(GO:0050712) |
| 2.6 | 7.9 | GO:0052331 | hemolysis by symbiont of host erythrocytes(GO:0019836) hemolysis in other organism(GO:0044179) hemolysis in other organism involved in symbiotic interaction(GO:0052331) |
| 2.2 | 6.7 | GO:0002752 | cell surface pattern recognition receptor signaling pathway(GO:0002752) |
| 2.2 | 6.6 | GO:2000296 | negative regulation of hydrogen peroxide catabolic process(GO:2000296) |
| 2.1 | 14.4 | GO:0016098 | monoterpenoid metabolic process(GO:0016098) |
| 2.0 | 25.5 | GO:2000334 | blood microparticle formation(GO:0072564) regulation of blood microparticle formation(GO:2000332) positive regulation of blood microparticle formation(GO:2000334) |
| 1.9 | 7.4 | GO:0051919 | positive regulation of fibrinolysis(GO:0051919) |
| 1.8 | 1.8 | GO:2000520 | regulation of immunological synapse formation(GO:2000520) |
| 1.8 | 12.5 | GO:0002925 | positive regulation of humoral immune response mediated by circulating immunoglobulin(GO:0002925) |
| 1.8 | 8.9 | GO:0015855 | pyrimidine nucleobase transport(GO:0015855) purine nucleobase transmembrane transport(GO:1904823) |
| 1.7 | 5.2 | GO:2000502 | negative regulation of natural killer cell chemotaxis(GO:2000502) |
| 1.7 | 10.3 | GO:0038112 | interleukin-8-mediated signaling pathway(GO:0038112) |
| 1.7 | 5.1 | GO:0034769 | basement membrane disassembly(GO:0034769) |
| 1.7 | 6.7 | GO:0019805 | quinolinate biosynthetic process(GO:0019805) |
| 1.7 | 1.7 | GO:1903970 | negative regulation of macrophage colony-stimulating factor signaling pathway(GO:1902227) negative regulation of response to macrophage colony-stimulating factor(GO:1903970) negative regulation of cellular response to macrophage colony-stimulating factor stimulus(GO:1903973) |
| 1.7 | 8.3 | GO:2000471 | regulation of hematopoietic stem cell migration(GO:2000471) positive regulation of hematopoietic stem cell migration(GO:2000473) |
| 1.7 | 6.6 | GO:0010902 | positive regulation of very-low-density lipoprotein particle remodeling(GO:0010902) |
| 1.6 | 9.8 | GO:0010751 | negative regulation of nitric oxide mediated signal transduction(GO:0010751) |
| 1.6 | 4.7 | GO:0019442 | tryptophan catabolic process to acetyl-CoA(GO:0019442) |
| 1.6 | 1.6 | GO:0002325 | natural killer cell differentiation involved in immune response(GO:0002325) regulation of natural killer cell differentiation involved in immune response(GO:0032826) |
| 1.6 | 4.7 | GO:0006711 | estrogen catabolic process(GO:0006711) |
| 1.5 | 4.6 | GO:1903015 | regulation of exo-alpha-sialidase activity(GO:1903015) |
| 1.5 | 8.9 | GO:0009753 | response to jasmonic acid(GO:0009753) cellular response to jasmonic acid stimulus(GO:0071395) |
| 1.5 | 10.2 | GO:0070269 | pyroptosis(GO:0070269) |
| 1.4 | 7.2 | GO:0030573 | bile acid catabolic process(GO:0030573) |
| 1.4 | 8.6 | GO:0002277 | myeloid dendritic cell activation involved in immune response(GO:0002277) |
| 1.4 | 2.8 | GO:1902567 | negative regulation of eosinophil activation(GO:1902567) |
| 1.4 | 4.1 | GO:1903718 | carbamoyl phosphate metabolic process(GO:0070408) carbamoyl phosphate biosynthetic process(GO:0070409) response to ammonia(GO:1903717) cellular response to ammonia(GO:1903718) |
| 1.3 | 7.9 | GO:0034196 | acylglycerol transport(GO:0034196) triglyceride transport(GO:0034197) |
| 1.3 | 5.1 | GO:0046968 | peptide antigen transport(GO:0046968) |
| 1.3 | 3.8 | GO:0046110 | xanthine metabolic process(GO:0046110) |
| 1.3 | 6.4 | GO:1904073 | regulation of trophectodermal cell proliferation(GO:1904073) positive regulation of trophectodermal cell proliferation(GO:1904075) |
| 1.3 | 5.0 | GO:0060621 | negative regulation of cholesterol import(GO:0060621) negative regulation of sterol import(GO:2000910) |
| 1.2 | 13.5 | GO:0060267 | positive regulation of respiratory burst(GO:0060267) |
| 1.2 | 2.4 | GO:0050902 | leukocyte adhesive activation(GO:0050902) |
| 1.2 | 4.9 | GO:0010900 | negative regulation of phosphatidylcholine catabolic process(GO:0010900) |
| 1.2 | 4.8 | GO:0001869 | regulation of complement activation, lectin pathway(GO:0001868) negative regulation of complement activation, lectin pathway(GO:0001869) |
| 1.2 | 2.4 | GO:0002436 | immune complex clearance(GO:0002434) immune complex clearance by monocytes and macrophages(GO:0002436) regulation of immune complex clearance by monocytes and macrophages(GO:0090264) |
| 1.2 | 3.5 | GO:1990654 | sebum secreting cell proliferation(GO:1990654) |
| 1.2 | 13.0 | GO:0048003 | antigen processing and presentation of lipid antigen via MHC class Ib(GO:0048003) antigen processing and presentation, exogenous lipid antigen via MHC class Ib(GO:0048007) |
| 1.2 | 1.2 | GO:0002856 | negative regulation of response to tumor cell(GO:0002835) negative regulation of immune response to tumor cell(GO:0002838) negative regulation of natural killer cell mediated immune response to tumor cell(GO:0002856) negative regulation of natural killer cell mediated cytotoxicity directed against tumor cell target(GO:0002859) |
| 1.1 | 13.8 | GO:0052696 | flavonoid glucuronidation(GO:0052696) xenobiotic glucuronidation(GO:0052697) |
| 1.1 | 2.3 | GO:0002581 | negative regulation of antigen processing and presentation of peptide or polysaccharide antigen via MHC class II(GO:0002581) |
| 1.1 | 5.7 | GO:0002933 | lipid hydroxylation(GO:0002933) |
| 1.1 | 6.8 | GO:0090294 | nitrogen catabolite regulation of transcription from RNA polymerase II promoter(GO:0001079) nitrogen catabolite activation of transcription from RNA polymerase II promoter(GO:0001080) regulation of urea metabolic process(GO:0034255) intracellular bile acid receptor signaling pathway(GO:0038185) interleukin-17 secretion(GO:0072615) nitrogen catabolite regulation of transcription(GO:0090293) nitrogen catabolite activation of transcription(GO:0090294) regulation of nitrogen cycle metabolic process(GO:1903314) positive regulation of glutamate metabolic process(GO:2000213) regulation of ammonia assimilation cycle(GO:2001248) positive regulation of ammonia assimilation cycle(GO:2001250) |
| 1.1 | 11.3 | GO:1902715 | positive regulation of interferon-gamma secretion(GO:1902715) |
| 1.1 | 4.5 | GO:0002290 | gamma-delta T cell activation involved in immune response(GO:0002290) negative regulation of interferon-beta secretion(GO:0035548) regulation of gamma-delta T cell activation involved in immune response(GO:2001191) positive regulation of gamma-delta T cell activation involved in immune response(GO:2001193) |
| 1.1 | 3.4 | GO:0001812 | regulation of type I hypersensitivity(GO:0001810) positive regulation of type I hypersensitivity(GO:0001812) type I hypersensitivity(GO:0016068) |
| 1.1 | 11.2 | GO:0006001 | fructose catabolic process(GO:0006001) fructose catabolic process to hydroxyacetone phosphate and glyceraldehyde-3-phosphate(GO:0061624) |
| 1.1 | 3.3 | GO:0035397 | helper T cell enhancement of adaptive immune response(GO:0035397) |
| 1.1 | 4.5 | GO:0044145 | multi-organism catabolic process(GO:0044035) development of symbiont involved in interaction with host(GO:0044115) modulation of development of symbiont involved in interaction with host(GO:0044145) negative regulation of development of symbiont involved in interaction with host(GO:0044147) metabolism of substance in other organism involved in symbiotic interaction(GO:0052214) catabolism of substance in other organism involved in symbiotic interaction(GO:0052227) metabolism of macromolecule in other organism involved in symbiotic interaction(GO:0052229) catabolism by host of symbiont macromolecule(GO:0052360) catabolism by organism of macromolecule in other organism involved in symbiotic interaction(GO:0052361) catabolism by host of symbiont protein(GO:0052362) catabolism by organism of protein in other organism involved in symbiotic interaction(GO:0052363) catabolism by host of substance in symbiont(GO:0052364) metabolism by host of symbiont macromolecule(GO:0052416) metabolism by host of symbiont protein(GO:0052417) metabolism by organism of protein in other organism involved in symbiotic interaction(GO:0052418) metabolism by host of substance in symbiont(GO:0052419) |
| 1.1 | 3.3 | GO:0033082 | regulation of extrathymic T cell differentiation(GO:0033082) |
| 1.1 | 6.5 | GO:0060335 | positive regulation of response to interferon-gamma(GO:0060332) positive regulation of interferon-gamma-mediated signaling pathway(GO:0060335) |
| 1.1 | 12.9 | GO:0002291 | T cell activation via T cell receptor contact with antigen bound to MHC molecule on antigen presenting cell(GO:0002291) |
| 1.1 | 1.1 | GO:0030185 | nitric oxide transport(GO:0030185) |
| 1.1 | 3.2 | GO:2001183 | negative regulation of interleukin-12 secretion(GO:2001183) |
| 1.0 | 3.1 | GO:0002728 | negative regulation of natural killer cell cytokine production(GO:0002728) |
| 1.0 | 4.1 | GO:2000660 | negative regulation of interleukin-1-mediated signaling pathway(GO:2000660) |
| 1.0 | 3.0 | GO:0019303 | D-ribose catabolic process(GO:0019303) |
| 1.0 | 3.0 | GO:0002302 | CD8-positive, alpha-beta T cell differentiation involved in immune response(GO:0002302) |
| 1.0 | 14.0 | GO:0043152 | induction of bacterial agglutination(GO:0043152) |
| 1.0 | 2.9 | GO:0001970 | positive regulation of activation of membrane attack complex(GO:0001970) |
| 1.0 | 1.0 | GO:0090212 | negative regulation of establishment of blood-brain barrier(GO:0090212) |
| 1.0 | 156.9 | GO:0006958 | complement activation, classical pathway(GO:0006958) |
| 1.0 | 2.9 | GO:0001915 | negative regulation of T cell mediated cytotoxicity(GO:0001915) |
| 1.0 | 1.0 | GO:0009441 | glycolate metabolic process(GO:0009441) |
| 0.9 | 8.1 | GO:0045919 | positive regulation of cytolysis(GO:0045919) |
| 0.9 | 3.6 | GO:2000702 | regulation of cell proliferation involved in mesonephros development(GO:2000606) negative regulation of cell proliferation involved in mesonephros development(GO:2000607) fibroblast growth factor receptor signaling pathway involved in ureteric bud formation(GO:2000699) glial cell-derived neurotrophic factor receptor signaling pathway involved in ureteric bud formation(GO:2000701) regulation of fibroblast growth factor receptor signaling pathway involved in ureteric bud formation(GO:2000702) negative regulation of fibroblast growth factor receptor signaling pathway involved in ureteric bud formation(GO:2000703) regulation of glial cell-derived neurotrophic factor receptor signaling pathway involved in ureteric bud formation(GO:2000733) negative regulation of glial cell-derived neurotrophic factor receptor signaling pathway involved in ureteric bud formation(GO:2000734) |
| 0.9 | 4.4 | GO:0071934 | thiamine transmembrane transport(GO:0071934) |
| 0.9 | 0.9 | GO:0035566 | regulation of metanephros size(GO:0035566) |
| 0.9 | 4.3 | GO:0009608 | response to symbiont(GO:0009608) response to symbiotic bacterium(GO:0009609) |
| 0.9 | 14.7 | GO:0006069 | ethanol oxidation(GO:0006069) |
| 0.9 | 2.6 | GO:0071449 | cellular response to lipid hydroperoxide(GO:0071449) |
| 0.9 | 1.7 | GO:1903595 | positive regulation of histamine secretion by mast cell(GO:1903595) |
| 0.9 | 5.1 | GO:0010757 | negative regulation of plasminogen activation(GO:0010757) |
| 0.8 | 7.6 | GO:0042738 | exogenous drug catabolic process(GO:0042738) |
| 0.8 | 1.7 | GO:1905237 | response to cyclosporin A(GO:1905237) |
| 0.8 | 8.5 | GO:0007598 | blood coagulation, extrinsic pathway(GO:0007598) |
| 0.8 | 7.6 | GO:0006957 | complement activation, alternative pathway(GO:0006957) |
| 0.8 | 3.3 | GO:0007499 | ectoderm and mesoderm interaction(GO:0007499) |
| 0.8 | 4.9 | GO:1903904 | negative regulation of establishment of T cell polarity(GO:1903904) negative regulation of Rho guanyl-nucleotide exchange factor activity(GO:2001107) |
| 0.8 | 4.9 | GO:0071726 | toll-like receptor TLR6:TLR2 signaling pathway(GO:0038124) response to diacyl bacterial lipopeptide(GO:0071724) cellular response to diacyl bacterial lipopeptide(GO:0071726) |
| 0.8 | 8.2 | GO:0006572 | tyrosine catabolic process(GO:0006572) |
| 0.8 | 0.8 | GO:0032701 | negative regulation of interleukin-18 production(GO:0032701) |
| 0.8 | 2.4 | GO:0002636 | positive regulation of germinal center formation(GO:0002636) |
| 0.8 | 7.9 | GO:0038110 | interleukin-2-mediated signaling pathway(GO:0038110) |
| 0.8 | 1.6 | GO:0046967 | cytosol to ER transport(GO:0046967) |
| 0.8 | 3.9 | GO:0003366 | cell-matrix adhesion involved in ameboidal cell migration(GO:0003366) |
| 0.8 | 3.1 | GO:0032747 | positive regulation of interleukin-23 production(GO:0032747) |
| 0.8 | 3.1 | GO:0021569 | rhombomere 3 development(GO:0021569) |
| 0.8 | 3.0 | GO:1990086 | lens fiber cell apoptotic process(GO:1990086) |
| 0.8 | 7.5 | GO:0002480 | antigen processing and presentation of exogenous peptide antigen via MHC class I, TAP-independent(GO:0002480) |
| 0.7 | 3.7 | GO:0052199 | modulation by virus of host molecular function(GO:0039506) suppression by virus of host molecular function(GO:0039507) suppression by virus of host catalytic activity(GO:0039513) modulation by virus of host catalytic activity(GO:0039516) suppression by virus of host cysteine-type endopeptidase activity involved in apoptotic process(GO:0039650) negative regulation by symbiont of host catalytic activity(GO:0052053) negative regulation by symbiont of host molecular function(GO:0052056) modulation by symbiont of host catalytic activity(GO:0052148) negative regulation of catalytic activity in other organism involved in symbiotic interaction(GO:0052199) |
| 0.7 | 2.2 | GO:0071529 | cementum mineralization(GO:0071529) |
| 0.7 | 2.2 | GO:0097272 | ammonia homeostasis(GO:0097272) |
| 0.7 | 2.2 | GO:0002372 | myeloid dendritic cell cytokine production(GO:0002372) |
| 0.7 | 3.7 | GO:0042853 | L-alanine metabolic process(GO:0042851) L-alanine catabolic process(GO:0042853) |
| 0.7 | 15.3 | GO:0072378 | blood coagulation, fibrin clot formation(GO:0072378) |
| 0.7 | 5.1 | GO:0043316 | cytotoxic T cell degranulation(GO:0043316) positive regulation of constitutive secretory pathway(GO:1903435) |
| 0.7 | 2.2 | GO:0002380 | immunoglobulin secretion involved in immune response(GO:0002380) |
| 0.7 | 2.1 | GO:0002194 | hepatocyte cell migration(GO:0002194) otic placode formation(GO:0043049) branching involved in pancreas morphogenesis(GO:0061114) acinar cell differentiation(GO:0090425) positive regulation of forebrain neuron differentiation(GO:2000979) |
| 0.7 | 4.3 | GO:0071461 | cellular response to redox state(GO:0071461) |
| 0.7 | 3.5 | GO:0003245 | cardiac muscle tissue growth involved in heart morphogenesis(GO:0003245) |
| 0.7 | 1.4 | GO:0032829 | regulation of tolerance induction dependent upon immune response(GO:0002652) regulation of CD4-positive, CD25-positive, alpha-beta regulatory T cell differentiation(GO:0032829) positive regulation of CD4-positive, CD25-positive, alpha-beta regulatory T cell differentiation(GO:0032831) |
| 0.7 | 8.4 | GO:0002430 | complement receptor mediated signaling pathway(GO:0002430) |
| 0.7 | 25.0 | GO:0019835 | cytolysis(GO:0019835) |
| 0.7 | 10.3 | GO:0009812 | flavonoid metabolic process(GO:0009812) |
| 0.7 | 4.8 | GO:0001865 | NK T cell differentiation(GO:0001865) |
| 0.7 | 3.4 | GO:0008588 | release of cytoplasmic sequestered NF-kappaB(GO:0008588) |
| 0.7 | 13.6 | GO:0072540 | T-helper 17 cell lineage commitment(GO:0072540) |
| 0.7 | 2.7 | GO:2000307 | tumor necrosis factor (ligand) superfamily member 11 production(GO:0072535) regulation of tumor necrosis factor (ligand) superfamily member 11 production(GO:2000307) |
| 0.7 | 2.0 | GO:0002818 | intracellular defense response(GO:0002818) |
| 0.7 | 4.1 | GO:0036100 | leukotriene catabolic process(GO:0036100) leukotriene B4 catabolic process(GO:0036101) leukotriene B4 metabolic process(GO:0036102) icosanoid catabolic process(GO:1901523) fatty acid derivative catabolic process(GO:1901569) |
| 0.7 | 2.0 | GO:0002913 | positive regulation of T cell anergy(GO:0002669) positive regulation of lymphocyte anergy(GO:0002913) |
| 0.7 | 1.4 | GO:0015920 | lipopolysaccharide transport(GO:0015920) |
| 0.7 | 0.7 | GO:0035744 | T-helper 1 cell cytokine production(GO:0035744) |
| 0.7 | 1.3 | GO:0002503 | peptide antigen assembly with MHC class II protein complex(GO:0002503) |
| 0.7 | 0.7 | GO:0045091 | regulation of single stranded viral RNA replication via double stranded DNA intermediate(GO:0045091) |
| 0.7 | 2.7 | GO:0032804 | negative regulation of low-density lipoprotein particle receptor catabolic process(GO:0032804) |
| 0.7 | 2.0 | GO:2001202 | negative regulation of transforming growth factor-beta secretion(GO:2001202) |
| 0.7 | 2.6 | GO:0002774 | Fc receptor mediated inhibitory signaling pathway(GO:0002774) |
| 0.7 | 2.6 | GO:2000683 | mesodermal-endodermal cell signaling(GO:0003131) programmed DNA elimination(GO:0031049) chromosome breakage(GO:0031052) histone H2A-S139 phosphorylation(GO:0035978) regulation of cellular response to X-ray(GO:2000683) positive regulation of cellular response to X-ray(GO:2000685) |
| 0.7 | 5.2 | GO:2001199 | negative regulation of dendritic cell differentiation(GO:2001199) |
| 0.7 | 6.5 | GO:0019885 | antigen processing and presentation of endogenous peptide antigen via MHC class I(GO:0019885) |
| 0.7 | 1.3 | GO:0045082 | positive regulation of interleukin-10 biosynthetic process(GO:0045082) |
| 0.7 | 2.0 | GO:0070175 | positive regulation of enamel mineralization(GO:0070175) |
| 0.7 | 1.3 | GO:0045355 | negative regulation of interferon-alpha biosynthetic process(GO:0045355) |
| 0.7 | 43.6 | GO:0006953 | acute-phase response(GO:0006953) |
| 0.6 | 5.8 | GO:0061737 | leukotriene signaling pathway(GO:0061737) |
| 0.6 | 1.9 | GO:0035752 | lysosomal lumen pH elevation(GO:0035752) |
| 0.6 | 9.0 | GO:0072672 | neutrophil extravasation(GO:0072672) |
| 0.6 | 7.6 | GO:0019373 | epoxygenase P450 pathway(GO:0019373) |
| 0.6 | 2.5 | GO:0000915 | assembly of actomyosin apparatus involved in cytokinesis(GO:0000912) actomyosin contractile ring assembly(GO:0000915) actomyosin contractile ring organization(GO:0044837) |
| 0.6 | 3.2 | GO:0034395 | regulation of transcription from RNA polymerase II promoter in response to iron(GO:0034395) |
| 0.6 | 1.2 | GO:0038123 | toll-like receptor TLR1:TLR2 signaling pathway(GO:0038123) response to triacyl bacterial lipopeptide(GO:0071725) cellular response to triacyl bacterial lipopeptide(GO:0071727) |
| 0.6 | 4.3 | GO:0001867 | complement activation, lectin pathway(GO:0001867) |
| 0.6 | 0.6 | GO:0045591 | positive regulation of regulatory T cell differentiation(GO:0045591) |
| 0.6 | 3.7 | GO:1904996 | positive regulation of leukocyte adhesion to vascular endothelial cell(GO:1904996) |
| 0.6 | 2.4 | GO:0097534 | lymphoid lineage cell migration(GO:0097534) lymphoid lineage cell migration into thymus(GO:0097535) |
| 0.6 | 1.8 | GO:0050955 | thermoception(GO:0050955) |
| 0.6 | 1.8 | GO:0019747 | regulation of isoprenoid metabolic process(GO:0019747) |
| 0.6 | 2.3 | GO:0050883 | musculoskeletal movement, spinal reflex action(GO:0050883) |
| 0.6 | 4.7 | GO:0035655 | interleukin-18-mediated signaling pathway(GO:0035655) |
| 0.6 | 4.1 | GO:0038195 | urokinase plasminogen activator signaling pathway(GO:0038195) |
| 0.6 | 0.6 | GO:0051673 | membrane disruption in other organism(GO:0051673) |
| 0.6 | 1.7 | GO:0002540 | arachidonic acid metabolite production involved in inflammatory response(GO:0002538) leukotriene production involved in inflammatory response(GO:0002540) |
| 0.6 | 1.1 | GO:0099552 | trans-synaptic signaling by lipid, modulating synaptic transmission(GO:0099552) trans-synaptic signaling by endocannabinoid, modulating synaptic transmission(GO:0099553) |
| 0.6 | 2.3 | GO:0002322 | B cell proliferation involved in immune response(GO:0002322) |
| 0.6 | 1.7 | GO:2001280 | positive regulation of prostaglandin biosynthetic process(GO:0031394) positive regulation of unsaturated fatty acid biosynthetic process(GO:2001280) |
| 0.6 | 3.4 | GO:0002863 | positive regulation of inflammatory response to antigenic stimulus(GO:0002863) |
| 0.6 | 9.6 | GO:0015939 | pantothenate metabolic process(GO:0015939) |
| 0.6 | 1.1 | GO:0005988 | lactose metabolic process(GO:0005988) lactose biosynthetic process(GO:0005989) |
| 0.6 | 10.0 | GO:0002523 | leukocyte migration involved in inflammatory response(GO:0002523) |
| 0.6 | 2.8 | GO:2001184 | positive regulation of interleukin-12 secretion(GO:2001184) |
| 0.6 | 2.2 | GO:0032571 | response to vitamin K(GO:0032571) |
| 0.6 | 3.3 | GO:0001692 | histamine metabolic process(GO:0001692) |
| 0.5 | 1.1 | GO:1901860 | positive regulation of mitochondrial DNA metabolic process(GO:1901860) |
| 0.5 | 0.5 | GO:0034125 | negative regulation of MyD88-dependent toll-like receptor signaling pathway(GO:0034125) |
| 0.5 | 2.7 | GO:0010533 | regulation of activation of Janus kinase activity(GO:0010533) |
| 0.5 | 2.7 | GO:0043686 | co-translational protein modification(GO:0043686) |
| 0.5 | 1.6 | GO:0060474 | positive regulation of sperm motility involved in capacitation(GO:0060474) |
| 0.5 | 2.7 | GO:0070837 | dehydroascorbic acid transport(GO:0070837) |
| 0.5 | 9.5 | GO:0034374 | low-density lipoprotein particle remodeling(GO:0034374) |
| 0.5 | 2.1 | GO:0000711 | meiotic DNA repair synthesis(GO:0000711) |
| 0.5 | 2.1 | GO:0090467 | L-arginine import(GO:0043091) arginine import(GO:0090467) |
| 0.5 | 1.6 | GO:0032918 | polyamine acetylation(GO:0032917) spermidine acetylation(GO:0032918) |
| 0.5 | 3.6 | GO:0000821 | regulation of arginine metabolic process(GO:0000821) |
| 0.5 | 7.8 | GO:1900017 | positive regulation of cytokine production involved in inflammatory response(GO:1900017) |
| 0.5 | 1.0 | GO:0045085 | negative regulation of interleukin-2 biosynthetic process(GO:0045085) |
| 0.5 | 2.0 | GO:1903216 | regulation of protein processing involved in protein targeting to mitochondrion(GO:1903216) negative regulation of protein processing involved in protein targeting to mitochondrion(GO:1903217) |
| 0.5 | 3.5 | GO:0019557 | histidine catabolic process to glutamate and formamide(GO:0019556) histidine catabolic process to glutamate and formate(GO:0019557) formamide metabolic process(GO:0043606) |
| 0.5 | 1.0 | GO:1904844 | response to L-glutamine(GO:1904844) cellular response to L-glutamine(GO:1904845) |
| 0.5 | 2.5 | GO:0038043 | interleukin-5-mediated signaling pathway(GO:0038043) |
| 0.5 | 3.0 | GO:0043103 | adenosine catabolic process(GO:0006154) hypoxanthine salvage(GO:0043103) inosine biosynthetic process(GO:0046103) |
| 0.5 | 5.4 | GO:2001300 | lipoxin metabolic process(GO:2001300) |
| 0.5 | 1.0 | GO:0003290 | atrial septum secundum morphogenesis(GO:0003290) |
| 0.5 | 4.4 | GO:0019064 | fusion of virus membrane with host plasma membrane(GO:0019064) membrane fusion involved in viral entry into host cell(GO:0039663) multi-organism membrane fusion(GO:0044800) |
| 0.5 | 1.9 | GO:0021649 | vestibulocochlear nerve structural organization(GO:0021649) positive regulation of cytokine activity(GO:0060301) ganglion morphogenesis(GO:0061552) VEGF-activated neuropilin signaling pathway involved in axon guidance(GO:1902378) dorsal root ganglion morphogenesis(GO:1904835) otic placode development(GO:1905040) |
| 0.5 | 1.9 | GO:0061358 | negative regulation of Wnt protein secretion(GO:0061358) |
| 0.5 | 1.4 | GO:0002416 | IgG immunoglobulin transcytosis in epithelial cells mediated by FcRn immunoglobulin receptor(GO:0002416) |
| 0.5 | 3.4 | GO:0006049 | UDP-N-acetylglucosamine catabolic process(GO:0006049) |
| 0.5 | 1.9 | GO:0042695 | thelarche(GO:0042695) mammary gland branching involved in thelarche(GO:0060744) |
| 0.5 | 1.4 | GO:0090675 | intermicrovillar adhesion(GO:0090675) |
| 0.5 | 0.9 | GO:0010520 | regulation of reciprocal meiotic recombination(GO:0010520) |
| 0.5 | 1.4 | GO:0070103 | regulation of interleukin-6-mediated signaling pathway(GO:0070103) positive regulation of interleukin-6-mediated signaling pathway(GO:0070105) |
| 0.5 | 1.4 | GO:0061182 | negative regulation of chondrocyte development(GO:0061182) |
| 0.5 | 1.4 | GO:1904479 | negative regulation of intestinal absorption(GO:1904479) |
| 0.5 | 1.4 | GO:0042946 | glucoside transport(GO:0042946) |
| 0.5 | 2.8 | GO:0060369 | positive regulation of natural killer cell cytokine production(GO:0002729) positive regulation of Fc receptor mediated stimulatory signaling pathway(GO:0060369) |
| 0.5 | 5.6 | GO:0032364 | oxygen homeostasis(GO:0032364) |
| 0.5 | 0.5 | GO:0070383 | DNA cytosine deamination(GO:0070383) |
| 0.5 | 0.5 | GO:0003032 | detection of oxygen(GO:0003032) |
| 0.5 | 0.5 | GO:0090164 | asymmetric Golgi ribbon formation(GO:0090164) |
| 0.5 | 0.9 | GO:2000321 | positive regulation of T-helper 17 cell differentiation(GO:2000321) |
| 0.5 | 5.0 | GO:2000271 | positive regulation of fibroblast apoptotic process(GO:2000271) |
| 0.5 | 4.1 | GO:0009972 | cytidine catabolic process(GO:0006216) cytidine deamination(GO:0009972) cytidine metabolic process(GO:0046087) |
| 0.5 | 3.2 | GO:0006651 | diacylglycerol biosynthetic process(GO:0006651) |
| 0.5 | 4.1 | GO:0032929 | negative regulation of superoxide anion generation(GO:0032929) |
| 0.4 | 4.5 | GO:0052695 | cellular glucuronidation(GO:0052695) |
| 0.4 | 1.3 | GO:1904211 | membrane protein proteolysis involved in retrograde protein transport, ER to cytosol(GO:1904211) |
| 0.4 | 1.3 | GO:0014813 | skeletal muscle satellite cell commitment(GO:0014813) |
| 0.4 | 0.4 | GO:0050787 | detoxification of mercury ion(GO:0050787) |
| 0.4 | 1.3 | GO:0010918 | positive regulation of mitochondrial membrane potential(GO:0010918) |
| 0.4 | 4.8 | GO:0072539 | T-helper 17 cell differentiation(GO:0072539) |
| 0.4 | 1.3 | GO:0048058 | compound eye corneal lens development(GO:0048058) |
| 0.4 | 1.7 | GO:0002543 | activation of blood coagulation via clotting cascade(GO:0002543) phosphatidylserine exposure on blood platelet(GO:0097045) |
| 0.4 | 1.7 | GO:1904045 | cellular response to aldosterone(GO:1904045) |
| 0.4 | 7.4 | GO:0046449 | creatinine metabolic process(GO:0046449) |
| 0.4 | 3.9 | GO:0033632 | regulation of cell-cell adhesion mediated by integrin(GO:0033632) |
| 0.4 | 0.4 | GO:0032494 | response to peptidoglycan(GO:0032494) |
| 0.4 | 3.9 | GO:0001909 | leukocyte mediated cytotoxicity(GO:0001909) |
| 0.4 | 0.4 | GO:1903433 | regulation of constitutive secretory pathway(GO:1903433) |
| 0.4 | 1.7 | GO:1900111 | positive regulation of histone H3-K9 dimethylation(GO:1900111) |
| 0.4 | 1.3 | GO:0034441 | plasma lipoprotein particle oxidation(GO:0034441) |
| 0.4 | 0.8 | GO:0035915 | pore formation in membrane of other organism(GO:0035915) |
| 0.4 | 3.0 | GO:0060263 | regulation of respiratory burst(GO:0060263) |
| 0.4 | 13.4 | GO:0050869 | negative regulation of B cell activation(GO:0050869) |
| 0.4 | 3.4 | GO:0010898 | positive regulation of triglyceride catabolic process(GO:0010898) |
| 0.4 | 1.3 | GO:1900365 | positive regulation of mRNA polyadenylation(GO:1900365) |
| 0.4 | 2.5 | GO:2000173 | regulation of neuron remodeling(GO:1904799) negative regulation of neuron remodeling(GO:1904800) negative regulation of branching morphogenesis of a nerve(GO:2000173) |
| 0.4 | 0.8 | GO:0031938 | regulation of chromatin silencing at telomere(GO:0031938) |
| 0.4 | 5.4 | GO:0044146 | negative regulation of growth of symbiont involved in interaction with host(GO:0044146) |
| 0.4 | 0.4 | GO:0006532 | aspartate biosynthetic process(GO:0006532) |
| 0.4 | 0.4 | GO:1902617 | response to fluoride(GO:1902617) |
| 0.4 | 2.5 | GO:0005985 | sucrose metabolic process(GO:0005985) |
| 0.4 | 2.5 | GO:0033700 | phospholipid efflux(GO:0033700) |
| 0.4 | 1.2 | GO:0003192 | mitral valve formation(GO:0003192) |
| 0.4 | 1.7 | GO:1902713 | regulation of interferon-gamma secretion(GO:1902713) |
| 0.4 | 0.8 | GO:0000255 | allantoin metabolic process(GO:0000255) |
| 0.4 | 1.2 | GO:1902594 | viral penetration into host nucleus(GO:0075732) multi-organism nuclear import(GO:1902594) |
| 0.4 | 2.4 | GO:0045348 | positive regulation of MHC class II biosynthetic process(GO:0045348) |
| 0.4 | 1.2 | GO:0060309 | elastin catabolic process(GO:0060309) |
| 0.4 | 2.8 | GO:0001920 | negative regulation of receptor recycling(GO:0001920) |
| 0.4 | 1.2 | GO:0021793 | chemorepulsion of branchiomotor axon(GO:0021793) |
| 0.4 | 4.8 | GO:0016554 | cytidine to uridine editing(GO:0016554) |
| 0.4 | 10.8 | GO:0006054 | N-acetylneuraminate metabolic process(GO:0006054) |
| 0.4 | 2.4 | GO:1903377 | negative regulation of oxidative stress-induced neuron intrinsic apoptotic signaling pathway(GO:1903377) |
| 0.4 | 1.2 | GO:2000797 | amniotic stem cell differentiation(GO:0097086) negative regulation of dense core granule biogenesis(GO:2000706) negative regulation of mesenchymal stem cell differentiation(GO:2000740) regulation of amniotic stem cell differentiation(GO:2000797) negative regulation of amniotic stem cell differentiation(GO:2000798) |
| 0.4 | 0.4 | GO:0071639 | positive regulation of monocyte chemotactic protein-1 production(GO:0071639) |
| 0.4 | 0.4 | GO:0046102 | inosine metabolic process(GO:0046102) |
| 0.4 | 1.2 | GO:0021524 | visceral motor neuron differentiation(GO:0021524) |
| 0.4 | 0.4 | GO:0002501 | peptide antigen assembly with MHC protein complex(GO:0002501) |
| 0.4 | 4.7 | GO:0060665 | regulation of branching involved in salivary gland morphogenesis by mesenchymal-epithelial signaling(GO:0060665) |
| 0.4 | 9.2 | GO:0071803 | positive regulation of podosome assembly(GO:0071803) |
| 0.4 | 2.3 | GO:0071315 | cellular response to morphine(GO:0071315) cellular response to isoquinoline alkaloid(GO:0071317) |
| 0.4 | 0.8 | GO:0060003 | copper ion export(GO:0060003) |
| 0.4 | 1.1 | GO:1904784 | NLRP1 inflammasome complex assembly(GO:1904784) |
| 0.4 | 0.4 | GO:0060392 | negative regulation of SMAD protein import into nucleus(GO:0060392) |
| 0.4 | 0.7 | GO:0071502 | cellular response to temperature stimulus(GO:0071502) |
| 0.4 | 1.5 | GO:0044537 | regulation of circulating fibrinogen levels(GO:0044537) |
| 0.4 | 1.9 | GO:1901164 | negative regulation of trophoblast cell migration(GO:1901164) |
| 0.4 | 0.4 | GO:0046532 | regulation of photoreceptor cell differentiation(GO:0046532) |
| 0.4 | 2.2 | GO:2000653 | regulation of genetic imprinting(GO:2000653) |
| 0.4 | 0.7 | GO:0032911 | negative regulation of transforming growth factor beta1 production(GO:0032911) |
| 0.4 | 1.5 | GO:0038183 | bile acid signaling pathway(GO:0038183) |
| 0.4 | 1.1 | GO:0042986 | positive regulation of amyloid precursor protein biosynthetic process(GO:0042986) |
| 0.4 | 1.1 | GO:0033364 | mast cell secretory granule organization(GO:0033364) |
| 0.4 | 3.3 | GO:0031666 | positive regulation of lipopolysaccharide-mediated signaling pathway(GO:0031666) |
| 0.4 | 1.1 | GO:0017186 | peptidyl-pyroglutamic acid biosynthetic process, using glutaminyl-peptide cyclotransferase(GO:0017186) |
| 0.4 | 0.7 | GO:0038158 | granulocyte colony-stimulating factor signaling pathway(GO:0038158) |
| 0.4 | 70.4 | GO:0002377 | immunoglobulin production(GO:0002377) |
| 0.4 | 1.4 | GO:0002881 | negative regulation of chronic inflammatory response to non-antigenic stimulus(GO:0002881) |
| 0.4 | 8.6 | GO:0050832 | defense response to fungus(GO:0050832) |
| 0.4 | 1.1 | GO:0042938 | dipeptide transport(GO:0042938) |
| 0.4 | 2.1 | GO:0019060 | intracellular transport of viral protein in host cell(GO:0019060) symbiont intracellular protein transport in host(GO:0030581) intracellular protein transport in other organism involved in symbiotic interaction(GO:0051708) |
| 0.4 | 1.1 | GO:0002415 | immunoglobulin transcytosis in epithelial cells mediated by polymeric immunoglobulin receptor(GO:0002415) |
| 0.4 | 0.4 | GO:0043380 | regulation of memory T cell differentiation(GO:0043380) |
| 0.4 | 1.1 | GO:1901053 | sarcosine metabolic process(GO:1901052) sarcosine catabolic process(GO:1901053) |
| 0.4 | 1.1 | GO:0048561 | establishment of organ orientation(GO:0048561) |
| 0.4 | 0.7 | GO:0002414 | immunoglobulin transcytosis in epithelial cells(GO:0002414) |
| 0.4 | 1.4 | GO:0001787 | natural killer cell proliferation(GO:0001787) |
| 0.4 | 1.1 | GO:0002309 | T cell proliferation involved in immune response(GO:0002309) |
| 0.4 | 1.4 | GO:0002347 | response to tumor cell(GO:0002347) |
| 0.4 | 0.4 | GO:0070543 | response to linoleic acid(GO:0070543) |
| 0.4 | 1.8 | GO:0060370 | susceptibility to T cell mediated cytotoxicity(GO:0060370) |
| 0.4 | 0.4 | GO:2000399 | negative regulation of T cell differentiation in thymus(GO:0033085) negative regulation of thymocyte aggregation(GO:2000399) |
| 0.4 | 1.8 | GO:0009253 | peptidoglycan metabolic process(GO:0000270) peptidoglycan catabolic process(GO:0009253) |
| 0.3 | 1.4 | GO:0044691 | tooth eruption(GO:0044691) |
| 0.3 | 1.0 | GO:0015722 | canalicular bile acid transport(GO:0015722) |
| 0.3 | 1.4 | GO:0009624 | response to nematode(GO:0009624) |
| 0.3 | 0.7 | GO:0034154 | toll-like receptor 7 signaling pathway(GO:0034154) |
| 0.3 | 0.3 | GO:0033594 | response to hydroxyisoflavone(GO:0033594) |
| 0.3 | 2.0 | GO:0070378 | positive regulation of ERK5 cascade(GO:0070378) |
| 0.3 | 1.0 | GO:0071469 | cellular response to alkaline pH(GO:0071469) |
| 0.3 | 0.7 | GO:2000547 | regulation of dendritic cell dendrite assembly(GO:2000547) |
| 0.3 | 1.3 | GO:0033037 | polysaccharide localization(GO:0033037) |
| 0.3 | 1.0 | GO:0050928 | negative regulation of positive chemotaxis(GO:0050928) |
| 0.3 | 2.0 | GO:0050859 | negative regulation of B cell receptor signaling pathway(GO:0050859) |
| 0.3 | 2.0 | GO:0006177 | GMP biosynthetic process(GO:0006177) |
| 0.3 | 3.6 | GO:0036112 | medium-chain fatty-acyl-CoA metabolic process(GO:0036112) |
| 0.3 | 1.0 | GO:1902044 | regulation of Fas signaling pathway(GO:1902044) |
| 0.3 | 1.0 | GO:1902173 | negative regulation of keratinocyte apoptotic process(GO:1902173) |
| 0.3 | 4.0 | GO:0070424 | regulation of nucleotide-binding oligomerization domain containing signaling pathway(GO:0070424) |
| 0.3 | 1.3 | GO:0097501 | stress response to metal ion(GO:0097501) |
| 0.3 | 2.0 | GO:1903265 | positive regulation of tumor necrosis factor-mediated signaling pathway(GO:1903265) |
| 0.3 | 0.7 | GO:0046322 | negative regulation of fatty acid oxidation(GO:0046322) |
| 0.3 | 2.9 | GO:0032782 | bile acid secretion(GO:0032782) |
| 0.3 | 0.6 | GO:0007079 | mitotic chromosome movement towards spindle pole(GO:0007079) |
| 0.3 | 1.3 | GO:1902283 | negative regulation of primary amine oxidase activity(GO:1902283) |
| 0.3 | 52.0 | GO:0006614 | SRP-dependent cotranslational protein targeting to membrane(GO:0006614) |
| 0.3 | 0.3 | GO:0050653 | chondroitin sulfate proteoglycan biosynthetic process, polysaccharide chain biosynthetic process(GO:0050653) |
| 0.3 | 1.6 | GO:0090156 | cellular sphingolipid homeostasis(GO:0090156) |
| 0.3 | 14.5 | GO:0050829 | defense response to Gram-negative bacterium(GO:0050829) |
| 0.3 | 4.2 | GO:0048743 | positive regulation of skeletal muscle fiber development(GO:0048743) |
| 0.3 | 1.3 | GO:0034224 | cellular response to zinc ion starvation(GO:0034224) |
| 0.3 | 2.9 | GO:0072643 | interferon-gamma secretion(GO:0072643) |
| 0.3 | 0.6 | GO:0034124 | regulation of MyD88-dependent toll-like receptor signaling pathway(GO:0034124) |
| 0.3 | 0.9 | GO:0035992 | tendon cell differentiation(GO:0035990) tendon formation(GO:0035992) |
| 0.3 | 4.7 | GO:0097296 | activation of cysteine-type endopeptidase activity involved in apoptotic signaling pathway(GO:0097296) |
| 0.3 | 1.6 | GO:0060751 | epithelial cell proliferation involved in mammary gland duct elongation(GO:0060750) branch elongation involved in mammary gland duct branching(GO:0060751) |
| 0.3 | 0.9 | GO:0033031 | positive regulation of neutrophil apoptotic process(GO:0033031) |
| 0.3 | 1.2 | GO:1903173 | phytol metabolic process(GO:0033306) fatty alcohol metabolic process(GO:1903173) |
| 0.3 | 0.3 | GO:0042746 | regulation of circadian sleep/wake cycle, wakefulness(GO:0010840) circadian sleep/wake cycle, wakefulness(GO:0042746) |
| 0.3 | 1.5 | GO:0051001 | negative regulation of nitric-oxide synthase activity(GO:0051001) |
| 0.3 | 0.6 | GO:1903352 | L-ornithine transmembrane transport(GO:1903352) |
| 0.3 | 0.9 | GO:0006982 | response to lipid hydroperoxide(GO:0006982) |
| 0.3 | 1.5 | GO:0034350 | regulation of glial cell apoptotic process(GO:0034350) negative regulation of glial cell apoptotic process(GO:0034351) |
| 0.3 | 0.9 | GO:0003218 | cardiac left ventricle formation(GO:0003218) |
| 0.3 | 1.8 | GO:0003409 | optic cup structural organization(GO:0003409) |
| 0.3 | 2.8 | GO:0051343 | positive regulation of cyclic-nucleotide phosphodiesterase activity(GO:0051343) |
| 0.3 | 5.8 | GO:0045730 | respiratory burst(GO:0045730) |
| 0.3 | 0.9 | GO:0002883 | regulation of hypersensitivity(GO:0002883) |
| 0.3 | 2.1 | GO:0044878 | mitotic cytokinesis checkpoint(GO:0044878) |
| 0.3 | 1.2 | GO:0051918 | negative regulation of fibrinolysis(GO:0051918) |
| 0.3 | 11.1 | GO:0043029 | T cell homeostasis(GO:0043029) |
| 0.3 | 4.5 | GO:0010815 | bradykinin catabolic process(GO:0010815) |
| 0.3 | 3.9 | GO:0034116 | positive regulation of heterotypic cell-cell adhesion(GO:0034116) |
| 0.3 | 18.3 | GO:0030212 | hyaluronan metabolic process(GO:0030212) |
| 0.3 | 15.2 | GO:0048247 | lymphocyte chemotaxis(GO:0048247) |
| 0.3 | 2.4 | GO:0045084 | positive regulation of interleukin-12 biosynthetic process(GO:0045084) |
| 0.3 | 7.8 | GO:0040015 | negative regulation of multicellular organism growth(GO:0040015) |
| 0.3 | 2.1 | GO:0071550 | death-inducing signaling complex assembly(GO:0071550) |
| 0.3 | 2.7 | GO:0042094 | interleukin-2 biosynthetic process(GO:0042094) |
| 0.3 | 0.9 | GO:0060018 | astrocyte fate commitment(GO:0060018) |
| 0.3 | 1.5 | GO:0044026 | DNA hypermethylation(GO:0044026) |
| 0.3 | 20.3 | GO:0006968 | cellular defense response(GO:0006968) |
| 0.3 | 2.0 | GO:0034447 | very-low-density lipoprotein particle clearance(GO:0034447) |
| 0.3 | 31.8 | GO:0031295 | T cell costimulation(GO:0031295) |
| 0.3 | 0.3 | GO:0006524 | alanine metabolic process(GO:0006522) alanine catabolic process(GO:0006524) pyruvate family amino acid metabolic process(GO:0009078) pyruvate family amino acid catabolic process(GO:0009080) |
| 0.3 | 3.5 | GO:0090023 | positive regulation of neutrophil chemotaxis(GO:0090023) |
| 0.3 | 0.9 | GO:0071314 | cellular response to cocaine(GO:0071314) |
| 0.3 | 2.0 | GO:0072011 | glomerular endothelium development(GO:0072011) |
| 0.3 | 1.1 | GO:0090119 | vesicle-mediated cholesterol transport(GO:0090119) |
| 0.3 | 2.0 | GO:0033629 | negative regulation of cell adhesion mediated by integrin(GO:0033629) |
| 0.3 | 1.1 | GO:0031064 | negative regulation of histone deacetylation(GO:0031064) |
| 0.3 | 2.5 | GO:0015793 | glycerol transport(GO:0015793) |
| 0.3 | 2.5 | GO:0032695 | negative regulation of interleukin-12 production(GO:0032695) |
| 0.3 | 2.8 | GO:0002675 | positive regulation of acute inflammatory response(GO:0002675) |
| 0.3 | 1.7 | GO:0060010 | Sertoli cell fate commitment(GO:0060010) |
| 0.3 | 1.4 | GO:0090341 | negative regulation of secretion of lysosomal enzymes(GO:0090341) |
| 0.3 | 0.3 | GO:0007341 | penetration of zona pellucida(GO:0007341) |
| 0.3 | 2.5 | GO:0070508 | sterol import(GO:0035376) cholesterol import(GO:0070508) |
| 0.3 | 1.4 | GO:0046900 | tetrahydrofolylpolyglutamate metabolic process(GO:0046900) |
| 0.3 | 1.4 | GO:0038163 | thrombopoietin-mediated signaling pathway(GO:0038163) |
| 0.3 | 2.2 | GO:0008582 | regulation of synaptic growth at neuromuscular junction(GO:0008582) |
| 0.3 | 0.8 | GO:1902616 | acyl carnitine transport(GO:0006844) acyl carnitine transmembrane transport(GO:1902616) |
| 0.3 | 0.8 | GO:0007060 | male meiosis chromosome segregation(GO:0007060) |
| 0.3 | 2.5 | GO:0033299 | secretion of lysosomal enzymes(GO:0033299) |
| 0.3 | 1.1 | GO:0015680 | intracellular copper ion transport(GO:0015680) |
| 0.3 | 6.0 | GO:0034356 | NAD biosynthesis via nicotinamide riboside salvage pathway(GO:0034356) |
| 0.3 | 0.8 | GO:0090022 | regulation of neutrophil chemotaxis(GO:0090022) |
| 0.3 | 12.6 | GO:0033198 | response to ATP(GO:0033198) |
| 0.3 | 1.4 | GO:0001757 | somite specification(GO:0001757) |
| 0.3 | 21.3 | GO:0018279 | protein N-linked glycosylation via asparagine(GO:0018279) |
| 0.3 | 1.6 | GO:0000117 | regulation of transcription involved in G2/M transition of mitotic cell cycle(GO:0000117) |
| 0.3 | 6.0 | GO:0045577 | regulation of B cell differentiation(GO:0045577) |
| 0.3 | 1.1 | GO:0060928 | atrioventricular node development(GO:0003162) cardiac septum cell differentiation(GO:0003292) atrioventricular node cell differentiation(GO:0060922) atrioventricular node cell development(GO:0060928) |
| 0.3 | 0.3 | GO:2000646 | positive regulation of receptor catabolic process(GO:2000646) |
| 0.3 | 3.8 | GO:0015747 | urate transport(GO:0015747) |
| 0.3 | 1.6 | GO:1902255 | positive regulation of intrinsic apoptotic signaling pathway by p53 class mediator(GO:1902255) |
| 0.3 | 0.8 | GO:0016267 | O-glycan processing, core 1(GO:0016267) |
| 0.3 | 1.6 | GO:1903490 | regulation of cytokinetic process(GO:0032954) regulation of mitotic cytokinetic process(GO:1903436) positive regulation of mitotic cytokinetic process(GO:1903438) positive regulation of mitotic cytokinesis(GO:1903490) |
| 0.3 | 1.8 | GO:0010940 | positive regulation of necrotic cell death(GO:0010940) |
| 0.3 | 0.5 | GO:0046121 | deoxyribonucleoside catabolic process(GO:0046121) |
| 0.3 | 0.5 | GO:0044725 | chromatin reprogramming in the zygote(GO:0044725) |
| 0.3 | 1.0 | GO:1904017 | cellular response to Thyroglobulin triiodothyronine(GO:1904017) |
| 0.3 | 0.5 | GO:0070173 | regulation of enamel mineralization(GO:0070173) |
| 0.3 | 1.0 | GO:0045209 | MAPK phosphatase export from nucleus(GO:0045208) MAPK phosphatase export from nucleus, leptomycin B sensitive(GO:0045209) |
| 0.3 | 0.5 | GO:1903862 | positive regulation of oxidative phosphorylation(GO:1903862) |
| 0.3 | 1.8 | GO:0072513 | positive regulation of secondary heart field cardioblast proliferation(GO:0072513) |
| 0.3 | 1.0 | GO:1903225 | negative regulation of endodermal cell differentiation(GO:1903225) |
| 0.3 | 1.0 | GO:0061113 | pancreas morphogenesis(GO:0061113) |
| 0.3 | 3.4 | GO:0032020 | ISG15-protein conjugation(GO:0032020) |
| 0.3 | 1.8 | GO:0070966 | nuclear-transcribed mRNA catabolic process, no-go decay(GO:0070966) |
| 0.3 | 0.5 | GO:0045074 | interleukin-10 biosynthetic process(GO:0042091) regulation of interleukin-10 biosynthetic process(GO:0045074) |
| 0.3 | 0.3 | GO:0048619 | embryonic hindgut morphogenesis(GO:0048619) |
| 0.3 | 0.8 | GO:0006097 | glyoxylate cycle(GO:0006097) |
| 0.3 | 0.5 | GO:0002361 | CD4-positive, CD25-positive, alpha-beta regulatory T cell differentiation(GO:0002361) |
| 0.3 | 1.8 | GO:0090095 | regulation of metanephric cap mesenchymal cell proliferation(GO:0090095) positive regulation of metanephric cap mesenchymal cell proliferation(GO:0090096) |
| 0.3 | 0.8 | GO:1904252 | negative regulation of bile acid biosynthetic process(GO:0070858) negative regulation of bile acid metabolic process(GO:1904252) |
| 0.3 | 1.8 | GO:0006613 | cotranslational protein targeting to membrane(GO:0006613) |
| 0.3 | 0.3 | GO:0006014 | D-ribose metabolic process(GO:0006014) |
| 0.2 | 4.5 | GO:0032000 | positive regulation of fatty acid beta-oxidation(GO:0032000) |
| 0.2 | 1.7 | GO:2000189 | positive regulation of cholesterol homeostasis(GO:2000189) |
| 0.2 | 1.0 | GO:0021546 | rhombomere development(GO:0021546) |
| 0.2 | 12.4 | GO:0002228 | natural killer cell mediated immunity(GO:0002228) |
| 0.2 | 1.2 | GO:1900108 | negative regulation of nodal signaling pathway(GO:1900108) |
| 0.2 | 0.5 | GO:0051574 | positive regulation of histone H3-K9 methylation(GO:0051574) |
| 0.2 | 0.5 | GO:0032258 | CVT pathway(GO:0032258) |
| 0.2 | 2.4 | GO:0018401 | peptidyl-proline hydroxylation to 4-hydroxy-L-proline(GO:0018401) |
| 0.2 | 1.0 | GO:0018277 | protein deamination(GO:0018277) |
| 0.2 | 4.9 | GO:0030277 | maintenance of gastrointestinal epithelium(GO:0030277) |
| 0.2 | 1.0 | GO:0060179 | male mating behavior(GO:0060179) |
| 0.2 | 0.5 | GO:0032714 | negative regulation of interleukin-5 production(GO:0032714) |
| 0.2 | 2.2 | GO:0006787 | porphyrin-containing compound catabolic process(GO:0006787) tetrapyrrole catabolic process(GO:0033015) heme catabolic process(GO:0042167) pigment catabolic process(GO:0046149) |
| 0.2 | 0.5 | GO:0021644 | vagus nerve morphogenesis(GO:0021644) |
| 0.2 | 0.5 | GO:0015755 | fructose transport(GO:0015755) |
| 0.2 | 0.5 | GO:0002625 | regulation of T cell antigen processing and presentation(GO:0002625) |
| 0.2 | 0.7 | GO:0042989 | sequestering of actin monomers(GO:0042989) |
| 0.2 | 1.7 | GO:0070221 | sulfide oxidation(GO:0019418) sulfide oxidation, using sulfide:quinone oxidoreductase(GO:0070221) |
| 0.2 | 0.9 | GO:2000158 | positive regulation of ubiquitin-specific protease activity(GO:2000158) |
| 0.2 | 0.9 | GO:0045065 | cytotoxic T cell differentiation(GO:0045065) |
| 0.2 | 0.2 | GO:0031296 | B cell costimulation(GO:0031296) |
| 0.2 | 1.9 | GO:0097475 | motor neuron migration(GO:0097475) |
| 0.2 | 0.5 | GO:0034729 | histone H3-K79 methylation(GO:0034729) |
| 0.2 | 1.2 | GO:0060244 | negative regulation of cell proliferation involved in contact inhibition(GO:0060244) |
| 0.2 | 2.1 | GO:0071287 | cellular response to manganese ion(GO:0071287) |
| 0.2 | 0.9 | GO:0052027 | modulation of signal transduction in other organism(GO:0044501) modulation by symbiont of host signal transduction pathway(GO:0052027) modulation of signal transduction in other organism involved in symbiotic interaction(GO:0052250) modulation by symbiont of host I-kappaB kinase/NF-kappaB cascade(GO:0085032) |
| 0.2 | 0.7 | GO:1990922 | regulation of hepatic stellate cell proliferation(GO:1904897) positive regulation of hepatic stellate cell proliferation(GO:1904899) hepatic stellate cell proliferation(GO:1990922) |
| 0.2 | 0.2 | GO:0032487 | regulation of Rap protein signal transduction(GO:0032487) |
| 0.2 | 0.9 | GO:0000706 | meiotic DNA double-strand break processing(GO:0000706) |
| 0.2 | 2.1 | GO:0050996 | positive regulation of lipid catabolic process(GO:0050996) |
| 0.2 | 1.4 | GO:0097039 | protein linear polyubiquitination(GO:0097039) |
| 0.2 | 1.8 | GO:0070171 | negative regulation of tooth mineralization(GO:0070171) |
| 0.2 | 0.2 | GO:0042222 | interleukin-1 biosynthetic process(GO:0042222) |
| 0.2 | 0.7 | GO:0035526 | retrograde transport, plasma membrane to Golgi(GO:0035526) |
| 0.2 | 0.7 | GO:0046005 | positive regulation of circadian sleep/wake cycle, REM sleep(GO:0046005) |
| 0.2 | 1.1 | GO:0006015 | 5-phosphoribose 1-diphosphate biosynthetic process(GO:0006015) 5-phosphoribose 1-diphosphate metabolic process(GO:0046391) |
| 0.2 | 1.6 | GO:0006203 | dGTP catabolic process(GO:0006203) dATP catabolic process(GO:0046061) |
| 0.2 | 2.2 | GO:0002681 | somatic diversification of T cell receptor genes(GO:0002568) somatic recombination of T cell receptor gene segments(GO:0002681) T cell receptor V(D)J recombination(GO:0033153) |
| 0.2 | 2.2 | GO:0042730 | fibrinolysis(GO:0042730) |
| 0.2 | 1.1 | GO:0061107 | seminal vesicle development(GO:0061107) |
| 0.2 | 8.0 | GO:0015697 | quaternary ammonium group transport(GO:0015697) |
| 0.2 | 1.5 | GO:0010744 | positive regulation of macrophage derived foam cell differentiation(GO:0010744) |
| 0.2 | 0.7 | GO:0033625 | positive regulation of integrin activation(GO:0033625) |
| 0.2 | 0.7 | GO:0051039 | histone displacement(GO:0001207) positive regulation of transcription involved in meiotic cell cycle(GO:0051039) |
| 0.2 | 0.4 | GO:0060734 | regulation of endoplasmic reticulum stress-induced eIF2 alpha phosphorylation(GO:0060734) |
| 0.2 | 0.4 | GO:0000432 | carbon catabolite regulation of transcription from RNA polymerase II promoter(GO:0000429) regulation of transcription from RNA polymerase II promoter by glucose(GO:0000430) positive regulation of transcription from RNA polymerase II promoter by glucose(GO:0000432) carbon catabolite activation of transcription from RNA polymerase II promoter(GO:0000436) carbon catabolite activation of transcription(GO:0045991) positive regulation of transcription by glucose(GO:0046016) |
| 0.2 | 1.3 | GO:0002457 | T cell antigen processing and presentation(GO:0002457) |
| 0.2 | 0.9 | GO:0001545 | primary ovarian follicle growth(GO:0001545) |
| 0.2 | 1.1 | GO:0035574 | histone H4-K20 demethylation(GO:0035574) |
| 0.2 | 0.9 | GO:0015785 | UDP-galactose transport(GO:0015785) UDP-galactose transmembrane transport(GO:0072334) |
| 0.2 | 1.7 | GO:0050868 | negative regulation of T cell activation(GO:0050868) |
| 0.2 | 1.7 | GO:0001562 | response to protozoan(GO:0001562) |
| 0.2 | 2.6 | GO:0071474 | cellular hyperosmotic response(GO:0071474) |
| 0.2 | 0.4 | GO:0030221 | basophil differentiation(GO:0030221) |
| 0.2 | 2.4 | GO:0035092 | sperm chromatin condensation(GO:0035092) |
| 0.2 | 0.6 | GO:0097032 | respiratory chain complex II assembly(GO:0034552) mitochondrial respiratory chain complex II assembly(GO:0034553) mitochondrial respiratory chain complex II biogenesis(GO:0097032) |
| 0.2 | 1.3 | GO:0015842 | aminergic neurotransmitter loading into synaptic vesicle(GO:0015842) |
| 0.2 | 0.6 | GO:1904828 | regulation of phenotypic switching by transcription from RNA polymerase II promoter(GO:0100057) regulation of hydrogen sulfide biosynthetic process(GO:1904826) positive regulation of hydrogen sulfide biosynthetic process(GO:1904828) |
| 0.2 | 0.6 | GO:0014707 | branchiomeric skeletal muscle development(GO:0014707) |
| 0.2 | 0.6 | GO:0035407 | histone H3-T11 phosphorylation(GO:0035407) |
| 0.2 | 3.2 | GO:0018377 | protein myristoylation(GO:0018377) |
| 0.2 | 1.1 | GO:0071504 | cellular response to heparin(GO:0071504) |
| 0.2 | 0.8 | GO:0006121 | mitochondrial electron transport, succinate to ubiquinone(GO:0006121) |
| 0.2 | 1.0 | GO:0043504 | mitochondrial DNA repair(GO:0043504) |
| 0.2 | 0.8 | GO:0043335 | protein unfolding(GO:0043335) |
| 0.2 | 0.4 | GO:0036292 | DNA rewinding(GO:0036292) |
| 0.2 | 2.5 | GO:0002507 | tolerance induction(GO:0002507) |
| 0.2 | 2.3 | GO:0072606 | interleukin-8 secretion(GO:0072606) |
| 0.2 | 0.4 | GO:1901253 | negative regulation of intracellular transport of viral material(GO:1901253) |
| 0.2 | 0.6 | GO:0014810 | positive regulation of skeletal muscle contraction by regulation of release of sequestered calcium ion(GO:0014810) |
| 0.2 | 0.6 | GO:0045359 | interferon-beta biosynthetic process(GO:0045350) regulation of interferon-beta biosynthetic process(GO:0045357) positive regulation of interferon-beta biosynthetic process(GO:0045359) |
| 0.2 | 8.6 | GO:0032945 | negative regulation of mononuclear cell proliferation(GO:0032945) negative regulation of lymphocyte proliferation(GO:0050672) |
| 0.2 | 0.2 | GO:0034146 | toll-like receptor 5 signaling pathway(GO:0034146) |
| 0.2 | 1.2 | GO:0002760 | positive regulation of antimicrobial peptide production(GO:0002225) positive regulation of antimicrobial humoral response(GO:0002760) positive regulation of antibacterial peptide production(GO:0002803) |
| 0.2 | 0.6 | GO:1902544 | regulation of DNA N-glycosylase activity(GO:1902544) |
| 0.2 | 0.6 | GO:1902202 | regulation of hepatocyte growth factor receptor signaling pathway(GO:1902202) |
| 0.2 | 2.0 | GO:1901475 | pyruvate transport(GO:0006848) pyruvate transmembrane transport(GO:1901475) |
| 0.2 | 0.6 | GO:0036333 | hepatocyte homeostasis(GO:0036333) response to tetrachloromethane(GO:1904772) |
| 0.2 | 0.6 | GO:0017198 | N-terminal peptidyl-serine acetylation(GO:0017198) N-terminal peptidyl-glutamic acid acetylation(GO:0018002) peptidyl-serine acetylation(GO:0030920) |
| 0.2 | 0.6 | GO:1904268 | positive regulation of Schwann cell migration(GO:1900149) regulation of Schwann cell chemotaxis(GO:1904266) positive regulation of Schwann cell chemotaxis(GO:1904268) Schwann cell chemotaxis(GO:1990751) |
| 0.2 | 1.4 | GO:0071651 | positive regulation of chemokine (C-C motif) ligand 5 production(GO:0071651) |
| 0.2 | 0.8 | GO:0006480 | N-terminal protein amino acid methylation(GO:0006480) |
| 0.2 | 0.4 | GO:0045715 | negative regulation of low-density lipoprotein particle receptor biosynthetic process(GO:0045715) |
| 0.2 | 1.0 | GO:0009440 | cyanate metabolic process(GO:0009439) cyanate catabolic process(GO:0009440) |
| 0.2 | 1.0 | GO:0060054 | positive regulation of epithelial cell proliferation involved in wound healing(GO:0060054) |
| 0.2 | 6.5 | GO:0050855 | regulation of B cell receptor signaling pathway(GO:0050855) |
| 0.2 | 0.6 | GO:1990637 | response to prolactin(GO:1990637) |
| 0.2 | 1.0 | GO:1901994 | negative regulation of meiotic cell cycle phase transition(GO:1901994) |
| 0.2 | 0.6 | GO:0035674 | tricarboxylic acid transmembrane transport(GO:0035674) |
| 0.2 | 2.6 | GO:0042092 | type 2 immune response(GO:0042092) |
| 0.2 | 1.6 | GO:0001712 | ectodermal cell fate commitment(GO:0001712) |
| 0.2 | 2.7 | GO:1903690 | negative regulation of wound healing, spreading of epidermal cells(GO:1903690) |
| 0.2 | 0.2 | GO:0045416 | positive regulation of interleukin-8 biosynthetic process(GO:0045416) |
| 0.2 | 1.2 | GO:0044339 | canonical Wnt signaling pathway involved in osteoblast differentiation(GO:0044339) |
| 0.2 | 15.8 | GO:0045071 | negative regulation of viral genome replication(GO:0045071) |
| 0.2 | 1.2 | GO:0046598 | positive regulation of viral entry into host cell(GO:0046598) |
| 0.2 | 0.6 | GO:0006287 | base-excision repair, gap-filling(GO:0006287) |
| 0.2 | 0.2 | GO:0044240 | multicellular organism lipid catabolic process(GO:0044240) |
| 0.2 | 0.6 | GO:0070995 | NADPH oxidation(GO:0070995) |
| 0.2 | 0.8 | GO:0002360 | T cell lineage commitment(GO:0002360) |
| 0.2 | 0.8 | GO:0016259 | selenocysteine metabolic process(GO:0016259) |
| 0.2 | 1.0 | GO:0045589 | regulation of regulatory T cell differentiation(GO:0045589) |
| 0.2 | 2.5 | GO:0090009 | primitive streak formation(GO:0090009) |
| 0.2 | 0.4 | GO:0009631 | cold acclimation(GO:0009631) |
| 0.2 | 4.0 | GO:0021534 | cell proliferation in hindbrain(GO:0021534) cell proliferation in external granule layer(GO:0021924) cerebellar granule cell precursor proliferation(GO:0021930) |
| 0.2 | 1.5 | GO:0014807 | regulation of somitogenesis(GO:0014807) |
| 0.2 | 1.3 | GO:2001171 | positive regulation of ATP biosynthetic process(GO:2001171) |
| 0.2 | 0.9 | GO:0051970 | negative regulation of transmission of nerve impulse(GO:0051970) |
| 0.2 | 3.9 | GO:0090050 | positive regulation of cell migration involved in sprouting angiogenesis(GO:0090050) |
| 0.2 | 1.7 | GO:1900004 | negative regulation of serine-type endopeptidase activity(GO:1900004) negative regulation of serine-type peptidase activity(GO:1902572) |
| 0.2 | 0.6 | GO:0051387 | negative regulation of neurotrophin TRK receptor signaling pathway(GO:0051387) |
| 0.2 | 0.4 | GO:0010193 | response to ozone(GO:0010193) |
| 0.2 | 0.4 | GO:0034140 | negative regulation of toll-like receptor 3 signaling pathway(GO:0034140) |
| 0.2 | 2.9 | GO:0039536 | negative regulation of RIG-I signaling pathway(GO:0039536) |
| 0.2 | 0.2 | GO:0061017 | hepatoblast differentiation(GO:0061017) |
| 0.2 | 0.9 | GO:0090219 | negative regulation of lipid kinase activity(GO:0090219) |
| 0.2 | 0.5 | GO:0038193 | thromboxane A2 signaling pathway(GO:0038193) |
| 0.2 | 0.7 | GO:0045351 | type I interferon biosynthetic process(GO:0045351) |
| 0.2 | 0.9 | GO:0032306 | regulation of prostaglandin secretion(GO:0032306) positive regulation of prostaglandin secretion(GO:0032308) |
| 0.2 | 1.6 | GO:0010764 | negative regulation of fibroblast migration(GO:0010764) |
| 0.2 | 0.4 | GO:0003193 | pulmonary valve formation(GO:0003193) foramen ovale closure(GO:0035922) |
| 0.2 | 0.2 | GO:0042737 | drug catabolic process(GO:0042737) |
| 0.2 | 0.2 | GO:0035378 | carbon dioxide transmembrane transport(GO:0035378) |
| 0.2 | 0.4 | GO:0060300 | regulation of cytokine activity(GO:0060300) |
| 0.2 | 0.5 | GO:0006212 | uracil catabolic process(GO:0006212) |
| 0.2 | 0.7 | GO:0060478 | acrosomal vesicle exocytosis(GO:0060478) |
| 0.2 | 0.7 | GO:0071684 | blastocyst hatching(GO:0001835) hatching(GO:0035188) organism emergence from protective structure(GO:0071684) |
| 0.2 | 1.4 | GO:0021979 | hypothalamus cell differentiation(GO:0021979) |
| 0.2 | 0.5 | GO:0002934 | desmosome organization(GO:0002934) |
| 0.2 | 3.5 | GO:0006183 | GTP biosynthetic process(GO:0006183) |
| 0.2 | 1.6 | GO:0006065 | UDP-glucuronate biosynthetic process(GO:0006065) |
| 0.2 | 0.2 | GO:0052203 | modulation by symbiont of host molecular function(GO:0052055) modulation of catalytic activity in other organism involved in symbiotic interaction(GO:0052203) modulation by host of symbiont catalytic activity(GO:0052422) |
| 0.2 | 1.9 | GO:0051177 | meiotic sister chromatid cohesion(GO:0051177) |
| 0.2 | 0.3 | GO:0051987 | positive regulation of attachment of spindle microtubules to kinetochore(GO:0051987) |
| 0.2 | 0.7 | GO:0009405 | pathogenesis(GO:0009405) |
| 0.2 | 3.8 | GO:0033540 | fatty acid beta-oxidation using acyl-CoA oxidase(GO:0033540) |
| 0.2 | 0.9 | GO:0010890 | positive regulation of sequestering of triglyceride(GO:0010890) |
| 0.2 | 0.7 | GO:1902093 | positive regulation of sperm motility(GO:1902093) |
| 0.2 | 1.9 | GO:0033211 | adiponectin-activated signaling pathway(GO:0033211) |
| 0.2 | 0.8 | GO:0034421 | post-translational protein acetylation(GO:0034421) |
| 0.2 | 0.5 | GO:1902109 | negative regulation of mitochondrial membrane permeability involved in apoptotic process(GO:1902109) |
| 0.2 | 0.5 | GO:0036451 | cap mRNA methylation(GO:0036451) |
| 0.2 | 1.7 | GO:0002084 | protein depalmitoylation(GO:0002084) |
| 0.2 | 0.7 | GO:0048200 | COPI-coated vesicle budding(GO:0035964) Golgi transport vesicle coating(GO:0048200) COPI coating of Golgi vesicle(GO:0048205) |
| 0.2 | 2.0 | GO:0038171 | cannabinoid signaling pathway(GO:0038171) |
| 0.2 | 2.8 | GO:0000290 | deadenylation-dependent decapping of nuclear-transcribed mRNA(GO:0000290) |
| 0.2 | 2.0 | GO:0070232 | regulation of T cell apoptotic process(GO:0070232) |
| 0.2 | 4.2 | GO:0043277 | apoptotic cell clearance(GO:0043277) |
| 0.2 | 0.8 | GO:0090362 | positive regulation of platelet-derived growth factor production(GO:0090362) |
| 0.2 | 1.5 | GO:0038145 | macrophage colony-stimulating factor signaling pathway(GO:0038145) |
| 0.2 | 0.8 | GO:0035815 | positive regulation of renal sodium excretion(GO:0035815) |
| 0.2 | 0.7 | GO:0006740 | NADPH regeneration(GO:0006740) |
| 0.2 | 3.1 | GO:0071361 | cellular response to ethanol(GO:0071361) |
| 0.2 | 1.3 | GO:0042346 | positive regulation of NF-kappaB import into nucleus(GO:0042346) |
| 0.2 | 1.5 | GO:0033227 | dsRNA transport(GO:0033227) |
| 0.2 | 0.2 | GO:0038162 | erythropoietin-mediated signaling pathway(GO:0038162) |
| 0.2 | 0.5 | GO:0072429 | response to intra-S DNA damage checkpoint signaling(GO:0072429) |
| 0.2 | 0.5 | GO:0098506 | nucleotide-excision repair, DNA damage removal(GO:0000718) DNA excision(GO:0044349) DNA 3' dephosphorylation(GO:0098503) DNA 3' dephosphorylation involved in DNA repair(GO:0098504) polynucleotide 3' dephosphorylation(GO:0098506) |
| 0.2 | 1.1 | GO:0071883 | activation of MAPK activity by adrenergic receptor signaling pathway(GO:0071883) |
| 0.2 | 1.6 | GO:0030449 | regulation of complement activation(GO:0030449) regulation of protein activation cascade(GO:2000257) |
| 0.2 | 0.5 | GO:0098735 | positive regulation of the force of heart contraction(GO:0098735) |
| 0.2 | 0.5 | GO:0071284 | cellular response to lead ion(GO:0071284) |
| 0.2 | 0.2 | GO:0042117 | monocyte activation(GO:0042117) |
| 0.2 | 2.1 | GO:1901740 | negative regulation of myoblast fusion(GO:1901740) regulation of hepatocyte apoptotic process(GO:1903943) negative regulation of hepatocyte apoptotic process(GO:1903944) |
| 0.2 | 0.5 | GO:1904481 | response to tetrahydrofolate(GO:1904481) cellular response to tetrahydrofolate(GO:1904482) |
| 0.2 | 0.6 | GO:0060743 | epithelial cell maturation involved in prostate gland development(GO:0060743) |
| 0.2 | 3.5 | GO:0015671 | oxygen transport(GO:0015671) |
| 0.2 | 0.6 | GO:0006175 | adenosine salvage(GO:0006169) dATP biosynthetic process(GO:0006175) |
| 0.2 | 1.3 | GO:0060282 | positive regulation of oocyte development(GO:0060282) |
| 0.2 | 0.6 | GO:0030576 | Cajal body organization(GO:0030576) |
| 0.2 | 0.3 | GO:0052204 | modulation of molecular function in other organism(GO:0044359) negative regulation of molecular function in other organism(GO:0044362) negative regulation of molecular function in other organism involved in symbiotic interaction(GO:0052204) modulation of molecular function in other organism involved in symbiotic interaction(GO:0052205) modification by host of symbiont molecular function(GO:0052428) |
| 0.2 | 0.6 | GO:1903608 | protein localization to cytoplasmic stress granule(GO:1903608) |
| 0.2 | 0.6 | GO:0061073 | ciliary body morphogenesis(GO:0061073) |
| 0.2 | 0.2 | GO:0035405 | histone-threonine phosphorylation(GO:0035405) |
| 0.2 | 0.5 | GO:0060046 | regulation of acrosome reaction(GO:0060046) |
| 0.2 | 0.5 | GO:0035262 | gonad morphogenesis(GO:0035262) |
| 0.2 | 2.7 | GO:0001955 | blood vessel maturation(GO:0001955) |
| 0.2 | 0.2 | GO:0033313 | meiotic cell cycle checkpoint(GO:0033313) |
| 0.2 | 0.5 | GO:0042668 | auditory receptor cell fate determination(GO:0042668) |
| 0.2 | 0.2 | GO:0000738 | DNA catabolic process, exonucleolytic(GO:0000738) |
| 0.2 | 0.6 | GO:0038018 | Wnt receptor catabolic process(GO:0038018) |
| 0.2 | 1.3 | GO:1902916 | positive regulation of protein polyubiquitination(GO:1902916) |
| 0.2 | 1.1 | GO:1901098 | positive regulation of autophagosome maturation(GO:1901098) |
| 0.2 | 0.6 | GO:1901097 | negative regulation of autophagosome maturation(GO:1901097) |
| 0.2 | 0.9 | GO:0035947 | regulation of gluconeogenesis by regulation of transcription from RNA polymerase II promoter(GO:0035947) positive regulation of gluconeogenesis by positive regulation of transcription from RNA polymerase II promoter(GO:0035948) regulation of cellular ketone metabolic process by positive regulation of transcription from RNA polymerase II promoter(GO:0072366) |
| 0.2 | 24.7 | GO:0002250 | adaptive immune response(GO:0002250) |
| 0.2 | 0.3 | GO:0009227 | nucleotide-sugar catabolic process(GO:0009227) |
| 0.2 | 0.6 | GO:0070922 | targeting of mRNA for destruction involved in RNA interference(GO:0030423) siRNA loading onto RISC involved in RNA interference(GO:0035087) small RNA loading onto RISC(GO:0070922) |
| 0.2 | 0.5 | GO:0045629 | negative regulation of T-helper 2 cell differentiation(GO:0045629) |
| 0.2 | 0.3 | GO:0097212 | lysosomal membrane organization(GO:0097212) |
| 0.2 | 0.2 | GO:2000403 | positive regulation of lymphocyte migration(GO:2000403) |
| 0.2 | 4.6 | GO:0030220 | platelet formation(GO:0030220) platelet morphogenesis(GO:0036344) |
| 0.2 | 0.5 | GO:0040034 | regulation of development, heterochronic(GO:0040034) regulation of timing of cell differentiation(GO:0048505) |
| 0.2 | 3.8 | GO:0002292 | T cell differentiation involved in immune response(GO:0002292) |
| 0.2 | 2.0 | GO:0042448 | progesterone metabolic process(GO:0042448) |
| 0.2 | 1.5 | GO:0021520 | spinal cord motor neuron cell fate specification(GO:0021520) |
| 0.2 | 0.6 | GO:0002188 | translation reinitiation(GO:0002188) |
| 0.2 | 0.2 | GO:0051660 | establishment of centrosome localization(GO:0051660) |
| 0.2 | 0.8 | GO:0097021 | lymphocyte migration into lymphoid organs(GO:0097021) |
| 0.2 | 0.5 | GO:0098583 | mastication(GO:0071626) learned vocalization behavior(GO:0098583) |
| 0.2 | 0.5 | GO:0006463 | steroid hormone receptor complex assembly(GO:0006463) |
| 0.2 | 0.6 | GO:0001821 | histamine secretion(GO:0001821) histamine transport(GO:0051608) |
| 0.2 | 1.5 | GO:0002943 | tRNA dihydrouridine synthesis(GO:0002943) |
| 0.1 | 0.6 | GO:0021849 | neuroblast division in subventricular zone(GO:0021849) |
| 0.1 | 1.0 | GO:0030311 | poly-N-acetyllactosamine biosynthetic process(GO:0030311) |
| 0.1 | 0.9 | GO:1904970 | brush border assembly(GO:1904970) |
| 0.1 | 0.3 | GO:0018076 | N-terminal peptidyl-lysine acetylation(GO:0018076) |
| 0.1 | 0.1 | GO:0036018 | response to erythropoietin(GO:0036017) cellular response to erythropoietin(GO:0036018) |
| 0.1 | 0.7 | GO:1902268 | negative regulation of polyamine transmembrane transport(GO:1902268) |
| 0.1 | 2.5 | GO:1900029 | positive regulation of ruffle assembly(GO:1900029) |
| 0.1 | 1.0 | GO:0045835 | negative regulation of meiotic nuclear division(GO:0045835) |
| 0.1 | 5.5 | GO:0060216 | definitive hemopoiesis(GO:0060216) |
| 0.1 | 0.7 | GO:0032466 | negative regulation of cytokinesis(GO:0032466) |
| 0.1 | 0.7 | GO:0042256 | mature ribosome assembly(GO:0042256) |
| 0.1 | 3.2 | GO:0035590 | purinergic nucleotide receptor signaling pathway(GO:0035590) |
| 0.1 | 0.7 | GO:0035624 | receptor transactivation(GO:0035624) |
| 0.1 | 0.1 | GO:0002578 | negative regulation of antigen processing and presentation(GO:0002578) |
| 0.1 | 0.7 | GO:0010587 | miRNA catabolic process(GO:0010587) |
| 0.1 | 2.0 | GO:0030917 | midbrain-hindbrain boundary development(GO:0030917) |
| 0.1 | 0.3 | GO:0061146 | Peyer's patch morphogenesis(GO:0061146) |
| 0.1 | 0.6 | GO:0010756 | positive regulation of plasminogen activation(GO:0010756) |
| 0.1 | 0.4 | GO:0035359 | negative regulation of peroxisome proliferator activated receptor signaling pathway(GO:0035359) |
| 0.1 | 0.6 | GO:2000659 | regulation of interleukin-1-mediated signaling pathway(GO:2000659) |
| 0.1 | 1.0 | GO:0001519 | peptide amidation(GO:0001519) protein amidation(GO:0018032) peptide modification(GO:0031179) |
| 0.1 | 0.4 | GO:0044778 | meiotic DNA integrity checkpoint(GO:0044778) |
| 0.1 | 0.3 | GO:0038156 | interleukin-3-mediated signaling pathway(GO:0038156) |
| 0.1 | 1.7 | GO:0042100 | B cell proliferation(GO:0042100) |
| 0.1 | 0.4 | GO:0018160 | peptidyl-pyrromethane cofactor linkage(GO:0018160) |
| 0.1 | 2.0 | GO:2000622 | regulation of nuclear-transcribed mRNA catabolic process, nonsense-mediated decay(GO:2000622) negative regulation of nuclear-transcribed mRNA catabolic process, nonsense-mediated decay(GO:2000623) |
| 0.1 | 2.8 | GO:0002903 | negative regulation of B cell apoptotic process(GO:0002903) |
| 0.1 | 0.4 | GO:0060022 | hard palate development(GO:0060022) |
| 0.1 | 0.4 | GO:0090261 | positive regulation of inclusion body assembly(GO:0090261) |
| 0.1 | 0.1 | GO:0006668 | sphinganine-1-phosphate metabolic process(GO:0006668) |
| 0.1 | 0.7 | GO:0090245 | axis elongation involved in somitogenesis(GO:0090245) |
| 0.1 | 1.1 | GO:0046415 | urate metabolic process(GO:0046415) |
| 0.1 | 0.6 | GO:0042776 | mitochondrial ATP synthesis coupled proton transport(GO:0042776) |
| 0.1 | 2.2 | GO:0006107 | oxaloacetate metabolic process(GO:0006107) |
| 0.1 | 0.1 | GO:0009257 | 10-formyltetrahydrofolate biosynthetic process(GO:0009257) |
| 0.1 | 9.3 | GO:0043124 | negative regulation of I-kappaB kinase/NF-kappaB signaling(GO:0043124) |
| 0.1 | 2.7 | GO:0048935 | peripheral nervous system neuron differentiation(GO:0048934) peripheral nervous system neuron development(GO:0048935) |
| 0.1 | 1.2 | GO:0006398 | mRNA 3'-end processing by stem-loop binding and cleavage(GO:0006398) |
| 0.1 | 0.3 | GO:0048742 | regulation of skeletal muscle fiber development(GO:0048742) |
| 0.1 | 0.5 | GO:0051413 | response to cortisone(GO:0051413) response to Thyroglobulin triiodothyronine(GO:1904016) |
| 0.1 | 0.3 | GO:0051792 | medium-chain fatty acid biosynthetic process(GO:0051792) |
| 0.1 | 1.7 | GO:0014809 | regulation of skeletal muscle contraction by regulation of release of sequestered calcium ion(GO:0014809) |
| 0.1 | 0.1 | GO:0008291 | acetylcholine metabolic process(GO:0008291) acetate ester metabolic process(GO:1900619) |
| 0.1 | 0.5 | GO:1900186 | negative regulation of clathrin-mediated endocytosis(GO:1900186) |
| 0.1 | 1.2 | GO:0010606 | positive regulation of cytoplasmic mRNA processing body assembly(GO:0010606) |
| 0.1 | 1.1 | GO:2000344 | positive regulation of acrosome reaction(GO:2000344) |
| 0.1 | 0.7 | GO:1990426 | homologous recombination-dependent replication fork processing(GO:1990426) |
| 0.1 | 0.4 | GO:0045204 | MAPK export from nucleus(GO:0045204) |
| 0.1 | 0.4 | GO:0090170 | regulation of Golgi inheritance(GO:0090170) |
| 0.1 | 0.7 | GO:0031536 | positive regulation of exit from mitosis(GO:0031536) |
| 0.1 | 0.9 | GO:0006269 | DNA replication, synthesis of RNA primer(GO:0006269) |
| 0.1 | 1.3 | GO:0048625 | myoblast fate commitment(GO:0048625) |
| 0.1 | 4.3 | GO:0032481 | positive regulation of type I interferon production(GO:0032481) |
| 0.1 | 1.0 | GO:0061074 | regulation of neural retina development(GO:0061074) |
| 0.1 | 0.9 | GO:0007168 | receptor guanylyl cyclase signaling pathway(GO:0007168) |
| 0.1 | 0.8 | GO:0019264 | glycine biosynthetic process from serine(GO:0019264) |
| 0.1 | 0.5 | GO:0009051 | pentose-phosphate shunt, oxidative branch(GO:0009051) |
| 0.1 | 0.5 | GO:0032790 | ribosome disassembly(GO:0032790) |
| 0.1 | 1.4 | GO:0010579 | regulation of adenylate cyclase activity involved in G-protein coupled receptor signaling pathway(GO:0010578) positive regulation of adenylate cyclase activity involved in G-protein coupled receptor signaling pathway(GO:0010579) |
| 0.1 | 0.4 | GO:0072139 | glomerular parietal epithelial cell differentiation(GO:0072139) positive regulation of epithelial cell differentiation involved in kidney development(GO:2000698) positive regulation of nephron tubule epithelial cell differentiation(GO:2000768) |
| 0.1 | 0.3 | GO:0060133 | somatotropin secreting cell development(GO:0060133) |
| 0.1 | 0.3 | GO:0071877 | regulation of adrenergic receptor signaling pathway(GO:0071877) |
| 0.1 | 0.4 | GO:0070145 | mitochondrial asparaginyl-tRNA aminoacylation(GO:0070145) |
| 0.1 | 0.4 | GO:0034134 | toll-like receptor 2 signaling pathway(GO:0034134) |
| 0.1 | 0.8 | GO:1903251 | multi-ciliated epithelial cell differentiation(GO:1903251) |
| 0.1 | 0.5 | GO:0043137 | DNA replication, removal of RNA primer(GO:0043137) |
| 0.1 | 0.4 | GO:0090410 | malonate catabolic process(GO:0090410) |
| 0.1 | 1.0 | GO:0045007 | depurination(GO:0045007) |
| 0.1 | 0.5 | GO:0060281 | regulation of oocyte development(GO:0060281) |
| 0.1 | 1.8 | GO:0051255 | spindle midzone assembly(GO:0051255) |
| 0.1 | 1.6 | GO:0006189 | 'de novo' IMP biosynthetic process(GO:0006189) |
| 0.1 | 1.1 | GO:0050957 | equilibrioception(GO:0050957) |
| 0.1 | 4.4 | GO:0070098 | chemokine-mediated signaling pathway(GO:0070098) |
| 0.1 | 0.1 | GO:1904430 | negative regulation of t-circle formation(GO:1904430) |
| 0.1 | 0.6 | GO:0019626 | short-chain fatty acid catabolic process(GO:0019626) |
| 0.1 | 0.4 | GO:0001732 | formation of cytoplasmic translation initiation complex(GO:0001732) |
| 0.1 | 0.7 | GO:0036483 | neuron intrinsic apoptotic signaling pathway in response to endoplasmic reticulum stress(GO:0036483) regulation of endoplasmic reticulum stress-induced neuron intrinsic apoptotic signaling pathway(GO:1903381) negative regulation of endoplasmic reticulum stress-induced neuron intrinsic apoptotic signaling pathway(GO:1903382) |
| 0.1 | 0.8 | GO:0010727 | negative regulation of hydrogen peroxide metabolic process(GO:0010727) |
| 0.1 | 0.4 | GO:0002755 | MyD88-dependent toll-like receptor signaling pathway(GO:0002755) |
| 0.1 | 0.4 | GO:0038001 | paracrine signaling(GO:0038001) |
| 0.1 | 0.5 | GO:0048627 | myoblast development(GO:0048627) |
| 0.1 | 3.0 | GO:0006346 | methylation-dependent chromatin silencing(GO:0006346) |
| 0.1 | 1.3 | GO:0035965 | cardiolipin acyl-chain remodeling(GO:0035965) |
| 0.1 | 0.6 | GO:1904744 | positive regulation of telomeric DNA binding(GO:1904744) |
| 0.1 | 0.6 | GO:0015942 | formate metabolic process(GO:0015942) |
| 0.1 | 0.5 | GO:0071348 | cellular response to interleukin-11(GO:0071348) |
| 0.1 | 0.5 | GO:0086053 | AV node cell to bundle of His cell communication by electrical coupling(GO:0086053) |
| 0.1 | 0.4 | GO:1903674 | regulation of cap-dependent translational initiation(GO:1903674) positive regulation of cap-dependent translational initiation(GO:1903676) |
| 0.1 | 0.1 | GO:1904933 | regulation of cell proliferation in midbrain(GO:1904933) |
| 0.1 | 0.5 | GO:0033320 | UDP-D-xylose metabolic process(GO:0033319) UDP-D-xylose biosynthetic process(GO:0033320) |
| 0.1 | 1.3 | GO:0050858 | negative regulation of antigen receptor-mediated signaling pathway(GO:0050858) |
| 0.1 | 1.5 | GO:0018904 | ether metabolic process(GO:0018904) |
| 0.1 | 1.7 | GO:0045898 | regulation of RNA polymerase II transcriptional preinitiation complex assembly(GO:0045898) |
| 0.1 | 0.4 | GO:0045719 | negative regulation of glycogen biosynthetic process(GO:0045719) negative regulation of glycogen metabolic process(GO:0070874) |
| 0.1 | 1.4 | GO:0051013 | microtubule severing(GO:0051013) |
| 0.1 | 0.4 | GO:0009386 | translational attenuation(GO:0009386) |
| 0.1 | 1.4 | GO:0010623 | programmed cell death involved in cell development(GO:0010623) |
| 0.1 | 0.7 | GO:0042226 | interleukin-6 biosynthetic process(GO:0042226) |
| 0.1 | 0.8 | GO:0097242 | beta-amyloid clearance(GO:0097242) |
| 0.1 | 1.0 | GO:0009629 | response to gravity(GO:0009629) |
| 0.1 | 0.1 | GO:1902809 | regulation of skeletal muscle fiber differentiation(GO:1902809) |
| 0.1 | 0.5 | GO:0051534 | negative regulation of NFAT protein import into nucleus(GO:0051534) |
| 0.1 | 2.1 | GO:1904867 | protein localization to nuclear body(GO:1903405) protein localization to Cajal body(GO:1904867) |
| 0.1 | 0.7 | GO:0015862 | uridine transport(GO:0015862) pyrimidine nucleoside transport(GO:0015864) |
| 0.1 | 1.1 | GO:0051195 | negative regulation of glycolytic process(GO:0045820) negative regulation of cofactor metabolic process(GO:0051195) negative regulation of coenzyme metabolic process(GO:0051198) |
| 0.1 | 1.1 | GO:0045047 | protein targeting to ER(GO:0045047) |
| 0.1 | 2.7 | GO:0007095 | mitotic G2 DNA damage checkpoint(GO:0007095) |
| 0.1 | 0.5 | GO:0032776 | DNA methylation on cytosine(GO:0032776) |
| 0.1 | 0.3 | GO:0001983 | regulation of systemic arterial blood pressure by carotid sinus baroreceptor feedback(GO:0001978) baroreceptor response to increased systemic arterial blood pressure(GO:0001983) |
| 0.1 | 0.9 | GO:0008228 | opsonization(GO:0008228) |
| 0.1 | 0.2 | GO:0060591 | chondroblast differentiation(GO:0060591) |
| 0.1 | 0.4 | GO:0071169 | establishment of protein localization to chromatin(GO:0071169) |
| 0.1 | 0.4 | GO:0006478 | peptidyl-tyrosine sulfation(GO:0006478) |
| 0.1 | 1.0 | GO:0009446 | putrescine biosynthetic process(GO:0009446) |
| 0.1 | 0.1 | GO:0022614 | membrane to membrane docking(GO:0022614) |
| 0.1 | 0.8 | GO:0038203 | TORC2 signaling(GO:0038203) |
| 0.1 | 0.6 | GO:0060398 | regulation of growth hormone receptor signaling pathway(GO:0060398) |
| 0.1 | 0.5 | GO:0010886 | positive regulation of cholesterol storage(GO:0010886) |
| 0.1 | 0.7 | GO:2000188 | regulation of cholesterol homeostasis(GO:2000188) |
| 0.1 | 0.4 | GO:1903755 | regulation of SUMO transferase activity(GO:1903182) positive regulation of SUMO transferase activity(GO:1903755) |
| 0.1 | 0.1 | GO:0002439 | chronic inflammatory response to antigenic stimulus(GO:0002439) |
| 0.1 | 1.5 | GO:0070072 | proton-transporting V-type ATPase complex assembly(GO:0070070) vacuolar proton-transporting V-type ATPase complex assembly(GO:0070072) |
| 0.1 | 0.4 | GO:0070327 | thyroid hormone transport(GO:0070327) |
| 0.1 | 0.4 | GO:0006591 | ornithine metabolic process(GO:0006591) |
| 0.1 | 6.5 | GO:0042590 | antigen processing and presentation of exogenous peptide antigen via MHC class I(GO:0042590) |
| 0.1 | 0.9 | GO:0071285 | cellular response to lithium ion(GO:0071285) |
| 0.1 | 1.3 | GO:0051639 | actin filament network formation(GO:0051639) |
| 0.1 | 0.3 | GO:0060467 | negative regulation of fertilization(GO:0060467) |
| 0.1 | 5.0 | GO:0034080 | CENP-A containing nucleosome assembly(GO:0034080) CENP-A containing chromatin organization(GO:0061641) |
| 0.1 | 0.9 | GO:0031087 | deadenylation-independent decapping of nuclear-transcribed mRNA(GO:0031087) |
| 0.1 | 0.4 | GO:0043129 | surfactant homeostasis(GO:0043129) |
| 0.1 | 0.3 | GO:0036323 | vascular endothelial growth factor receptor-1 signaling pathway(GO:0036323) |
| 0.1 | 1.6 | GO:0060397 | JAK-STAT cascade involved in growth hormone signaling pathway(GO:0060397) |
| 0.1 | 0.5 | GO:0010992 | ubiquitin homeostasis(GO:0010992) |
| 0.1 | 0.7 | GO:0032025 | response to cobalt ion(GO:0032025) |
| 0.1 | 1.3 | GO:0050830 | defense response to Gram-positive bacterium(GO:0050830) |
| 0.1 | 0.1 | GO:0050691 | regulation of defense response to virus by host(GO:0050691) |
| 0.1 | 1.2 | GO:0002002 | regulation of angiotensin levels in blood(GO:0002002) regulation of angiotensin metabolic process(GO:0060177) |
| 0.1 | 0.2 | GO:0001546 | preantral ovarian follicle growth(GO:0001546) multi-layer follicle stage(GO:0048162) regulation of ovulation(GO:0060278) |
| 0.1 | 0.2 | GO:1903778 | protein localization to vacuolar membrane(GO:1903778) |
| 0.1 | 0.6 | GO:0032261 | purine nucleotide salvage(GO:0032261) |
| 0.1 | 1.0 | GO:0060005 | vestibular reflex(GO:0060005) |
| 0.1 | 0.3 | GO:0098974 | postsynaptic actin cytoskeleton organization(GO:0098974) |
| 0.1 | 1.8 | GO:0021840 | directional guidance of interneurons involved in migration from the subpallium to the cortex(GO:0021840) chemorepulsion involved in interneuron migration from the subpallium to the cortex(GO:0021842) ERBB3 signaling pathway(GO:0038129) |
| 0.1 | 5.6 | GO:0070671 | interleukin-12-mediated signaling pathway(GO:0035722) response to interleukin-12(GO:0070671) cellular response to interleukin-12(GO:0071349) |
| 0.1 | 0.5 | GO:2000346 | negative regulation of hepatocyte proliferation(GO:2000346) |
| 0.1 | 0.7 | GO:0003363 | lamellipodium assembly involved in ameboidal cell migration(GO:0003363) |
| 0.1 | 0.3 | GO:0007135 | meiosis II(GO:0007135) |
| 0.1 | 0.3 | GO:0032679 | TRAIL production(GO:0032639) regulation of TRAIL production(GO:0032679) positive regulation of TRAIL production(GO:0032759) |
| 0.1 | 0.4 | GO:0009786 | regulation of asymmetric cell division(GO:0009786) |
| 0.1 | 3.7 | GO:0051569 | regulation of histone H3-K4 methylation(GO:0051569) |
| 0.1 | 0.2 | GO:0044806 | G-quadruplex DNA unwinding(GO:0044806) |
| 0.1 | 0.2 | GO:1901492 | positive regulation of lymphangiogenesis(GO:1901492) |
| 0.1 | 2.4 | GO:0032728 | positive regulation of interferon-beta production(GO:0032728) |
| 0.1 | 0.2 | GO:0021622 | oculomotor nerve morphogenesis(GO:0021622) oculomotor nerve formation(GO:0021623) |
| 0.1 | 0.3 | GO:0098795 | mRNA cleavage involved in gene silencing by miRNA(GO:0035279) mRNA cleavage involved in gene silencing(GO:0098795) |
| 0.1 | 0.3 | GO:0032905 | transforming growth factor beta1 production(GO:0032905) regulation of transforming growth factor beta1 production(GO:0032908) |
| 0.1 | 6.6 | GO:0031424 | keratinization(GO:0031424) |
| 0.1 | 0.7 | GO:0090038 | negative regulation of protein kinase C signaling(GO:0090038) |
| 0.1 | 0.4 | GO:1905044 | Schwann cell proliferation involved in axon regeneration(GO:0014011) negative regulation of Schwann cell migration(GO:1900148) regulation of Schwann cell proliferation involved in axon regeneration(GO:1905044) negative regulation of Schwann cell proliferation involved in axon regeneration(GO:1905045) |
| 0.1 | 1.0 | GO:0045603 | positive regulation of endothelial cell differentiation(GO:0045603) |
| 0.1 | 1.4 | GO:0042359 | vitamin D metabolic process(GO:0042359) |
| 0.1 | 1.4 | GO:1903963 | arachidonic acid secretion(GO:0050482) arachidonate transport(GO:1903963) |
| 0.1 | 0.2 | GO:0006549 | isoleucine metabolic process(GO:0006549) |
| 0.1 | 0.2 | GO:0003223 | ventricular compact myocardium morphogenesis(GO:0003223) |
| 0.1 | 2.4 | GO:0048240 | sperm capacitation(GO:0048240) |
| 0.1 | 2.2 | GO:0010592 | positive regulation of lamellipodium assembly(GO:0010592) |
| 0.1 | 1.1 | GO:0048280 | vesicle fusion with Golgi apparatus(GO:0048280) |
| 0.1 | 0.3 | GO:0048867 | ganglion mother cell fate determination(GO:0007402) stem cell fate determination(GO:0048867) |
| 0.1 | 0.5 | GO:0007296 | vitellogenesis(GO:0007296) |
| 0.1 | 0.3 | GO:0002227 | innate immune response in mucosa(GO:0002227) |
| 0.1 | 1.7 | GO:0046628 | positive regulation of insulin receptor signaling pathway(GO:0046628) |
| 0.1 | 0.8 | GO:0051000 | positive regulation of nitric-oxide synthase activity(GO:0051000) |
| 0.1 | 0.2 | GO:0016999 | antibiotic metabolic process(GO:0016999) cellular lactam metabolic process(GO:0072338) |
| 0.1 | 0.2 | GO:0019730 | antimicrobial humoral response(GO:0019730) |
| 0.1 | 0.4 | GO:0002251 | organ or tissue specific immune response(GO:0002251) |
| 0.1 | 3.1 | GO:0051084 | 'de novo' posttranslational protein folding(GO:0051084) |
| 0.1 | 0.5 | GO:0060753 | regulation of mast cell chemotaxis(GO:0060753) |
| 0.1 | 0.4 | GO:0042357 | thiamine diphosphate metabolic process(GO:0042357) |
| 0.1 | 0.2 | GO:0002922 | positive regulation of humoral immune response(GO:0002922) |
| 0.1 | 0.3 | GO:0001951 | intestinal D-glucose absorption(GO:0001951) |
| 0.1 | 0.5 | GO:0035026 | leading edge cell differentiation(GO:0035026) |
| 0.1 | 15.0 | GO:0070268 | cornification(GO:0070268) |
| 0.1 | 0.8 | GO:0016557 | peroxisome membrane biogenesis(GO:0016557) |
| 0.1 | 1.3 | GO:0015721 | bile acid and bile salt transport(GO:0015721) |
| 0.1 | 1.2 | GO:0006047 | UDP-N-acetylglucosamine metabolic process(GO:0006047) |
| 0.1 | 0.4 | GO:0060290 | transdifferentiation(GO:0060290) |
| 0.1 | 0.4 | GO:0055089 | fatty acid homeostasis(GO:0055089) |
| 0.1 | 0.9 | GO:0070423 | nucleotide-binding oligomerization domain containing signaling pathway(GO:0070423) |
| 0.1 | 1.0 | GO:0098535 | de novo centriole assembly(GO:0098535) |
| 0.1 | 0.5 | GO:0030200 | heparan sulfate proteoglycan catabolic process(GO:0030200) |
| 0.1 | 0.9 | GO:0090435 | protein localization to nuclear envelope(GO:0090435) |
| 0.1 | 0.5 | GO:0034238 | macrophage fusion(GO:0034238) regulation of macrophage fusion(GO:0034239) positive regulation of macrophage fusion(GO:0034241) |
| 0.1 | 0.1 | GO:1901993 | meiotic cell cycle phase transition(GO:0044771) regulation of meiotic cell cycle phase transition(GO:1901993) |
| 0.1 | 1.2 | GO:0051315 | attachment of mitotic spindle microtubules to kinetochore(GO:0051315) |
| 0.1 | 1.7 | GO:0002192 | IRES-dependent translational initiation(GO:0002192) |
| 0.1 | 4.6 | GO:0035036 | sperm-egg recognition(GO:0035036) |
| 0.1 | 0.9 | GO:1990845 | adaptive thermogenesis(GO:1990845) |
| 0.1 | 51.1 | GO:0043312 | neutrophil activation involved in immune response(GO:0002283) neutrophil degranulation(GO:0043312) |
| 0.1 | 0.5 | GO:0000023 | maltose metabolic process(GO:0000023) |
| 0.1 | 0.2 | GO:0046778 | modification by virus of host mRNA processing(GO:0046778) |
| 0.1 | 0.3 | GO:1901874 | negative regulation of post-translational protein modification(GO:1901874) |
| 0.1 | 2.2 | GO:0051482 | positive regulation of cytosolic calcium ion concentration involved in phospholipase C-activating G-protein coupled signaling pathway(GO:0051482) |
| 0.1 | 0.4 | GO:0046356 | acetyl-CoA catabolic process(GO:0046356) |
| 0.1 | 0.4 | GO:0090656 | t-circle formation(GO:0090656) |
| 0.1 | 0.6 | GO:0070862 | negative regulation of protein exit from endoplasmic reticulum(GO:0070862) negative regulation of retrograde protein transport, ER to cytosol(GO:1904153) |
| 0.1 | 0.2 | GO:0071140 | resolution of recombination intermediates(GO:0071139) resolution of mitotic recombination intermediates(GO:0071140) |
| 0.1 | 1.0 | GO:0044351 | macropinocytosis(GO:0044351) |
| 0.1 | 0.3 | GO:0036155 | acylglycerol acyl-chain remodeling(GO:0036155) |
| 0.1 | 0.4 | GO:1904806 | regulation of protein oxidation(GO:1904806) positive regulation of protein oxidation(GO:1904808) |
| 0.1 | 1.1 | GO:0001682 | tRNA 5'-leader removal(GO:0001682) |
| 0.1 | 0.2 | GO:0030885 | regulation of myeloid dendritic cell activation(GO:0030885) |
| 0.1 | 0.1 | GO:0010430 | fatty acid omega-oxidation(GO:0010430) |
| 0.1 | 0.8 | GO:0020027 | hemoglobin metabolic process(GO:0020027) |
| 0.1 | 1.0 | GO:0060390 | regulation of SMAD protein import into nucleus(GO:0060390) |
| 0.1 | 0.3 | GO:0003050 | regulation of systemic arterial blood pressure by atrial natriuretic peptide(GO:0003050) |
| 0.1 | 0.7 | GO:0061143 | nose morphogenesis(GO:0043585) alveolar primary septum development(GO:0061143) |
| 0.1 | 1.1 | GO:0030238 | male sex determination(GO:0030238) |
| 0.1 | 0.5 | GO:0071955 | recycling endosome to Golgi transport(GO:0071955) |
| 0.1 | 0.9 | GO:0010032 | meiotic chromosome condensation(GO:0010032) |
| 0.1 | 0.4 | GO:0052150 | modulation by symbiont of host apoptotic process(GO:0052150) |
| 0.1 | 0.3 | GO:2000852 | regulation of corticosterone secretion(GO:2000852) |
| 0.1 | 0.3 | GO:0090285 | negative regulation of protein glycosylation in Golgi(GO:0090285) |
| 0.1 | 0.3 | GO:0009826 | unidimensional cell growth(GO:0009826) |
| 0.1 | 0.2 | GO:0035565 | regulation of pronephros size(GO:0035565) |
| 0.1 | 0.8 | GO:0072498 | embryonic skeletal joint development(GO:0072498) |
| 0.1 | 0.7 | GO:0018231 | peptidyl-L-cysteine S-palmitoylation(GO:0018230) peptidyl-S-diacylglycerol-L-cysteine biosynthetic process from peptidyl-cysteine(GO:0018231) |
| 0.1 | 0.2 | GO:0015014 | heparan sulfate proteoglycan biosynthetic process, polysaccharide chain biosynthetic process(GO:0015014) |
| 0.1 | 1.9 | GO:0035666 | TRIF-dependent toll-like receptor signaling pathway(GO:0035666) |
| 0.1 | 0.4 | GO:0031120 | snRNA pseudouridine synthesis(GO:0031120) |
| 0.1 | 0.4 | GO:2001013 | epithelial cell proliferation involved in renal tubule morphogenesis(GO:2001013) |
| 0.1 | 0.8 | GO:0043402 | glucocorticoid mediated signaling pathway(GO:0043402) |
| 0.1 | 0.3 | GO:0048539 | bone marrow development(GO:0048539) |
| 0.1 | 0.4 | GO:0030101 | natural killer cell activation(GO:0030101) |
| 0.1 | 0.5 | GO:0040016 | embryonic cleavage(GO:0040016) |
| 0.1 | 0.1 | GO:0032431 | positive regulation of phospholipase A2 activity(GO:0032430) activation of phospholipase A2 activity(GO:0032431) activation of phospholipase A2 activity by calcium-mediated signaling(GO:0043006) |
| 0.1 | 0.5 | GO:0007506 | gonadal mesoderm development(GO:0007506) |
| 0.1 | 2.8 | GO:0045652 | regulation of megakaryocyte differentiation(GO:0045652) |
| 0.1 | 1.4 | GO:0060334 | regulation of interferon-gamma-mediated signaling pathway(GO:0060334) |
| 0.1 | 1.1 | GO:0031284 | positive regulation of guanylate cyclase activity(GO:0031284) |
| 0.1 | 0.5 | GO:0021797 | forebrain anterior/posterior pattern specification(GO:0021797) |
| 0.1 | 1.9 | GO:0097341 | inhibition of cysteine-type endopeptidase activity(GO:0097340) zymogen inhibition(GO:0097341) |
| 0.1 | 1.0 | GO:0030091 | protein repair(GO:0030091) |
| 0.1 | 0.2 | GO:2000297 | negative regulation of synapse maturation(GO:2000297) |
| 0.1 | 1.4 | GO:0007084 | mitotic nuclear envelope reassembly(GO:0007084) |
| 0.1 | 1.2 | GO:0035278 | miRNA mediated inhibition of translation(GO:0035278) negative regulation of translation, ncRNA-mediated(GO:0040033) regulation of translation, ncRNA-mediated(GO:0045974) |
| 0.1 | 1.2 | GO:0015886 | heme transport(GO:0015886) |
| 0.1 | 0.2 | GO:0060261 | positive regulation of transcription initiation from RNA polymerase II promoter(GO:0060261) |
| 0.1 | 1.6 | GO:0016973 | poly(A)+ mRNA export from nucleus(GO:0016973) |
| 0.1 | 27.9 | GO:0050911 | detection of chemical stimulus involved in sensory perception of smell(GO:0050911) |
| 0.1 | 0.3 | GO:0000451 | rRNA 2'-O-methylation(GO:0000451) |
| 0.1 | 0.2 | GO:0046010 | positive regulation of circadian sleep/wake cycle, non-REM sleep(GO:0046010) |
| 0.1 | 0.6 | GO:1900748 | positive regulation of vascular endothelial growth factor signaling pathway(GO:1900748) |
| 0.1 | 0.2 | GO:0048633 | positive regulation of skeletal muscle tissue growth(GO:0048633) |
| 0.1 | 0.3 | GO:0044364 | killing of cells of other organism(GO:0031640) disruption of cells of other organism(GO:0044364) |
| 0.1 | 3.5 | GO:0050912 | detection of chemical stimulus involved in sensory perception of taste(GO:0050912) |
| 0.1 | 0.7 | GO:0002191 | cap-dependent translational initiation(GO:0002191) |
| 0.1 | 0.5 | GO:0046092 | deoxycytidine metabolic process(GO:0046092) |
| 0.1 | 2.0 | GO:0006123 | mitochondrial electron transport, cytochrome c to oxygen(GO:0006123) |
| 0.1 | 0.1 | GO:1903626 | positive regulation of DNA catabolic process(GO:1903626) |
| 0.1 | 0.2 | GO:0044205 | 'de novo' UMP biosynthetic process(GO:0044205) |
| 0.1 | 0.8 | GO:0048757 | endosome to melanosome transport(GO:0035646) endosome to pigment granule transport(GO:0043485) pigment granule maturation(GO:0048757) |
| 0.1 | 0.5 | GO:0021527 | spinal cord association neuron differentiation(GO:0021527) |
| 0.1 | 0.1 | GO:1903797 | positive regulation of inorganic anion transmembrane transport(GO:1903797) |
| 0.1 | 0.2 | GO:0005984 | disaccharide metabolic process(GO:0005984) |
| 0.1 | 0.5 | GO:0036079 | GDP-fucose transport(GO:0015783) purine nucleotide-sugar transport(GO:0036079) |
| 0.1 | 0.3 | GO:0033034 | positive regulation of myeloid cell apoptotic process(GO:0033034) positive regulation of macrophage apoptotic process(GO:2000111) |
| 0.1 | 0.5 | GO:0045656 | negative regulation of monocyte differentiation(GO:0045656) |
| 0.1 | 0.8 | GO:1904379 | protein localization to cytosolic proteasome complex(GO:1904327) protein localization to cytosolic proteasome complex involved in ERAD pathway(GO:1904379) |
| 0.1 | 0.2 | GO:1904425 | negative regulation of GTP binding(GO:1904425) |
| 0.1 | 0.2 | GO:0030505 | inorganic diphosphate transport(GO:0030505) |
| 0.1 | 1.3 | GO:0003309 | type B pancreatic cell differentiation(GO:0003309) |
| 0.1 | 0.4 | GO:0002260 | lymphocyte homeostasis(GO:0002260) |
| 0.1 | 1.0 | GO:0060117 | auditory receptor cell development(GO:0060117) |
| 0.1 | 0.2 | GO:0090154 | positive regulation of sphingolipid biosynthetic process(GO:0090154) positive regulation of ceramide biosynthetic process(GO:2000304) |
| 0.1 | 0.2 | GO:0006931 | substrate-dependent cell migration, cell attachment to substrate(GO:0006931) |
| 0.1 | 0.1 | GO:0030174 | regulation of DNA-dependent DNA replication initiation(GO:0030174) |
| 0.1 | 0.5 | GO:0070272 | proton-transporting ATP synthase complex assembly(GO:0043461) proton-transporting ATP synthase complex biogenesis(GO:0070272) |
| 0.1 | 0.2 | GO:0042309 | homoiothermy(GO:0042309) |
| 0.1 | 0.3 | GO:0097327 | response to antineoplastic agent(GO:0097327) |
| 0.1 | 0.2 | GO:1900738 | positive regulation of phospholipase C-activating G-protein coupled receptor signaling pathway(GO:1900738) |
| 0.1 | 0.3 | GO:1990168 | protein K33-linked deubiquitination(GO:1990168) |
| 0.1 | 1.8 | GO:0030322 | stabilization of membrane potential(GO:0030322) |
| 0.1 | 0.3 | GO:0002118 | aggressive behavior(GO:0002118) |
| 0.1 | 0.8 | GO:0050910 | detection of mechanical stimulus involved in sensory perception of sound(GO:0050910) |
| 0.1 | 0.8 | GO:0038092 | nodal signaling pathway(GO:0038092) |
| 0.1 | 0.1 | GO:0019085 | early viral transcription(GO:0019085) |
| 0.1 | 0.3 | GO:0023021 | termination of signal transduction(GO:0023021) |
| 0.1 | 0.3 | GO:1904117 | response to vasopressin(GO:1904116) cellular response to vasopressin(GO:1904117) |
| 0.1 | 0.7 | GO:0006477 | protein sulfation(GO:0006477) |
| 0.1 | 0.2 | GO:1904975 | response to bleomycin(GO:1904975) cellular response to bleomycin(GO:1904976) |
| 0.1 | 0.3 | GO:0032055 | negative regulation of translation in response to stress(GO:0032055) negative regulation of translational initiation in response to stress(GO:0032057) |
| 0.1 | 0.1 | GO:1903895 | negative regulation of IRE1-mediated unfolded protein response(GO:1903895) |
| 0.1 | 0.4 | GO:0001574 | ganglioside biosynthetic process(GO:0001574) |
| 0.1 | 0.3 | GO:0002437 | inflammatory response to antigenic stimulus(GO:0002437) |
| 0.1 | 0.3 | GO:0046167 | glycerol-3-phosphate biosynthetic process(GO:0046167) |
| 0.1 | 0.1 | GO:0031639 | plasminogen activation(GO:0031639) |
| 0.1 | 0.1 | GO:0000350 | generation of catalytic spliceosome for second transesterification step(GO:0000350) |
| 0.1 | 0.1 | GO:0002086 | diaphragm contraction(GO:0002086) |
| 0.1 | 0.7 | GO:0017187 | peptidyl-glutamic acid carboxylation(GO:0017187) protein carboxylation(GO:0018214) |
| 0.1 | 0.3 | GO:0030854 | positive regulation of granulocyte differentiation(GO:0030854) |
| 0.1 | 9.4 | GO:0006413 | translational initiation(GO:0006413) |
| 0.1 | 0.4 | GO:0045792 | negative regulation of cell size(GO:0045792) |
| 0.1 | 0.3 | GO:0031936 | negative regulation of chromatin silencing(GO:0031936) |
| 0.1 | 0.1 | GO:1901096 | regulation of autophagosome maturation(GO:1901096) |
| 0.1 | 0.2 | GO:0035811 | negative regulation of urine volume(GO:0035811) |
| 0.1 | 0.5 | GO:0000183 | chromatin silencing at rDNA(GO:0000183) |
| 0.1 | 1.5 | GO:0007141 | male meiosis I(GO:0007141) |
| 0.1 | 0.6 | GO:0007171 | activation of transmembrane receptor protein tyrosine kinase activity(GO:0007171) |
| 0.1 | 0.3 | GO:0060768 | regulation of epithelial cell proliferation involved in prostate gland development(GO:0060768) |
| 0.1 | 0.1 | GO:0061428 | negative regulation of transcription from RNA polymerase II promoter in response to hypoxia(GO:0061428) |
| 0.1 | 0.1 | GO:0019046 | release from viral latency(GO:0019046) |
| 0.1 | 1.1 | GO:0050942 | positive regulation of melanocyte differentiation(GO:0045636) positive regulation of pigment cell differentiation(GO:0050942) |
| 0.1 | 0.8 | GO:0031119 | tRNA pseudouridine synthesis(GO:0031119) |
| 0.1 | 0.8 | GO:0030210 | heparin metabolic process(GO:0030202) heparin biosynthetic process(GO:0030210) |
| 0.1 | 0.4 | GO:0006959 | humoral immune response(GO:0006959) |
| 0.1 | 0.6 | GO:0032464 | positive regulation of protein homooligomerization(GO:0032464) |
| 0.1 | 0.3 | GO:0003431 | growth plate cartilage chondrocyte development(GO:0003431) |
| 0.1 | 0.1 | GO:0061042 | vascular wound healing(GO:0061042) |
| 0.1 | 0.2 | GO:0046586 | regulation of calcium-dependent cell-cell adhesion(GO:0046586) |
| 0.1 | 0.9 | GO:0042789 | mRNA transcription from RNA polymerase II promoter(GO:0042789) |
| 0.1 | 0.3 | GO:0045072 | regulation of interferon-gamma biosynthetic process(GO:0045072) |
| 0.1 | 0.3 | GO:0010626 | regulation of Schwann cell proliferation(GO:0010624) negative regulation of Schwann cell proliferation(GO:0010626) |
| 0.1 | 0.8 | GO:0051044 | positive regulation of membrane protein ectodomain proteolysis(GO:0051044) |
| 0.1 | 0.6 | GO:0035583 | sequestering of TGFbeta in extracellular matrix(GO:0035583) |
| 0.1 | 0.9 | GO:0000722 | telomere maintenance via recombination(GO:0000722) |
| 0.1 | 0.4 | GO:0097284 | hepatocyte apoptotic process(GO:0097284) |
| 0.1 | 2.2 | GO:0032873 | negative regulation of stress-activated MAPK cascade(GO:0032873) negative regulation of stress-activated protein kinase signaling cascade(GO:0070303) |
| 0.1 | 0.1 | GO:0009726 | detection of endogenous stimulus(GO:0009726) |
| 0.1 | 0.3 | GO:0097186 | amelogenesis(GO:0097186) |
| 0.1 | 0.8 | GO:0006309 | apoptotic DNA fragmentation(GO:0006309) |
| 0.1 | 0.4 | GO:0050766 | positive regulation of phagocytosis(GO:0050766) |
| 0.1 | 0.7 | GO:0071353 | cellular response to interleukin-4(GO:0071353) |
| 0.1 | 0.2 | GO:1903259 | exon-exon junction complex disassembly(GO:1903259) |
| 0.1 | 0.2 | GO:0072180 | mesonephric duct morphogenesis(GO:0072180) |
| 0.1 | 0.4 | GO:0051014 | actin filament severing(GO:0051014) |
| 0.1 | 0.4 | GO:0032237 | activation of store-operated calcium channel activity(GO:0032237) positive regulation of store-operated calcium channel activity(GO:1901341) |
| 0.1 | 0.1 | GO:0008626 | granzyme-mediated apoptotic signaling pathway(GO:0008626) |
| 0.1 | 0.2 | GO:0019074 | viral genome packaging(GO:0019072) viral RNA genome packaging(GO:0019074) |
| 0.1 | 1.3 | GO:0098915 | membrane repolarization during ventricular cardiac muscle cell action potential(GO:0098915) |
| 0.1 | 0.5 | GO:0043950 | positive regulation of cAMP-mediated signaling(GO:0043950) |
| 0.1 | 0.1 | GO:0019364 | NADP catabolic process(GO:0006742) pyridine nucleotide catabolic process(GO:0019364) |
| 0.1 | 0.3 | GO:0003433 | chondrocyte development involved in endochondral bone morphogenesis(GO:0003433) |
| 0.1 | 0.2 | GO:1904562 | phosphatidylinositol 5-phosphate metabolic process(GO:1904562) |
| 0.1 | 0.2 | GO:0036046 | protein demalonylation(GO:0036046) peptidyl-lysine demalonylation(GO:0036047) protein desuccinylation(GO:0036048) peptidyl-lysine desuccinylation(GO:0036049) protein deglutarylation(GO:0061698) peptidyl-lysine deglutarylation(GO:0061699) |
| 0.1 | 0.8 | GO:0006525 | arginine metabolic process(GO:0006525) |
| 0.1 | 0.2 | GO:0060151 | peroxisome localization(GO:0060151) microtubule-based peroxisome localization(GO:0060152) |
| 0.1 | 0.5 | GO:0006235 | dTTP biosynthetic process(GO:0006235) pyrimidine deoxyribonucleoside triphosphate biosynthetic process(GO:0009212) |
| 0.1 | 0.2 | GO:0006438 | valyl-tRNA aminoacylation(GO:0006438) |
| 0.1 | 0.2 | GO:0045006 | DNA deamination(GO:0045006) |
| 0.1 | 0.8 | GO:0032119 | sequestering of zinc ion(GO:0032119) |
| 0.1 | 0.5 | GO:0010225 | response to UV-C(GO:0010225) |
| 0.1 | 0.6 | GO:0060338 | regulation of type I interferon-mediated signaling pathway(GO:0060338) |
| 0.1 | 0.6 | GO:1902222 | L-phenylalanine metabolic process(GO:0006558) L-phenylalanine catabolic process(GO:0006559) erythrose 4-phosphate/phosphoenolpyruvate family amino acid metabolic process(GO:1902221) erythrose 4-phosphate/phosphoenolpyruvate family amino acid catabolic process(GO:1902222) |
| 0.1 | 1.0 | GO:0007221 | positive regulation of transcription of Notch receptor target(GO:0007221) |
| 0.1 | 0.2 | GO:0030997 | regulation of centriole-centriole cohesion(GO:0030997) |
| 0.1 | 0.2 | GO:0002184 | cytoplasmic translational termination(GO:0002184) |
| 0.1 | 0.6 | GO:0033539 | fatty acid beta-oxidation using acyl-CoA dehydrogenase(GO:0033539) |
| 0.1 | 0.6 | GO:0034389 | lipid particle organization(GO:0034389) |
| 0.1 | 0.1 | GO:0061739 | protein lipidation involved in autophagosome assembly(GO:0061739) |
| 0.1 | 1.1 | GO:0019370 | leukotriene biosynthetic process(GO:0019370) |
| 0.1 | 0.5 | GO:0070537 | histone H2A K63-linked deubiquitination(GO:0070537) |
| 0.1 | 1.2 | GO:0000083 | regulation of transcription involved in G1/S transition of mitotic cell cycle(GO:0000083) |
| 0.1 | 1.2 | GO:0070816 | phosphorylation of RNA polymerase II C-terminal domain(GO:0070816) |
| 0.1 | 1.2 | GO:0000920 | cell separation after cytokinesis(GO:0000920) |
| 0.1 | 0.1 | GO:0060363 | cranial suture morphogenesis(GO:0060363) |
| 0.1 | 0.6 | GO:0043584 | nose development(GO:0043584) |
| 0.1 | 1.2 | GO:0045737 | positive regulation of cyclin-dependent protein serine/threonine kinase activity(GO:0045737) |
| 0.1 | 0.2 | GO:0006290 | pyrimidine dimer repair(GO:0006290) |
| 0.1 | 0.4 | GO:0019530 | taurine metabolic process(GO:0019530) |
| 0.1 | 6.2 | GO:0070125 | mitochondrial translational elongation(GO:0070125) |
| 0.1 | 0.2 | GO:0097623 | potassium ion export across plasma membrane(GO:0097623) |
| 0.1 | 0.3 | GO:2000860 | positive regulation of mineralocorticoid secretion(GO:2000857) positive regulation of aldosterone secretion(GO:2000860) |
| 0.1 | 0.6 | GO:0048569 | post-embryonic organ development(GO:0048569) |
| 0.1 | 0.3 | GO:0071477 | hypotonic salinity response(GO:0042539) cellular hypotonic salinity response(GO:0071477) |
| 0.1 | 0.5 | GO:0032876 | regulation of DNA endoreduplication(GO:0032875) negative regulation of DNA endoreduplication(GO:0032876) DNA endoreduplication(GO:0042023) |
| 0.1 | 0.3 | GO:1904428 | negative regulation of tubulin deacetylation(GO:1904428) |
| 0.1 | 0.6 | GO:0072310 | glomerular visceral epithelial cell development(GO:0072015) glomerular epithelial cell development(GO:0072310) |
| 0.1 | 0.4 | GO:0071380 | cellular response to prostaglandin E stimulus(GO:0071380) |
| 0.1 | 0.5 | GO:1901970 | positive regulation of mitotic metaphase/anaphase transition(GO:0045842) positive regulation of mitotic sister chromatid separation(GO:1901970) positive regulation of metaphase/anaphase transition of cell cycle(GO:1902101) |
| 0.1 | 0.1 | GO:0070676 | intralumenal vesicle formation(GO:0070676) |
| 0.1 | 0.3 | GO:2001106 | regulation of Rho guanyl-nucleotide exchange factor activity(GO:2001106) |
| 0.1 | 0.4 | GO:0032511 | late endosome to vacuole transport via multivesicular body sorting pathway(GO:0032511) |
| 0.1 | 1.6 | GO:0043252 | sodium-independent organic anion transport(GO:0043252) |
| 0.1 | 0.2 | GO:0051122 | hepoxilin metabolic process(GO:0051121) hepoxilin biosynthetic process(GO:0051122) |
| 0.1 | 0.3 | GO:0043249 | erythrocyte maturation(GO:0043249) |
| 0.0 | 0.1 | GO:0007228 | positive regulation of hh target transcription factor activity(GO:0007228) |
| 0.0 | 0.4 | GO:0006335 | DNA replication-dependent nucleosome assembly(GO:0006335) DNA replication-dependent nucleosome organization(GO:0034723) |
| 0.0 | 0.2 | GO:1902559 | 3'-phosphoadenosine 5'-phosphosulfate transport(GO:0046963) 3'-phospho-5'-adenylyl sulfate transmembrane transport(GO:1902559) |
| 0.0 | 0.9 | GO:0043097 | pyrimidine-containing compound salvage(GO:0008655) pyrimidine nucleoside salvage(GO:0043097) |
| 0.0 | 2.8 | GO:0007077 | mitotic nuclear envelope disassembly(GO:0007077) |
| 0.0 | 0.3 | GO:0018343 | protein farnesylation(GO:0018343) |
| 0.0 | 0.2 | GO:0001845 | phagolysosome assembly(GO:0001845) |
| 0.0 | 0.3 | GO:0060312 | regulation of blood vessel remodeling(GO:0060312) |
| 0.0 | 0.1 | GO:1903715 | regulation of aerobic respiration(GO:1903715) |
| 0.0 | 0.2 | GO:0072734 | response to staurosporine(GO:0072733) cellular response to staurosporine(GO:0072734) |
| 0.0 | 4.0 | GO:0009301 | snRNA transcription(GO:0009301) snRNA transcription from RNA polymerase II promoter(GO:0042795) |
| 0.0 | 0.1 | GO:1903925 | signal transduction involved in intra-S DNA damage checkpoint(GO:0072428) regulation of mitotic cell cycle DNA replication(GO:1903463) negative regulation of mitotic cell cycle DNA replication(GO:1903464) response to bisphenol A(GO:1903925) cellular response to bisphenol A(GO:1903926) |
| 0.0 | 0.4 | GO:0019321 | pentose metabolic process(GO:0019321) |
| 0.0 | 0.5 | GO:0038003 | opioid receptor signaling pathway(GO:0038003) |
| 0.0 | 0.2 | GO:1901550 | regulation of endothelial cell development(GO:1901550) regulation of establishment of endothelial barrier(GO:1903140) |
| 0.0 | 0.5 | GO:0031274 | positive regulation of pseudopodium assembly(GO:0031274) |
| 0.0 | 0.3 | GO:1904380 | endoplasmic reticulum mannose trimming(GO:1904380) |
| 0.0 | 0.6 | GO:0008608 | attachment of spindle microtubules to kinetochore(GO:0008608) |
| 0.0 | 1.1 | GO:0050994 | regulation of lipid catabolic process(GO:0050994) |
| 0.0 | 0.3 | GO:0030259 | lipid glycosylation(GO:0030259) |
| 0.0 | 0.3 | GO:0035902 | response to immobilization stress(GO:0035902) |
| 0.0 | 0.5 | GO:0015937 | coenzyme A biosynthetic process(GO:0015937) |
| 0.0 | 0.4 | GO:0006685 | sphingomyelin catabolic process(GO:0006685) |
| 0.0 | 1.4 | GO:0031581 | hemidesmosome assembly(GO:0031581) |
| 0.0 | 0.3 | GO:0044108 | cellular alcohol metabolic process(GO:0044107) cellular alcohol biosynthetic process(GO:0044108) |
| 0.0 | 0.9 | GO:0071577 | zinc II ion transmembrane transport(GO:0071577) |
| 0.0 | 2.6 | GO:0044819 | mitotic G1 DNA damage checkpoint(GO:0031571) mitotic G1/S transition checkpoint(GO:0044819) |
| 0.0 | 1.0 | GO:0048525 | negative regulation of viral process(GO:0048525) |
| 0.0 | 0.1 | GO:0002071 | glandular epithelial cell maturation(GO:0002071) |
| 0.0 | 0.1 | GO:0044805 | late nucleophagy(GO:0044805) |
| 0.0 | 0.0 | GO:0044406 | adhesion of symbiont to host(GO:0044406) |
| 0.0 | 0.3 | GO:0036037 | CD8-positive, alpha-beta T cell activation(GO:0036037) |
| 0.0 | 0.4 | GO:0045901 | translational frameshifting(GO:0006452) positive regulation of translational elongation(GO:0045901) positive regulation of translational termination(GO:0045905) |
| 0.0 | 0.1 | GO:0090403 | oxidative stress-induced premature senescence(GO:0090403) |
| 0.0 | 0.7 | GO:2000739 | mesenchymal stem cell differentiation(GO:0072497) regulation of mesenchymal stem cell differentiation(GO:2000739) |
| 0.0 | 1.5 | GO:0018345 | protein palmitoylation(GO:0018345) |
| 0.0 | 0.4 | GO:0045721 | negative regulation of gluconeogenesis(GO:0045721) |
| 0.0 | 0.1 | GO:0090283 | regulation of protein glycosylation in Golgi(GO:0090283) |
| 0.0 | 0.1 | GO:2000298 | regulation of Rho-dependent protein serine/threonine kinase activity(GO:2000298) |
| 0.0 | 0.1 | GO:2000275 | regulation of oxidative phosphorylation uncoupler activity(GO:2000275) |
| 0.0 | 0.3 | GO:0051697 | protein delipidation(GO:0051697) |
| 0.0 | 0.2 | GO:0060012 | synaptic transmission, glycinergic(GO:0060012) |
| 0.0 | 0.4 | GO:0031022 | nuclear migration along microfilament(GO:0031022) |
| 0.0 | 0.2 | GO:0050930 | induction of positive chemotaxis(GO:0050930) |
| 0.0 | 0.2 | GO:0089700 | protein kinase D signaling(GO:0089700) |
| 0.0 | 0.1 | GO:0030187 | melatonin metabolic process(GO:0030186) melatonin biosynthetic process(GO:0030187) |
| 0.0 | 0.2 | GO:0033504 | floor plate development(GO:0033504) |
| 0.0 | 0.1 | GO:0031860 | telomeric 3' overhang formation(GO:0031860) |
| 0.0 | 0.2 | GO:0006556 | S-adenosylmethionine biosynthetic process(GO:0006556) |
| 0.0 | 0.2 | GO:1903803 | glutamine secretion(GO:0010585) L-glutamine import(GO:0036229) L-glutamine import into cell(GO:1903803) |
| 0.0 | 0.1 | GO:0018283 | metal incorporation into metallo-sulfur cluster(GO:0018282) iron incorporation into metallo-sulfur cluster(GO:0018283) |
| 0.0 | 1.6 | GO:0060333 | interferon-gamma-mediated signaling pathway(GO:0060333) |
| 0.0 | 0.1 | GO:0009597 | detection of virus(GO:0009597) |
| 0.0 | 0.5 | GO:0001556 | oocyte maturation(GO:0001556) |
| 0.0 | 0.5 | GO:0070208 | protein heterotrimerization(GO:0070208) |
| 0.0 | 0.6 | GO:0090110 | cargo loading into COPII-coated vesicle(GO:0090110) |
| 0.0 | 0.7 | GO:0006491 | N-glycan processing(GO:0006491) |
| 0.0 | 0.5 | GO:0036444 | calcium ion transmembrane import into mitochondrion(GO:0036444) |
| 0.0 | 0.4 | GO:0016576 | histone dephosphorylation(GO:0016576) |
| 0.0 | 0.3 | GO:0043555 | regulation of translation in response to stress(GO:0043555) |
| 0.0 | 0.1 | GO:0090598 | male genitalia morphogenesis(GO:0048808) male anatomical structure morphogenesis(GO:0090598) |
| 0.0 | 0.6 | GO:0018298 | protein-chromophore linkage(GO:0018298) |
| 0.0 | 0.2 | GO:0060837 | blood vessel endothelial cell differentiation(GO:0060837) |
| 0.0 | 0.4 | GO:0035562 | negative regulation of chromatin binding(GO:0035562) |
| 0.0 | 0.1 | GO:1903936 | cellular response to sodium arsenite(GO:1903936) |
| 0.0 | 0.8 | GO:0032201 | telomere maintenance via semi-conservative replication(GO:0032201) |
| 0.0 | 0.1 | GO:2001033 | negative regulation of double-strand break repair via nonhomologous end joining(GO:2001033) |
| 0.0 | 0.2 | GO:0006517 | protein deglycosylation(GO:0006517) |
| 0.0 | 0.5 | GO:1901099 | negative regulation of signal transduction in absence of ligand(GO:1901099) negative regulation of extrinsic apoptotic signaling pathway in absence of ligand(GO:2001240) |
| 0.0 | 0.1 | GO:0010792 | DNA double-strand break processing involved in repair via single-strand annealing(GO:0010792) |
| 0.0 | 0.2 | GO:0045872 | positive regulation of rhodopsin gene expression(GO:0045872) |
| 0.0 | 0.1 | GO:0030263 | apoptotic chromosome condensation(GO:0030263) |
| 0.0 | 0.2 | GO:0003417 | growth plate cartilage development(GO:0003417) |
| 0.0 | 0.1 | GO:0036484 | trunk segmentation(GO:0035290) trunk neural crest cell migration(GO:0036484) ventral trunk neural crest cell migration(GO:0036486) |
| 0.0 | 0.3 | GO:0034505 | tooth mineralization(GO:0034505) |
| 0.0 | 0.5 | GO:0030970 | retrograde protein transport, ER to cytosol(GO:0030970) |
| 0.0 | 0.6 | GO:0046339 | diacylglycerol metabolic process(GO:0046339) |
| 0.0 | 0.1 | GO:0008295 | spermidine biosynthetic process(GO:0008295) |
| 0.0 | 0.1 | GO:1990579 | protein trans-autophosphorylation(GO:0036290) peptidyl-serine trans-autophosphorylation(GO:1990579) |
| 0.0 | 0.6 | GO:0039694 | viral RNA genome replication(GO:0039694) RNA replication(GO:0039703) |
| 0.0 | 0.6 | GO:0042769 | DNA damage response, detection of DNA damage(GO:0042769) |
| 0.0 | 0.3 | GO:0006104 | succinyl-CoA metabolic process(GO:0006104) |
| 0.0 | 0.5 | GO:0042035 | regulation of cytokine biosynthetic process(GO:0042035) |
| 0.0 | 0.3 | GO:0006686 | sphingomyelin biosynthetic process(GO:0006686) |
| 0.0 | 0.1 | GO:0034434 | steroid esterification(GO:0034433) sterol esterification(GO:0034434) cholesterol esterification(GO:0034435) |
| 0.0 | 0.2 | GO:0015772 | disaccharide transport(GO:0015766) sucrose transport(GO:0015770) oligosaccharide transport(GO:0015772) |
| 0.0 | 0.1 | GO:0051599 | response to hydrostatic pressure(GO:0051599) |
| 0.0 | 0.3 | GO:0043586 | tongue development(GO:0043586) |
| 0.0 | 0.1 | GO:0098734 | macromolecule depalmitoylation(GO:0098734) |
| 0.0 | 0.1 | GO:0021503 | neural fold bending(GO:0021503) |
| 0.0 | 0.1 | GO:0061643 | chemorepulsion of dopaminergic neuron axon(GO:0036518) chemorepulsion of axon(GO:0061643) |
| 0.0 | 0.8 | GO:0050962 | detection of light stimulus involved in visual perception(GO:0050908) detection of light stimulus involved in sensory perception(GO:0050962) |
| 0.0 | 0.0 | GO:0009820 | alkaloid metabolic process(GO:0009820) |
| 0.0 | 0.1 | GO:0072081 | proximal/distal pattern formation involved in nephron development(GO:0072047) specification of nephron tubule identity(GO:0072081) specification of loop of Henle identity(GO:0072086) |
| 0.0 | 0.3 | GO:0007512 | adult heart development(GO:0007512) |
| 0.0 | 0.2 | GO:0043248 | proteasome assembly(GO:0043248) |
| 0.0 | 0.1 | GO:0032847 | regulation of cellular pH reduction(GO:0032847) |
| 0.0 | 0.0 | GO:0010838 | positive regulation of keratinocyte proliferation(GO:0010838) |
| 0.0 | 0.3 | GO:0032329 | serine transport(GO:0032329) |
| 0.0 | 0.2 | GO:0001773 | myeloid dendritic cell activation(GO:0001773) |
| 0.0 | 0.1 | GO:0007308 | oocyte construction(GO:0007308) oocyte axis specification(GO:0007309) oocyte anterior/posterior axis specification(GO:0007314) pole plasm assembly(GO:0007315) maternal determination of anterior/posterior axis, embryo(GO:0008358) P granule organization(GO:0030719) |
| 0.0 | 0.4 | GO:0032968 | positive regulation of transcription elongation from RNA polymerase II promoter(GO:0032968) |
| 0.0 | 0.6 | GO:0006099 | tricarboxylic acid cycle(GO:0006099) |
| 0.0 | 0.2 | GO:0071104 | response to interleukin-9(GO:0071104) |
| 0.0 | 0.4 | GO:0070544 | histone H3-K36 demethylation(GO:0070544) |
| 0.0 | 0.3 | GO:0098779 | mitophagy in response to mitochondrial depolarization(GO:0098779) |
| 0.0 | 0.3 | GO:0035970 | peptidyl-threonine dephosphorylation(GO:0035970) |
| 0.0 | 0.1 | GO:0018158 | protein oxidation(GO:0018158) |
| 0.0 | 0.4 | GO:0045746 | negative regulation of Notch signaling pathway(GO:0045746) |
| 0.0 | 0.1 | GO:1904977 | lymphatic endothelial cell migration(GO:1904977) |
| 0.0 | 0.1 | GO:0031337 | cellular response to phosphate starvation(GO:0016036) positive regulation of sulfur amino acid metabolic process(GO:0031337) positive regulation of homocysteine metabolic process(GO:0050668) |
| 0.0 | 0.3 | GO:0010165 | response to X-ray(GO:0010165) |
| 0.0 | 0.4 | GO:0003376 | sphingosine-1-phosphate signaling pathway(GO:0003376) |
| 0.0 | 0.2 | GO:0001765 | membrane raft assembly(GO:0001765) |
| 0.0 | 0.2 | GO:0061085 | regulation of histone H3-K27 methylation(GO:0061085) |
| 0.0 | 0.1 | GO:0034227 | tRNA thio-modification(GO:0034227) |
| 0.0 | 0.4 | GO:0007080 | mitotic metaphase plate congression(GO:0007080) |
| 0.0 | 0.1 | GO:0098856 | intestinal cholesterol absorption(GO:0030299) intestinal lipid absorption(GO:0098856) |
| 0.0 | 0.1 | GO:0002328 | pro-B cell differentiation(GO:0002328) |
| 0.0 | 0.1 | GO:0043951 | negative regulation of cAMP-mediated signaling(GO:0043951) |
| 0.0 | 0.7 | GO:0031146 | SCF-dependent proteasomal ubiquitin-dependent protein catabolic process(GO:0031146) |
| 0.0 | 0.0 | GO:0090193 | positive regulation of glomerular mesangial cell proliferation(GO:0072126) positive regulation of glomerulus development(GO:0090193) positive regulation of cell proliferation involved in kidney development(GO:1901724) |
| 0.0 | 1.1 | GO:0042742 | defense response to bacterium(GO:0042742) |
| 0.0 | 0.2 | GO:0005981 | regulation of glycogen catabolic process(GO:0005981) |
| 0.0 | 0.1 | GO:0070127 | tRNA aminoacylation for mitochondrial protein translation(GO:0070127) |
| 0.0 | 0.1 | GO:0009106 | lipoate metabolic process(GO:0009106) |
| 0.0 | 0.4 | GO:0006004 | fucose metabolic process(GO:0006004) |
| 0.0 | 0.1 | GO:1902914 | regulation of protein polyubiquitination(GO:1902914) |
| 0.0 | 0.3 | GO:0030947 | regulation of vascular endothelial growth factor receptor signaling pathway(GO:0030947) |
| 0.0 | 0.0 | GO:0006691 | leukotriene metabolic process(GO:0006691) |
| 0.0 | 0.0 | GO:0021943 | formation of radial glial scaffolds(GO:0021943) |
| 0.0 | 0.3 | GO:1904886 | beta-catenin destruction complex disassembly(GO:1904886) |
| 0.0 | 0.1 | GO:0060023 | soft palate development(GO:0060023) |
| 0.0 | 0.7 | GO:0070979 | protein K11-linked ubiquitination(GO:0070979) |
| 0.0 | 0.8 | GO:0043984 | histone H4-K16 acetylation(GO:0043984) |
| 0.0 | 0.1 | GO:0048599 | oocyte development(GO:0048599) |
| 0.0 | 0.2 | GO:0051661 | maintenance of centrosome location(GO:0051661) |
| 0.0 | 0.2 | GO:0098787 | mRNA cleavage involved in mRNA processing(GO:0098787) pre-mRNA cleavage required for polyadenylation(GO:0098789) |
| 0.0 | 0.1 | GO:0031468 | nuclear envelope reassembly(GO:0031468) |
| 0.0 | 0.1 | GO:0051096 | positive regulation of helicase activity(GO:0051096) |
| 0.0 | 0.1 | GO:2000467 | positive regulation of glycogen (starch) synthase activity(GO:2000467) |
| 0.0 | 0.1 | GO:0098911 | regulation of ventricular cardiac muscle cell action potential(GO:0098911) |
| 0.0 | 1.1 | GO:0000413 | protein peptidyl-prolyl isomerization(GO:0000413) |
| 0.0 | 0.1 | GO:1902231 | positive regulation of intrinsic apoptotic signaling pathway in response to DNA damage(GO:1902231) |
| 0.0 | 0.3 | GO:0070932 | histone H3 deacetylation(GO:0070932) |
| 0.0 | 0.2 | GO:0002043 | blood vessel endothelial cell proliferation involved in sprouting angiogenesis(GO:0002043) |
| 0.0 | 0.2 | GO:0035879 | plasma membrane lactate transport(GO:0035879) |
| 0.0 | 0.1 | GO:0006072 | glycerol-3-phosphate metabolic process(GO:0006072) |
| 0.0 | 0.2 | GO:0042554 | superoxide anion generation(GO:0042554) |
| 0.0 | 0.0 | GO:1901187 | regulation of ephrin receptor signaling pathway(GO:1901187) |
| 0.0 | 0.1 | GO:0044783 | G1 DNA damage checkpoint(GO:0044783) |
| 0.0 | 0.2 | GO:0044804 | nucleophagy(GO:0044804) |
| 0.0 | 0.1 | GO:0032202 | telomere assembly(GO:0032202) |
| 0.0 | 0.1 | GO:0097398 | response to interleukin-17(GO:0097396) cellular response to interleukin-17(GO:0097398) |
| 0.0 | 0.1 | GO:0060414 | aorta smooth muscle tissue morphogenesis(GO:0060414) |
| 0.0 | 0.1 | GO:0032486 | Rap protein signal transduction(GO:0032486) |
| 0.0 | 0.3 | GO:0043651 | linoleic acid metabolic process(GO:0043651) |
| 0.0 | 0.0 | GO:0035048 | splicing factor protein import into nucleus(GO:0035048) |
| 0.0 | 0.1 | GO:0015742 | alpha-ketoglutarate transport(GO:0015742) |
| 0.0 | 0.1 | GO:0030219 | megakaryocyte differentiation(GO:0030219) |
| 0.0 | 0.1 | GO:0019388 | galactose catabolic process(GO:0019388) |
| 0.0 | 0.2 | GO:0006285 | base-excision repair, AP site formation(GO:0006285) |
| 0.0 | 0.2 | GO:0048741 | skeletal muscle fiber development(GO:0048741) |
| 0.0 | 0.4 | GO:0006739 | NADP metabolic process(GO:0006739) |
| 0.0 | 0.1 | GO:0046618 | drug export(GO:0046618) |
| 0.0 | 0.0 | GO:0044314 | protein K27-linked ubiquitination(GO:0044314) |
| 0.0 | 0.1 | GO:0016127 | cholesterol catabolic process(GO:0006707) sterol catabolic process(GO:0016127) |
| 0.0 | 0.1 | GO:0071294 | cellular response to zinc ion(GO:0071294) |
| 0.0 | 0.2 | GO:0030261 | chromosome condensation(GO:0030261) |
| 0.0 | 0.7 | GO:0006368 | transcription elongation from RNA polymerase II promoter(GO:0006368) |
| 0.0 | 0.4 | GO:0045599 | negative regulation of fat cell differentiation(GO:0045599) |
| 0.0 | 0.1 | GO:0060075 | regulation of resting membrane potential(GO:0060075) |
| 0.0 | 0.3 | GO:0002076 | osteoblast development(GO:0002076) |
| 0.0 | 0.1 | GO:0034721 | histone H3-K4 demethylation, trimethyl-H3-K4-specific(GO:0034721) |
| 0.0 | 0.3 | GO:0006488 | dolichol-linked oligosaccharide biosynthetic process(GO:0006488) |
| 0.0 | 0.1 | GO:0032482 | Rab protein signal transduction(GO:0032482) |
| 0.0 | 0.0 | GO:0002756 | MyD88-independent toll-like receptor signaling pathway(GO:0002756) |
| 0.0 | 0.1 | GO:0015677 | copper ion import(GO:0015677) |
Gene overrepresentation in cellular component category:
| Log-likelihood per target | Total log-likelihood | Term | Description |
|---|---|---|---|
| 3.1 | 15.3 | GO:0071756 | IgM immunoglobulin complex(GO:0071753) IgM immunoglobulin complex, circulating(GO:0071754) pentameric IgM immunoglobulin complex(GO:0071756) |
| 2.1 | 8.4 | GO:0031838 | haptoglobin-hemoglobin complex(GO:0031838) |
| 1.8 | 23.8 | GO:0005577 | fibrinogen complex(GO:0005577) |
| 1.7 | 3.5 | GO:0019814 | immunoglobulin complex(GO:0019814) |
| 1.7 | 10.0 | GO:0097169 | AIM2 inflammasome complex(GO:0097169) |
| 1.5 | 3.1 | GO:0072557 | IPAF inflammasome complex(GO:0072557) |
| 1.5 | 14.7 | GO:0034687 | integrin alphaL-beta2 complex(GO:0034687) |
| 1.4 | 5.7 | GO:0097598 | sperm cytoplasmic droplet(GO:0097598) |
| 1.4 | 4.3 | GO:0097679 | other organism cytoplasm(GO:0097679) |
| 1.4 | 2.8 | GO:0071745 | IgA immunoglobulin complex(GO:0071745) IgA immunoglobulin complex, circulating(GO:0071746) monomeric IgA immunoglobulin complex(GO:0071748) polymeric IgA immunoglobulin complex(GO:0071749) dimeric IgA immunoglobulin complex(GO:0071750) secretory IgA immunoglobulin complex(GO:0071751) secretory dimeric IgA immunoglobulin complex(GO:0071752) |
| 1.4 | 6.8 | GO:0044279 | other organism cell membrane(GO:0044218) other organism membrane(GO:0044279) |
| 1.1 | 56.0 | GO:0042571 | immunoglobulin complex, circulating(GO:0042571) |
| 0.9 | 7.3 | GO:0005579 | membrane attack complex(GO:0005579) |
| 0.9 | 3.6 | GO:0030895 | apolipoprotein B mRNA editing enzyme complex(GO:0030895) |
| 0.9 | 3.6 | GO:0005944 | phosphatidylinositol 3-kinase complex, class IB(GO:0005944) |
| 0.9 | 4.5 | GO:1990667 | PCSK9-AnxA2 complex(GO:1990667) |
| 0.9 | 10.6 | GO:0042105 | alpha-beta T cell receptor complex(GO:0042105) |
| 0.8 | 17.5 | GO:0034364 | high-density lipoprotein particle(GO:0034364) |
| 0.8 | 24.0 | GO:0042627 | chylomicron(GO:0042627) |
| 0.8 | 0.8 | GO:0034688 | integrin alphaM-beta2 complex(GO:0034688) |
| 0.8 | 3.9 | GO:0034669 | integrin alpha4-beta7 complex(GO:0034669) |
| 0.7 | 17.6 | GO:0042101 | T cell receptor complex(GO:0042101) |
| 0.7 | 2.7 | GO:0097013 | phagocytic vesicle lumen(GO:0097013) |
| 0.7 | 5.4 | GO:1990111 | spermatoproteasome complex(GO:1990111) |
| 0.7 | 4.6 | GO:0070876 | SOSS complex(GO:0070876) |
| 0.7 | 2.6 | GO:0035354 | Toll-like receptor 1-Toll-like receptor 2 protein complex(GO:0035354) |
| 0.6 | 4.5 | GO:0036021 | endolysosome lumen(GO:0036021) |
| 0.6 | 1.9 | GO:0042022 | interleukin-12 receptor complex(GO:0042022) |
| 0.6 | 7.0 | GO:0042612 | MHC class I protein complex(GO:0042612) |
| 0.6 | 1.8 | GO:0030526 | granulocyte macrophage colony-stimulating factor receptor complex(GO:0030526) |
| 0.6 | 3.1 | GO:0036502 | Derlin-1-VIMP complex(GO:0036502) |
| 0.6 | 11.8 | GO:0042611 | MHC protein complex(GO:0042611) MHC class II protein complex(GO:0042613) |
| 0.6 | 4.0 | GO:0043541 | UDP-N-acetylglucosamine transferase complex(GO:0043541) |
| 0.6 | 8.0 | GO:0005833 | hemoglobin complex(GO:0005833) |
| 0.6 | 3.4 | GO:0044194 | cytolytic granule(GO:0044194) |
| 0.5 | 6.0 | GO:0032010 | phagolysosome(GO:0032010) |
| 0.5 | 5.3 | GO:0035867 | alphav-beta3 integrin-IGF-1-IGF1R complex(GO:0035867) |
| 0.5 | 9.0 | GO:0071682 | endocytic vesicle lumen(GO:0071682) |
| 0.5 | 8.3 | GO:0046581 | intercellular canaliculus(GO:0046581) |
| 0.5 | 1.6 | GO:0032997 | Fc receptor complex(GO:0032997) Fc-epsilon receptor I complex(GO:0032998) |
| 0.5 | 25.9 | GO:0031092 | platelet alpha granule membrane(GO:0031092) |
| 0.5 | 1.5 | GO:0099400 | cytoplasmic side of mitochondrial outer membrane(GO:0032473) caveola neck(GO:0099400) |
| 0.5 | 1.4 | GO:0016590 | ACF complex(GO:0016590) |
| 0.5 | 4.7 | GO:0046696 | lipopolysaccharide receptor complex(GO:0046696) |
| 0.5 | 2.8 | GO:0043625 | delta DNA polymerase complex(GO:0043625) |
| 0.5 | 2.3 | GO:0031232 | extrinsic component of external side of plasma membrane(GO:0031232) |
| 0.4 | 1.3 | GO:0033150 | cytoskeletal calyx(GO:0033150) |
| 0.4 | 5.3 | GO:0060171 | stereocilium membrane(GO:0060171) |
| 0.4 | 1.3 | GO:0036195 | muscle cell projection(GO:0036194) muscle cell projection membrane(GO:0036195) |
| 0.4 | 77.9 | GO:0072562 | blood microparticle(GO:0072562) |
| 0.4 | 1.7 | GO:1990590 | ATF1-ATF4 transcription factor complex(GO:1990590) |
| 0.4 | 2.5 | GO:0072559 | NLRP3 inflammasome complex(GO:0072559) |
| 0.4 | 0.4 | GO:0005889 | hydrogen:potassium-exchanging ATPase complex(GO:0005889) |
| 0.4 | 0.4 | GO:0002193 | MAML1-RBP-Jkappa- ICN1 complex(GO:0002193) |
| 0.4 | 4.9 | GO:0071438 | invadopodium membrane(GO:0071438) |
| 0.4 | 1.6 | GO:0036398 | TCR signalosome(GO:0036398) |
| 0.4 | 1.2 | GO:0070195 | growth hormone receptor complex(GO:0070195) |
| 0.4 | 1.2 | GO:0005600 | collagen type XIII trimer(GO:0005600) transmembrane collagen trimer(GO:0030936) |
| 0.4 | 1.6 | GO:0061702 | inflammasome complex(GO:0061702) |
| 0.4 | 1.9 | GO:0045257 | mitochondrial respiratory chain complex II, succinate dehydrogenase complex (ubiquinone)(GO:0005749) succinate dehydrogenase complex (ubiquinone)(GO:0045257) respiratory chain complex II(GO:0045273) succinate dehydrogenase complex(GO:0045281) fumarate reductase complex(GO:0045283) |
| 0.4 | 5.3 | GO:0097486 | multivesicular body lumen(GO:0097486) |
| 0.4 | 29.2 | GO:0022627 | cytosolic small ribosomal subunit(GO:0022627) |
| 0.4 | 1.5 | GO:1990879 | CST complex(GO:1990879) |
| 0.4 | 2.2 | GO:0002079 | inner acrosomal membrane(GO:0002079) |
| 0.4 | 1.1 | GO:0097179 | protein C inhibitor-TMPRSS7 complex(GO:0036024) protein C inhibitor-TMPRSS11E complex(GO:0036025) protein C inhibitor-PLAT complex(GO:0036026) protein C inhibitor-PLAU complex(GO:0036027) protein C inhibitor-thrombin complex(GO:0036028) protein C inhibitor-KLK3 complex(GO:0036029) protein C inhibitor-plasma kallikrein complex(GO:0036030) protease inhibitor complex(GO:0097179) serine protease inhibitor complex(GO:0097180) protein C inhibitor-coagulation factor V complex(GO:0097181) protein C inhibitor-coagulation factor Xa complex(GO:0097182) protein C inhibitor-coagulation factor XI complex(GO:0097183) |
| 0.4 | 35.1 | GO:0035580 | specific granule lumen(GO:0035580) |
| 0.4 | 9.5 | GO:0001527 | microfibril(GO:0001527) fibril(GO:0043205) |
| 0.4 | 2.2 | GO:0005896 | interleukin-6 receptor complex(GO:0005896) |
| 0.4 | 1.8 | GO:0034665 | integrin alpha1-beta1 complex(GO:0034665) |
| 0.4 | 14.2 | GO:0001891 | phagocytic cup(GO:0001891) |
| 0.4 | 2.5 | GO:0097149 | centralspindlin complex(GO:0097149) |
| 0.4 | 2.5 | GO:0042824 | MHC class I peptide loading complex(GO:0042824) |
| 0.4 | 2.5 | GO:0032311 | angiogenin-PRI complex(GO:0032311) |
| 0.4 | 0.7 | GO:1990726 | Lsm1-7-Pat1 complex(GO:1990726) |
| 0.3 | 1.0 | GO:0070081 | clathrin-sculpted monoamine transport vesicle(GO:0070081) clathrin-sculpted monoamine transport vesicle membrane(GO:0070083) |
| 0.3 | 1.3 | GO:0033257 | Bcl3/NF-kappaB2 complex(GO:0033257) |
| 0.3 | 2.9 | GO:0035985 | senescence-associated heterochromatin focus(GO:0035985) |
| 0.3 | 6.1 | GO:0031254 | uropod(GO:0001931) cell trailing edge(GO:0031254) |
| 0.3 | 7.0 | GO:0031265 | CD95 death-inducing signaling complex(GO:0031265) |
| 0.3 | 2.2 | GO:0005784 | Sec61 translocon complex(GO:0005784) translocon complex(GO:0071256) |
| 0.3 | 1.3 | GO:0005863 | striated muscle myosin thick filament(GO:0005863) |
| 0.3 | 11.5 | GO:0042629 | mast cell granule(GO:0042629) |
| 0.3 | 4.0 | GO:0035686 | sperm fibrous sheath(GO:0035686) |
| 0.3 | 20.8 | GO:0001772 | immunological synapse(GO:0001772) |
| 0.3 | 4.8 | GO:0031089 | platelet dense granule lumen(GO:0031089) |
| 0.3 | 2.1 | GO:0097209 | epidermal lamellar body(GO:0097209) |
| 0.3 | 1.5 | GO:0031618 | nuclear pericentric heterochromatin(GO:0031618) |
| 0.3 | 100.6 | GO:0009897 | external side of plasma membrane(GO:0009897) |
| 0.3 | 5.4 | GO:0008250 | oligosaccharyltransferase complex(GO:0008250) |
| 0.3 | 0.8 | GO:0032002 | interleukin-28 receptor complex(GO:0032002) |
| 0.3 | 2.7 | GO:0034663 | endoplasmic reticulum chaperone complex(GO:0034663) |
| 0.3 | 0.8 | GO:0043511 | inhibin complex(GO:0043511) inhibin A complex(GO:0043512) |
| 0.3 | 2.2 | GO:0097443 | sorting endosome(GO:0097443) |
| 0.3 | 1.1 | GO:0005588 | collagen type V trimer(GO:0005588) |
| 0.3 | 1.6 | GO:0035339 | SPOTS complex(GO:0035339) |
| 0.3 | 35.9 | GO:0070821 | tertiary granule membrane(GO:0070821) |
| 0.3 | 1.6 | GO:0005873 | plus-end kinesin complex(GO:0005873) |
| 0.3 | 0.8 | GO:0005760 | gamma DNA polymerase complex(GO:0005760) |
| 0.3 | 1.0 | GO:0031905 | early endosome lumen(GO:0031905) |
| 0.3 | 0.8 | GO:0034684 | integrin alphav-beta5 complex(GO:0034684) |
| 0.3 | 25.9 | GO:0033116 | endoplasmic reticulum-Golgi intermediate compartment membrane(GO:0033116) |
| 0.2 | 28.5 | GO:0022625 | cytosolic large ribosomal subunit(GO:0022625) |
| 0.2 | 1.2 | GO:0036501 | UFD1-NPL4 complex(GO:0036501) |
| 0.2 | 0.7 | GO:0031080 | nuclear pore outer ring(GO:0031080) |
| 0.2 | 1.7 | GO:0030289 | protein phosphatase 4 complex(GO:0030289) |
| 0.2 | 0.7 | GO:0090651 | apical cytoplasm(GO:0090651) |
| 0.2 | 1.7 | GO:0070369 | beta-catenin-TCF7L2 complex(GO:0070369) catenin-TCF7L2 complex(GO:0071664) |
| 0.2 | 1.4 | GO:0044214 | spanning component of plasma membrane(GO:0044214) spanning component of membrane(GO:0089717) |
| 0.2 | 0.7 | GO:0009346 | citrate lyase complex(GO:0009346) |
| 0.2 | 0.7 | GO:0033593 | BRCA2-MAGE-D1 complex(GO:0033593) |
| 0.2 | 1.3 | GO:0043196 | varicosity(GO:0043196) |
| 0.2 | 19.5 | GO:0035577 | azurophil granule membrane(GO:0035577) |
| 0.2 | 1.3 | GO:1990907 | beta-catenin-TCF complex(GO:1990907) |
| 0.2 | 0.6 | GO:0035370 | UBC13-UEV1A complex(GO:0035370) |
| 0.2 | 5.2 | GO:0045495 | P granule(GO:0043186) pole plasm(GO:0045495) germ plasm(GO:0060293) |
| 0.2 | 1.4 | GO:0005658 | alpha DNA polymerase:primase complex(GO:0005658) |
| 0.2 | 26.5 | GO:0035578 | azurophil granule lumen(GO:0035578) |
| 0.2 | 0.4 | GO:0031931 | TORC1 complex(GO:0031931) TOR complex(GO:0038201) |
| 0.2 | 1.4 | GO:0031262 | Ndc80 complex(GO:0031262) |
| 0.2 | 0.6 | GO:0036117 | hyaluranon cable(GO:0036117) |
| 0.2 | 0.2 | GO:0030678 | mitochondrial ribonuclease P complex(GO:0030678) |
| 0.2 | 2.1 | GO:0002199 | zona pellucida receptor complex(GO:0002199) |
| 0.2 | 1.7 | GO:0098536 | deuterosome(GO:0098536) |
| 0.2 | 0.6 | GO:0036284 | tubulobulbar complex(GO:0036284) |
| 0.2 | 4.2 | GO:0001741 | XY body(GO:0001741) |
| 0.2 | 0.7 | GO:0031084 | BLOC-2 complex(GO:0031084) |
| 0.2 | 1.6 | GO:0065010 | extracellular membrane-bounded organelle(GO:0065010) |
| 0.2 | 1.4 | GO:0019907 | cyclin-dependent protein kinase activating kinase holoenzyme complex(GO:0019907) |
| 0.2 | 0.9 | GO:0005595 | collagen type XII trimer(GO:0005595) |
| 0.2 | 0.4 | GO:0072536 | interleukin-23 receptor complex(GO:0072536) |
| 0.2 | 1.4 | GO:1990682 | CSF1-CSF1R complex(GO:1990682) |
| 0.2 | 1.6 | GO:0098554 | cytoplasmic side of endoplasmic reticulum membrane(GO:0098554) |
| 0.2 | 0.3 | GO:0097125 | cyclin B1-CDK1 complex(GO:0097125) |
| 0.2 | 2.2 | GO:0005688 | U6 snRNP(GO:0005688) |
| 0.2 | 2.5 | GO:0001520 | outer dense fiber(GO:0001520) |
| 0.2 | 6.6 | GO:0005719 | nuclear euchromatin(GO:0005719) |
| 0.2 | 0.2 | GO:0005958 | DNA-dependent protein kinase-DNA ligase 4 complex(GO:0005958) |
| 0.2 | 2.0 | GO:0071541 | eukaryotic translation initiation factor 3 complex, eIF3m(GO:0071541) |
| 0.2 | 0.5 | GO:1990742 | microvesicle(GO:1990742) |
| 0.2 | 1.0 | GO:0097165 | nuclear stress granule(GO:0097165) |
| 0.2 | 0.7 | GO:0005828 | kinetochore microtubule(GO:0005828) |
| 0.2 | 1.7 | GO:0045180 | basal cortex(GO:0045180) |
| 0.2 | 2.0 | GO:0097524 | sperm plasma membrane(GO:0097524) |
| 0.2 | 0.2 | GO:0002945 | cyclin K-CDK13 complex(GO:0002945) |
| 0.2 | 1.8 | GO:0008282 | ATP-sensitive potassium channel complex(GO:0008282) |
| 0.2 | 1.3 | GO:0071595 | Nem1-Spo7 phosphatase complex(GO:0071595) |
| 0.2 | 5.4 | GO:0030014 | CCR4-NOT complex(GO:0030014) |
| 0.2 | 1.4 | GO:0071797 | LUBAC complex(GO:0071797) |
| 0.2 | 0.8 | GO:0044754 | autolysosome(GO:0044754) |
| 0.2 | 0.9 | GO:0032807 | DNA ligase IV complex(GO:0032807) |
| 0.2 | 1.1 | GO:0032280 | symmetric synapse(GO:0032280) |
| 0.2 | 3.8 | GO:0044613 | nuclear pore central transport channel(GO:0044613) |
| 0.2 | 0.9 | GO:0000799 | nuclear condensin complex(GO:0000799) |
| 0.2 | 0.3 | GO:0001651 | dense fibrillar component(GO:0001651) |
| 0.1 | 1.0 | GO:0000801 | central element(GO:0000801) |
| 0.1 | 1.0 | GO:1990462 | omegasome(GO:1990462) |
| 0.1 | 2.4 | GO:0032039 | integrator complex(GO:0032039) |
| 0.1 | 0.3 | GO:0000805 | X chromosome(GO:0000805) |
| 0.1 | 9.7 | GO:0001533 | cornified envelope(GO:0001533) |
| 0.1 | 0.4 | GO:0036387 | nuclear pre-replicative complex(GO:0005656) pre-replicative complex(GO:0036387) |
| 0.1 | 0.9 | GO:0009368 | endopeptidase Clp complex(GO:0009368) |
| 0.1 | 1.1 | GO:0034993 | microtubule organizing center attachment site(GO:0034992) LINC complex(GO:0034993) |
| 0.1 | 4.4 | GO:0031528 | microvillus membrane(GO:0031528) |
| 0.1 | 1.1 | GO:0032133 | chromosome passenger complex(GO:0032133) |
| 0.1 | 3.6 | GO:0031229 | integral component of nuclear inner membrane(GO:0005639) intrinsic component of nuclear inner membrane(GO:0031229) |
| 0.1 | 1.5 | GO:0035692 | macrophage migration inhibitory factor receptor complex(GO:0035692) |
| 0.1 | 0.4 | GO:0001674 | female germ cell nucleus(GO:0001674) |
| 0.1 | 1.9 | GO:0042599 | lamellar body(GO:0042599) |
| 0.1 | 5.5 | GO:1904724 | tertiary granule lumen(GO:1904724) |
| 0.1 | 0.4 | GO:0060342 | photoreceptor inner segment membrane(GO:0060342) |
| 0.1 | 0.4 | GO:0005927 | muscle tendon junction(GO:0005927) |
| 0.1 | 6.3 | GO:0034451 | centriolar satellite(GO:0034451) |
| 0.1 | 1.0 | GO:0098576 | lumenal side of membrane(GO:0098576) |
| 0.1 | 2.9 | GO:0035102 | PRC1 complex(GO:0035102) |
| 0.1 | 1.7 | GO:0097136 | Bcl-2 family protein complex(GO:0097136) |
| 0.1 | 2.4 | GO:0036056 | filtration diaphragm(GO:0036056) slit diaphragm(GO:0036057) |
| 0.1 | 0.6 | GO:0000839 | Hrd1p ubiquitin ligase ERAD-L complex(GO:0000839) |
| 0.1 | 1.4 | GO:0097413 | Lewy body(GO:0097413) |
| 0.1 | 1.1 | GO:0005785 | signal recognition particle receptor complex(GO:0005785) |
| 0.1 | 0.9 | GO:0071986 | Ragulator complex(GO:0071986) |
| 0.1 | 1.3 | GO:0042382 | paraspeckles(GO:0042382) |
| 0.1 | 0.5 | GO:0008537 | proteasome activator complex(GO:0008537) |
| 0.1 | 1.3 | GO:0005943 | phosphatidylinositol 3-kinase complex, class IA(GO:0005943) |
| 0.1 | 1.2 | GO:0043190 | ATP-binding cassette (ABC) transporter complex(GO:0043190) |
| 0.1 | 1.2 | GO:0005655 | nucleolar ribonuclease P complex(GO:0005655) |
| 0.1 | 0.5 | GO:0070701 | mucus layer(GO:0070701) |
| 0.1 | 7.7 | GO:0005782 | peroxisomal matrix(GO:0005782) microbody lumen(GO:0031907) |
| 0.1 | 2.5 | GO:0045277 | respiratory chain complex IV(GO:0045277) |
| 0.1 | 0.5 | GO:0005753 | mitochondrial proton-transporting ATP synthase complex(GO:0005753) proton-transporting ATP synthase complex(GO:0045259) |
| 0.1 | 8.1 | GO:0005762 | organellar large ribosomal subunit(GO:0000315) mitochondrial large ribosomal subunit(GO:0005762) |
| 0.1 | 0.4 | GO:1990356 | sumoylated E2 ligase complex(GO:1990356) |
| 0.1 | 0.5 | GO:0070022 | transforming growth factor beta receptor homodimeric complex(GO:0070022) |
| 0.1 | 0.8 | GO:0000791 | euchromatin(GO:0000791) |
| 0.1 | 1.1 | GO:0005672 | transcription factor TFIIA complex(GO:0005672) |
| 0.1 | 1.7 | GO:0005885 | Arp2/3 protein complex(GO:0005885) |
| 0.1 | 1.5 | GO:0000778 | condensed nuclear chromosome kinetochore(GO:0000778) |
| 0.1 | 0.7 | GO:0089701 | U2AF(GO:0089701) |
| 0.1 | 0.2 | GO:0033256 | I-kappaB/NF-kappaB complex(GO:0033256) |
| 0.1 | 0.6 | GO:0048476 | Holliday junction resolvase complex(GO:0048476) |
| 0.1 | 1.3 | GO:0072487 | MSL complex(GO:0072487) |
| 0.1 | 0.8 | GO:0031415 | NatA complex(GO:0031415) |
| 0.1 | 0.3 | GO:0043293 | apoptosome(GO:0043293) |
| 0.1 | 0.4 | GO:0035517 | PR-DUB complex(GO:0035517) |
| 0.1 | 1.7 | GO:0097225 | sperm midpiece(GO:0097225) |
| 0.1 | 1.3 | GO:0033588 | Elongator holoenzyme complex(GO:0033588) |
| 0.1 | 0.9 | GO:0030896 | checkpoint clamp complex(GO:0030896) |
| 0.1 | 1.0 | GO:0097550 | transcriptional preinitiation complex(GO:0097550) |
| 0.1 | 0.4 | GO:1990423 | RZZ complex(GO:1990423) |
| 0.1 | 0.8 | GO:0035976 | AP1 complex(GO:0035976) |
| 0.1 | 1.1 | GO:0036128 | CatSper complex(GO:0036128) |
| 0.1 | 0.3 | GO:1990298 | mitotic checkpoint complex(GO:0033597) bub1-bub3 complex(GO:1990298) |
| 0.1 | 0.7 | GO:1990246 | uniplex complex(GO:1990246) |
| 0.1 | 0.7 | GO:0032299 | ribonuclease H2 complex(GO:0032299) |
| 0.1 | 0.9 | GO:0005787 | signal peptidase complex(GO:0005787) |
| 0.1 | 0.7 | GO:0005594 | collagen type IX trimer(GO:0005594) |
| 0.1 | 0.7 | GO:0070435 | Shc-EGFR complex(GO:0070435) |
| 0.1 | 0.7 | GO:0070436 | Grb2-EGFR complex(GO:0070436) |
| 0.1 | 0.6 | GO:0000780 | condensed nuclear chromosome, centromeric region(GO:0000780) |
| 0.1 | 0.5 | GO:0033553 | rDNA heterochromatin(GO:0033553) |
| 0.1 | 1.4 | GO:0032426 | stereocilium tip(GO:0032426) |
| 0.1 | 0.3 | GO:0071817 | MMXD complex(GO:0071817) |
| 0.1 | 0.3 | GO:0034991 | nuclear meiotic cohesin complex(GO:0034991) |
| 0.1 | 0.3 | GO:0031264 | death-inducing signaling complex(GO:0031264) |
| 0.1 | 9.0 | GO:0005811 | lipid particle(GO:0005811) |
| 0.1 | 0.3 | GO:0030312 | external encapsulating structure(GO:0030312) |
| 0.1 | 0.7 | GO:0031313 | extrinsic component of endosome membrane(GO:0031313) |
| 0.1 | 11.6 | GO:0001669 | acrosomal vesicle(GO:0001669) |
| 0.1 | 0.6 | GO:0034098 | VCP-NPL4-UFD1 AAA ATPase complex(GO:0034098) |
| 0.1 | 0.8 | GO:0045252 | oxoglutarate dehydrogenase complex(GO:0045252) |
| 0.1 | 0.4 | GO:0000220 | vacuolar proton-transporting V-type ATPase, V0 domain(GO:0000220) |
| 0.1 | 0.2 | GO:0098837 | postsynaptic recycling endosome(GO:0098837) |
| 0.1 | 0.4 | GO:0046930 | pore complex(GO:0046930) |
| 0.1 | 17.1 | GO:0030667 | secretory granule membrane(GO:0030667) |
| 0.1 | 0.6 | GO:0031523 | Myb complex(GO:0031523) |
| 0.1 | 18.1 | GO:0034774 | secretory granule lumen(GO:0034774) |
| 0.1 | 0.6 | GO:0000308 | cytoplasmic cyclin-dependent protein kinase holoenzyme complex(GO:0000308) |
| 0.1 | 0.6 | GO:1990316 | ATG1/ULK1 kinase complex(GO:1990316) |
| 0.1 | 0.8 | GO:0002116 | semaphorin receptor complex(GO:0002116) |
| 0.1 | 0.2 | GO:0031251 | PAN complex(GO:0031251) |
| 0.1 | 0.2 | GO:0031933 | telomeric heterochromatin(GO:0031933) |
| 0.1 | 0.8 | GO:0098559 | cytoplasmic side of early endosome membrane(GO:0098559) |
| 0.1 | 0.3 | GO:0044307 | dendritic branch(GO:0044307) |
| 0.1 | 0.3 | GO:0034455 | t-UTP complex(GO:0034455) |
| 0.1 | 0.4 | GO:0032437 | cuticular plate(GO:0032437) |
| 0.1 | 0.3 | GO:0061617 | MICOS complex(GO:0061617) |
| 0.1 | 0.2 | GO:0097342 | ripoptosome(GO:0097342) |
| 0.1 | 0.3 | GO:0031205 | endoplasmic reticulum Sec complex(GO:0031205) |
| 0.1 | 0.3 | GO:0030906 | retromer, cargo-selective complex(GO:0030906) |
| 0.1 | 0.2 | GO:1902636 | kinociliary basal body(GO:1902636) |
| 0.1 | 0.5 | GO:0005971 | ribonucleoside-diphosphate reductase complex(GO:0005971) |
| 0.1 | 0.1 | GO:0000438 | core TFIIH complex portion of holo TFIIH complex(GO:0000438) |
| 0.1 | 0.9 | GO:0042405 | nuclear inclusion body(GO:0042405) |
| 0.1 | 1.5 | GO:0000164 | protein phosphatase type 1 complex(GO:0000164) |
| 0.1 | 0.3 | GO:0070765 | gamma-secretase complex(GO:0070765) |
| 0.1 | 0.8 | GO:0005790 | smooth endoplasmic reticulum(GO:0005790) |
| 0.1 | 1.8 | GO:0031305 | intrinsic component of mitochondrial inner membrane(GO:0031304) integral component of mitochondrial inner membrane(GO:0031305) |
| 0.1 | 0.9 | GO:0005614 | interstitial matrix(GO:0005614) |
| 0.1 | 0.8 | GO:0000015 | phosphopyruvate hydratase complex(GO:0000015) |
| 0.1 | 4.0 | GO:0009295 | nucleoid(GO:0009295) mitochondrial nucleoid(GO:0042645) |
| 0.1 | 0.4 | GO:0043020 | NADPH oxidase complex(GO:0043020) |
| 0.1 | 0.3 | GO:0035838 | growing cell tip(GO:0035838) new growing cell tip(GO:0035841) |
| 0.1 | 5.8 | GO:0044217 | other organism(GO:0044215) other organism cell(GO:0044216) other organism part(GO:0044217) |
| 0.1 | 0.2 | GO:0035101 | FACT complex(GO:0035101) |
| 0.1 | 0.8 | GO:0035068 | micro-ribonucleoprotein complex(GO:0035068) |
| 0.1 | 0.5 | GO:0032777 | Piccolo NuA4 histone acetyltransferase complex(GO:0032777) |
| 0.1 | 0.6 | GO:0019773 | proteasome core complex, alpha-subunit complex(GO:0019773) |
| 0.1 | 1.2 | GO:0005942 | phosphatidylinositol 3-kinase complex(GO:0005942) |
| 0.1 | 0.2 | GO:0018444 | translation release factor complex(GO:0018444) |
| 0.1 | 0.3 | GO:0048179 | activin receptor complex(GO:0048179) |
| 0.1 | 0.7 | GO:0098643 | fibrillar collagen trimer(GO:0005583) banded collagen fibril(GO:0098643) |
| 0.1 | 0.1 | GO:0000814 | ESCRT II complex(GO:0000814) |
| 0.1 | 0.8 | GO:0005852 | eukaryotic translation initiation factor 3 complex(GO:0005852) |
| 0.1 | 0.6 | GO:0016442 | RISC complex(GO:0016442) RNAi effector complex(GO:0031332) |
| 0.1 | 0.5 | GO:0005610 | laminin-5 complex(GO:0005610) |
| 0.1 | 0.3 | GO:0000788 | nuclear nucleosome(GO:0000788) |
| 0.1 | 1.2 | GO:0031932 | TORC2 complex(GO:0031932) |
| 0.1 | 0.2 | GO:0034657 | GID complex(GO:0034657) |
| 0.1 | 0.6 | GO:0005638 | lamin filament(GO:0005638) |
| 0.1 | 0.4 | GO:0019774 | proteasome core complex, beta-subunit complex(GO:0019774) |
| 0.1 | 1.0 | GO:0000800 | lateral element(GO:0000800) |
| 0.1 | 0.2 | GO:0070937 | CRD-mediated mRNA stability complex(GO:0070937) |
| 0.1 | 0.4 | GO:0042272 | nuclear RNA export factor complex(GO:0042272) |
| 0.1 | 0.4 | GO:0032009 | early phagosome(GO:0032009) |
| 0.1 | 0.7 | GO:0101002 | ficolin-1-rich granule(GO:0101002) ficolin-1-rich granule lumen(GO:1904813) |
| 0.1 | 27.9 | GO:0005667 | transcription factor complex(GO:0005667) |
| 0.0 | 0.6 | GO:0044666 | MLL3/4 complex(GO:0044666) |
| 0.0 | 0.5 | GO:0005851 | eukaryotic translation initiation factor 2B complex(GO:0005851) |
| 0.0 | 0.0 | GO:0002178 | palmitoyltransferase complex(GO:0002178) |
| 0.0 | 0.9 | GO:0005847 | mRNA cleavage and polyadenylation specificity factor complex(GO:0005847) |
| 0.0 | 1.0 | GO:0031904 | endosome lumen(GO:0031904) |
| 0.0 | 5.4 | GO:0032580 | Golgi cisterna membrane(GO:0032580) |
| 0.0 | 1.1 | GO:0005801 | cis-Golgi network(GO:0005801) |
| 0.0 | 0.3 | GO:0031501 | mannosyltransferase complex(GO:0031501) |
| 0.0 | 0.3 | GO:0032806 | carboxy-terminal domain protein kinase complex(GO:0032806) |
| 0.0 | 2.9 | GO:0031228 | intrinsic component of Golgi membrane(GO:0031228) |
| 0.0 | 0.1 | GO:0044609 | DBIRD complex(GO:0044609) |
| 0.0 | 0.8 | GO:0030056 | hemidesmosome(GO:0030056) |
| 0.0 | 6.4 | GO:0016605 | PML body(GO:0016605) |
| 0.0 | 0.6 | GO:0034518 | RNA cap binding complex(GO:0034518) |
| 0.0 | 0.3 | GO:0042406 | extrinsic component of endoplasmic reticulum membrane(GO:0042406) |
| 0.0 | 0.2 | GO:0005965 | protein farnesyltransferase complex(GO:0005965) |
| 0.0 | 3.3 | GO:0045095 | keratin filament(GO:0045095) |
| 0.0 | 1.0 | GO:0031011 | Ino80 complex(GO:0031011) DNA helicase complex(GO:0033202) |
| 0.0 | 0.5 | GO:0097038 | perinuclear endoplasmic reticulum(GO:0097038) |
| 0.0 | 0.1 | GO:0097135 | cyclin E2-CDK2 complex(GO:0097135) |
| 0.0 | 0.2 | GO:0071008 | U2-type post-mRNA release spliceosomal complex(GO:0071008) |
| 0.0 | 2.0 | GO:0005793 | endoplasmic reticulum-Golgi intermediate compartment(GO:0005793) |
| 0.0 | 0.3 | GO:0072687 | meiotic spindle(GO:0072687) |
| 0.0 | 58.8 | GO:0005615 | extracellular space(GO:0005615) |
| 0.0 | 0.1 | GO:0005602 | complement component C1 complex(GO:0005602) |
| 0.0 | 0.5 | GO:0031465 | Cul4B-RING E3 ubiquitin ligase complex(GO:0031465) |
| 0.0 | 0.4 | GO:0071818 | BAT3 complex(GO:0071818) ER membrane insertion complex(GO:0072379) |
| 0.0 | 0.8 | GO:0005922 | connexon complex(GO:0005922) |
| 0.0 | 0.4 | GO:0044327 | dendritic spine head(GO:0044327) |
| 0.0 | 0.2 | GO:0033165 | interphotoreceptor matrix(GO:0033165) |
| 0.0 | 0.2 | GO:0042788 | polysomal ribosome(GO:0042788) |
| 0.0 | 0.2 | GO:0030057 | desmosome(GO:0030057) |
| 0.0 | 0.2 | GO:0031298 | replication fork protection complex(GO:0031298) |
| 0.0 | 0.1 | GO:1990630 | Ire1 complex(GO:1990332) IRE1-RACK1-PP2A complex(GO:1990630) |
| 0.0 | 0.2 | GO:0000796 | condensin complex(GO:0000796) |
| 0.0 | 2.0 | GO:0001917 | photoreceptor inner segment(GO:0001917) |
| 0.0 | 0.3 | GO:0000940 | condensed chromosome outer kinetochore(GO:0000940) |
| 0.0 | 0.1 | GO:0010370 | perinucleolar chromocenter(GO:0010370) |
| 0.0 | 0.4 | GO:0071204 | histone pre-mRNA 3'end processing complex(GO:0071204) |
| 0.0 | 0.4 | GO:0016461 | unconventional myosin complex(GO:0016461) |
| 0.0 | 0.2 | GO:0034388 | Pwp2p-containing subcomplex of 90S preribosome(GO:0034388) |
| 0.0 | 0.2 | GO:0000124 | SAGA complex(GO:0000124) |
| 0.0 | 0.5 | GO:0008074 | guanylate cyclase complex, soluble(GO:0008074) |
| 0.0 | 0.3 | GO:0030008 | TRAPP complex(GO:0030008) |
| 0.0 | 0.2 | GO:0030126 | COPI vesicle coat(GO:0030126) COPI-coated vesicle membrane(GO:0030663) |
| 0.0 | 0.5 | GO:0030134 | ER to Golgi transport vesicle(GO:0030134) |
| 0.0 | 1.3 | GO:0005902 | microvillus(GO:0005902) |
| 0.0 | 0.2 | GO:0008622 | epsilon DNA polymerase complex(GO:0008622) |
| 0.0 | 0.1 | GO:0032937 | SREBP-SCAP-Insig complex(GO:0032937) |
| 0.0 | 0.3 | GO:0045120 | pronucleus(GO:0045120) |
| 0.0 | 0.1 | GO:0090571 | RNA polymerase II transcription repressor complex(GO:0090571) |
| 0.0 | 0.2 | GO:0005721 | pericentric heterochromatin(GO:0005721) |
| 0.0 | 0.4 | GO:0070971 | endoplasmic reticulum exit site(GO:0070971) |
| 0.0 | 1.1 | GO:0005747 | mitochondrial respiratory chain complex I(GO:0005747) NADH dehydrogenase complex(GO:0030964) respiratory chain complex I(GO:0045271) |
| 0.0 | 3.9 | GO:0036464 | cytoplasmic ribonucleoprotein granule(GO:0036464) |
| 0.0 | 0.1 | GO:0097362 | MCM8-MCM9 complex(GO:0097362) |
| 0.0 | 0.4 | GO:0005736 | DNA-directed RNA polymerase I complex(GO:0005736) |
| 0.0 | 1.7 | GO:0000777 | condensed chromosome kinetochore(GO:0000777) |
| 0.0 | 19.9 | GO:0005789 | endoplasmic reticulum membrane(GO:0005789) |
| 0.0 | 0.1 | GO:1990851 | Wnt-Frizzled-LRP5/6 complex(GO:1990851) |
| 0.0 | 0.1 | GO:0032798 | Swi5-Sfr1 complex(GO:0032798) |
| 0.0 | 0.0 | GO:0019908 | nuclear cyclin-dependent protein kinase holoenzyme complex(GO:0019908) |
| 0.0 | 0.1 | GO:0030485 | smooth muscle contractile fiber(GO:0030485) |
| 0.0 | 0.6 | GO:0016592 | mediator complex(GO:0016592) |
| 0.0 | 0.1 | GO:0070449 | elongin complex(GO:0070449) |
| 0.0 | 0.1 | GO:0033186 | CAF-1 complex(GO:0033186) |
| 0.0 | 0.2 | GO:0097381 | photoreceptor disc membrane(GO:0097381) |
Gene overrepresentation in molecular function category:
| Log-likelihood per target | Total log-likelihood | Term | Description |
|---|---|---|---|
| 2.9 | 11.4 | GO:0061609 | fructose-1-phosphate aldolase activity(GO:0061609) |
| 2.6 | 13.0 | GO:0034875 | oxidoreductase activity, acting on CH or CH2 groups, quinone or similar compound as acceptor(GO:0033695) caffeine oxidase activity(GO:0034875) |
| 2.5 | 7.6 | GO:0004917 | interleukin-7 receptor activity(GO:0004917) |
| 2.4 | 12.0 | GO:0004910 | interleukin-1, Type II, blocking receptor activity(GO:0004910) |
| 2.1 | 6.3 | GO:0050528 | acyloxyacyl hydrolase activity(GO:0050528) |
| 2.0 | 23.8 | GO:0070892 | lipoteichoic acid receptor activity(GO:0070892) |
| 2.0 | 7.9 | GO:0017159 | pantetheine hydrolase activity(GO:0017159) |
| 2.0 | 11.8 | GO:0060230 | lipoprotein lipase activator activity(GO:0060230) |
| 2.0 | 7.8 | GO:0047023 | androsterone dehydrogenase activity(GO:0047023) |
| 1.9 | 13.3 | GO:0030492 | hemoglobin binding(GO:0030492) |
| 1.8 | 14.7 | GO:0004873 | asialoglycoprotein receptor activity(GO:0004873) |
| 1.8 | 12.5 | GO:0019862 | IgA binding(GO:0019862) |
| 1.8 | 8.9 | GO:0005350 | pyrimidine nucleobase transmembrane transporter activity(GO:0005350) |
| 1.7 | 10.3 | GO:0004918 | interleukin-8 receptor activity(GO:0004918) |
| 1.7 | 3.4 | GO:0019959 | interleukin-8 binding(GO:0019959) |
| 1.7 | 18.2 | GO:0030369 | ICAM-3 receptor activity(GO:0030369) |
| 1.6 | 4.7 | GO:0047787 | delta4-3-oxosteroid 5beta-reductase activity(GO:0047787) |
| 1.5 | 13.9 | GO:0004024 | alcohol dehydrogenase activity, zinc-dependent(GO:0004024) |
| 1.5 | 7.7 | GO:0048248 | CXCR3 chemokine receptor binding(GO:0048248) |
| 1.5 | 11.8 | GO:0043208 | glycosphingolipid binding(GO:0043208) |
| 1.4 | 7.2 | GO:0003870 | 5-aminolevulinate synthase activity(GO:0003870) N-succinyltransferase activity(GO:0016749) |
| 1.4 | 12.9 | GO:0030883 | lipid antigen binding(GO:0030882) endogenous lipid antigen binding(GO:0030883) exogenous lipid antigen binding(GO:0030884) |
| 1.3 | 5.4 | GO:0033265 | choline binding(GO:0033265) |
| 1.3 | 1.3 | GO:0004031 | aldehyde oxidase activity(GO:0004031) |
| 1.3 | 4.0 | GO:0003692 | left-handed Z-DNA binding(GO:0003692) |
| 1.3 | 5.2 | GO:0005151 | interleukin-1, Type II receptor binding(GO:0005151) |
| 1.3 | 1.3 | GO:0019770 | IgG receptor activity(GO:0019770) |
| 1.2 | 3.6 | GO:0052852 | (S)-2-hydroxy-acid oxidase activity(GO:0003973) very-long-chain-(S)-2-hydroxy-acid oxidase activity(GO:0052852) long-chain-(S)-2-hydroxy-long-chain-acid oxidase activity(GO:0052853) medium-chain-(S)-2-hydroxy-acid oxidase activity(GO:0052854) |
| 1.2 | 1.2 | GO:0038181 | bile acid receptor activity(GO:0038181) |
| 1.2 | 1.2 | GO:0015125 | bile acid transmembrane transporter activity(GO:0015125) |
| 1.1 | 6.8 | GO:1902122 | chenodeoxycholic acid binding(GO:1902122) |
| 1.1 | 4.5 | GO:0030107 | HLA-A specific inhibitory MHC class I receptor activity(GO:0030107) |
| 1.1 | 3.3 | GO:0052871 | tocopherol omega-hydroxylase activity(GO:0052870) alpha-tocopherol omega-hydroxylase activity(GO:0052871) 20-hydroxy-leukotriene B4 omega oxidase activity(GO:0097258) 20-aldehyde-leukotriene B4 20-monooxygenase activity(GO:0097259) |
| 1.1 | 9.9 | GO:0060228 | phosphatidylcholine-sterol O-acyltransferase activator activity(GO:0060228) |
| 1.1 | 3.3 | GO:0015403 | thiamine uptake transmembrane transporter activity(GO:0015403) |
| 1.1 | 1.1 | GO:0019763 | immunoglobulin receptor activity(GO:0019763) |
| 1.1 | 3.2 | GO:0080130 | L-phenylalanine:2-oxoglutarate aminotransferase activity(GO:0080130) |
| 1.1 | 3.2 | GO:0044715 | 8-oxo-dGDP phosphatase activity(GO:0044715) |
| 1.1 | 8.4 | GO:0023029 | MHC class Ib protein binding(GO:0023029) |
| 1.0 | 4.2 | GO:0047946 | glutamine N-acyltransferase activity(GO:0047946) |
| 1.0 | 4.1 | GO:0004088 | carbamoyl-phosphate synthase (ammonia) activity(GO:0004087) carbamoyl-phosphate synthase (glutamine-hydrolyzing) activity(GO:0004088) |
| 1.0 | 10.1 | GO:0019863 | IgE binding(GO:0019863) |
| 1.0 | 3.0 | GO:0042008 | interleukin-18 receptor activity(GO:0042008) |
| 1.0 | 6.9 | GO:0004499 | N,N-dimethylaniline monooxygenase activity(GO:0004499) |
| 1.0 | 65.9 | GO:0034987 | immunoglobulin receptor binding(GO:0034987) |
| 0.9 | 2.8 | GO:0042289 | MHC class II protein binding(GO:0042289) |
| 0.9 | 15.8 | GO:0008391 | arachidonic acid monooxygenase activity(GO:0008391) arachidonic acid epoxygenase activity(GO:0008392) |
| 0.9 | 2.6 | GO:0005174 | CD40 receptor binding(GO:0005174) |
| 0.8 | 7.4 | GO:0070891 | lipoteichoic acid binding(GO:0070891) |
| 0.8 | 2.5 | GO:0004411 | homogentisate 1,2-dioxygenase activity(GO:0004411) |
| 0.8 | 6.5 | GO:0005124 | scavenger receptor binding(GO:0005124) |
| 0.8 | 4.8 | GO:0030197 | extracellular matrix constituent, lubricant activity(GO:0030197) |
| 0.8 | 163.5 | GO:0003823 | antigen binding(GO:0003823) |
| 0.8 | 12.9 | GO:0001730 | 2'-5'-oligoadenylate synthetase activity(GO:0001730) |
| 0.8 | 7.9 | GO:0003835 | beta-galactoside alpha-2,6-sialyltransferase activity(GO:0003835) |
| 0.8 | 2.3 | GO:0001596 | angiotensin type I receptor activity(GO:0001596) |
| 0.8 | 6.2 | GO:0001875 | lipopolysaccharide receptor activity(GO:0001875) |
| 0.8 | 3.1 | GO:0019976 | interleukin-2 receptor activity(GO:0004911) interleukin-2 binding(GO:0019976) |
| 0.7 | 1.5 | GO:0030881 | beta-2-microglobulin binding(GO:0030881) |
| 0.7 | 6.0 | GO:0004974 | leukotriene receptor activity(GO:0004974) |
| 0.7 | 2.2 | GO:0004119 | cGMP-inhibited cyclic-nucleotide phosphodiesterase activity(GO:0004119) |
| 0.7 | 5.1 | GO:0050294 | steroid sulfotransferase activity(GO:0050294) |
| 0.7 | 2.9 | GO:0030395 | lactose binding(GO:0030395) |
| 0.7 | 2.9 | GO:1902271 | D3 vitamins binding(GO:1902271) |
| 0.7 | 5.0 | GO:0097199 | cysteine-type endopeptidase activity involved in apoptotic signaling pathway(GO:0097199) |
| 0.7 | 3.5 | GO:0070180 | large ribosomal subunit rRNA binding(GO:0070180) |
| 0.7 | 2.8 | GO:0047006 | 17-alpha,20-alpha-dihydroxypregn-4-en-3-one dehydrogenase activity(GO:0047006) |
| 0.7 | 2.0 | GO:0052816 | medium-chain acyl-CoA hydrolase activity(GO:0052815) long-chain acyl-CoA hydrolase activity(GO:0052816) |
| 0.7 | 7.3 | GO:0016494 | C-X-C chemokine receptor activity(GO:0016494) |
| 0.7 | 4.0 | GO:0030377 | urokinase plasminogen activator receptor activity(GO:0030377) |
| 0.7 | 2.6 | GO:0035501 | MH1 domain binding(GO:0035501) |
| 0.7 | 2.0 | GO:0071723 | lipopeptide binding(GO:0071723) |
| 0.6 | 1.9 | GO:0004878 | complement component C5a receptor activity(GO:0004878) |
| 0.6 | 1.9 | GO:0016517 | interleukin-12 receptor activity(GO:0016517) |
| 0.6 | 4.5 | GO:0032395 | MHC class II receptor activity(GO:0032395) |
| 0.6 | 1.9 | GO:0004613 | phosphoenolpyruvate carboxykinase activity(GO:0004611) phosphoenolpyruvate carboxykinase (GTP) activity(GO:0004613) |
| 0.6 | 0.6 | GO:0031893 | vasopressin receptor binding(GO:0031893) |
| 0.6 | 3.1 | GO:0015254 | glycerol channel activity(GO:0015254) |
| 0.6 | 7.5 | GO:0046625 | sphingolipid binding(GO:0046625) |
| 0.6 | 3.1 | GO:0016404 | 15-hydroxyprostaglandin dehydrogenase (NAD+) activity(GO:0016404) |
| 0.6 | 14.3 | GO:0042288 | MHC class I protein binding(GO:0042288) |
| 0.6 | 1.8 | GO:0004165 | dodecenoyl-CoA delta-isomerase activity(GO:0004165) |
| 0.6 | 1.8 | GO:0017098 | sulfonylurea receptor binding(GO:0017098) |
| 0.6 | 6.6 | GO:0045236 | CXCR chemokine receptor binding(GO:0045236) |
| 0.6 | 11.9 | GO:0005537 | mannose binding(GO:0005537) |
| 0.6 | 4.8 | GO:0001849 | complement component C1q binding(GO:0001849) |
| 0.6 | 2.3 | GO:1901375 | acetylcholine transmembrane transporter activity(GO:0005277) acetate ester transmembrane transporter activity(GO:1901375) |
| 0.6 | 1.7 | GO:0004060 | arylamine N-acetyltransferase activity(GO:0004060) |
| 0.6 | 1.7 | GO:0004051 | arachidonate 5-lipoxygenase activity(GO:0004051) |
| 0.6 | 1.1 | GO:0047086 | phenanthrene 9,10-monooxygenase activity(GO:0018636) ketosteroid monooxygenase activity(GO:0047086) |
| 0.6 | 9.0 | GO:0038187 | signaling pattern recognition receptor activity(GO:0008329) pattern recognition receptor activity(GO:0038187) |
| 0.6 | 1.7 | GO:0008670 | 2,4-dienoyl-CoA reductase (NADPH) activity(GO:0008670) |
| 0.6 | 4.5 | GO:0032052 | bile acid binding(GO:0032052) |
| 0.6 | 1.1 | GO:0015234 | thiamine transmembrane transporter activity(GO:0015234) |
| 0.6 | 2.8 | GO:0052798 | beta-galactoside alpha-2,3-sialyltransferase activity(GO:0052798) |
| 0.6 | 28.7 | GO:0015020 | glucuronosyltransferase activity(GO:0015020) |
| 0.5 | 2.7 | GO:0033300 | dehydroascorbic acid transporter activity(GO:0033300) |
| 0.5 | 1.6 | GO:0005152 | interleukin-1 receptor antagonist activity(GO:0005152) |
| 0.5 | 1.6 | GO:0004145 | diamine N-acetyltransferase activity(GO:0004145) polyamine binding(GO:0019808) |
| 0.5 | 4.7 | GO:0019834 | phospholipase A2 inhibitor activity(GO:0019834) |
| 0.5 | 3.1 | GO:0008453 | alanine-glyoxylate transaminase activity(GO:0008453) |
| 0.5 | 1.5 | GO:0034188 | apolipoprotein A-I receptor activity(GO:0034188) phosphatidylserine-translocating ATPase activity(GO:0090556) |
| 0.5 | 8.1 | GO:0042608 | T cell receptor binding(GO:0042608) |
| 0.5 | 0.5 | GO:0031727 | CCR2 chemokine receptor binding(GO:0031727) |
| 0.5 | 2.5 | GO:0004914 | interleukin-5 receptor activity(GO:0004914) |
| 0.5 | 1.5 | GO:0036479 | GTP-dependent protein kinase activity(GO:0034211) peroxidase inhibitor activity(GO:0036479) |
| 0.5 | 2.4 | GO:0031726 | CCR1 chemokine receptor binding(GO:0031726) |
| 0.5 | 1.9 | GO:0038047 | beta-endorphin receptor activity(GO:0004979) morphine receptor activity(GO:0038047) |
| 0.5 | 7.2 | GO:0004321 | fatty-acyl-CoA synthase activity(GO:0004321) |
| 0.5 | 3.4 | GO:0003827 | alpha-1,3-mannosylglycoprotein 2-beta-N-acetylglucosaminyltransferase activity(GO:0003827) |
| 0.5 | 1.4 | GO:0097689 | iron channel activity(GO:0097689) |
| 0.5 | 2.8 | GO:0047961 | glycine N-acyltransferase activity(GO:0047961) |
| 0.5 | 8.5 | GO:0004062 | aryl sulfotransferase activity(GO:0004062) |
| 0.5 | 1.4 | GO:0042947 | glucoside transmembrane transporter activity(GO:0042947) |
| 0.5 | 2.3 | GO:0047844 | deoxycytidine deaminase activity(GO:0047844) |
| 0.5 | 3.7 | GO:0005134 | interleukin-2 receptor binding(GO:0005134) |
| 0.5 | 4.6 | GO:0047498 | calcium-dependent phospholipase A2 activity(GO:0047498) |
| 0.5 | 0.5 | GO:0015563 | uptake transmembrane transporter activity(GO:0015563) |
| 0.5 | 4.6 | GO:0005094 | Rho GDP-dissociation inhibitor activity(GO:0005094) |
| 0.5 | 1.8 | GO:0090554 | phosphatidylcholine-translocating ATPase activity(GO:0090554) |
| 0.4 | 7.6 | GO:0019865 | immunoglobulin binding(GO:0019865) |
| 0.4 | 4.0 | GO:0008109 | N-acetyllactosaminide beta-1,6-N-acetylglucosaminyltransferase activity(GO:0008109) |
| 0.4 | 9.7 | GO:0016493 | C-C chemokine receptor activity(GO:0016493) |
| 0.4 | 1.3 | GO:0016154 | thymidine phosphorylase activity(GO:0009032) pyrimidine-nucleoside phosphorylase activity(GO:0016154) |
| 0.4 | 2.2 | GO:0016822 | hydrolase activity, acting on acid carbon-carbon bonds(GO:0016822) hydrolase activity, acting on acid carbon-carbon bonds, in ketonic substances(GO:0016823) |
| 0.4 | 1.8 | GO:0005275 | amine transmembrane transporter activity(GO:0005275) |
| 0.4 | 2.6 | GO:0004833 | tryptophan 2,3-dioxygenase activity(GO:0004833) |
| 0.4 | 1.3 | GO:0017129 | triglyceride binding(GO:0017129) |
| 0.4 | 1.7 | GO:0005477 | pyruvate secondary active transmembrane transporter activity(GO:0005477) |
| 0.4 | 3.9 | GO:0008269 | JAK pathway signal transduction adaptor activity(GO:0008269) |
| 0.4 | 3.0 | GO:0019826 | oxygen sensor activity(GO:0019826) |
| 0.4 | 3.0 | GO:0016841 | ammonia-lyase activity(GO:0016841) |
| 0.4 | 3.4 | GO:0032393 | MHC class I receptor activity(GO:0032393) |
| 0.4 | 1.7 | GO:0005011 | macrophage colony-stimulating factor receptor activity(GO:0005011) |
| 0.4 | 1.7 | GO:0032560 | dGTPase activity(GO:0008832) triphosphoric monoester hydrolase activity(GO:0016793) guanyl deoxyribonucleotide binding(GO:0032560) dGTP binding(GO:0032567) |
| 0.4 | 0.4 | GO:0004069 | L-aspartate:2-oxoglutarate aminotransferase activity(GO:0004069) |
| 0.4 | 5.8 | GO:0035005 | 1-phosphatidylinositol-4-phosphate 3-kinase activity(GO:0035005) |
| 0.4 | 1.2 | GO:0008761 | UDP-N-acetylglucosamine 2-epimerase activity(GO:0008761) N-acylmannosamine kinase activity(GO:0009384) |
| 0.4 | 1.6 | GO:0031731 | CCR6 chemokine receptor binding(GO:0031731) |
| 0.4 | 7.3 | GO:0003796 | lysozyme activity(GO:0003796) |
| 0.4 | 4.0 | GO:0004064 | arylesterase activity(GO:0004064) |
| 0.4 | 3.2 | GO:0004875 | complement receptor activity(GO:0004875) |
| 0.4 | 4.4 | GO:0046703 | natural killer cell lectin-like receptor binding(GO:0046703) |
| 0.4 | 2.0 | GO:0004392 | heme oxygenase (decyclizing) activity(GO:0004392) |
| 0.4 | 1.6 | GO:0045569 | TRAIL binding(GO:0045569) |
| 0.4 | 1.6 | GO:0008177 | succinate dehydrogenase (ubiquinone) activity(GO:0008177) |
| 0.4 | 64.0 | GO:0004867 | serine-type endopeptidase inhibitor activity(GO:0004867) |
| 0.4 | 0.8 | GO:0044729 | hemi-methylated DNA-binding(GO:0044729) |
| 0.4 | 1.2 | GO:0004796 | thromboxane-A synthase activity(GO:0004796) 12-hydroxyheptadecatrienoic acid synthase activity(GO:0036134) |
| 0.4 | 13.3 | GO:0008009 | chemokine activity(GO:0008009) |
| 0.4 | 1.5 | GO:0008431 | vitamin E binding(GO:0008431) |
| 0.4 | 5.5 | GO:0015232 | heme transporter activity(GO:0015232) |
| 0.4 | 5.2 | GO:0051525 | NFAT protein binding(GO:0051525) |
| 0.4 | 10.6 | GO:0005068 | transmembrane receptor protein tyrosine kinase adaptor activity(GO:0005068) |
| 0.4 | 1.8 | GO:0003938 | IMP dehydrogenase activity(GO:0003938) |
| 0.4 | 1.1 | GO:0016603 | glutaminyl-peptide cyclotransferase activity(GO:0016603) |
| 0.4 | 1.1 | GO:0061505 | DNA topoisomerase type II (ATP-hydrolyzing) activity(GO:0003918) DNA topoisomerase II activity(GO:0061505) |
| 0.4 | 1.1 | GO:0008900 | hydrogen:potassium-exchanging ATPase activity(GO:0008900) |
| 0.4 | 1.4 | GO:0016495 | C-X3-C chemokine receptor activity(GO:0016495) |
| 0.4 | 1.4 | GO:0070119 | ciliary neurotrophic factor binding(GO:0070119) |
| 0.4 | 2.1 | GO:0017161 | phosphatidylinositol-3,4-bisphosphate 4-phosphatase activity(GO:0016316) inositol-1,3,4-trisphosphate 4-phosphatase activity(GO:0017161) phosphatidylinositol-4,5-bisphosphate 4-phosphatase activity(GO:0034597) inositol-3,4-bisphosphate 4-phosphatase activity(GO:0052828) |
| 0.4 | 1.1 | GO:0008480 | sarcosine dehydrogenase activity(GO:0008480) |
| 0.4 | 1.1 | GO:0004574 | oligo-1,6-glucosidase activity(GO:0004574) |
| 0.4 | 2.5 | GO:0016936 | galactoside binding(GO:0016936) |
| 0.4 | 1.1 | GO:0033981 | D-dopachrome decarboxylase activity(GO:0033981) |
| 0.4 | 4.6 | GO:0016174 | NAD(P)H oxidase activity(GO:0016174) |
| 0.3 | 13.3 | GO:0019825 | oxygen binding(GO:0019825) |
| 0.3 | 3.5 | GO:0004720 | protein-lysine 6-oxidase activity(GO:0004720) |
| 0.3 | 1.4 | GO:0015222 | serotonin transmembrane transporter activity(GO:0015222) |
| 0.3 | 1.7 | GO:0004464 | leukotriene-C4 synthase activity(GO:0004464) |
| 0.3 | 1.0 | GO:0015432 | bile acid-exporting ATPase activity(GO:0015432) |
| 0.3 | 2.1 | GO:0015562 | efflux transmembrane transporter activity(GO:0015562) |
| 0.3 | 2.0 | GO:0030298 | receptor signaling protein tyrosine kinase activator activity(GO:0030298) |
| 0.3 | 1.0 | GO:1990698 | palmitoleoyltransferase activity(GO:1990698) |
| 0.3 | 6.4 | GO:0050664 | superoxide-generating NADPH oxidase activity(GO:0016175) oxidoreductase activity, acting on NAD(P)H, oxygen as acceptor(GO:0050664) |
| 0.3 | 2.0 | GO:0004505 | phenylalanine 4-monooxygenase activity(GO:0004505) |
| 0.3 | 1.7 | GO:0005138 | interleukin-6 receptor binding(GO:0005138) |
| 0.3 | 1.0 | GO:0001851 | complement component C3b binding(GO:0001851) |
| 0.3 | 1.7 | GO:0016297 | oleoyl-[acyl-carrier-protein] hydrolase activity(GO:0004320) myristoyl-[acyl-carrier-protein] hydrolase activity(GO:0016295) palmitoyl-[acyl-carrier-protein] hydrolase activity(GO:0016296) acyl-[acyl-carrier-protein] hydrolase activity(GO:0016297) |
| 0.3 | 3.0 | GO:0035662 | Toll-like receptor 4 binding(GO:0035662) |
| 0.3 | 14.9 | GO:0042056 | chemoattractant activity(GO:0042056) |
| 0.3 | 0.3 | GO:0000104 | succinate dehydrogenase activity(GO:0000104) |
| 0.3 | 1.6 | GO:0005333 | norepinephrine transmembrane transporter activity(GO:0005333) |
| 0.3 | 1.0 | GO:0004743 | pyruvate kinase activity(GO:0004743) |
| 0.3 | 2.0 | GO:0004882 | androgen receptor activity(GO:0004882) |
| 0.3 | 4.2 | GO:0008142 | oxysterol binding(GO:0008142) |
| 0.3 | 1.0 | GO:0004531 | deoxyribonuclease II activity(GO:0004531) |
| 0.3 | 0.3 | GO:0047238 | glucuronosyl-N-acetylgalactosaminyl-proteoglycan 4-beta-N-acetylgalactosaminyltransferase activity(GO:0047238) |
| 0.3 | 6.1 | GO:0050700 | CARD domain binding(GO:0050700) |
| 0.3 | 3.2 | GO:0001637 | G-protein coupled chemoattractant receptor activity(GO:0001637) chemokine receptor activity(GO:0004950) |
| 0.3 | 0.9 | GO:0004998 | transferrin receptor activity(GO:0004998) |
| 0.3 | 2.5 | GO:0051033 | nucleic acid transmembrane transporter activity(GO:0051032) RNA transmembrane transporter activity(GO:0051033) |
| 0.3 | 0.9 | GO:0042834 | peptidoglycan binding(GO:0042834) |
| 0.3 | 0.9 | GO:0002054 | nucleobase binding(GO:0002054) |
| 0.3 | 1.6 | GO:0047280 | nicotinamide phosphoribosyltransferase activity(GO:0047280) |
| 0.3 | 1.2 | GO:0047977 | hepoxilin-epoxide hydrolase activity(GO:0047977) |
| 0.3 | 5.5 | GO:0042609 | CD4 receptor binding(GO:0042609) |
| 0.3 | 1.2 | GO:0043273 | CTPase activity(GO:0043273) |
| 0.3 | 14.1 | GO:0005164 | tumor necrosis factor receptor binding(GO:0005164) |
| 0.3 | 0.9 | GO:0004008 | copper-exporting ATPase activity(GO:0004008) copper-transporting ATPase activity(GO:0043682) |
| 0.3 | 1.8 | GO:0043120 | tumor necrosis factor binding(GO:0043120) |
| 0.3 | 0.6 | GO:0004618 | phosphoglycerate kinase activity(GO:0004618) |
| 0.3 | 8.7 | GO:0070006 | metalloaminopeptidase activity(GO:0070006) |
| 0.3 | 3.3 | GO:0031685 | adenosine receptor binding(GO:0031685) |
| 0.3 | 4.4 | GO:0004579 | dolichyl-diphosphooligosaccharide-protein glycotransferase activity(GO:0004579) |
| 0.3 | 0.9 | GO:0052739 | phosphatidylserine 1-acylhydrolase activity(GO:0052739) |
| 0.3 | 1.2 | GO:0042132 | fructose 1,6-bisphosphate 1-phosphatase activity(GO:0042132) |
| 0.3 | 0.9 | GO:0016401 | palmitoyl-CoA oxidase activity(GO:0016401) |
| 0.3 | 1.2 | GO:0051431 | corticotropin-releasing hormone receptor 2 binding(GO:0051431) |
| 0.3 | 0.6 | GO:0004906 | interferon-gamma receptor activity(GO:0004906) |
| 0.3 | 1.4 | GO:0052593 | tryptamine:oxygen oxidoreductase (deaminating) activity(GO:0052593) aminoacetone:oxygen oxidoreductase(deaminating) activity(GO:0052594) aliphatic-amine oxidase activity(GO:0052595) phenethylamine:oxygen oxidoreductase (deaminating) activity(GO:0052596) |
| 0.3 | 1.2 | GO:0034736 | sterol O-acyltransferase activity(GO:0004772) cholesterol O-acyltransferase activity(GO:0034736) |
| 0.3 | 9.5 | GO:0005095 | GTPase inhibitor activity(GO:0005095) |
| 0.3 | 1.4 | GO:0070051 | fibrinogen binding(GO:0070051) |
| 0.3 | 2.0 | GO:0004035 | alkaline phosphatase activity(GO:0004035) |
| 0.3 | 0.9 | GO:0005046 | KDEL sequence binding(GO:0005046) |
| 0.3 | 0.6 | GO:0016165 | linoleate 13S-lipoxygenase activity(GO:0016165) |
| 0.3 | 1.1 | GO:0005148 | prolactin receptor binding(GO:0005148) |
| 0.3 | 0.8 | GO:0004339 | glucan 1,4-alpha-glucosidase activity(GO:0004339) |
| 0.3 | 0.8 | GO:0042007 | interleukin-18 binding(GO:0042007) |
| 0.3 | 0.8 | GO:0015227 | acyl carnitine transmembrane transporter activity(GO:0015227) |
| 0.3 | 0.6 | GO:0016890 | site-specific endodeoxyribonuclease activity, specific for altered base(GO:0016890) |
| 0.3 | 1.7 | GO:0034191 | apolipoprotein A-I receptor binding(GO:0034191) |
| 0.3 | 2.2 | GO:0031849 | olfactory receptor binding(GO:0031849) |
| 0.3 | 1.1 | GO:0016712 | oxidoreductase activity, acting on paired donors, with incorporation or reduction of molecular oxygen, reduced flavin or flavoprotein as one donor, and incorporation of one atom of oxygen(GO:0016712) |
| 0.3 | 0.8 | GO:0005137 | interleukin-5 receptor binding(GO:0005137) |
| 0.3 | 0.5 | GO:0070644 | vitamin D response element binding(GO:0070644) |
| 0.3 | 0.8 | GO:0016263 | glycoprotein-N-acetylgalactosamine 3-beta-galactosyltransferase activity(GO:0016263) |
| 0.3 | 2.7 | GO:0030292 | protein tyrosine kinase inhibitor activity(GO:0030292) |
| 0.3 | 1.1 | GO:0070224 | sulfide:quinone oxidoreductase activity(GO:0070224) |
| 0.3 | 1.3 | GO:0047374 | methylumbelliferyl-acetate deacetylase activity(GO:0047374) |
| 0.3 | 0.8 | GO:0035651 | AP-3 adaptor complex binding(GO:0035651) |
| 0.3 | 1.0 | GO:0017057 | 6-phosphogluconolactonase activity(GO:0017057) |
| 0.3 | 1.0 | GO:0000033 | alpha-1,3-mannosyltransferase activity(GO:0000033) |
| 0.3 | 1.0 | GO:0004307 | ethanolaminephosphotransferase activity(GO:0004307) |
| 0.3 | 0.8 | GO:0051990 | isocitrate dehydrogenase (NADP+) activity(GO:0004450) (R)-2-hydroxyglutarate dehydrogenase activity(GO:0051990) |
| 0.3 | 1.5 | GO:0001602 | pancreatic polypeptide receptor activity(GO:0001602) |
| 0.3 | 14.3 | GO:0043027 | cysteine-type endopeptidase inhibitor activity involved in apoptotic process(GO:0043027) |
| 0.3 | 2.0 | GO:0030345 | extracellular matrix structural constituent conferring compression resistance(GO:0030021) structural constituent of tooth enamel(GO:0030345) |
| 0.3 | 2.0 | GO:0005497 | androgen binding(GO:0005497) |
| 0.3 | 0.8 | GO:0005139 | interleukin-7 receptor binding(GO:0005139) |
| 0.3 | 5.3 | GO:0008320 | protein transmembrane transporter activity(GO:0008320) |
| 0.2 | 0.2 | GO:0016211 | glutamate-ammonia ligase activity(GO:0004356) ammonia ligase activity(GO:0016211) acid-ammonia (or amide) ligase activity(GO:0016880) |
| 0.2 | 3.2 | GO:0097371 | MDM2/MDM4 family protein binding(GO:0097371) |
| 0.2 | 1.0 | GO:0016784 | 3-mercaptopyruvate sulfurtransferase activity(GO:0016784) |
| 0.2 | 1.7 | GO:0004126 | cytidine deaminase activity(GO:0004126) |
| 0.2 | 1.7 | GO:0050659 | N-acetylgalactosamine 4-sulfate 6-O-sulfotransferase activity(GO:0050659) |
| 0.2 | 6.9 | GO:0004185 | serine-type carboxypeptidase activity(GO:0004185) |
| 0.2 | 3.9 | GO:0008199 | ferric iron binding(GO:0008199) |
| 0.2 | 2.2 | GO:1990948 | ligase inhibitor activity(GO:0055104) ubiquitin ligase inhibitor activity(GO:1990948) |
| 0.2 | 1.2 | GO:0001069 | regulatory region RNA binding(GO:0001069) |
| 0.2 | 1.7 | GO:0038052 | RNA polymerase II transcription factor activity, estrogen-activated sequence-specific DNA binding(GO:0038052) |
| 0.2 | 1.2 | GO:0032767 | copper-dependent protein binding(GO:0032767) |
| 0.2 | 2.7 | GO:0016725 | oxidoreductase activity, acting on CH or CH2 groups(GO:0016725) |
| 0.2 | 0.7 | GO:0030272 | 5-formyltetrahydrofolate cyclo-ligase activity(GO:0030272) |
| 0.2 | 7.2 | GO:0045125 | bioactive lipid receptor activity(GO:0045125) |
| 0.2 | 0.7 | GO:0036487 | nitric-oxide synthase inhibitor activity(GO:0036487) |
| 0.2 | 0.5 | GO:0004096 | catalase activity(GO:0004096) |
| 0.2 | 0.2 | GO:0001601 | peptide YY receptor activity(GO:0001601) |
| 0.2 | 0.9 | GO:0035800 | deubiquitinase activator activity(GO:0035800) |
| 0.2 | 3.3 | GO:0001591 | dopamine neurotransmitter receptor activity, coupled via Gi/Go(GO:0001591) |
| 0.2 | 2.1 | GO:0015057 | thrombin receptor activity(GO:0015057) |
| 0.2 | 0.7 | GO:1990932 | 5.8S rRNA binding(GO:1990932) |
| 0.2 | 0.5 | GO:0043183 | vascular endothelial growth factor receptor 1 binding(GO:0043183) |
| 0.2 | 55.2 | GO:0003735 | structural constituent of ribosome(GO:0003735) |
| 0.2 | 3.2 | GO:0015143 | urate transmembrane transporter activity(GO:0015143) salt transmembrane transporter activity(GO:1901702) |
| 0.2 | 0.9 | GO:0016882 | cyclo-ligase activity(GO:0016882) |
| 0.2 | 2.1 | GO:0003846 | 2-acylglycerol O-acyltransferase activity(GO:0003846) |
| 0.2 | 0.2 | GO:0048030 | disaccharide binding(GO:0048030) |
| 0.2 | 1.6 | GO:0004609 | phosphatidylserine decarboxylase activity(GO:0004609) |
| 0.2 | 0.7 | GO:0005519 | cytoskeletal regulatory protein binding(GO:0005519) |
| 0.2 | 3.4 | GO:0000774 | adenyl-nucleotide exchange factor activity(GO:0000774) |
| 0.2 | 0.7 | GO:0003878 | ATP citrate synthase activity(GO:0003878) |
| 0.2 | 2.7 | GO:0070492 | oligosaccharide binding(GO:0070492) |
| 0.2 | 0.9 | GO:0004102 | choline O-acetyltransferase activity(GO:0004102) |
| 0.2 | 4.0 | GO:0001530 | lipopolysaccharide binding(GO:0001530) |
| 0.2 | 0.7 | GO:0003845 | 11-beta-hydroxysteroid dehydrogenase [NAD(P)] activity(GO:0003845) |
| 0.2 | 0.9 | GO:0004905 | type I interferon receptor activity(GO:0004905) |
| 0.2 | 2.0 | GO:0004699 | calcium-independent protein kinase C activity(GO:0004699) |
| 0.2 | 1.5 | GO:0002114 | interleukin-33 receptor activity(GO:0002114) |
| 0.2 | 0.9 | GO:0004963 | follicle-stimulating hormone receptor activity(GO:0004963) |
| 0.2 | 1.1 | GO:0035575 | histone demethylase activity (H4-K20 specific)(GO:0035575) |
| 0.2 | 0.9 | GO:0004949 | cannabinoid receptor activity(GO:0004949) |
| 0.2 | 0.9 | GO:0005459 | UDP-galactose transmembrane transporter activity(GO:0005459) |
| 0.2 | 0.6 | GO:0016005 | phospholipase A2 activator activity(GO:0016005) |
| 0.2 | 6.6 | GO:0004602 | glutathione peroxidase activity(GO:0004602) |
| 0.2 | 1.1 | GO:0033829 | O-fucosylpeptide 3-beta-N-acetylglucosaminyltransferase activity(GO:0033829) |
| 0.2 | 6.4 | GO:0004298 | threonine-type endopeptidase activity(GO:0004298) threonine-type peptidase activity(GO:0070003) |
| 0.2 | 0.8 | GO:0016262 | protein N-acetylglucosaminyltransferase activity(GO:0016262) |
| 0.2 | 1.1 | GO:0046624 | sphingolipid transporter activity(GO:0046624) |
| 0.2 | 9.3 | GO:0005540 | hyaluronic acid binding(GO:0005540) |
| 0.2 | 4.2 | GO:0004745 | retinol dehydrogenase activity(GO:0004745) |
| 0.2 | 3.5 | GO:0043225 | anion transmembrane-transporting ATPase activity(GO:0043225) |
| 0.2 | 1.7 | GO:0004468 | lysine N-acetyltransferase activity, acting on acetyl phosphate as donor(GO:0004468) |
| 0.2 | 1.7 | GO:0051425 | PTB domain binding(GO:0051425) |
| 0.2 | 0.6 | GO:0033858 | N-acetylgalactosamine kinase activity(GO:0033858) |
| 0.2 | 0.2 | GO:0016748 | succinyltransferase activity(GO:0016748) |
| 0.2 | 0.6 | GO:0043739 | G/U mismatch-specific uracil-DNA glycosylase activity(GO:0043739) |
| 0.2 | 3.9 | GO:0015929 | hexosaminidase activity(GO:0015929) |
| 0.2 | 0.6 | GO:1990190 | peptide-glutamate-N-acetyltransferase activity(GO:1990190) |
| 0.2 | 0.8 | GO:0002046 | opsin binding(GO:0002046) |
| 0.2 | 0.8 | GO:0071885 | N-terminal protein N-methyltransferase activity(GO:0071885) |
| 0.2 | 1.8 | GO:0047134 | protein-disulfide reductase activity(GO:0047134) |
| 0.2 | 3.2 | GO:0005021 | vascular endothelial growth factor-activated receptor activity(GO:0005021) |
| 0.2 | 1.2 | GO:0034647 | histone demethylase activity (H3-trimethyl-K4 specific)(GO:0034647) |
| 0.2 | 1.2 | GO:0004677 | DNA-dependent protein kinase activity(GO:0004677) |
| 0.2 | 1.0 | GO:0046404 | ATP-dependent polydeoxyribonucleotide 5'-hydroxyl-kinase activity(GO:0046404) polydeoxyribonucleotide kinase activity(GO:0051733) ATP-dependent polynucleotide kinase activity(GO:0051734) |
| 0.2 | 0.6 | GO:0008859 | exoribonuclease II activity(GO:0008859) |
| 0.2 | 1.4 | GO:0004920 | interleukin-10 receptor activity(GO:0004920) |
| 0.2 | 0.6 | GO:0017116 | single-stranded DNA-dependent ATP-dependent DNA helicase activity(GO:0017116) |
| 0.2 | 0.2 | GO:0008311 | double-stranded DNA 3'-5' exodeoxyribonuclease activity(GO:0008311) |
| 0.2 | 1.0 | GO:0004466 | long-chain-acyl-CoA dehydrogenase activity(GO:0004466) |
| 0.2 | 0.8 | GO:0036042 | long-chain fatty acyl-CoA binding(GO:0036042) |
| 0.2 | 1.3 | GO:0008523 | sodium-dependent multivitamin transmembrane transporter activity(GO:0008523) |
| 0.2 | 2.1 | GO:0004931 | extracellular ATP-gated cation channel activity(GO:0004931) ATP-gated ion channel activity(GO:0035381) |
| 0.2 | 1.1 | GO:0003983 | UTP:glucose-1-phosphate uridylyltransferase activity(GO:0003983) UTP-monosaccharide-1-phosphate uridylyltransferase activity(GO:0051748) |
| 0.2 | 0.7 | GO:0045145 | single-stranded DNA 5'-3' exodeoxyribonuclease activity(GO:0045145) |
| 0.2 | 0.7 | GO:0070095 | fructose-6-phosphate binding(GO:0070095) |
| 0.2 | 1.8 | GO:0015016 | [heparan sulfate]-glucosamine N-sulfotransferase activity(GO:0015016) |
| 0.2 | 0.9 | GO:0047757 | chondroitin-glucuronate 5-epimerase activity(GO:0047757) |
| 0.2 | 0.7 | GO:0030375 | thyroid hormone receptor activator activity(GO:0010861) thyroid hormone receptor coactivator activity(GO:0030375) |
| 0.2 | 2.2 | GO:0004568 | chitinase activity(GO:0004568) |
| 0.2 | 6.2 | GO:0005159 | insulin-like growth factor receptor binding(GO:0005159) |
| 0.2 | 0.7 | GO:0030171 | voltage-gated proton channel activity(GO:0030171) |
| 0.2 | 0.7 | GO:0003953 | NAD+ nucleosidase activity(GO:0003953) |
| 0.2 | 0.5 | GO:0004961 | thromboxane receptor activity(GO:0004960) thromboxane A2 receptor activity(GO:0004961) |
| 0.2 | 1.3 | GO:0090599 | alpha-glucosidase activity(GO:0090599) |
| 0.2 | 0.2 | GO:0008401 | retinoic acid 4-hydroxylase activity(GO:0008401) |
| 0.2 | 0.4 | GO:0042020 | interleukin-23 binding(GO:0042019) interleukin-23 receptor activity(GO:0042020) |
| 0.2 | 0.7 | GO:0016314 | phosphatidylinositol-3,4,5-trisphosphate 3-phosphatase activity(GO:0016314) phosphatidylinositol-3,4-bisphosphate 3-phosphatase activity(GO:0051800) |
| 0.2 | 0.7 | GO:0004382 | guanosine-diphosphatase activity(GO:0004382) |
| 0.2 | 0.7 | GO:0032406 | MutLbeta complex binding(GO:0032406) MutSbeta complex binding(GO:0032408) |
| 0.2 | 1.2 | GO:0004957 | prostaglandin E receptor activity(GO:0004957) |
| 0.2 | 2.3 | GO:0022850 | serotonin-gated cation channel activity(GO:0022850) |
| 0.2 | 1.4 | GO:0032810 | sterol response element binding(GO:0032810) |
| 0.2 | 49.6 | GO:0004252 | serine-type endopeptidase activity(GO:0004252) |
| 0.2 | 1.0 | GO:0019960 | C-X3-C chemokine binding(GO:0019960) |
| 0.2 | 11.7 | GO:0005547 | phosphatidylinositol-3,4,5-trisphosphate binding(GO:0005547) |
| 0.2 | 0.7 | GO:0001595 | angiotensin receptor activity(GO:0001595) angiotensin type II receptor activity(GO:0004945) |
| 0.2 | 0.7 | GO:0010736 | serum response element binding(GO:0010736) |
| 0.2 | 0.3 | GO:0031716 | calcitonin receptor binding(GO:0031716) |
| 0.2 | 0.7 | GO:0050253 | retinyl-palmitate esterase activity(GO:0050253) |
| 0.2 | 2.2 | GO:0004985 | opioid receptor activity(GO:0004985) |
| 0.2 | 0.5 | GO:0016649 | electron-transferring-flavoprotein dehydrogenase activity(GO:0004174) oxidoreductase activity, acting on the CH-NH group of donors, quinone or similar compound as acceptor(GO:0016649) |
| 0.2 | 0.5 | GO:0004483 | mRNA (nucleoside-2'-O-)-methyltransferase activity(GO:0004483) |
| 0.2 | 0.5 | GO:0097677 | STAT family protein binding(GO:0097677) |
| 0.2 | 2.0 | GO:0004969 | histamine receptor activity(GO:0004969) |
| 0.2 | 1.3 | GO:0008048 | calcium sensitive guanylate cyclase activator activity(GO:0008048) |
| 0.2 | 2.1 | GO:0050692 | DBD domain binding(GO:0050692) |
| 0.2 | 0.5 | GO:0030617 | transforming growth factor beta receptor, inhibitory cytoplasmic mediator activity(GO:0030617) |
| 0.2 | 1.1 | GO:0008508 | bile acid:sodium symporter activity(GO:0008508) |
| 0.2 | 0.5 | GO:0047389 | glycerophosphocholine phosphodiesterase activity(GO:0047389) |
| 0.2 | 0.8 | GO:0047756 | chondroitin 4-sulfotransferase activity(GO:0047756) |
| 0.2 | 1.3 | GO:0060698 | endoribonuclease inhibitor activity(GO:0060698) |
| 0.2 | 0.3 | GO:0004948 | calcitonin receptor activity(GO:0004948) |
| 0.2 | 0.6 | GO:0035671 | enone reductase activity(GO:0035671) |
| 0.2 | 0.6 | GO:0004001 | adenosine kinase activity(GO:0004001) |
| 0.2 | 1.4 | GO:0015926 | glucosidase activity(GO:0015926) |
| 0.2 | 3.8 | GO:0005044 | scavenger receptor activity(GO:0005044) |
| 0.2 | 0.6 | GO:0051765 | inositol tetrakisphosphate kinase activity(GO:0051765) |
| 0.2 | 0.8 | GO:0043891 | glyceraldehyde-3-phosphate dehydrogenase (NAD+) (phosphorylating) activity(GO:0004365) glyceraldehyde-3-phosphate dehydrogenase (NAD(P)+) (phosphorylating) activity(GO:0043891) |
| 0.2 | 1.3 | GO:0070700 | BMP receptor binding(GO:0070700) |
| 0.2 | 0.3 | GO:0016715 | oxidoreductase activity, acting on paired donors, with incorporation or reduction of molecular oxygen, reduced ascorbate as one donor, and incorporation of one atom of oxygen(GO:0016715) |
| 0.2 | 1.4 | GO:0004704 | NF-kappaB-inducing kinase activity(GO:0004704) |
| 0.2 | 6.5 | GO:0004869 | cysteine-type endopeptidase inhibitor activity(GO:0004869) |
| 0.2 | 4.0 | GO:0048027 | mRNA 5'-UTR binding(GO:0048027) |
| 0.2 | 5.6 | GO:0003887 | DNA-directed DNA polymerase activity(GO:0003887) |
| 0.2 | 1.1 | GO:0004366 | glycerol-3-phosphate O-acyltransferase activity(GO:0004366) |
| 0.2 | 1.1 | GO:0003987 | acetate-CoA ligase activity(GO:0003987) |
| 0.2 | 1.5 | GO:0017150 | tRNA dihydrouridine synthase activity(GO:0017150) |
| 0.1 | 1.0 | GO:0008525 | phosphatidylcholine transporter activity(GO:0008525) |
| 0.1 | 0.7 | GO:0008073 | ornithine decarboxylase inhibitor activity(GO:0008073) |
| 0.1 | 0.9 | GO:0050693 | LBD domain binding(GO:0050693) |
| 0.1 | 0.7 | GO:0035325 | Toll-like receptor binding(GO:0035325) |
| 0.1 | 0.7 | GO:0035473 | lipase binding(GO:0035473) |
| 0.1 | 1.0 | GO:0003989 | acetyl-CoA carboxylase activity(GO:0003989) |
| 0.1 | 1.0 | GO:0008395 | steroid hydroxylase activity(GO:0008395) |
| 0.1 | 0.4 | GO:0004615 | phosphomannomutase activity(GO:0004615) |
| 0.1 | 0.7 | GO:0004802 | transketolase activity(GO:0004802) |
| 0.1 | 0.4 | GO:0016652 | NAD(P)+ transhydrogenase activity(GO:0008746) oxidoreductase activity, acting on NAD(P)H, NAD(P) as acceptor(GO:0016652) |
| 0.1 | 1.3 | GO:0030368 | interleukin-17 receptor activity(GO:0030368) |
| 0.1 | 1.0 | GO:0004598 | peptidylglycine monooxygenase activity(GO:0004504) peptidylamidoglycolate lyase activity(GO:0004598) |
| 0.1 | 2.9 | GO:0008494 | translation activator activity(GO:0008494) |
| 0.1 | 0.4 | GO:0070984 | SET domain binding(GO:0070984) |
| 0.1 | 0.3 | GO:0004912 | interleukin-3 receptor activity(GO:0004912) |
| 0.1 | 4.3 | GO:0016864 | protein disulfide isomerase activity(GO:0003756) intramolecular oxidoreductase activity, transposing S-S bonds(GO:0016864) |
| 0.1 | 0.4 | GO:0004418 | hydroxymethylbilane synthase activity(GO:0004418) |
| 0.1 | 1.3 | GO:0043426 | MRF binding(GO:0043426) |
| 0.1 | 0.7 | GO:0008457 | beta-galactosyl-N-acetylglucosaminylgalactosylglucosyl-ceramide beta-1,3-acetylglucosaminyltransferase activity(GO:0008457) lactosylceramide 1,3-N-acetyl-beta-D-glucosaminyltransferase activity(GO:0047256) |
| 0.1 | 0.7 | GO:0016434 | rRNA (cytosine) methyltransferase activity(GO:0016434) |
| 0.1 | 2.2 | GO:0043522 | leucine zipper domain binding(GO:0043522) |
| 0.1 | 1.3 | GO:0004793 | glycine hydroxymethyltransferase activity(GO:0004372) threonine aldolase activity(GO:0004793) L-allo-threonine aldolase activity(GO:0008732) |
| 0.1 | 0.6 | GO:0010385 | double-stranded methylated DNA binding(GO:0010385) |
| 0.1 | 1.1 | GO:1990254 | keratin filament binding(GO:1990254) |
| 0.1 | 0.8 | GO:0086077 | gap junction channel activity involved in AV node cell-bundle of His cell electrical coupling(GO:0086077) |
| 0.1 | 3.8 | GO:0097153 | cysteine-type endopeptidase activity involved in apoptotic process(GO:0097153) |
| 0.1 | 1.4 | GO:0042296 | ISG15 transferase activity(GO:0042296) |
| 0.1 | 0.6 | GO:0047708 | biotinidase activity(GO:0047708) |
| 0.1 | 3.2 | GO:0001614 | G-protein coupled nucleotide receptor activity(GO:0001608) purinergic nucleotide receptor activity(GO:0001614) nucleotide receptor activity(GO:0016502) G-protein coupled purinergic nucleotide receptor activity(GO:0045028) |
| 0.1 | 0.7 | GO:0003886 | DNA (cytosine-5-)-methyltransferase activity(GO:0003886) |
| 0.1 | 0.7 | GO:0016842 | amidine-lyase activity(GO:0016842) |
| 0.1 | 1.8 | GO:0098599 | palmitoyl-(protein) hydrolase activity(GO:0008474) palmitoyl hydrolase activity(GO:0098599) |
| 0.1 | 1.1 | GO:1990763 | arrestin family protein binding(GO:1990763) |
| 0.1 | 8.0 | GO:1990841 | promoter-specific chromatin binding(GO:1990841) |
| 0.1 | 0.3 | GO:0004315 | 3-oxoacyl-[acyl-carrier-protein] synthase activity(GO:0004315) |
| 0.1 | 1.2 | GO:0032453 | histone demethylase activity (H3-K4 specific)(GO:0032453) |
| 0.1 | 1.7 | GO:0015279 | store-operated calcium channel activity(GO:0015279) |
| 0.1 | 0.7 | GO:0003986 | acetyl-CoA hydrolase activity(GO:0003986) |
| 0.1 | 2.5 | GO:0017017 | MAP kinase tyrosine/serine/threonine phosphatase activity(GO:0017017) |
| 0.1 | 12.7 | GO:0004715 | non-membrane spanning protein tyrosine kinase activity(GO:0004715) |
| 0.1 | 0.4 | GO:0004879 | RNA polymerase II transcription factor activity, ligand-activated sequence-specific DNA binding(GO:0004879) transcription factor activity, direct ligand regulated sequence-specific DNA binding(GO:0098531) |
| 0.1 | 0.8 | GO:0032296 | ribonuclease III activity(GO:0004525) double-stranded RNA-specific ribonuclease activity(GO:0032296) |
| 0.1 | 0.8 | GO:0016941 | natriuretic peptide receptor activity(GO:0016941) |
| 0.1 | 1.6 | GO:0070699 | type II activin receptor binding(GO:0070699) |
| 0.1 | 5.3 | GO:0001784 | phosphotyrosine binding(GO:0001784) |
| 0.1 | 3.1 | GO:0032036 | myosin heavy chain binding(GO:0032036) |
| 0.1 | 0.6 | GO:0015252 | hydrogen ion channel activity(GO:0015252) |
| 0.1 | 18.4 | GO:0004222 | metalloendopeptidase activity(GO:0004222) |
| 0.1 | 0.8 | GO:0004977 | melanocortin receptor activity(GO:0004977) |
| 0.1 | 0.4 | GO:0004815 | aspartate-tRNA ligase activity(GO:0004815) aspartate-tRNA(Asn) ligase activity(GO:0050560) |
| 0.1 | 0.5 | GO:0004954 | prostanoid receptor activity(GO:0004954) prostaglandin receptor activity(GO:0004955) |
| 0.1 | 0.6 | GO:0016778 | diphosphotransferase activity(GO:0016778) |
| 0.1 | 0.5 | GO:0004967 | glucagon receptor activity(GO:0004967) |
| 0.1 | 1.8 | GO:0030169 | low-density lipoprotein particle binding(GO:0030169) |
| 0.1 | 0.4 | GO:0090409 | malonyl-CoA synthetase activity(GO:0090409) |
| 0.1 | 0.4 | GO:0016714 | oxidoreductase activity, acting on paired donors, with incorporation or reduction of molecular oxygen, reduced pteridine as one donor, and incorporation of one atom of oxygen(GO:0016714) |
| 0.1 | 3.6 | GO:0070742 | C2H2 zinc finger domain binding(GO:0070742) |
| 0.1 | 0.7 | GO:0035014 | phosphatidylinositol 3-kinase regulator activity(GO:0035014) 1-phosphatidylinositol-3-kinase regulator activity(GO:0046935) |
| 0.1 | 0.5 | GO:0008534 | oxidized purine nucleobase lesion DNA N-glycosylase activity(GO:0008534) |
| 0.1 | 0.4 | GO:0098808 | mRNA cap binding(GO:0098808) |
| 0.1 | 0.7 | GO:0039552 | RIG-I binding(GO:0039552) |
| 0.1 | 0.6 | GO:0043199 | sulfate binding(GO:0043199) |
| 0.1 | 0.4 | GO:0071207 | histone pre-mRNA stem-loop binding(GO:0071207) |
| 0.1 | 0.5 | GO:0048040 | UDP-glucuronate decarboxylase activity(GO:0048040) |
| 0.1 | 1.6 | GO:0031386 | protein tag(GO:0031386) |
| 0.1 | 1.6 | GO:0008429 | phosphatidylethanolamine binding(GO:0008429) |
| 0.1 | 0.7 | GO:0061575 | cyclin-dependent protein serine/threonine kinase activator activity(GO:0061575) |
| 0.1 | 0.4 | GO:0004514 | nicotinate-nucleotide diphosphorylase (carboxylating) activity(GO:0004514) |
| 0.1 | 0.7 | GO:0003945 | N-acetyllactosamine synthase activity(GO:0003945) |
| 0.1 | 0.8 | GO:0060002 | plus-end directed microfilament motor activity(GO:0060002) |
| 0.1 | 1.6 | GO:0030020 | extracellular matrix structural constituent conferring tensile strength(GO:0030020) |
| 0.1 | 0.9 | GO:0015038 | glutathione disulfide oxidoreductase activity(GO:0015038) |
| 0.1 | 3.2 | GO:0008190 | eukaryotic initiation factor 4E binding(GO:0008190) |
| 0.1 | 0.7 | GO:0008889 | glycerophosphodiester phosphodiesterase activity(GO:0008889) |
| 0.1 | 0.7 | GO:0003997 | acyl-CoA oxidase activity(GO:0003997) |
| 0.1 | 0.4 | GO:0008476 | protein-tyrosine sulfotransferase activity(GO:0008476) |
| 0.1 | 1.9 | GO:0035613 | RNA stem-loop binding(GO:0035613) |
| 0.1 | 0.3 | GO:0015055 | secretin receptor activity(GO:0015055) |
| 0.1 | 0.3 | GO:0004583 | dolichyl-phosphate-glucose-glycolipid alpha-glucosyltransferase activity(GO:0004583) |
| 0.1 | 0.3 | GO:0016794 | guanosine-3',5'-bis(diphosphate) 3'-diphosphatase activity(GO:0008893) diphosphoric monoester hydrolase activity(GO:0016794) |
| 0.1 | 0.3 | GO:0030158 | protein xylosyltransferase activity(GO:0030158) |
| 0.1 | 0.9 | GO:0039706 | co-receptor binding(GO:0039706) |
| 0.1 | 0.4 | GO:0061656 | SUMO conjugating enzyme activity(GO:0061656) |
| 0.1 | 0.1 | GO:0000702 | oxidized base lesion DNA N-glycosylase activity(GO:0000702) |
| 0.1 | 0.3 | GO:0070039 | rRNA (guanosine-2'-O-)-methyltransferase activity(GO:0070039) |
| 0.1 | 0.6 | GO:0015526 | hexose phosphate transmembrane transporter activity(GO:0015119) organophosphate:inorganic phosphate antiporter activity(GO:0015315) hexose-phosphate:inorganic phosphate antiporter activity(GO:0015526) glucose 6-phosphate:inorganic phosphate antiporter activity(GO:0061513) |
| 0.1 | 0.5 | GO:0098639 | collagen binding involved in cell-matrix adhesion(GO:0098639) |
| 0.1 | 1.9 | GO:0015923 | alpha-mannosidase activity(GO:0004559) mannosidase activity(GO:0015923) |
| 0.1 | 0.4 | GO:0017077 | oxidative phosphorylation uncoupler activity(GO:0017077) |
| 0.1 | 0.2 | GO:0070643 | vitamin D3 25-hydroxylase activity(GO:0030343) vitamin D 25-hydroxylase activity(GO:0070643) |
| 0.1 | 0.3 | GO:0098973 | structural constituent of synapse(GO:0098918) structural constituent of postsynaptic actin cytoskeleton(GO:0098973) |
| 0.1 | 0.8 | GO:0004883 | glucocorticoid receptor activity(GO:0004883) glucocorticoid-activated RNA polymerase II transcription factor binding transcription factor activity(GO:0038051) |
| 0.1 | 2.4 | GO:0004535 | poly(A)-specific ribonuclease activity(GO:0004535) |
| 0.1 | 0.3 | GO:0005093 | Rab GDP-dissociation inhibitor activity(GO:0005093) |
| 0.1 | 1.5 | GO:0005000 | vasopressin receptor activity(GO:0005000) |
| 0.1 | 3.0 | GO:0017056 | structural constituent of nuclear pore(GO:0017056) |
| 0.1 | 0.2 | GO:0003963 | RNA-3'-phosphate cyclase activity(GO:0003963) |
| 0.1 | 0.1 | GO:0030549 | acetylcholine receptor activator activity(GO:0030549) |
| 0.1 | 1.8 | GO:0004000 | adenosine deaminase activity(GO:0004000) |
| 0.1 | 0.4 | GO:0004360 | glutamine-fructose-6-phosphate transaminase (isomerizing) activity(GO:0004360) |
| 0.1 | 0.4 | GO:0070259 | tyrosyl-DNA phosphodiesterase activity(GO:0070259) |
| 0.1 | 1.7 | GO:0016813 | hydrolase activity, acting on carbon-nitrogen (but not peptide) bonds, in linear amidines(GO:0016813) |
| 0.1 | 6.6 | GO:0005549 | odorant binding(GO:0005549) |
| 0.1 | 0.6 | GO:0008297 | single-stranded DNA exodeoxyribonuclease activity(GO:0008297) |
| 0.1 | 0.2 | GO:0071535 | RING-like zinc finger domain binding(GO:0071535) |
| 0.1 | 1.7 | GO:0001222 | transcription corepressor binding(GO:0001222) |
| 0.1 | 0.9 | GO:0035251 | UDP-glucosyltransferase activity(GO:0035251) |
| 0.1 | 0.3 | GO:0008502 | melatonin receptor activity(GO:0008502) |
| 0.1 | 0.5 | GO:0030619 | U1 snRNA binding(GO:0030619) |
| 0.1 | 0.4 | GO:0015375 | glycine:sodium symporter activity(GO:0015375) |
| 0.1 | 0.5 | GO:0003976 | UDP-N-acetylglucosamine-lysosomal-enzyme N-acetylglucosaminephosphotransferase activity(GO:0003976) |
| 0.1 | 0.3 | GO:0050613 | delta14-sterol reductase activity(GO:0050613) |
| 0.1 | 0.9 | GO:0016167 | glial cell-derived neurotrophic factor receptor activity(GO:0016167) |
| 0.1 | 5.0 | GO:0061631 | ubiquitin conjugating enzyme activity(GO:0061631) ubiquitin-like protein conjugating enzyme activity(GO:0061650) |
| 0.1 | 0.6 | GO:0071074 | eukaryotic initiation factor eIF2 binding(GO:0071074) |
| 0.1 | 0.8 | GO:0003988 | acetyl-CoA C-acyltransferase activity(GO:0003988) |
| 0.1 | 0.5 | GO:0004616 | phosphogluconate dehydrogenase (decarboxylating) activity(GO:0004616) |
| 0.1 | 1.8 | GO:0031957 | very long-chain fatty acid-CoA ligase activity(GO:0031957) |
| 0.1 | 0.3 | GO:0001224 | RNA polymerase II transcription cofactor binding(GO:0001224) RNA polymerase II transcription coactivator binding(GO:0001225) |
| 0.1 | 0.3 | GO:0004021 | L-alanine:2-oxoglutarate aminotransferase activity(GO:0004021) alanine-oxo-acid transaminase activity(GO:0047635) |
| 0.1 | 0.3 | GO:0033746 | histone demethylase activity (H3-R2 specific)(GO:0033746) histone demethylase activity (H4-R3 specific)(GO:0033749) |
| 0.1 | 0.6 | GO:0003960 | NADPH:quinone reductase activity(GO:0003960) |
| 0.1 | 10.5 | GO:0004540 | ribonuclease activity(GO:0004540) |
| 0.1 | 1.1 | GO:0004526 | ribonuclease P activity(GO:0004526) |
| 0.1 | 0.3 | GO:2001069 | glycogen binding(GO:2001069) |
| 0.1 | 0.9 | GO:0004935 | adrenergic receptor activity(GO:0004935) |
| 0.1 | 0.4 | GO:0070579 | methylcytosine dioxygenase activity(GO:0070579) |
| 0.1 | 28.2 | GO:0030246 | carbohydrate binding(GO:0030246) |
| 0.1 | 4.2 | GO:0015026 | coreceptor activity(GO:0015026) |
| 0.1 | 0.5 | GO:0008532 | N-acetyllactosaminide beta-1,3-N-acetylglucosaminyltransferase activity(GO:0008532) |
| 0.1 | 0.3 | GO:0004584 | dolichyl-phosphate-mannose-glycolipid alpha-mannosyltransferase activity(GO:0004584) |
| 0.1 | 3.0 | GO:0032041 | histone deacetylase activity (H3-K14 specific)(GO:0031078) NAD-dependent histone deacetylase activity (H3-K14 specific)(GO:0032041) |
| 0.1 | 0.3 | GO:0003858 | 3-hydroxybutyrate dehydrogenase activity(GO:0003858) |
| 0.1 | 1.4 | GO:0043138 | 3'-5' DNA helicase activity(GO:0043138) |
| 0.1 | 0.6 | GO:0016176 | superoxide-generating NADPH oxidase activator activity(GO:0016176) |
| 0.1 | 0.3 | GO:0019150 | D-ribulokinase activity(GO:0019150) |
| 0.1 | 0.3 | GO:0030350 | iron-responsive element binding(GO:0030350) |
| 0.1 | 0.6 | GO:0031996 | thioesterase binding(GO:0031996) |
| 0.1 | 2.6 | GO:0004181 | metallocarboxypeptidase activity(GO:0004181) |
| 0.1 | 0.7 | GO:0016416 | O-palmitoyltransferase activity(GO:0016416) |
| 0.1 | 0.4 | GO:0004666 | prostaglandin-endoperoxide synthase activity(GO:0004666) |
| 0.1 | 0.2 | GO:0008061 | chitin binding(GO:0008061) |
| 0.1 | 1.3 | GO:0008140 | cAMP response element binding protein binding(GO:0008140) |
| 0.1 | 0.4 | GO:0016933 | extracellular-glycine-gated ion channel activity(GO:0016933) extracellular-glycine-gated chloride channel activity(GO:0016934) |
| 0.1 | 0.7 | GO:0034235 | GPI anchor binding(GO:0034235) |
| 0.1 | 2.1 | GO:0070403 | NAD+ binding(GO:0070403) |
| 0.1 | 0.2 | GO:0047750 | cholestenol delta-isomerase activity(GO:0047750) |
| 0.1 | 1.9 | GO:0035497 | cAMP response element binding(GO:0035497) |
| 0.1 | 0.5 | GO:0032422 | purine-rich negative regulatory element binding(GO:0032422) |
| 0.1 | 1.7 | GO:0005176 | ErbB-2 class receptor binding(GO:0005176) |
| 0.1 | 1.3 | GO:0051864 | histone demethylase activity (H3-K36 specific)(GO:0051864) |
| 0.1 | 3.0 | GO:0019198 | transmembrane receptor protein tyrosine phosphatase activity(GO:0005001) transmembrane receptor protein phosphatase activity(GO:0019198) |
| 0.1 | 0.3 | GO:0050501 | hyaluronan synthase activity(GO:0050501) |
| 0.1 | 0.5 | GO:0008131 | primary amine oxidase activity(GO:0008131) |
| 0.1 | 1.0 | GO:0055056 | D-glucose transmembrane transporter activity(GO:0055056) |
| 0.1 | 0.2 | GO:0047783 | steroid 11-beta-monooxygenase activity(GO:0004507) corticosterone 18-monooxygenase activity(GO:0047783) |
| 0.1 | 0.5 | GO:0008113 | peptide-methionine (S)-S-oxide reductase activity(GO:0008113) |
| 0.1 | 1.5 | GO:0009931 | calcium-dependent protein serine/threonine kinase activity(GO:0009931) |
| 0.1 | 0.6 | GO:0004614 | phosphoglucomutase activity(GO:0004614) |
| 0.1 | 0.2 | GO:0071208 | histone pre-mRNA DCP binding(GO:0071208) U7 snRNA binding(GO:0071209) |
| 0.1 | 0.7 | GO:0016004 | phospholipase activator activity(GO:0016004) |
| 0.1 | 0.5 | GO:0036080 | GDP-fucose transmembrane transporter activity(GO:0005457) purine nucleotide-sugar transmembrane transporter activity(GO:0036080) |
| 0.1 | 0.5 | GO:0000064 | L-ornithine transmembrane transporter activity(GO:0000064) |
| 0.1 | 0.7 | GO:0035174 | histone serine kinase activity(GO:0035174) |
| 0.1 | 0.4 | GO:0005172 | vascular endothelial growth factor receptor binding(GO:0005172) |
| 0.1 | 0.3 | GO:0004492 | methylmalonyl-CoA decarboxylase activity(GO:0004492) |
| 0.1 | 0.5 | GO:0004594 | pantothenate kinase activity(GO:0004594) |
| 0.1 | 0.2 | GO:0080023 | 3R-hydroxyacyl-CoA dehydratase activity(GO:0080023) |
| 0.1 | 20.9 | GO:0004984 | olfactory receptor activity(GO:0004984) |
| 0.1 | 0.7 | GO:0016671 | oxidoreductase activity, acting on a sulfur group of donors, disulfide as acceptor(GO:0016671) |
| 0.1 | 0.5 | GO:0042500 | aspartic endopeptidase activity, intramembrane cleaving(GO:0042500) |
| 0.1 | 1.8 | GO:0005031 | tumor necrosis factor-activated receptor activity(GO:0005031) death receptor activity(GO:0005035) |
| 0.1 | 0.4 | GO:0022897 | peptide:proton symporter activity(GO:0015333) proton-dependent peptide secondary active transmembrane transporter activity(GO:0022897) |
| 0.1 | 0.3 | GO:0003974 | UDP-N-acetylglucosamine 4-epimerase activity(GO:0003974) UDP-glucose 4-epimerase activity(GO:0003978) |
| 0.1 | 0.2 | GO:0031755 | endothelial differentiation G-protein coupled receptor binding(GO:0031753) Edg-2 lysophosphatidic acid receptor binding(GO:0031755) |
| 0.1 | 1.4 | GO:0015645 | fatty acid ligase activity(GO:0015645) |
| 0.1 | 0.1 | GO:0001727 | lipid kinase activity(GO:0001727) |
| 0.1 | 0.3 | GO:0032440 | 2-alkenal reductase [NAD(P)] activity(GO:0032440) |
| 0.1 | 0.6 | GO:0004305 | ethanolamine kinase activity(GO:0004305) |
| 0.1 | 0.6 | GO:0004137 | deoxycytidine kinase activity(GO:0004137) |
| 0.1 | 1.2 | GO:0017128 | phospholipid scramblase activity(GO:0017128) |
| 0.1 | 0.2 | GO:0009008 | DNA-methyltransferase activity(GO:0009008) |
| 0.1 | 10.7 | GO:0005178 | integrin binding(GO:0005178) |
| 0.1 | 0.2 | GO:0000224 | peptide-N4-(N-acetyl-beta-glucosaminyl)asparagine amidase activity(GO:0000224) |
| 0.1 | 0.6 | GO:0070568 | guanylyltransferase activity(GO:0070568) |
| 0.1 | 0.8 | GO:0016889 | crossover junction endodeoxyribonuclease activity(GO:0008821) endodeoxyribonuclease activity, producing 3'-phosphomonoesters(GO:0016889) |
| 0.1 | 0.3 | GO:0061676 | importin-alpha family protein binding(GO:0061676) |
| 0.1 | 0.1 | GO:0031177 | phosphopantetheine binding(GO:0031177) |
| 0.1 | 0.3 | GO:0045131 | pre-mRNA branch point binding(GO:0045131) |
| 0.1 | 5.2 | GO:0005201 | extracellular matrix structural constituent(GO:0005201) |
| 0.1 | 1.4 | GO:0015643 | toxic substance binding(GO:0015643) |
| 0.1 | 0.3 | GO:0004370 | glycerol kinase activity(GO:0004370) |
| 0.1 | 1.3 | GO:0017070 | U6 snRNA binding(GO:0017070) |
| 0.1 | 0.1 | GO:0031762 | alpha-1A adrenergic receptor binding(GO:0031691) alpha-1B adrenergic receptor binding(GO:0031692) follicle-stimulating hormone receptor binding(GO:0031762) |
| 0.1 | 1.9 | GO:0004806 | triglyceride lipase activity(GO:0004806) |
| 0.1 | 0.1 | GO:0097604 | temperature-gated cation channel activity(GO:0097604) |
| 0.1 | 0.3 | GO:0008478 | pyridoxal kinase activity(GO:0008478) |
| 0.1 | 0.6 | GO:0003854 | 3-beta-hydroxy-delta5-steroid dehydrogenase activity(GO:0003854) |
| 0.1 | 1.0 | GO:0017154 | semaphorin receptor activity(GO:0017154) |
| 0.1 | 3.9 | GO:0004896 | cytokine receptor activity(GO:0004896) |
| 0.1 | 2.2 | GO:0004129 | cytochrome-c oxidase activity(GO:0004129) heme-copper terminal oxidase activity(GO:0015002) oxidoreductase activity, acting on a heme group of donors, oxygen as acceptor(GO:0016676) |
| 0.1 | 0.4 | GO:0030229 | very-low-density lipoprotein particle receptor activity(GO:0030229) |
| 0.1 | 0.8 | GO:0004634 | phosphopyruvate hydratase activity(GO:0004634) |
| 0.1 | 2.1 | GO:0042974 | retinoic acid receptor binding(GO:0042974) |
| 0.1 | 1.7 | GO:0022841 | potassium ion leak channel activity(GO:0022841) |
| 0.1 | 0.3 | GO:0043237 | laminin-1 binding(GO:0043237) |
| 0.1 | 0.2 | GO:0060422 | peptidyl-dipeptidase inhibitor activity(GO:0060422) |
| 0.1 | 0.1 | GO:0016774 | phosphotransferase activity, carboxyl group as acceptor(GO:0016774) |
| 0.1 | 0.3 | GO:0001132 | RNA polymerase II transcription factor activity, TBP-class protein binding, involved in preinitiation complex assembly(GO:0001129) RNA polymerase II transcription factor activity, TBP-class protein binding(GO:0001132) |
| 0.1 | 1.0 | GO:0008301 | DNA binding, bending(GO:0008301) |
| 0.1 | 0.7 | GO:0004767 | sphingomyelin phosphodiesterase activity(GO:0004767) |
| 0.1 | 0.2 | GO:0004832 | valine-tRNA ligase activity(GO:0004832) |
| 0.1 | 0.5 | GO:0001594 | trace-amine receptor activity(GO:0001594) |
| 0.1 | 0.2 | GO:0045127 | N-acetylglucosamine kinase activity(GO:0045127) |
| 0.1 | 0.3 | GO:0015189 | L-lysine transmembrane transporter activity(GO:0015189) |
| 0.1 | 0.2 | GO:0004577 | N-acetylglucosaminyldiphosphodolichol N-acetylglucosaminyltransferase activity(GO:0004577) |
| 0.1 | 0.2 | GO:0008650 | rRNA (uridine-2'-O-)-methyltransferase activity(GO:0008650) rRNA (uridine) methyltransferase activity(GO:0016436) |
| 0.1 | 0.5 | GO:0009019 | tRNA (guanine-N1-)-methyltransferase activity(GO:0009019) |
| 0.1 | 0.2 | GO:0003958 | NADPH-hemoprotein reductase activity(GO:0003958) |
| 0.1 | 0.1 | GO:0051120 | hepoxilin A3 synthase activity(GO:0051120) |
| 0.1 | 0.1 | GO:0051538 | 3 iron, 4 sulfur cluster binding(GO:0051538) |
| 0.1 | 1.2 | GO:0001206 | transcriptional repressor activity, RNA polymerase II distal enhancer sequence-specific binding(GO:0001206) |
| 0.1 | 0.6 | GO:0004459 | L-lactate dehydrogenase activity(GO:0004459) |
| 0.1 | 0.3 | GO:0071558 | histone demethylase activity (H3-K27 specific)(GO:0071558) |
| 0.1 | 0.2 | GO:0031862 | prostanoid receptor binding(GO:0031862) |
| 0.1 | 5.0 | GO:0004402 | histone acetyltransferase activity(GO:0004402) |
| 0.1 | 0.2 | GO:0050436 | microfibril binding(GO:0050436) |
| 0.1 | 1.6 | GO:0043539 | protein serine/threonine kinase activator activity(GO:0043539) |
| 0.1 | 0.3 | GO:0050833 | pyruvate transmembrane transporter activity(GO:0050833) |
| 0.1 | 0.1 | GO:0003896 | DNA primase activity(GO:0003896) |
| 0.1 | 1.6 | GO:0015347 | sodium-independent organic anion transmembrane transporter activity(GO:0015347) |
| 0.1 | 0.6 | GO:0022833 | mechanically-gated ion channel activity(GO:0008381) mechanically gated channel activity(GO:0022833) |
| 0.1 | 0.3 | GO:0046899 | nucleoside triphosphate adenylate kinase activity(GO:0046899) |
| 0.1 | 0.1 | GO:0055077 | gap junction hemi-channel activity(GO:0055077) |
| 0.1 | 0.2 | GO:0004379 | glycylpeptide N-tetradecanoyltransferase activity(GO:0004379) myristoyltransferase activity(GO:0019107) |
| 0.1 | 0.4 | GO:0043023 | ribosomal large subunit binding(GO:0043023) |
| 0.0 | 0.1 | GO:0001537 | N-acetylgalactosamine 4-O-sulfotransferase activity(GO:0001537) |
| 0.0 | 1.1 | GO:0015271 | outward rectifier potassium channel activity(GO:0015271) |
| 0.0 | 0.6 | GO:0008420 | CTD phosphatase activity(GO:0008420) |
| 0.0 | 0.2 | GO:0046964 | 3'-phosphoadenosine 5'-phosphosulfate transmembrane transporter activity(GO:0046964) |
| 0.0 | 3.8 | GO:0003743 | translation initiation factor activity(GO:0003743) |
| 0.0 | 0.0 | GO:0004144 | diacylglycerol O-acyltransferase activity(GO:0004144) |
| 0.0 | 1.2 | GO:0017166 | vinculin binding(GO:0017166) |
| 0.0 | 4.1 | GO:0003727 | single-stranded RNA binding(GO:0003727) |
| 0.0 | 2.3 | GO:0005385 | zinc ion transmembrane transporter activity(GO:0005385) |
| 0.0 | 0.4 | GO:0036310 | annealing helicase activity(GO:0036310) |
| 0.0 | 0.9 | GO:0030898 | actin-dependent ATPase activity(GO:0030898) |
| 0.0 | 0.7 | GO:0031419 | cobalamin binding(GO:0031419) |
| 0.0 | 0.4 | GO:0016361 | activin receptor activity, type I(GO:0016361) |
| 0.0 | 1.6 | GO:0042169 | SH2 domain binding(GO:0042169) |
| 0.0 | 1.1 | GO:0008143 | poly(A) binding(GO:0008143) |
| 0.0 | 1.6 | GO:0051059 | NF-kappaB binding(GO:0051059) |
| 0.0 | 36.1 | GO:0001228 | transcriptional activator activity, RNA polymerase II transcription regulatory region sequence-specific binding(GO:0001228) |
| 0.0 | 0.3 | GO:0004706 | JUN kinase kinase kinase activity(GO:0004706) |
| 0.0 | 1.5 | GO:0016667 | oxidoreductase activity, acting on a sulfur group of donors(GO:0016667) |
| 0.0 | 0.3 | GO:0004966 | galanin receptor activity(GO:0004966) |
| 0.0 | 0.1 | GO:0016899 | oxidoreductase activity, acting on the CH-OH group of donors, oxygen as acceptor(GO:0016899) |
| 0.0 | 0.2 | GO:0050816 | phosphothreonine binding(GO:0050816) |
| 0.0 | 0.3 | GO:0010521 | telomerase inhibitor activity(GO:0010521) |
| 0.0 | 0.5 | GO:0030280 | structural constituent of epidermis(GO:0030280) |
| 0.0 | 0.1 | GO:0004052 | arachidonate 12-lipoxygenase activity(GO:0004052) |
| 0.0 | 0.2 | GO:0042134 | rRNA primary transcript binding(GO:0042134) |
| 0.0 | 0.1 | GO:0030284 | estrogen receptor activity(GO:0030284) |
| 0.0 | 0.3 | GO:0035198 | miRNA binding(GO:0035198) |
| 0.0 | 0.2 | GO:0022840 | leak channel activity(GO:0022840) narrow pore channel activity(GO:0022842) |
| 0.0 | 0.1 | GO:0000994 | RNA polymerase III core binding(GO:0000994) |
| 0.0 | 0.0 | GO:0004176 | ATP-dependent peptidase activity(GO:0004176) |
| 0.0 | 0.2 | GO:0004991 | parathyroid hormone receptor activity(GO:0004991) |
| 0.0 | 0.3 | GO:0051996 | farnesyl-diphosphate farnesyltransferase activity(GO:0004310) squalene synthase activity(GO:0051996) |
| 0.0 | 0.1 | GO:0004766 | spermidine synthase activity(GO:0004766) |
| 0.0 | 8.6 | GO:0000982 | transcription factor activity, RNA polymerase II core promoter proximal region sequence-specific binding(GO:0000982) |
| 0.0 | 0.6 | GO:1901612 | phosphatidylglycerol binding(GO:1901611) cardiolipin binding(GO:1901612) |
| 0.0 | 0.2 | GO:0089720 | caspase binding(GO:0089720) |
| 0.0 | 2.2 | GO:0000980 | RNA polymerase II distal enhancer sequence-specific DNA binding(GO:0000980) |
| 0.0 | 0.3 | GO:0010997 | anaphase-promoting complex binding(GO:0010997) |
| 0.0 | 0.2 | GO:0003875 | ADP-ribosylarginine hydrolase activity(GO:0003875) |
| 0.0 | 2.0 | GO:0016831 | carboxy-lyase activity(GO:0016831) |
| 0.0 | 0.2 | GO:0016647 | oxidoreductase activity, acting on the CH-NH group of donors, oxygen as acceptor(GO:0016647) |
| 0.0 | 0.4 | GO:0060072 | large conductance calcium-activated potassium channel activity(GO:0060072) |
| 0.0 | 0.1 | GO:0046976 | histone methyltransferase activity (H3-K27 specific)(GO:0046976) |
| 0.0 | 0.2 | GO:1902444 | riboflavin binding(GO:1902444) |
| 0.0 | 0.2 | GO:0004660 | protein farnesyltransferase activity(GO:0004660) |
| 0.0 | 0.1 | GO:0033699 | DNA 5'-adenosine monophosphate hydrolase activity(GO:0033699) |
| 0.0 | 0.1 | GO:0000035 | acyl binding(GO:0000035) |
| 0.0 | 0.1 | GO:0031071 | cysteine desulfurase activity(GO:0031071) |
| 0.0 | 0.3 | GO:0033691 | sialic acid binding(GO:0033691) |
| 0.0 | 0.4 | GO:0035173 | histone kinase activity(GO:0035173) |
| 0.0 | 0.4 | GO:0003688 | DNA replication origin binding(GO:0003688) |
| 0.0 | 0.5 | GO:0001158 | enhancer sequence-specific DNA binding(GO:0001158) |
| 0.0 | 0.3 | GO:0072542 | protein phosphatase activator activity(GO:0072542) |
| 0.0 | 0.1 | GO:0086059 | voltage-gated calcium channel activity involved SA node cell action potential(GO:0086059) |
| 0.0 | 0.3 | GO:0003847 | 1-alkyl-2-acetylglycerophosphocholine esterase activity(GO:0003847) |
| 0.0 | 0.2 | GO:0047057 | oxidoreductase activity, acting on the CH-OH group of donors, disulfide as acceptor(GO:0016900) vitamin-K-epoxide reductase (warfarin-sensitive) activity(GO:0047057) |
| 0.0 | 0.4 | GO:0031435 | mitogen-activated protein kinase kinase kinase binding(GO:0031435) |
| 0.0 | 0.6 | GO:0036374 | glutathione hydrolase activity(GO:0036374) |
| 0.0 | 0.7 | GO:0070016 | armadillo repeat domain binding(GO:0070016) |
| 0.0 | 0.1 | GO:0016608 | growth hormone-releasing hormone activity(GO:0016608) |
| 0.0 | 0.1 | GO:0031208 | POZ domain binding(GO:0031208) |
| 0.0 | 0.3 | GO:1990829 | C-rich single-stranded DNA binding(GO:1990829) |
| 0.0 | 0.2 | GO:0000405 | bubble DNA binding(GO:0000405) |
| 0.0 | 0.1 | GO:0016713 | oxidoreductase activity, acting on paired donors, with incorporation or reduction of molecular oxygen, reduced iron-sulfur protein as one donor, and incorporation of one atom of oxygen(GO:0016713) |
| 0.0 | 0.1 | GO:0008240 | tripeptidyl-peptidase activity(GO:0008240) |
| 0.0 | 0.3 | GO:0008097 | 5S rRNA binding(GO:0008097) |
| 0.0 | 0.3 | GO:0070740 | tubulin-glutamic acid ligase activity(GO:0070740) |
| 0.0 | 0.2 | GO:0015157 | sucrose:proton symporter activity(GO:0008506) sucrose transmembrane transporter activity(GO:0008515) disaccharide transmembrane transporter activity(GO:0015154) oligosaccharide transmembrane transporter activity(GO:0015157) |
| 0.0 | 0.5 | GO:0016884 | carbon-nitrogen ligase activity, with glutamine as amido-N-donor(GO:0016884) |
| 0.0 | 2.4 | GO:0004004 | ATP-dependent RNA helicase activity(GO:0004004) RNA-dependent ATPase activity(GO:0008186) |
| 0.0 | 1.0 | GO:0003707 | steroid hormone receptor activity(GO:0003707) |
| 0.0 | 0.3 | GO:0031013 | troponin I binding(GO:0031013) |
| 0.0 | 0.3 | GO:0043325 | phosphatidylinositol-3,4-bisphosphate binding(GO:0043325) |
| 0.0 | 0.1 | GO:0042979 | ornithine decarboxylase regulator activity(GO:0042979) |
| 0.0 | 0.1 | GO:0008428 | ribonuclease inhibitor activity(GO:0008428) |
| 0.0 | 0.2 | GO:0004045 | aminoacyl-tRNA hydrolase activity(GO:0004045) |
| 0.0 | 0.1 | GO:0005136 | interleukin-4 receptor binding(GO:0005136) |
| 0.0 | 0.1 | GO:0003828 | alpha-N-acetylneuraminate alpha-2,8-sialyltransferase activity(GO:0003828) |
| 0.0 | 0.6 | GO:0005092 | GDP-dissociation inhibitor activity(GO:0005092) |
| 0.0 | 0.1 | GO:0047696 | beta-adrenergic receptor kinase activity(GO:0047696) |
| 0.0 | 0.2 | GO:0047493 | sphingomyelin synthase activity(GO:0033188) ceramide cholinephosphotransferase activity(GO:0047493) |
| 0.0 | 0.3 | GO:0019869 | chloride channel inhibitor activity(GO:0019869) |
| 0.0 | 0.2 | GO:0008853 | exodeoxyribonuclease III activity(GO:0008853) |
| 0.0 | 0.4 | GO:0004383 | guanylate cyclase activity(GO:0004383) |
| 0.0 | 0.6 | GO:0016709 | oxidoreductase activity, acting on paired donors, with incorporation or reduction of molecular oxygen, NAD(P)H as one donor, and incorporation of one atom of oxygen(GO:0016709) |
| 0.0 | 0.1 | GO:0050333 | thiamin-triphosphatase activity(GO:0050333) |
| 0.0 | 0.1 | GO:0005166 | neurotrophin p75 receptor binding(GO:0005166) |
| 0.0 | 0.4 | GO:0047617 | acyl-CoA hydrolase activity(GO:0047617) |
| 0.0 | 0.1 | GO:0016520 | growth hormone-releasing hormone receptor activity(GO:0016520) |
| 0.0 | 0.5 | GO:0005522 | profilin binding(GO:0005522) |
| 0.0 | 0.2 | GO:0008408 | 3'-5' exonuclease activity(GO:0008408) |
| 0.0 | 0.2 | GO:0001848 | complement binding(GO:0001848) |
| 0.0 | 3.4 | GO:0005125 | cytokine activity(GO:0005125) |
| 0.0 | 0.1 | GO:0004445 | inositol-polyphosphate 5-phosphatase activity(GO:0004445) |
| 0.0 | 0.0 | GO:0004301 | epoxide hydrolase activity(GO:0004301) |
| 0.0 | 0.1 | GO:0001512 | dihydronicotinamide riboside quinone reductase activity(GO:0001512) melatonin binding(GO:1904408) |
| 0.0 | 0.3 | GO:0005078 | MAP-kinase scaffold activity(GO:0005078) |
| 0.0 | 0.1 | GO:0004775 | succinate-CoA ligase (ADP-forming) activity(GO:0004775) |
| 0.0 | 0.1 | GO:0004032 | alditol:NADP+ 1-oxidoreductase activity(GO:0004032) |
| 0.0 | 0.2 | GO:0004030 | aldehyde dehydrogenase [NAD(P)+] activity(GO:0004030) |
| 0.0 | 0.1 | GO:0036440 | citrate (Si)-synthase activity(GO:0004108) citrate synthase activity(GO:0036440) |
| 0.0 | 0.4 | GO:0001054 | RNA polymerase I activity(GO:0001054) |
| 0.0 | 0.3 | GO:0008353 | RNA polymerase II carboxy-terminal domain kinase activity(GO:0008353) |
| 0.0 | 0.5 | GO:0003785 | actin monomer binding(GO:0003785) |
| 0.0 | 0.2 | GO:0055106 | ubiquitin-protein transferase regulator activity(GO:0055106) |
| 0.0 | 1.1 | GO:0003755 | peptidyl-prolyl cis-trans isomerase activity(GO:0003755) |
| 0.0 | 0.1 | GO:0070728 | leucine binding(GO:0070728) |
| 0.0 | 0.1 | GO:0016206 | catechol O-methyltransferase activity(GO:0016206) |
| 0.0 | 0.0 | GO:0008263 | pyrimidine-specific mismatch base pair DNA N-glycosylase activity(GO:0008263) |
| 0.0 | 0.0 | GO:0015140 | malate transmembrane transporter activity(GO:0015140) |
| 0.0 | 0.9 | GO:0003954 | NADH dehydrogenase activity(GO:0003954) |
| 0.0 | 0.1 | GO:0015307 | drug:proton antiporter activity(GO:0015307) |
| 0.0 | 0.2 | GO:0022889 | L-serine transmembrane transporter activity(GO:0015194) serine transmembrane transporter activity(GO:0022889) |
| 0.0 | 0.2 | GO:0008568 | microtubule-severing ATPase activity(GO:0008568) |
| 0.0 | 0.0 | GO:0030249 | guanylate cyclase regulator activity(GO:0030249) |
| 0.0 | 1.4 | GO:0001227 | transcriptional repressor activity, RNA polymerase II transcription regulatory region sequence-specific binding(GO:0001227) |
| 0.0 | 0.1 | GO:0004591 | oxoglutarate dehydrogenase (succinyl-transferring) activity(GO:0004591) |
| 0.0 | 0.1 | GO:0017060 | 3-galactosyl-N-acetylglucosaminide 4-alpha-L-fucosyltransferase activity(GO:0017060) |
| 0.0 | 0.1 | GO:0004430 | 1-phosphatidylinositol 4-kinase activity(GO:0004430) |
| 0.0 | 0.0 | GO:0019777 | Atg12 transferase activity(GO:0019777) |
| 0.0 | 0.5 | GO:0019706 | protein-cysteine S-palmitoyltransferase activity(GO:0019706) protein-cysteine S-acyltransferase activity(GO:0019707) |
| 0.0 | 0.3 | GO:0004012 | phospholipid-translocating ATPase activity(GO:0004012) |
| 0.0 | 0.4 | GO:0008484 | sulfuric ester hydrolase activity(GO:0008484) |
| 0.0 | 0.1 | GO:0086008 | voltage-gated potassium channel activity involved in cardiac muscle cell action potential repolarization(GO:0086008) |
| 0.0 | 0.0 | GO:0008441 | 3'(2'),5'-bisphosphate nucleotidase activity(GO:0008441) |
| 0.0 | 0.0 | GO:0000822 | inositol hexakisphosphate binding(GO:0000822) |
| 0.0 | 0.1 | GO:0048185 | activin binding(GO:0048185) |
| 0.0 | 0.2 | GO:0000339 | RNA cap binding(GO:0000339) |
Gene overrepresentation in curated gene sets: canonical pathways category:
| Log-likelihood per target | Total log-likelihood | Term | Description |
|---|---|---|---|
| 0.9 | 0.9 | SIG BCR SIGNALING PATHWAY | Members of the BCR signaling pathway |
| 0.9 | 55.5 | PID INTEGRIN2 PATHWAY | Beta2 integrin cell surface interactions |
| 0.5 | 3.2 | PID IL8 CXCR1 PATHWAY | IL8- and CXCR1-mediated signaling events |
| 0.5 | 3.1 | PID AR NONGENOMIC PATHWAY | Nongenotropic Androgen signaling |
| 0.5 | 3.3 | PID CD40 PATHWAY | CD40/CD40L signaling |
| 0.5 | 20.3 | PID TOLL ENDOGENOUS PATHWAY | Endogenous TLR signaling |
| 0.5 | 29.5 | PID IL12 STAT4 PATHWAY | IL12 signaling mediated by STAT4 |
| 0.4 | 2.2 | ST DIFFERENTIATION PATHWAY IN PC12 CELLS | Differentiation Pathway in PC12 Cells; this is a specific case of PAC1 Receptor Pathway. |
| 0.4 | 4.5 | PID IL27 PATHWAY | IL27-mediated signaling events |
| 0.4 | 16.7 | SA MMP CYTOKINE CONNECTION | Cytokines can induce activation of matrix metalloproteinases, which degrade extracellular matrix. |
| 0.4 | 1.2 | PID LPA4 PATHWAY | LPA4-mediated signaling events |
| 0.4 | 1.1 | ST JAK STAT PATHWAY | Jak-STAT Pathway |
| 0.4 | 2.5 | PID IL5 PATHWAY | IL5-mediated signaling events |
| 0.3 | 43.6 | PID IL4 2PATHWAY | IL4-mediated signaling events |
| 0.3 | 6.0 | ST INTERFERON GAMMA PATHWAY | Interferon gamma pathway. |
| 0.3 | 16.1 | PID IL12 2PATHWAY | IL12-mediated signaling events |
| 0.3 | 28.3 | PID HNF3B PATHWAY | FOXA2 and FOXA3 transcription factor networks |
| 0.3 | 19.9 | PID IL1 PATHWAY | IL1-mediated signaling events |
| 0.3 | 23.8 | PID BCR 5PATHWAY | BCR signaling pathway |
| 0.3 | 14.0 | PID TRAIL PATHWAY | TRAIL signaling pathway |
| 0.3 | 0.6 | PID NEPHRIN NEPH1 PATHWAY | Nephrin/Neph1 signaling in the kidney podocyte |
| 0.3 | 25.0 | PID HNF3A PATHWAY | FOXA1 transcription factor network |
| 0.3 | 3.6 | PID IL23 PATHWAY | IL23-mediated signaling events |
| 0.3 | 17.7 | PID UPA UPAR PATHWAY | Urokinase-type plasminogen activator (uPA) and uPAR-mediated signaling |
| 0.3 | 4.6 | PID TCR JNK PATHWAY | JNK signaling in the CD4+ TCR pathway |
| 0.3 | 2.1 | PID CD8 TCR DOWNSTREAM PATHWAY | Downstream signaling in naïve CD8+ T cells |
| 0.2 | 15.1 | PID FCER1 PATHWAY | Fc-epsilon receptor I signaling in mast cells |
| 0.2 | 4.4 | PID ANTHRAX PATHWAY | Cellular roles of Anthrax toxin |
| 0.2 | 1.2 | PID TCR RAS PATHWAY | Ras signaling in the CD4+ TCR pathway |
| 0.2 | 13.1 | PID IL6 7 PATHWAY | IL6-mediated signaling events |
| 0.2 | 1.6 | PID FRA PATHWAY | Validated transcriptional targets of AP1 family members Fra1 and Fra2 |
| 0.2 | 0.9 | PID WNT NONCANONICAL PATHWAY | Noncanonical Wnt signaling pathway |
| 0.2 | 1.7 | PID NFKAPPAB ATYPICAL PATHWAY | Atypical NF-kappaB pathway |
| 0.2 | 7.4 | PID EPHRINB REV PATHWAY | Ephrin B reverse signaling |
| 0.2 | 11.1 | PID IL8 CXCR2 PATHWAY | IL8- and CXCR2-mediated signaling events |
| 0.2 | 5.9 | PID IL2 1PATHWAY | IL2-mediated signaling events |
| 0.2 | 74.5 | NABA ECM REGULATORS | Genes encoding enzymes and their regulators involved in the remodeling of the extracellular matrix |
| 0.2 | 4.5 | PID CD8 TCR PATHWAY | TCR signaling in naïve CD8+ T cells |
| 0.2 | 1.0 | PID LYMPH ANGIOGENESIS PATHWAY | VEGFR3 signaling in lymphatic endothelium |
| 0.2 | 4.3 | PID IGF1 PATHWAY | IGF1 pathway |
| 0.2 | 54.9 | NABA ECM AFFILIATED | Genes encoding proteins affiliated structurally or functionally to extracellular matrix proteins |
| 0.2 | 1.5 | SA PROGRAMMED CELL DEATH | Programmed cell death, or apoptosis, eliminates damaged or unneeded cells. |
| 0.2 | 4.7 | PID CXCR3 PATHWAY | CXCR3-mediated signaling events |
| 0.2 | 3.4 | SA REG CASCADE OF CYCLIN EXPR | Expression of cyclins regulates progression through the cell cycle by activating cyclin-dependent kinases. |
| 0.2 | 5.5 | PID HIV NEF PATHWAY | HIV-1 Nef: Negative effector of Fas and TNF-alpha |
| 0.2 | 2.6 | PID INTEGRIN5 PATHWAY | Beta5 beta6 beta7 and beta8 integrin cell surface interactions |
| 0.2 | 3.2 | PID VEGF VEGFR PATHWAY | VEGF and VEGFR signaling network |
| 0.1 | 4.0 | PID ANGIOPOIETIN RECEPTOR PATHWAY | Angiopoietin receptor Tie2-mediated signaling |
| 0.1 | 10.3 | PID RXR VDR PATHWAY | RXR and RAR heterodimerization with other nuclear receptor |
| 0.1 | 1.9 | PID INTEGRIN A9B1 PATHWAY | Alpha9 beta1 integrin signaling events |
| 0.1 | 0.1 | ST GRANULE CELL SURVIVAL PATHWAY | Granule Cell Survival Pathway is a specific case of more general PAC1 Receptor Pathway. |
| 0.1 | 5.2 | PID TXA2PATHWAY | Thromboxane A2 receptor signaling |
| 0.1 | 1.4 | PID EPO PATHWAY | EPO signaling pathway |
| 0.1 | 0.8 | PID S1P S1P2 PATHWAY | S1P2 pathway |
| 0.1 | 2.4 | PID TCR PATHWAY | TCR signaling in naïve CD4+ T cells |
| 0.1 | 0.8 | PID THROMBIN PAR4 PATHWAY | PAR4-mediated thrombin signaling events |
| 0.1 | 4.1 | PID P38 MK2 PATHWAY | p38 signaling mediated by MAPKAP kinases |
| 0.1 | 1.8 | PID IL2 STAT5 PATHWAY | IL2 signaling events mediated by STAT5 |
| 0.1 | 2.5 | PID SMAD2 3PATHWAY | Regulation of cytoplasmic and nuclear SMAD2/3 signaling |
| 0.1 | 3.8 | PID NFKAPPAB CANONICAL PATHWAY | Canonical NF-kappaB pathway |
| 0.1 | 3.0 | PID CIRCADIAN PATHWAY | Circadian rhythm pathway |
| 0.1 | 7.6 | PID PLK1 PATHWAY | PLK1 signaling events |
| 0.1 | 1.2 | PID ER NONGENOMIC PATHWAY | Plasma membrane estrogen receptor signaling |
| 0.1 | 4.0 | PID FOXM1 PATHWAY | FOXM1 transcription factor network |
| 0.1 | 2.5 | PID PRL SIGNALING EVENTS PATHWAY | Signaling events mediated by PRL |
| 0.1 | 4.4 | PID SYNDECAN 4 PATHWAY | Syndecan-4-mediated signaling events |
| 0.1 | 2.2 | ST G ALPHA S PATHWAY | G alpha s Pathway |
| 0.1 | 1.8 | PID P38 ALPHA BETA PATHWAY | Regulation of p38-alpha and p38-beta |
| 0.1 | 10.9 | PID CMYB PATHWAY | C-MYB transcription factor network |
| 0.1 | 1.8 | PID GMCSF PATHWAY | GMCSF-mediated signaling events |
| 0.1 | 3.0 | PID CONE PATHWAY | Visual signal transduction: Cones |
| 0.1 | 0.7 | SA B CELL RECEPTOR COMPLEXES | Antigen binding to B cell receptors activates protein tyrosine kinases, such as the Src family, which ultimate activate MAP kinases. |
| 0.1 | 0.7 | PID FOXO PATHWAY | FoxO family signaling |
| 0.1 | 2.0 | PID KIT PATHWAY | Signaling events mediated by Stem cell factor receptor (c-Kit) |
| 0.1 | 6.3 | PID NOTCH PATHWAY | Notch signaling pathway |
| 0.1 | 2.5 | PID ENDOTHELIN PATHWAY | Endothelins |
| 0.1 | 5.3 | PID RAC1 PATHWAY | RAC1 signaling pathway |
| 0.1 | 4.7 | PID DELTA NP63 PATHWAY | Validated transcriptional targets of deltaNp63 isoforms |
| 0.1 | 8.5 | PID RHOA REG PATHWAY | Regulation of RhoA activity |
| 0.1 | 0.3 | PID TCPTP PATHWAY | Signaling events mediated by TCPTP |
| 0.1 | 0.6 | PID S1P META PATHWAY | Sphingosine 1-phosphate (S1P) pathway |
| 0.1 | 5.3 | PID ILK PATHWAY | Integrin-linked kinase signaling |
| 0.1 | 2.0 | PID ATF2 PATHWAY | ATF-2 transcription factor network |
| 0.1 | 0.4 | SA CASPASE CASCADE | Apoptosis is mediated by caspases, cysteine proteases arranged in a proteolytic cascade. |
| 0.0 | 1.2 | PID PS1 PATHWAY | Presenilin action in Notch and Wnt signaling |
| 0.0 | 0.9 | PID AMB2 NEUTROPHILS PATHWAY | amb2 Integrin signaling |
| 0.0 | 1.7 | PID HES HEY PATHWAY | Notch-mediated HES/HEY network |
| 0.0 | 1.0 | PID AURORA A PATHWAY | Aurora A signaling |
| 0.0 | 3.0 | PID E2F PATHWAY | E2F transcription factor network |
| 0.0 | 1.7 | PID NFAT TFPATHWAY | Calcineurin-regulated NFAT-dependent transcription in lymphocytes |
| 0.0 | 5.3 | PID BETA CATENIN NUC PATHWAY | Regulation of nuclear beta catenin signaling and target gene transcription |
| 0.0 | 0.2 | PID VEGFR1 PATHWAY | VEGFR1 specific signals |
| 0.0 | 0.0 | ST ADRENERGIC | Adrenergic Pathway |
| 0.0 | 0.8 | PID DNA PK PATHWAY | DNA-PK pathway in nonhomologous end joining |
| 0.0 | 0.7 | ST P38 MAPK PATHWAY | p38 MAPK Pathway |
| 0.0 | 0.2 | ST PHOSPHOINOSITIDE 3 KINASE PATHWAY | PI3K Pathway |
| 0.0 | 3.0 | PID HDAC CLASSI PATHWAY | Signaling events mediated by HDAC Class I |
| 0.0 | 1.1 | PID HEDGEHOG GLI PATHWAY | Hedgehog signaling events mediated by Gli proteins |
| 0.0 | 0.7 | PID P38 ALPHA BETA DOWNSTREAM PATHWAY | Signaling mediated by p38-alpha and p38-beta |
| 0.0 | 2.2 | NABA COLLAGENS | Genes encoding collagen proteins |
| 0.0 | 2.1 | PID MYC ACTIV PATHWAY | Validated targets of C-MYC transcriptional activation |
| 0.0 | 3.2 | PID P53 DOWNSTREAM PATHWAY | Direct p53 effectors |
| 0.0 | 1.2 | PID MET PATHWAY | Signaling events mediated by Hepatocyte Growth Factor Receptor (c-Met) |
| 0.0 | 0.9 | PID RB 1PATHWAY | Regulation of retinoblastoma protein |
| 0.0 | 0.3 | SIG INSULIN RECEPTOR PATHWAY IN CARDIAC MYOCYTES | Genes related to the insulin receptor pathway |
| 0.0 | 0.4 | PID RET PATHWAY | Signaling events regulated by Ret tyrosine kinase |
| 0.0 | 0.5 | PID ALK1 PATHWAY | ALK1 signaling events |
| 0.0 | 0.0 | SA PTEN PATHWAY | PTEN is a tumor suppressor that dephosphorylates the lipid messenger phosphatidylinositol triphosphate. |
Gene overrepresentation in curated gene sets: REACTOME pathways category:
| Log-likelihood per target | Total log-likelihood | Term | Description |
|---|---|---|---|
| 1.8 | 31.8 | REACTOME XENOBIOTICS | Genes involved in Xenobiotics |
| 1.5 | 28.8 | REACTOME COMMON PATHWAY | Genes involved in Common Pathway |
| 1.2 | 7.2 | REACTOME BINDING AND ENTRY OF HIV VIRION | Genes involved in Binding and entry of HIV virion |
| 1.1 | 12.1 | REACTOME ENDOSOMAL VACUOLAR PATHWAY | Genes involved in Endosomal/Vacuolar pathway |
| 0.9 | 12.7 | REACTOME CREATION OF C4 AND C2 ACTIVATORS | Genes involved in Creation of C4 and C2 activators |
| 0.9 | 13.8 | REACTOME RECYCLING OF BILE ACIDS AND SALTS | Genes involved in Recycling of bile acids and salts |
| 0.8 | 8.5 | REACTOME INITIAL TRIGGERING OF COMPLEMENT | Genes involved in Initial triggering of complement |
| 0.8 | 23.7 | REACTOME PHOSPHORYLATION OF CD3 AND TCR ZETA CHAINS | Genes involved in Phosphorylation of CD3 and TCR zeta chains |
| 0.8 | 12.1 | REACTOME SYNTHESIS OF BILE ACIDS AND BILE SALTS VIA 24 HYDROXYCHOLESTEROL | Genes involved in Synthesis of bile acids and bile salts via 24-hydroxycholesterol |
| 0.8 | 20.6 | REACTOME COMPLEMENT CASCADE | Genes involved in Complement cascade |
| 0.8 | 22.6 | REACTOME GLUCURONIDATION | Genes involved in Glucuronidation |
| 0.8 | 14.0 | REACTOME ETHANOL OXIDATION | Genes involved in Ethanol oxidation |
| 0.8 | 19.8 | REACTOME INTRINSIC PATHWAY | Genes involved in Intrinsic Pathway |
| 0.7 | 76.8 | REACTOME IMMUNOREGULATORY INTERACTIONS BETWEEN A LYMPHOID AND A NON LYMPHOID CELL | Genes involved in Immunoregulatory interactions between a Lymphoid and a non-Lymphoid cell |
| 0.7 | 9.8 | REACTOME TRYPTOPHAN CATABOLISM | Genes involved in Tryptophan catabolism |
| 0.6 | 15.5 | REACTOME CHYLOMICRON MEDIATED LIPID TRANSPORT | Genes involved in Chylomicron-mediated lipid transport |
| 0.6 | 0.6 | REACTOME CIRCADIAN REPRESSION OF EXPRESSION BY REV ERBA | Genes involved in Circadian Repression of Expression by REV-ERBA |
| 0.6 | 40.4 | REACTOME CHEMOKINE RECEPTORS BIND CHEMOKINES | Genes involved in Chemokine receptors bind chemokines |
| 0.5 | 3.5 | REACTOME FORMATION OF FIBRIN CLOT CLOTTING CASCADE | Genes involved in Formation of Fibrin Clot (Clotting Cascade) |
| 0.5 | 22.4 | REACTOME DEFENSINS | Genes involved in Defensins |
| 0.5 | 17.5 | REACTOME EXTRINSIC PATHWAY FOR APOPTOSIS | Genes involved in Extrinsic Pathway for Apoptosis |
| 0.5 | 13.0 | REACTOME CYTOSOLIC SULFONATION OF SMALL MOLECULES | Genes involved in Cytosolic sulfonation of small molecules |
| 0.5 | 5.5 | REACTOME TRAF6 MEDIATED IRF7 ACTIVATION IN TLR7 8 OR 9 SIGNALING | Genes involved in TRAF6 mediated IRF7 activation in TLR7/8 or 9 signaling |
| 0.4 | 5.5 | REACTOME HYALURONAN UPTAKE AND DEGRADATION | Genes involved in Hyaluronan uptake and degradation |
| 0.4 | 12.6 | REACTOME IL 7 SIGNALING | Genes involved in Interleukin-7 signaling |
| 0.4 | 2.5 | REACTOME PD1 SIGNALING | Genes involved in PD-1 signaling |
| 0.4 | 28.4 | REACTOME FORMATION OF THE TERNARY COMPLEX AND SUBSEQUENTLY THE 43S COMPLEX | Genes involved in Formation of the ternary complex, and subsequently, the 43S complex |
| 0.4 | 8.8 | REACTOME EICOSANOID LIGAND BINDING RECEPTORS | Genes involved in Eicosanoid ligand-binding receptors |
| 0.3 | 3.8 | REACTOME ACTIVATED TAK1 MEDIATES P38 MAPK ACTIVATION | Genes involved in activated TAK1 mediates p38 MAPK activation |
| 0.3 | 7.5 | REACTOME ACTIVATION OF IRF3 IRF7 MEDIATED BY TBK1 IKK EPSILON | Genes involved in Activation of IRF3/IRF7 mediated by TBK1/IKK epsilon |
| 0.3 | 6.1 | REACTOME CD28 DEPENDENT VAV1 PATHWAY | Genes involved in CD28 dependent Vav1 pathway |
| 0.3 | 3.3 | REACTOME GAMMA CARBOXYLATION TRANSPORT AND AMINO TERMINAL CLEAVAGE OF PROTEINS | Genes involved in Gamma-carboxylation, transport, and amino-terminal cleavage of proteins |
| 0.3 | 34.6 | REACTOME ANTIGEN PROCESSING CROSS PRESENTATION | Genes involved in Antigen processing-Cross presentation |
| 0.3 | 11.1 | REACTOME TIE2 SIGNALING | Genes involved in Tie2 Signaling |
| 0.3 | 5.5 | REACTOME TCR SIGNALING | Genes involved in TCR signaling |
| 0.3 | 5.7 | REACTOME ACYL CHAIN REMODELLING OF PS | Genes involved in Acyl chain remodelling of PS |
| 0.3 | 4.0 | REACTOME PURINE CATABOLISM | Genes involved in Purine catabolism |
| 0.3 | 1.5 | REACTOME ELEVATION OF CYTOSOLIC CA2 LEVELS | Genes involved in Elevation of cytosolic Ca2+ levels |
| 0.3 | 31.9 | REACTOME INTERFERON GAMMA SIGNALING | Genes involved in Interferon gamma signaling |
| 0.3 | 1.8 | REACTOME PLATELET SENSITIZATION BY LDL | Genes involved in Platelet sensitization by LDL |
| 0.3 | 4.2 | REACTOME GRB2 SOS PROVIDES LINKAGE TO MAPK SIGNALING FOR INTERGRINS | Genes involved in GRB2:SOS provides linkage to MAPK signaling for Intergrins |
| 0.3 | 11.6 | REACTOME AMYLOIDS | Genes involved in Amyloids |
| 0.3 | 0.6 | REACTOME G ALPHA1213 SIGNALLING EVENTS | Genes involved in G alpha (12/13) signalling events |
| 0.3 | 10.2 | REACTOME INFLAMMASOMES | Genes involved in Inflammasomes |
| 0.3 | 6.7 | REACTOME NUCLEOTIDE BINDING DOMAIN LEUCINE RICH REPEAT CONTAINING RECEPTOR NLR SIGNALING PATHWAYS | Genes involved in Nucleotide-binding domain, leucine rich repeat containing receptor (NLR) signaling pathways |
| 0.3 | 4.8 | REACTOME PASSIVE TRANSPORT BY AQUAPORINS | Genes involved in Passive Transport by Aquaporins |
| 0.3 | 7.8 | REACTOME IL RECEPTOR SHC SIGNALING | Genes involved in Interleukin receptor SHC signaling |
| 0.3 | 9.1 | REACTOME GENERATION OF SECOND MESSENGER MOLECULES | Genes involved in Generation of second messenger molecules |
| 0.3 | 0.5 | REACTOME CDK MEDIATED PHOSPHORYLATION AND REMOVAL OF CDC6 | Genes involved in CDK-mediated phosphorylation and removal of Cdc6 |
| 0.3 | 2.7 | REACTOME PECAM1 INTERACTIONS | Genes involved in PECAM1 interactions |
| 0.3 | 0.3 | REACTOME APC CDC20 MEDIATED DEGRADATION OF NEK2A | Genes involved in APC-Cdc20 mediated degradation of Nek2A |
| 0.3 | 27.4 | REACTOME PEPTIDE CHAIN ELONGATION | Genes involved in Peptide chain elongation |
| 0.2 | 9.1 | REACTOME ANTIGEN ACTIVATES B CELL RECEPTOR LEADING TO GENERATION OF SECOND MESSENGERS | Genes involved in Antigen Activates B Cell Receptor Leading to Generation of Second Messengers |
| 0.2 | 2.5 | REACTOME IL 6 SIGNALING | Genes involved in Interleukin-6 signaling |
| 0.2 | 6.8 | REACTOME N GLYCAN ANTENNAE ELONGATION | Genes involved in N-Glycan antennae elongation |
| 0.2 | 16.7 | REACTOME IL1 SIGNALING | Genes involved in Interleukin-1 signaling |
| 0.2 | 3.7 | REACTOME LIPOPROTEIN METABOLISM | Genes involved in Lipoprotein metabolism |
| 0.2 | 6.5 | REACTOME METABOLISM OF PORPHYRINS | Genes involved in Metabolism of porphyrins |
| 0.2 | 4.2 | REACTOME P2Y RECEPTORS | Genes involved in P2Y receptors |
| 0.2 | 7.3 | REACTOME DEGRADATION OF THE EXTRACELLULAR MATRIX | Genes involved in Degradation of the extracellular matrix |
| 0.2 | 3.3 | REACTOME ACTIVATION OF CHAPERONE GENES BY ATF6 ALPHA | Genes involved in Activation of Chaperone Genes by ATF6-alpha |
| 0.2 | 0.6 | REACTOME NUCLEAR EVENTS KINASE AND TRANSCRIPTION FACTOR ACTIVATION | Genes involved in Nuclear Events (kinase and transcription factor activation) |
| 0.2 | 3.6 | REACTOME RIP MEDIATED NFKB ACTIVATION VIA DAI | Genes involved in RIP-mediated NFkB activation via DAI |
| 0.2 | 1.2 | REACTOME ANTIGEN PRESENTATION FOLDING ASSEMBLY AND PEPTIDE LOADING OF CLASS I MHC | Genes involved in Antigen Presentation: Folding, assembly and peptide loading of class I MHC |
| 0.2 | 1.4 | REACTOME TRAFFICKING AND PROCESSING OF ENDOSOMAL TLR | Genes involved in Trafficking and processing of endosomal TLR |
| 0.2 | 1.0 | REACTOME TRAF6 MEDIATED IRF7 ACTIVATION | Genes involved in TRAF6 mediated IRF7 activation |
| 0.2 | 2.2 | REACTOME P53 INDEPENDENT G1 S DNA DAMAGE CHECKPOINT | Genes involved in p53-Independent G1/S DNA damage checkpoint |
| 0.2 | 2.5 | REACTOME GLYCOPROTEIN HORMONES | Genes involved in Glycoprotein hormones |
| 0.2 | 3.6 | REACTOME PURINE RIBONUCLEOSIDE MONOPHOSPHATE BIOSYNTHESIS | Genes involved in Purine ribonucleoside monophosphate biosynthesis |
| 0.2 | 3.5 | REACTOME PYRIMIDINE CATABOLISM | Genes involved in Pyrimidine catabolism |
| 0.2 | 3.3 | REACTOME REVERSIBLE HYDRATION OF CARBON DIOXIDE | Genes involved in Reversible Hydration of Carbon Dioxide |
| 0.2 | 7.5 | REACTOME SYNTHESIS OF PIPS AT THE PLASMA MEMBRANE | Genes involved in Synthesis of PIPs at the plasma membrane |
| 0.2 | 3.4 | REACTOME VEGF LIGAND RECEPTOR INTERACTIONS | Genes involved in VEGF ligand-receptor interactions |
| 0.2 | 12.9 | REACTOME GLUCONEOGENESIS | Genes involved in Gluconeogenesis |
| 0.2 | 3.3 | REACTOME VITAMIN B5 PANTOTHENATE METABOLISM | Genes involved in Vitamin B5 (pantothenate) metabolism |
| 0.2 | 1.1 | REACTOME ACTIVATION OF NF KAPPAB IN B CELLS | Genes involved in Activation of NF-kappaB in B Cells |
| 0.2 | 8.2 | REACTOME NEGATIVE REGULATORS OF RIG I MDA5 SIGNALING | Genes involved in Negative regulators of RIG-I/MDA5 signaling |
| 0.1 | 0.4 | REACTOME SYNTHESIS OF BILE ACIDS AND BILE SALTS VIA 7ALPHA HYDROXYCHOLESTEROL | Genes involved in Synthesis of bile acids and bile salts via 7alpha-hydroxycholesterol |
| 0.1 | 2.4 | REACTOME ADVANCED GLYCOSYLATION ENDPRODUCT RECEPTOR SIGNALING | Genes involved in Advanced glycosylation endproduct receptor signaling |
| 0.1 | 4.2 | REACTOME SIGNAL REGULATORY PROTEIN SIRP FAMILY INTERACTIONS | Genes involved in Signal regulatory protein (SIRP) family interactions |
| 0.1 | 4.0 | REACTOME REGULATION OF GENE EXPRESSION IN BETA CELLS | Genes involved in Regulation of gene expression in beta cells |
| 0.1 | 9.3 | REACTOME PHASE1 FUNCTIONALIZATION OF COMPOUNDS | Genes involved in Phase 1 - Functionalization of compounds |
| 0.1 | 2.3 | REACTOME REMOVAL OF THE FLAP INTERMEDIATE FROM THE C STRAND | Genes involved in Removal of the Flap Intermediate from the C-strand |
| 0.1 | 5.8 | REACTOME COSTIMULATION BY THE CD28 FAMILY | Genes involved in Costimulation by the CD28 family |
| 0.1 | 0.8 | REACTOME PKB MEDIATED EVENTS | Genes involved in PKB-mediated events |
| 0.1 | 4.5 | REACTOME LIPID DIGESTION MOBILIZATION AND TRANSPORT | Genes involved in Lipid digestion, mobilization, and transport |
| 0.1 | 0.3 | REACTOME MRNA DECAY BY 3 TO 5 EXORIBONUCLEASE | Genes involved in mRNA Decay by 3' to 5' Exoribonuclease |
| 0.1 | 1.0 | REACTOME REGULATION OF KIT SIGNALING | Genes involved in Regulation of KIT signaling |
| 0.1 | 3.5 | REACTOME ORGANIC CATION ANION ZWITTERION TRANSPORT | Genes involved in Organic cation/anion/zwitterion transport |
| 0.1 | 1.8 | REACTOME CDC6 ASSOCIATION WITH THE ORC ORIGIN COMPLEX | Genes involved in CDC6 association with the ORC:origin complex |
| 0.1 | 4.4 | REACTOME SRP DEPENDENT COTRANSLATIONAL PROTEIN TARGETING TO MEMBRANE | Genes involved in SRP-dependent cotranslational protein targeting to membrane |
| 0.1 | 4.7 | REACTOME TRANSPORT TO THE GOLGI AND SUBSEQUENT MODIFICATION | Genes involved in Transport to the Golgi and subsequent modification |
| 0.1 | 1.0 | REACTOME PROCESSIVE SYNTHESIS ON THE LAGGING STRAND | Genes involved in Processive synthesis on the lagging strand |
| 0.1 | 0.2 | REACTOME VIF MEDIATED DEGRADATION OF APOBEC3G | Genes involved in Vif-mediated degradation of APOBEC3G |
| 0.1 | 16.0 | REACTOME NUCLEAR RECEPTOR TRANSCRIPTION PATHWAY | Genes involved in Nuclear Receptor transcription pathway |
| 0.1 | 2.3 | REACTOME OXYGEN DEPENDENT PROLINE HYDROXYLATION OF HYPOXIA INDUCIBLE FACTOR ALPHA | Genes involved in Oxygen-dependent Proline Hydroxylation of Hypoxia-inducible Factor Alpha |
| 0.1 | 1.1 | REACTOME N GLYCAN TRIMMING IN THE ER AND CALNEXIN CALRETICULIN CYCLE | Genes involved in N-glycan trimming in the ER and Calnexin/Calreticulin cycle |
| 0.1 | 1.8 | REACTOME MITOCHONDRIAL FATTY ACID BETA OXIDATION | Genes involved in Mitochondrial Fatty Acid Beta-Oxidation |
| 0.1 | 4.8 | REACTOME YAP1 AND WWTR1 TAZ STIMULATED GENE EXPRESSION | Genes involved in YAP1- and WWTR1 (TAZ)-stimulated gene expression |
| 0.1 | 1.6 | REACTOME G ALPHA Q SIGNALLING EVENTS | Genes involved in G alpha (q) signalling events |
| 0.1 | 0.6 | REACTOME TRANSPORT OF MATURE MRNA DERIVED FROM AN INTRONLESS TRANSCRIPT | Genes involved in Transport of Mature mRNA Derived from an Intronless Transcript |
| 0.1 | 3.8 | REACTOME TRANSCRIPTIONAL REGULATION OF WHITE ADIPOCYTE DIFFERENTIATION | Genes involved in Transcriptional Regulation of White Adipocyte Differentiation |
| 0.1 | 3.1 | REACTOME GROWTH HORMONE RECEPTOR SIGNALING | Genes involved in Growth hormone receptor signaling |
| 0.1 | 0.6 | REACTOME G2 M DNA DAMAGE CHECKPOINT | Genes involved in G2/M DNA damage checkpoint |
| 0.1 | 4.1 | REACTOME ASPARAGINE N LINKED GLYCOSYLATION | Genes involved in Asparagine N-linked glycosylation |
| 0.1 | 0.6 | REACTOME CTNNB1 PHOSPHORYLATION CASCADE | Genes involved in Beta-catenin phosphorylation cascade |
| 0.1 | 0.5 | REACTOME IL 2 SIGNALING | Genes involved in Interleukin-2 signaling |
| 0.1 | 4.1 | REACTOME INTRINSIC PATHWAY FOR APOPTOSIS | Genes involved in Intrinsic Pathway for Apoptosis |
| 0.1 | 1.6 | REACTOME METABOLISM OF POLYAMINES | Genes involved in Metabolism of polyamines |
| 0.1 | 26.3 | REACTOME CLASS A1 RHODOPSIN LIKE RECEPTORS | Genes involved in Class A/1 (Rhodopsin-like receptors) |
| 0.1 | 4.2 | REACTOME KINESINS | Genes involved in Kinesins |
| 0.1 | 1.2 | REACTOME TGF BETA RECEPTOR SIGNALING IN EMT EPITHELIAL TO MESENCHYMAL TRANSITION | Genes involved in TGF-beta receptor signaling in EMT (epithelial to mesenchymal transition) |
| 0.1 | 2.0 | REACTOME MRNA DECAY BY 5 TO 3 EXORIBONUCLEASE | Genes involved in mRNA Decay by 5' to 3' Exoribonuclease |
| 0.1 | 5.0 | REACTOME SMAD2 SMAD3 SMAD4 HETEROTRIMER REGULATES TRANSCRIPTION | Genes involved in SMAD2/SMAD3:SMAD4 heterotrimer regulates transcription |
| 0.1 | 1.3 | REACTOME SIGNALING BY NOTCH4 | Genes involved in Signaling by NOTCH4 |
| 0.1 | 1.7 | REACTOME RESOLUTION OF AP SITES VIA THE MULTIPLE NUCLEOTIDE PATCH REPLACEMENT PATHWAY | Genes involved in Resolution of AP sites via the multiple-nucleotide patch replacement pathway |
| 0.1 | 2.4 | REACTOME DESTABILIZATION OF MRNA BY AUF1 HNRNP D0 | Genes involved in Destabilization of mRNA by AUF1 (hnRNP D0) |
| 0.1 | 0.6 | REACTOME REGULATION OF IFNA SIGNALING | Genes involved in Regulation of IFNA signaling |
| 0.1 | 1.7 | REACTOME REGULATION OF BETA CELL DEVELOPMENT | Genes involved in Regulation of beta-cell development |
| 0.1 | 0.3 | REACTOME SCF BETA TRCP MEDIATED DEGRADATION OF EMI1 | Genes involved in SCF-beta-TrCP mediated degradation of Emi1 |
| 0.1 | 1.9 | REACTOME GPVI MEDIATED ACTIVATION CASCADE | Genes involved in GPVI-mediated activation cascade |
| 0.1 | 2.2 | REACTOME CITRIC ACID CYCLE TCA CYCLE | Genes involved in Citric acid cycle (TCA cycle) |
| 0.1 | 3.2 | REACTOME KERATAN SULFATE KERATIN METABOLISM | Genes involved in Keratan sulfate/keratin metabolism |
| 0.1 | 3.9 | REACTOME REGULATION OF GLUCOKINASE BY GLUCOKINASE REGULATORY PROTEIN | Genes involved in Regulation of Glucokinase by Glucokinase Regulatory Protein |
| 0.1 | 0.7 | REACTOME SYNTHESIS SECRETION AND DEACYLATION OF GHRELIN | Genes involved in Synthesis, Secretion, and Deacylation of Ghrelin |
| 0.1 | 3.5 | REACTOME REGULATION OF MITOTIC CELL CYCLE | Genes involved in Regulation of mitotic cell cycle |
| 0.1 | 2.0 | REACTOME G BETA GAMMA SIGNALLING THROUGH PI3KGAMMA | Genes involved in G beta:gamma signalling through PI3Kgamma |
| 0.1 | 9.4 | REACTOME PPARA ACTIVATES GENE EXPRESSION | Genes involved in PPARA Activates Gene Expression |
| 0.1 | 0.2 | REACTOME ACTIVATION OF THE MRNA UPON BINDING OF THE CAP BINDING COMPLEX AND EIFS AND SUBSEQUENT BINDING TO 43S | Genes involved in Activation of the mRNA upon binding of the cap-binding complex and eIFs, and subsequent binding to 43S |
| 0.1 | 1.5 | REACTOME BILE SALT AND ORGANIC ANION SLC TRANSPORTERS | Genes involved in Bile salt and organic anion SLC transporters |
| 0.1 | 2.4 | REACTOME ZINC TRANSPORTERS | Genes involved in Zinc transporters |
| 0.1 | 1.4 | REACTOME SEMA3A PAK DEPENDENT AXON REPULSION | Genes involved in Sema3A PAK dependent Axon repulsion |
| 0.1 | 1.3 | REACTOME THE ACTIVATION OF ARYLSULFATASES | Genes involved in The activation of arylsulfatases |
| 0.1 | 1.7 | REACTOME METABOLISM OF STEROID HORMONES AND VITAMINS A AND D | Genes involved in Metabolism of steroid hormones and vitamins A and D |
| 0.1 | 0.3 | REACTOME HYALURONAN METABOLISM | Genes involved in Hyaluronan metabolism |
| 0.1 | 0.4 | REACTOME REGULATION OF THE FANCONI ANEMIA PATHWAY | Genes involved in Regulation of the Fanconi anemia pathway |
| 0.1 | 2.2 | REACTOME EFFECTS OF PIP2 HYDROLYSIS | Genes involved in Effects of PIP2 hydrolysis |
| 0.1 | 1.3 | REACTOME G1 S SPECIFIC TRANSCRIPTION | Genes involved in G1/S-Specific Transcription |
| 0.1 | 2.2 | REACTOME INCRETIN SYNTHESIS SECRETION AND INACTIVATION | Genes involved in Incretin Synthesis, Secretion, and Inactivation |
| 0.1 | 0.4 | REACTOME SPRY REGULATION OF FGF SIGNALING | Genes involved in Spry regulation of FGF signaling |
| 0.1 | 0.3 | REACTOME ACYL CHAIN REMODELLING OF PG | Genes involved in Acyl chain remodelling of PG |
| 0.1 | 16.6 | REACTOME OLFACTORY SIGNALING PATHWAY | Genes involved in Olfactory Signaling Pathway |
| 0.1 | 1.0 | REACTOME SLBP DEPENDENT PROCESSING OF REPLICATION DEPENDENT HISTONE PRE MRNAS | Genes involved in SLBP Dependent Processing of Replication-Dependent Histone Pre-mRNAs |
| 0.1 | 1.3 | REACTOME TANDEM PORE DOMAIN POTASSIUM CHANNELS | Genes involved in Tandem pore domain potassium channels |
| 0.1 | 0.9 | REACTOME PYRIMIDINE METABOLISM | Genes involved in Pyrimidine metabolism |
| 0.1 | 1.6 | REACTOME DEPOSITION OF NEW CENPA CONTAINING NUCLEOSOMES AT THE CENTROMERE | Genes involved in Deposition of New CENPA-containing Nucleosomes at the Centromere |
| 0.1 | 0.8 | REACTOME SIGNALING BY ILS | Genes involved in Signaling by Interleukins |
| 0.1 | 1.3 | REACTOME PURINE SALVAGE | Genes involved in Purine salvage |
| 0.0 | 0.5 | REACTOME TETRAHYDROBIOPTERIN BH4 SYNTHESIS RECYCLING SALVAGE AND REGULATION | Genes involved in Tetrahydrobiopterin (BH4) synthesis, recycling, salvage and regulation |
| 0.0 | 3.4 | REACTOME ACTIVATION OF CHAPERONE GENES BY XBP1S | Genes involved in Activation of Chaperone Genes by XBP1(S) |
| 0.0 | 0.5 | REACTOME COPI MEDIATED TRANSPORT | Genes involved in COPI Mediated Transport |
| 0.0 | 3.6 | REACTOME METABOLISM OF VITAMINS AND COFACTORS | Genes involved in Metabolism of vitamins and cofactors |
| 0.0 | 0.4 | REACTOME ROLE OF SECOND MESSENGERS IN NETRIN1 SIGNALING | Genes involved in Role of second messengers in netrin-1 signaling |
| 0.0 | 5.7 | REACTOME FACTORS INVOLVED IN MEGAKARYOCYTE DEVELOPMENT AND PLATELET PRODUCTION | Genes involved in Factors involved in megakaryocyte development and platelet production |
| 0.0 | 0.3 | REACTOME RNA POL I PROMOTER OPENING | Genes involved in RNA Polymerase I Promoter Opening |
| 0.0 | 1.0 | REACTOME GLYCOGEN BREAKDOWN GLYCOGENOLYSIS | Genes involved in Glycogen breakdown (glycogenolysis) |
| 0.0 | 1.0 | REACTOME CASPASE MEDIATED CLEAVAGE OF CYTOSKELETAL PROTEINS | Genes involved in Caspase-mediated cleavage of cytoskeletal proteins |
| 0.0 | 2.3 | REACTOME NOTCH1 INTRACELLULAR DOMAIN REGULATES TRANSCRIPTION | Genes involved in NOTCH1 Intracellular Domain Regulates Transcription |
| 0.0 | 1.7 | REACTOME ABC FAMILY PROTEINS MEDIATED TRANSPORT | Genes involved in ABC-family proteins mediated transport |
| 0.0 | 0.2 | REACTOME SYNTHESIS OF PA | Genes involved in Synthesis of PA |
| 0.0 | 0.4 | REACTOME CYCLIN A B1 ASSOCIATED EVENTS DURING G2 M TRANSITION | Genes involved in Cyclin A/B1 associated events during G2/M transition |
| 0.0 | 0.7 | REACTOME TRANSLATION | Genes involved in Translation |
| 0.0 | 0.9 | REACTOME MITOCHONDRIAL TRNA AMINOACYLATION | Genes involved in Mitochondrial tRNA aminoacylation |
| 0.0 | 2.1 | REACTOME CELL SURFACE INTERACTIONS AT THE VASCULAR WALL | Genes involved in Cell surface interactions at the vascular wall |
| 0.0 | 2.1 | REACTOME BIOLOGICAL OXIDATIONS | Genes involved in Biological oxidations |
| 0.0 | 0.2 | REACTOME AKT PHOSPHORYLATES TARGETS IN THE CYTOSOL | Genes involved in AKT phosphorylates targets in the cytosol |
| 0.0 | 0.5 | REACTOME ALPHA LINOLENIC ACID ALA METABOLISM | Genes involved in alpha-linolenic acid (ALA) metabolism |
| 0.0 | 1.8 | REACTOME ASSOCIATION OF TRIC CCT WITH TARGET PROTEINS DURING BIOSYNTHESIS | Genes involved in Association of TriC/CCT with target proteins during biosynthesis |
| 0.0 | 0.4 | REACTOME ENOS ACTIVATION AND REGULATION | Genes involved in eNOS activation and regulation |
| 0.0 | 2.7 | REACTOME MITOTIC PROMETAPHASE | Genes involved in Mitotic Prometaphase |
| 0.0 | 0.9 | REACTOME DEADENYLATION OF MRNA | Genes involved in Deadenylation of mRNA |
| 0.0 | 0.9 | REACTOME MEIOTIC RECOMBINATION | Genes involved in Meiotic Recombination |
| 0.0 | 0.5 | REACTOME PKA MEDIATED PHOSPHORYLATION OF CREB | Genes involved in PKA-mediated phosphorylation of CREB |
| 0.0 | 1.9 | REACTOME RESPIRATORY ELECTRON TRANSPORT ATP SYNTHESIS BY CHEMIOSMOTIC COUPLING AND HEAT PRODUCTION BY UNCOUPLING PROTEINS | Genes involved in Respiratory electron transport, ATP synthesis by chemiosmotic coupling, and heat production by uncoupling proteins. |
| 0.0 | 0.7 | REACTOME NEPHRIN INTERACTIONS | Genes involved in Nephrin interactions |
| 0.0 | 0.2 | REACTOME ERKS ARE INACTIVATED | Genes involved in ERKs are inactivated |
| 0.0 | 0.3 | REACTOME G0 AND EARLY G1 | Genes involved in G0 and Early G1 |
| 0.0 | 0.4 | REACTOME SYNTHESIS OF PE | Genes involved in Synthesis of PE |
| 0.0 | 0.6 | REACTOME APOPTOTIC CLEAVAGE OF CELLULAR PROTEINS | Genes involved in Apoptotic cleavage of cellular proteins |
| 0.0 | 0.1 | REACTOME REGULATION OF HYPOXIA INDUCIBLE FACTOR HIF BY OXYGEN | Genes involved in Regulation of Hypoxia-inducible Factor (HIF) by Oxygen |
| 0.0 | 0.1 | REACTOME CIRCADIAN CLOCK | Genes involved in Circadian Clock |