Project
Illumina Body Map 2 (GSE30611)
Navigation
Downloads
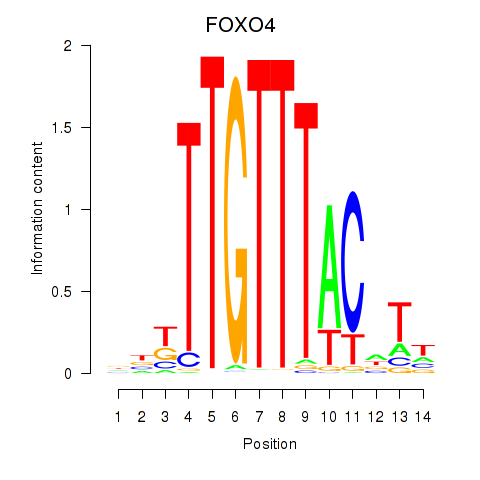
Results for FOXO4
Z-value: 1.34
Motif logo
Transcription factors associated with FOXO4
| Gene Symbol | Gene ID | Gene Info |
|---|---|---|
|
FOXO4
|
ENSG00000184481.17 | forkhead box O4 |
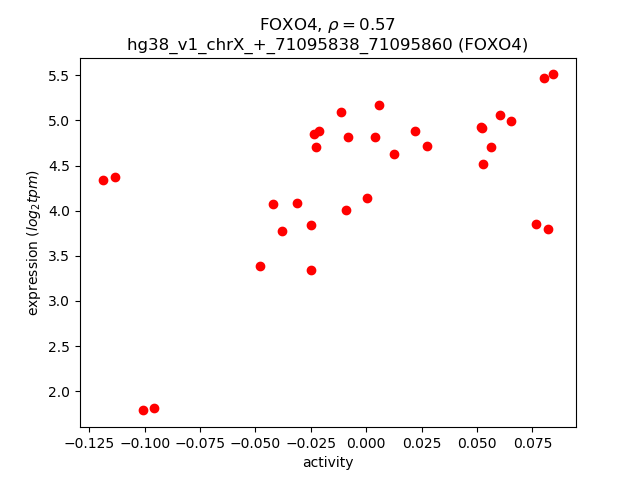
Activity-expression correlation:
| Gene | Promoter | Pearson corr. coef. | P-value | Plot |
|---|---|---|---|---|
| FOXO4 | hg38_v1_chrX_+_71095838_71095860 | 0.57 | 5.9e-04 | Click! |
Activity profile of FOXO4 motif
Sorted Z-values of FOXO4 motif
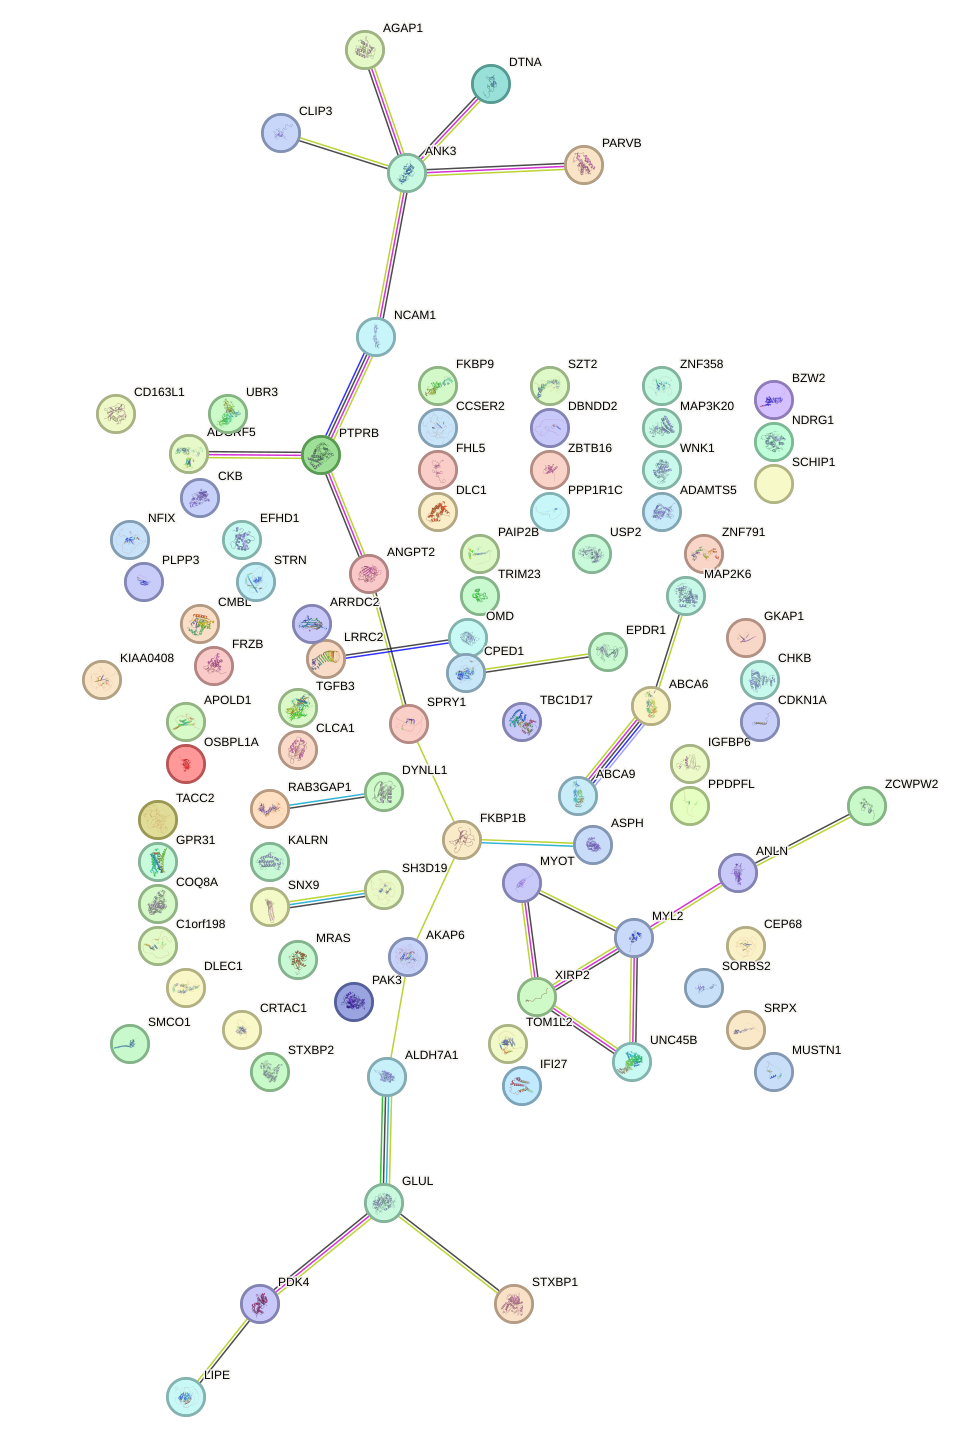
Network of associatons between targets according to the STRING database.
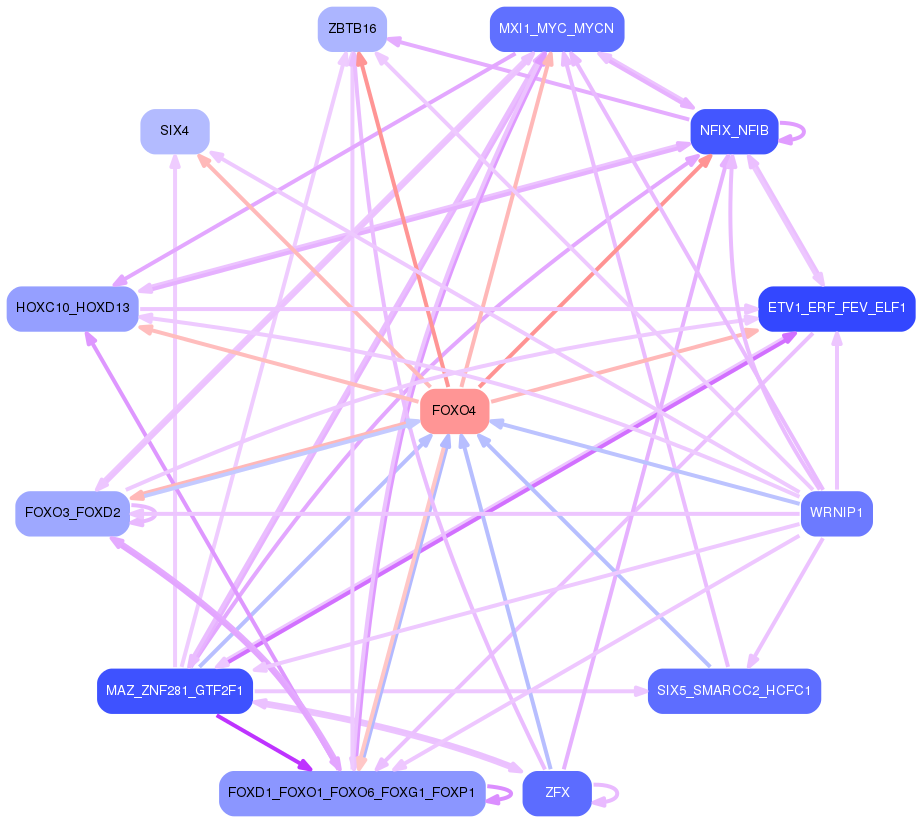
First level regulatory network of FOXO4
Gene Ontology Analysis
Gene overrepresentation in biological process category:
| Log-likelihood per target | Total log-likelihood | Term | Description |
|---|---|---|---|
| 1.7 | 6.9 | GO:0006542 | glutamine biosynthetic process(GO:0006542) |
| 1.2 | 3.5 | GO:0050928 | negative regulation of positive chemotaxis(GO:0050928) |
| 0.6 | 2.9 | GO:0060940 | epithelial to mesenchymal transition involved in cardiac fibroblast development(GO:0060940) |
| 0.6 | 2.3 | GO:0031455 | glycine betaine biosynthetic process from choline(GO:0019285) glycine betaine metabolic process(GO:0031455) glycine betaine biosynthetic process(GO:0031456) |
| 0.5 | 2.2 | GO:0044691 | tooth eruption(GO:0044691) |
| 0.5 | 3.6 | GO:1903296 | regulation of glutamate secretion, neurotransmission(GO:1903294) positive regulation of glutamate secretion, neurotransmission(GO:1903296) |
| 0.5 | 3.0 | GO:0051138 | positive regulation of NK T cell differentiation(GO:0051138) |
| 0.5 | 1.4 | GO:0003032 | detection of oxygen(GO:0003032) |
| 0.5 | 2.8 | GO:0002904 | positive regulation of B cell apoptotic process(GO:0002904) |
| 0.4 | 2.2 | GO:1901350 | cell-cell signaling involved in cell-cell junction organization(GO:1901350) |
| 0.4 | 2.9 | GO:0044565 | dendritic cell proliferation(GO:0044565) |
| 0.4 | 3.7 | GO:0060574 | intestinal epithelial cell maturation(GO:0060574) |
| 0.4 | 3.6 | GO:1902261 | positive regulation of delayed rectifier potassium channel activity(GO:1902261) |
| 0.4 | 5.1 | GO:0098735 | positive regulation of the force of heart contraction(GO:0098735) |
| 0.4 | 2.3 | GO:0048014 | Tie signaling pathway(GO:0048014) |
| 0.4 | 1.1 | GO:0001544 | initiation of primordial ovarian follicle growth(GO:0001544) |
| 0.4 | 1.4 | GO:0031106 | septin ring assembly(GO:0000921) septin ring organization(GO:0031106) |
| 0.3 | 2.0 | GO:0090131 | glomerular mesangial cell development(GO:0072144) mesenchyme migration(GO:0090131) |
| 0.3 | 2.9 | GO:1901668 | regulation of superoxide dismutase activity(GO:1901668) |
| 0.3 | 2.5 | GO:1900827 | maintenance of protein location in membrane(GO:0072658) maintenance of protein location in plasma membrane(GO:0072660) positive regulation of membrane depolarization during cardiac muscle cell action potential(GO:1900827) |
| 0.3 | 1.8 | GO:0006127 | glycerophosphate shuttle(GO:0006127) |
| 0.3 | 2.7 | GO:0018230 | peptidyl-L-cysteine S-palmitoylation(GO:0018230) peptidyl-S-diacylglycerol-L-cysteine biosynthetic process from peptidyl-cysteine(GO:0018231) |
| 0.3 | 1.3 | GO:0071596 | ubiquitin-dependent protein catabolic process via the N-end rule pathway(GO:0071596) |
| 0.3 | 1.1 | GO:0086097 | phospholipase C-activating angiotensin-activated signaling pathway(GO:0086097) |
| 0.3 | 1.0 | GO:0061055 | myotome development(GO:0061055) |
| 0.2 | 1.0 | GO:1900535 | medium-chain fatty-acyl-CoA catabolic process(GO:0036114) long-chain fatty-acyl-CoA catabolic process(GO:0036116) palmitic acid metabolic process(GO:1900533) palmitic acid biosynthetic process(GO:1900535) |
| 0.2 | 1.9 | GO:0030644 | cellular chloride ion homeostasis(GO:0030644) |
| 0.2 | 2.9 | GO:0046959 | habituation(GO:0046959) negative regulation of growth hormone secretion(GO:0060125) |
| 0.2 | 0.9 | GO:2000393 | negative regulation of lamellipodium morphogenesis(GO:2000393) |
| 0.2 | 4.9 | GO:0010510 | regulation of acetyl-CoA biosynthetic process from pyruvate(GO:0010510) |
| 0.2 | 1.1 | GO:0072709 | cellular response to sorbitol(GO:0072709) |
| 0.2 | 0.7 | GO:0006533 | aspartate catabolic process(GO:0006533) |
| 0.2 | 1.1 | GO:1901662 | phylloquinone metabolic process(GO:0042374) phylloquinone catabolic process(GO:0042376) quinone catabolic process(GO:1901662) |
| 0.2 | 0.6 | GO:1903537 | meiotic spindle elongation(GO:0051232) meiotic cell cycle process involved in oocyte maturation(GO:1903537) regulation of meiotic cell cycle process involved in oocyte maturation(GO:1903538) |
| 0.2 | 0.6 | GO:1904425 | negative regulation of GTP binding(GO:1904425) |
| 0.2 | 0.8 | GO:0046603 | negative regulation of mitotic centrosome separation(GO:0046603) |
| 0.2 | 0.8 | GO:0048789 | cytoskeletal matrix organization at active zone(GO:0048789) neurexin clustering involved in presynaptic membrane assembly(GO:0097115) retrograde trans-synaptic signaling by soluble gas(GO:0098923) retrograde trans-synaptic signaling by trans-synaptic protein complex(GO:0098942) trans-synaptic signaling by soluble gas(GO:0099543) |
| 0.2 | 1.2 | GO:0023016 | signal transduction by trans-phosphorylation(GO:0023016) |
| 0.2 | 0.7 | GO:1903487 | regulation of lactation(GO:1903487) |
| 0.2 | 1.3 | GO:0042264 | peptidyl-aspartic acid hydroxylation(GO:0042264) |
| 0.2 | 5.3 | GO:0051044 | positive regulation of membrane protein ectodomain proteolysis(GO:0051044) |
| 0.2 | 2.9 | GO:1901898 | negative regulation of relaxation of cardiac muscle(GO:1901898) |
| 0.2 | 1.8 | GO:0060244 | negative regulation of cell proliferation involved in contact inhibition(GO:0060244) |
| 0.2 | 1.8 | GO:0042758 | long-chain fatty acid catabolic process(GO:0042758) |
| 0.2 | 1.8 | GO:0060029 | convergent extension involved in organogenesis(GO:0060029) |
| 0.2 | 1.0 | GO:0098746 | fast, calcium ion-dependent exocytosis of neurotransmitter(GO:0098746) |
| 0.2 | 0.5 | GO:0019417 | sulfur oxidation(GO:0019417) |
| 0.2 | 1.8 | GO:0071073 | positive regulation of phospholipid biosynthetic process(GO:0071073) |
| 0.2 | 0.8 | GO:0016240 | autophagosome docking(GO:0016240) |
| 0.1 | 0.4 | GO:2000438 | CD24 biosynthetic process(GO:0035724) activation of meiosis involved in egg activation(GO:0060466) negative regulation of monocyte extravasation(GO:2000438) regulation of CD24 biosynthetic process(GO:2000559) positive regulation of CD24 biosynthetic process(GO:2000560) |
| 0.1 | 0.4 | GO:0031550 | positive regulation of brain-derived neurotrophic factor receptor signaling pathway(GO:0031550) |
| 0.1 | 0.9 | GO:0014846 | esophagus smooth muscle contraction(GO:0014846) |
| 0.1 | 0.9 | GO:0018032 | protein amidation(GO:0018032) |
| 0.1 | 0.8 | GO:0042109 | lymphotoxin A production(GO:0032641) lymphotoxin A biosynthetic process(GO:0042109) |
| 0.1 | 5.7 | GO:0003298 | physiological muscle hypertrophy(GO:0003298) physiological cardiac muscle hypertrophy(GO:0003301) cell growth involved in cardiac muscle cell development(GO:0061049) |
| 0.1 | 0.8 | GO:0048133 | germ-line stem cell division(GO:0042078) male germ-line stem cell asymmetric division(GO:0048133) regulation of branching involved in mammary gland duct morphogenesis(GO:0060762) germline stem cell asymmetric division(GO:0098728) |
| 0.1 | 0.2 | GO:0031990 | mRNA export from nucleus in response to heat stress(GO:0031990) |
| 0.1 | 3.6 | GO:0042118 | endothelial cell activation(GO:0042118) |
| 0.1 | 1.3 | GO:0071963 | establishment or maintenance of cell polarity regulating cell shape(GO:0071963) |
| 0.1 | 1.0 | GO:0072513 | positive regulation of secondary heart field cardioblast proliferation(GO:0072513) |
| 0.1 | 1.4 | GO:0008354 | germ cell migration(GO:0008354) |
| 0.1 | 1.1 | GO:0060770 | negative regulation of epithelial cell proliferation involved in prostate gland development(GO:0060770) |
| 0.1 | 0.4 | GO:2000638 | regulation of SREBP signaling pathway(GO:2000638) negative regulation of SREBP signaling pathway(GO:2000639) |
| 0.1 | 0.4 | GO:1905150 | regulation of voltage-gated sodium channel activity(GO:1905150) |
| 0.1 | 0.3 | GO:1902173 | negative regulation of keratinocyte apoptotic process(GO:1902173) |
| 0.1 | 0.8 | GO:0051684 | maintenance of Golgi location(GO:0051684) |
| 0.1 | 2.0 | GO:0042340 | keratan sulfate catabolic process(GO:0042340) |
| 0.1 | 0.4 | GO:0032747 | positive regulation of interleukin-23 production(GO:0032747) |
| 0.1 | 0.4 | GO:2000097 | regulation of smooth muscle cell-matrix adhesion(GO:2000097) |
| 0.1 | 0.9 | GO:0009597 | detection of virus(GO:0009597) |
| 0.1 | 0.6 | GO:0097428 | protein maturation by iron-sulfur cluster transfer(GO:0097428) |
| 0.1 | 1.8 | GO:0045475 | locomotor rhythm(GO:0045475) |
| 0.1 | 0.3 | GO:0045175 | basal protein localization(GO:0045175) |
| 0.1 | 1.8 | GO:0010457 | centriole-centriole cohesion(GO:0010457) |
| 0.1 | 1.3 | GO:0090232 | positive regulation of spindle checkpoint(GO:0090232) |
| 0.1 | 0.2 | GO:1904717 | excitatory chemical synaptic transmission(GO:0098976) regulation of AMPA glutamate receptor clustering(GO:1904717) positive regulation of AMPA glutamate receptor clustering(GO:1904719) |
| 0.1 | 0.2 | GO:1901069 | guanosine-containing compound catabolic process(GO:1901069) |
| 0.1 | 4.7 | GO:0007274 | neuromuscular synaptic transmission(GO:0007274) |
| 0.1 | 0.5 | GO:0061083 | regulation of protein refolding(GO:0061083) negative regulation of protein refolding(GO:0061084) |
| 0.1 | 1.5 | GO:1900119 | positive regulation of execution phase of apoptosis(GO:1900119) |
| 0.1 | 0.8 | GO:0043985 | histone H4-R3 methylation(GO:0043985) |
| 0.1 | 0.8 | GO:0042536 | negative regulation of tumor necrosis factor biosynthetic process(GO:0042536) |
| 0.1 | 1.3 | GO:0021520 | spinal cord motor neuron cell fate specification(GO:0021520) |
| 0.1 | 3.0 | GO:0045947 | negative regulation of translational initiation(GO:0045947) |
| 0.1 | 2.3 | GO:0043567 | regulation of insulin-like growth factor receptor signaling pathway(GO:0043567) |
| 0.1 | 1.0 | GO:0007258 | JUN phosphorylation(GO:0007258) |
| 0.1 | 0.3 | GO:0035853 | chromosome passenger complex localization to spindle midzone(GO:0035853) |
| 0.1 | 0.7 | GO:0032525 | somite rostral/caudal axis specification(GO:0032525) |
| 0.1 | 5.5 | GO:0000381 | regulation of alternative mRNA splicing, via spliceosome(GO:0000381) |
| 0.1 | 3.3 | GO:0035115 | embryonic forelimb morphogenesis(GO:0035115) |
| 0.1 | 0.4 | GO:0032468 | Golgi calcium ion homeostasis(GO:0032468) |
| 0.1 | 0.5 | GO:0033564 | anterior/posterior axon guidance(GO:0033564) |
| 0.1 | 0.8 | GO:0001887 | selenium compound metabolic process(GO:0001887) |
| 0.1 | 0.1 | GO:0070245 | positive regulation of thymocyte apoptotic process(GO:0070245) |
| 0.1 | 0.2 | GO:1903567 | negative regulation of protein localization to cilium(GO:1903565) regulation of protein localization to ciliary membrane(GO:1903567) negative regulation of protein localization to ciliary membrane(GO:1903568) |
| 0.1 | 1.0 | GO:0090360 | platelet-derived growth factor production(GO:0090360) regulation of platelet-derived growth factor production(GO:0090361) |
| 0.1 | 2.2 | GO:0042994 | cytoplasmic sequestering of transcription factor(GO:0042994) |
| 0.1 | 0.3 | GO:1902617 | response to fluoride(GO:1902617) |
| 0.1 | 0.4 | GO:0007352 | zygotic specification of dorsal/ventral axis(GO:0007352) |
| 0.0 | 0.7 | GO:0006600 | creatine metabolic process(GO:0006600) |
| 0.0 | 0.6 | GO:2001106 | regulation of Rho guanyl-nucleotide exchange factor activity(GO:2001106) |
| 0.0 | 0.4 | GO:0044211 | CTP salvage(GO:0044211) |
| 0.0 | 1.3 | GO:0035988 | chondrocyte proliferation(GO:0035988) |
| 0.0 | 1.4 | GO:0006744 | ubiquinone biosynthetic process(GO:0006744) quinone biosynthetic process(GO:1901663) |
| 0.0 | 1.0 | GO:0048172 | regulation of short-term neuronal synaptic plasticity(GO:0048172) |
| 0.0 | 0.2 | GO:1903173 | phytol metabolic process(GO:0033306) fatty alcohol metabolic process(GO:1903173) |
| 0.0 | 0.3 | GO:0010966 | regulation of phosphate transport(GO:0010966) |
| 0.0 | 0.8 | GO:2001224 | positive regulation of neuron migration(GO:2001224) |
| 0.0 | 1.1 | GO:0048935 | peripheral nervous system neuron differentiation(GO:0048934) peripheral nervous system neuron development(GO:0048935) |
| 0.0 | 0.8 | GO:0046007 | negative regulation of activated T cell proliferation(GO:0046007) |
| 0.0 | 0.5 | GO:0045792 | negative regulation of cell size(GO:0045792) |
| 0.0 | 0.2 | GO:0009257 | 10-formyltetrahydrofolate biosynthetic process(GO:0009257) |
| 0.0 | 0.7 | GO:2000480 | negative regulation of cAMP-dependent protein kinase activity(GO:2000480) |
| 0.0 | 0.6 | GO:0035860 | glial cell-derived neurotrophic factor receptor signaling pathway(GO:0035860) |
| 0.0 | 0.7 | GO:0042407 | cristae formation(GO:0042407) |
| 0.0 | 1.2 | GO:0017121 | phospholipid scrambling(GO:0017121) |
| 0.0 | 2.5 | GO:0006699 | bile acid biosynthetic process(GO:0006699) |
| 0.0 | 0.5 | GO:1901621 | negative regulation of smoothened signaling pathway involved in dorsal/ventral neural tube patterning(GO:1901621) |
| 0.0 | 2.7 | GO:0045839 | negative regulation of mitotic nuclear division(GO:0045839) |
| 0.0 | 0.3 | GO:0031860 | telomeric 3' overhang formation(GO:0031860) |
| 0.0 | 2.1 | GO:1900087 | positive regulation of G1/S transition of mitotic cell cycle(GO:1900087) |
| 0.0 | 5.2 | GO:0061077 | chaperone-mediated protein folding(GO:0061077) |
| 0.0 | 9.0 | GO:0021987 | cerebral cortex development(GO:0021987) |
| 0.0 | 2.2 | GO:0046825 | regulation of protein export from nucleus(GO:0046825) |
| 0.0 | 0.3 | GO:0016584 | nucleosome positioning(GO:0016584) |
| 0.0 | 0.1 | GO:0007343 | egg activation(GO:0007343) |
| 0.0 | 3.4 | GO:0070830 | bicellular tight junction assembly(GO:0070830) |
| 0.0 | 0.2 | GO:2001034 | positive regulation of double-strand break repair via nonhomologous end joining(GO:2001034) |
| 0.0 | 2.2 | GO:0042733 | embryonic digit morphogenesis(GO:0042733) |
| 0.0 | 0.4 | GO:1901740 | negative regulation of syncytium formation by plasma membrane fusion(GO:0034242) negative regulation of myoblast fusion(GO:1901740) regulation of hepatocyte apoptotic process(GO:1903943) negative regulation of hepatocyte apoptotic process(GO:1903944) |
| 0.0 | 0.1 | GO:0042270 | protection from natural killer cell mediated cytotoxicity(GO:0042270) |
| 0.0 | 0.3 | GO:0061484 | hematopoietic stem cell homeostasis(GO:0061484) |
| 0.0 | 1.1 | GO:0089711 | L-glutamate transmembrane transport(GO:0089711) |
| 0.0 | 2.9 | GO:0045600 | positive regulation of fat cell differentiation(GO:0045600) |
| 0.0 | 0.8 | GO:0045663 | positive regulation of myoblast differentiation(GO:0045663) |
| 0.0 | 1.1 | GO:0050667 | homocysteine metabolic process(GO:0050667) |
| 0.0 | 0.1 | GO:0043335 | protein unfolding(GO:0043335) |
| 0.0 | 0.2 | GO:0051835 | positive regulation of synapse structural plasticity(GO:0051835) |
| 0.0 | 0.5 | GO:0021957 | corticospinal tract morphogenesis(GO:0021957) |
| 0.0 | 0.3 | GO:0038007 | netrin-activated signaling pathway(GO:0038007) |
| 0.0 | 0.1 | GO:0048162 | preantral ovarian follicle growth(GO:0001546) multi-layer follicle stage(GO:0048162) |
| 0.0 | 3.1 | GO:0042147 | retrograde transport, endosome to Golgi(GO:0042147) |
| 0.0 | 4.1 | GO:1902476 | chloride transmembrane transport(GO:1902476) |
| 0.0 | 0.8 | GO:0016339 | calcium-dependent cell-cell adhesion via plasma membrane cell adhesion molecules(GO:0016339) |
| 0.0 | 0.2 | GO:0045198 | establishment of epithelial cell apical/basal polarity(GO:0045198) |
| 0.0 | 0.6 | GO:0070734 | histone H3-K27 methylation(GO:0070734) |
| 0.0 | 1.8 | GO:0045840 | positive regulation of mitotic nuclear division(GO:0045840) |
| 0.0 | 0.6 | GO:0033119 | negative regulation of RNA splicing(GO:0033119) |
| 0.0 | 1.7 | GO:0003281 | ventricular septum development(GO:0003281) |
| 0.0 | 1.1 | GO:0031572 | G2 DNA damage checkpoint(GO:0031572) |
| 0.0 | 0.7 | GO:0060292 | long term synaptic depression(GO:0060292) |
| 0.0 | 0.1 | GO:0030071 | regulation of mitotic metaphase/anaphase transition(GO:0030071) |
| 0.0 | 0.8 | GO:0019228 | neuronal action potential(GO:0019228) |
| 0.0 | 2.2 | GO:1990830 | response to leukemia inhibitory factor(GO:1990823) cellular response to leukemia inhibitory factor(GO:1990830) |
| 0.0 | 0.3 | GO:0052695 | cellular glucuronidation(GO:0052695) |
| 0.0 | 2.1 | GO:0006805 | xenobiotic metabolic process(GO:0006805) |
| 0.0 | 0.1 | GO:0010265 | SCF complex assembly(GO:0010265) |
| 0.0 | 0.6 | GO:0042462 | eye photoreceptor cell development(GO:0042462) |
| 0.0 | 0.4 | GO:0071425 | hematopoietic stem cell proliferation(GO:0071425) |
| 0.0 | 1.0 | GO:0007040 | lysosome organization(GO:0007040) lytic vacuole organization(GO:0080171) |
| 0.0 | 0.7 | GO:0015701 | bicarbonate transport(GO:0015701) |
| 0.0 | 0.4 | GO:0000083 | regulation of transcription involved in G1/S transition of mitotic cell cycle(GO:0000083) |
| 0.0 | 0.5 | GO:0035329 | hippo signaling(GO:0035329) |
| 0.0 | 1.8 | GO:0060333 | interferon-gamma-mediated signaling pathway(GO:0060333) |
| 0.0 | 0.2 | GO:0007144 | female meiosis I(GO:0007144) |
| 0.0 | 0.3 | GO:0007035 | vacuolar acidification(GO:0007035) |
Gene overrepresentation in cellular component category:
| Log-likelihood per target | Total log-likelihood | Term | Description |
|---|---|---|---|
| 0.7 | 3.7 | GO:0070557 | PCNA-p21 complex(GO:0070557) |
| 0.3 | 2.9 | GO:1990130 | Iml1 complex(GO:1990130) |
| 0.3 | 5.1 | GO:0097512 | cardiac myofibril(GO:0097512) |
| 0.3 | 2.0 | GO:0030485 | smooth muscle contractile fiber(GO:0030485) |
| 0.3 | 1.8 | GO:0009331 | glycerol-3-phosphate dehydrogenase complex(GO:0009331) |
| 0.2 | 2.2 | GO:0048787 | presynaptic active zone membrane(GO:0048787) |
| 0.2 | 1.1 | GO:0036398 | TCR signalosome(GO:0036398) |
| 0.2 | 0.8 | GO:0097629 | extrinsic component of omegasome membrane(GO:0097629) |
| 0.2 | 2.2 | GO:0016942 | insulin-like growth factor binding protein complex(GO:0016942) growth factor complex(GO:0036454) |
| 0.1 | 2.8 | GO:0014701 | junctional sarcoplasmic reticulum membrane(GO:0014701) |
| 0.1 | 0.7 | GO:1902937 | inward rectifier potassium channel complex(GO:1902937) |
| 0.1 | 6.9 | GO:0097386 | glial cell projection(GO:0097386) |
| 0.1 | 1.4 | GO:0005826 | actomyosin contractile ring(GO:0005826) |
| 0.1 | 2.9 | GO:0042589 | zymogen granule membrane(GO:0042589) |
| 0.1 | 1.3 | GO:0019907 | cyclin-dependent protein kinase activating kinase holoenzyme complex(GO:0019907) |
| 0.1 | 0.2 | GO:0034657 | GID complex(GO:0034657) |
| 0.1 | 0.7 | GO:0016013 | syntrophin complex(GO:0016013) |
| 0.1 | 1.0 | GO:0060200 | clathrin-sculpted acetylcholine transport vesicle(GO:0060200) clathrin-sculpted acetylcholine transport vesicle membrane(GO:0060201) |
| 0.1 | 0.7 | GO:0061617 | MICOS complex(GO:0061617) |
| 0.1 | 1.3 | GO:0032541 | cortical endoplasmic reticulum(GO:0032541) |
| 0.1 | 1.1 | GO:0070552 | BRISC complex(GO:0070552) |
| 0.1 | 0.5 | GO:0034680 | integrin alpha10-beta1 complex(GO:0034680) |
| 0.1 | 2.5 | GO:0014731 | spectrin-associated cytoskeleton(GO:0014731) |
| 0.1 | 3.7 | GO:0000159 | protein phosphatase type 2A complex(GO:0000159) |
| 0.1 | 0.7 | GO:0036157 | outer dynein arm(GO:0036157) |
| 0.1 | 18.3 | GO:0030018 | Z disc(GO:0030018) |
| 0.1 | 0.4 | GO:1990452 | Parkin-FBXW7-Cul1 ubiquitin ligase complex(GO:1990452) |
| 0.1 | 1.1 | GO:0043020 | NADPH oxidase complex(GO:0043020) |
| 0.1 | 2.3 | GO:0005921 | gap junction(GO:0005921) |
| 0.1 | 1.2 | GO:0098563 | integral component of synaptic vesicle membrane(GO:0030285) intrinsic component of synaptic vesicle membrane(GO:0098563) |
| 0.0 | 0.7 | GO:0030478 | actin cap(GO:0030478) |
| 0.0 | 1.4 | GO:0071782 | endoplasmic reticulum tubular network(GO:0071782) |
| 0.0 | 5.5 | GO:0099501 | synaptic vesicle membrane(GO:0030672) exocytic vesicle membrane(GO:0099501) |
| 0.0 | 0.3 | GO:0000221 | vacuolar proton-transporting V-type ATPase, V1 domain(GO:0000221) |
| 0.0 | 2.5 | GO:0009925 | basal plasma membrane(GO:0009925) |
| 0.0 | 0.3 | GO:0005967 | mitochondrial pyruvate dehydrogenase complex(GO:0005967) |
| 0.0 | 0.1 | GO:0097489 | multivesicular body, internal vesicle lumen(GO:0097489) |
| 0.0 | 0.3 | GO:0005683 | U7 snRNP(GO:0005683) |
| 0.0 | 0.8 | GO:0001518 | voltage-gated sodium channel complex(GO:0001518) |
| 0.0 | 5.5 | GO:0005776 | autophagosome(GO:0005776) |
| 0.0 | 3.8 | GO:0055038 | recycling endosome membrane(GO:0055038) |
| 0.0 | 0.8 | GO:0032433 | filopodium tip(GO:0032433) |
| 0.0 | 0.9 | GO:0043220 | Schmidt-Lanterman incisure(GO:0043220) |
| 0.0 | 0.8 | GO:0031089 | platelet dense granule lumen(GO:0031089) |
| 0.0 | 0.4 | GO:0031466 | Cul5-RING ubiquitin ligase complex(GO:0031466) |
| 0.0 | 0.2 | GO:0005712 | chiasma(GO:0005712) |
| 0.0 | 0.5 | GO:0031931 | TORC1 complex(GO:0031931) |
| 0.0 | 0.2 | GO:1990876 | cytoplasmic side of nuclear pore(GO:1990876) |
| 0.0 | 1.7 | GO:0005891 | voltage-gated calcium channel complex(GO:0005891) |
| 0.0 | 6.0 | GO:0042383 | sarcolemma(GO:0042383) |
| 0.0 | 0.7 | GO:0005952 | cAMP-dependent protein kinase complex(GO:0005952) |
| 0.0 | 0.1 | GO:1990923 | PET complex(GO:1990923) |
| 0.0 | 1.0 | GO:0032839 | dendrite cytoplasm(GO:0032839) |
| 0.0 | 0.1 | GO:0035363 | histone locus body(GO:0035363) |
| 0.0 | 7.1 | GO:0005802 | trans-Golgi network(GO:0005802) |
| 0.0 | 0.8 | GO:0030057 | desmosome(GO:0030057) |
| 0.0 | 0.7 | GO:0005838 | proteasome regulatory particle(GO:0005838) |
| 0.0 | 0.3 | GO:0030870 | Mre11 complex(GO:0030870) |
| 0.0 | 0.2 | GO:0001939 | female pronucleus(GO:0001939) |
| 0.0 | 0.6 | GO:0035098 | ESC/E(Z) complex(GO:0035098) |
| 0.0 | 0.6 | GO:0005892 | acetylcholine-gated channel complex(GO:0005892) |
| 0.0 | 0.3 | GO:0031010 | ISWI-type complex(GO:0031010) |
| 0.0 | 0.4 | GO:0031265 | CD95 death-inducing signaling complex(GO:0031265) ripoptosome(GO:0097342) |
| 0.0 | 2.8 | GO:0016605 | PML body(GO:0016605) |
| 0.0 | 0.3 | GO:0032045 | guanyl-nucleotide exchange factor complex(GO:0032045) |
| 0.0 | 0.4 | GO:0005671 | Ada2/Gcn5/Ada3 transcription activator complex(GO:0005671) |
| 0.0 | 1.6 | GO:0055037 | recycling endosome(GO:0055037) |
| 0.0 | 1.5 | GO:0030864 | cortical actin cytoskeleton(GO:0030864) |
| 0.0 | 1.8 | GO:0005811 | lipid particle(GO:0005811) |
| 0.0 | 0.6 | GO:0032281 | AMPA glutamate receptor complex(GO:0032281) |
| 0.0 | 2.5 | GO:0043202 | lysosomal lumen(GO:0043202) |
| 0.0 | 1.0 | GO:0005791 | rough endoplasmic reticulum(GO:0005791) |
| 0.0 | 6.9 | GO:0005743 | mitochondrial inner membrane(GO:0005743) |
Gene overrepresentation in molecular function category:
| Log-likelihood per target | Total log-likelihood | Term | Description |
|---|---|---|---|
| 1.7 | 6.9 | GO:0016880 | glutamate-ammonia ligase activity(GO:0004356) ammonia ligase activity(GO:0016211) acid-ammonia (or amide) ligase activity(GO:0016880) |
| 0.8 | 4.9 | GO:0004740 | pyruvate dehydrogenase (acetyl-transferring) kinase activity(GO:0004740) |
| 0.7 | 3.7 | GO:0019912 | cyclin-dependent protein kinase activating kinase activity(GO:0019912) |
| 0.6 | 1.8 | GO:0033878 | hormone-sensitive lipase activity(GO:0033878) |
| 0.5 | 2.8 | GO:0042030 | ATPase inhibitor activity(GO:0042030) |
| 0.4 | 2.7 | GO:0097001 | ceramide binding(GO:0097001) |
| 0.4 | 1.1 | GO:0000253 | 3-keto sterol reductase activity(GO:0000253) |
| 0.4 | 1.8 | GO:0052591 | sn-glycerol-3-phosphate:ubiquinone oxidoreductase activity(GO:0052590) sn-glycerol-3-phosphate:ubiquinone-8 oxidoreductase activity(GO:0052591) |
| 0.4 | 1.1 | GO:0001596 | angiotensin type I receptor activity(GO:0001596) |
| 0.3 | 2.7 | GO:0004111 | creatine kinase activity(GO:0004111) |
| 0.2 | 1.4 | GO:0034714 | type III transforming growth factor beta receptor binding(GO:0034714) |
| 0.2 | 1.4 | GO:0042392 | sphingosine-1-phosphate phosphatase activity(GO:0042392) |
| 0.2 | 1.3 | GO:0004597 | peptide-aspartate beta-dioxygenase activity(GO:0004597) |
| 0.2 | 1.1 | GO:0005294 | neutral L-amino acid secondary active transmembrane transporter activity(GO:0005294) |
| 0.2 | 5.1 | GO:0032036 | myosin heavy chain binding(GO:0032036) |
| 0.2 | 2.3 | GO:0031995 | insulin-like growth factor II binding(GO:0031995) |
| 0.1 | 3.0 | GO:0001206 | transcriptional repressor activity, RNA polymerase II distal enhancer sequence-specific binding(GO:0001206) |
| 0.1 | 0.9 | GO:0004598 | peptidylglycine monooxygenase activity(GO:0004504) peptidylamidoglycolate lyase activity(GO:0004598) |
| 0.1 | 5.7 | GO:0008093 | cytoskeletal adaptor activity(GO:0008093) |
| 0.1 | 10.2 | GO:0051393 | alpha-actinin binding(GO:0051393) |
| 0.1 | 2.8 | GO:0008179 | adenylate cyclase binding(GO:0008179) |
| 0.1 | 0.3 | GO:0071209 | U7 snRNA binding(GO:0071209) |
| 0.1 | 0.6 | GO:1990430 | extracellular matrix protein binding(GO:1990430) |
| 0.1 | 0.4 | GO:0005169 | neurotrophin TRKB receptor binding(GO:0005169) |
| 0.1 | 0.5 | GO:0032558 | adenyl deoxyribonucleotide binding(GO:0032558) dATP binding(GO:0032564) |
| 0.1 | 1.0 | GO:0036042 | long-chain fatty acyl-CoA binding(GO:0036042) |
| 0.1 | 0.7 | GO:0008273 | calcium, potassium:sodium antiporter activity(GO:0008273) |
| 0.1 | 1.0 | GO:0015277 | kainate selective glutamate receptor activity(GO:0015277) |
| 0.1 | 1.0 | GO:0030348 | syntaxin-3 binding(GO:0030348) |
| 0.1 | 1.7 | GO:0004865 | protein serine/threonine phosphatase inhibitor activity(GO:0004865) |
| 0.1 | 0.9 | GO:0008449 | N-acetylglucosamine-6-sulfatase activity(GO:0008449) |
| 0.1 | 1.1 | GO:0019826 | oxygen sensor activity(GO:0019826) |
| 0.1 | 1.2 | GO:0019869 | chloride channel inhibitor activity(GO:0019869) |
| 0.1 | 0.7 | GO:0004046 | aminoacylase activity(GO:0004046) |
| 0.1 | 2.9 | GO:0005229 | intracellular calcium activated chloride channel activity(GO:0005229) |
| 0.1 | 2.8 | GO:0004029 | aldehyde dehydrogenase (NAD) activity(GO:0004029) |
| 0.1 | 1.0 | GO:0016909 | JUN kinase activity(GO:0004705) SAP kinase activity(GO:0016909) |
| 0.1 | 2.9 | GO:0000900 | translation repressor activity, nucleic acid binding(GO:0000900) |
| 0.1 | 0.7 | GO:0045505 | dynein intermediate chain binding(GO:0045505) |
| 0.1 | 1.2 | GO:0022851 | GABA-gated chloride ion channel activity(GO:0022851) |
| 0.1 | 1.2 | GO:0017128 | phospholipid scramblase activity(GO:0017128) |
| 0.1 | 1.8 | GO:0042813 | Wnt-activated receptor activity(GO:0042813) |
| 0.1 | 1.1 | GO:0071933 | Arp2/3 complex binding(GO:0071933) |
| 0.1 | 3.1 | GO:0030742 | GTP-dependent protein binding(GO:0030742) |
| 0.1 | 2.0 | GO:0005528 | macrolide binding(GO:0005527) FK506 binding(GO:0005528) |
| 0.1 | 1.7 | GO:0031698 | beta-2 adrenergic receptor binding(GO:0031698) |
| 0.1 | 0.6 | GO:0016167 | glial cell-derived neurotrophic factor receptor activity(GO:0016167) |
| 0.1 | 0.4 | GO:0050816 | phosphothreonine binding(GO:0050816) |
| 0.1 | 0.1 | GO:0030235 | nitric-oxide synthase regulator activity(GO:0030235) |
| 0.1 | 0.5 | GO:0098639 | collagen binding involved in cell-matrix adhesion(GO:0098639) |
| 0.1 | 3.3 | GO:0051721 | protein phosphatase 2A binding(GO:0051721) |
| 0.1 | 2.2 | GO:0043274 | phospholipase binding(GO:0043274) |
| 0.1 | 0.9 | GO:0015194 | L-serine transmembrane transporter activity(GO:0015194) serine transmembrane transporter activity(GO:0022889) |
| 0.0 | 0.8 | GO:0032051 | clathrin light chain binding(GO:0032051) |
| 0.0 | 2.5 | GO:0043015 | gamma-tubulin binding(GO:0043015) |
| 0.0 | 0.1 | GO:0004980 | melanocyte-stimulating hormone receptor activity(GO:0004980) |
| 0.0 | 0.2 | GO:0004329 | formate-tetrahydrofolate ligase activity(GO:0004329) |
| 0.0 | 2.6 | GO:0051879 | Hsp90 protein binding(GO:0051879) |
| 0.0 | 1.1 | GO:0004708 | MAP kinase kinase activity(GO:0004708) |
| 0.0 | 0.4 | GO:0004849 | uridine kinase activity(GO:0004849) |
| 0.0 | 1.1 | GO:0030275 | LRR domain binding(GO:0030275) |
| 0.0 | 0.7 | GO:0004089 | carbonate dehydratase activity(GO:0004089) |
| 0.0 | 0.8 | GO:0015643 | toxic substance binding(GO:0015643) |
| 0.0 | 5.3 | GO:0030165 | PDZ domain binding(GO:0030165) |
| 0.0 | 2.5 | GO:0030507 | spectrin binding(GO:0030507) |
| 0.0 | 1.5 | GO:0004709 | MAP kinase kinase kinase activity(GO:0004709) |
| 0.0 | 1.4 | GO:0019198 | transmembrane receptor protein tyrosine phosphatase activity(GO:0005001) transmembrane receptor protein phosphatase activity(GO:0019198) |
| 0.0 | 0.7 | GO:0008603 | cAMP-dependent protein kinase regulator activity(GO:0008603) |
| 0.0 | 1.4 | GO:0043531 | ADP binding(GO:0043531) |
| 0.0 | 4.4 | GO:0042626 | ATPase activity, coupled to transmembrane movement of substances(GO:0042626) |
| 0.0 | 1.4 | GO:0030332 | cyclin binding(GO:0030332) |
| 0.0 | 0.7 | GO:0050998 | nitric-oxide synthase binding(GO:0050998) |
| 0.0 | 0.8 | GO:0008569 | ATP-dependent microtubule motor activity, minus-end-directed(GO:0008569) |
| 0.0 | 0.8 | GO:0001011 | transcription factor activity, sequence-specific DNA binding, RNA polymerase recruiting(GO:0001011) transcription factor activity, TFIIB-class binding(GO:0001087) |
| 0.0 | 2.2 | GO:0001102 | RNA polymerase II activating transcription factor binding(GO:0001102) |
| 0.0 | 0.7 | GO:0005523 | tropomyosin binding(GO:0005523) |
| 0.0 | 1.7 | GO:0042169 | SH2 domain binding(GO:0042169) |
| 0.0 | 0.7 | GO:0004653 | polypeptide N-acetylgalactosaminyltransferase activity(GO:0004653) |
| 0.0 | 0.6 | GO:0008198 | ferrous iron binding(GO:0008198) |
| 0.0 | 6.1 | GO:0035257 | nuclear hormone receptor binding(GO:0035257) |
| 0.0 | 7.5 | GO:0008022 | protein C-terminus binding(GO:0008022) |
| 0.0 | 0.2 | GO:0003696 | satellite DNA binding(GO:0003696) centromeric DNA binding(GO:0019237) |
| 0.0 | 0.6 | GO:0022848 | acetylcholine-gated cation channel activity(GO:0022848) |
| 0.0 | 2.5 | GO:0030276 | clathrin binding(GO:0030276) |
| 0.0 | 2.2 | GO:0050840 | extracellular matrix binding(GO:0050840) |
| 0.0 | 0.7 | GO:0008157 | protein phosphatase 1 binding(GO:0008157) |
| 0.0 | 0.8 | GO:0005248 | voltage-gated sodium channel activity(GO:0005248) voltage-gated ion channel activity involved in regulation of postsynaptic membrane potential(GO:1905030) |
| 0.0 | 0.6 | GO:0016805 | dipeptidase activity(GO:0016805) |
| 0.0 | 1.4 | GO:0017112 | Rab guanyl-nucleotide exchange factor activity(GO:0017112) |
| 0.0 | 0.1 | GO:0005250 | A-type (transient outward) potassium channel activity(GO:0005250) |
| 0.0 | 0.6 | GO:0001671 | ATPase activator activity(GO:0001671) |
| 0.0 | 0.3 | GO:0019992 | diacylglycerol binding(GO:0019992) |
| 0.0 | 0.1 | GO:0051120 | hepoxilin A3 synthase activity(GO:0051120) |
| 0.0 | 0.3 | GO:0005049 | nuclear export signal receptor activity(GO:0005049) |
| 0.0 | 0.6 | GO:0097200 | cysteine-type endopeptidase activity involved in execution phase of apoptosis(GO:0097200) |
| 0.0 | 2.3 | GO:0003705 | transcription factor activity, RNA polymerase II distal enhancer sequence-specific binding(GO:0003705) |
| 0.0 | 0.5 | GO:0008266 | poly(U) RNA binding(GO:0008266) |
| 0.0 | 0.3 | GO:0005545 | 1-phosphatidylinositol binding(GO:0005545) |
| 0.0 | 0.5 | GO:0071949 | FAD binding(GO:0071949) |
| 0.0 | 0.1 | GO:0032190 | acrosin binding(GO:0032190) |
| 0.0 | 1.7 | GO:0001618 | virus receptor activity(GO:0001618) |
| 0.0 | 0.7 | GO:0019956 | chemokine binding(GO:0019956) |
| 0.0 | 1.1 | GO:0004869 | cysteine-type endopeptidase inhibitor activity(GO:0004869) |
| 0.0 | 0.1 | GO:0030274 | LIM domain binding(GO:0030274) |
| 0.0 | 6.7 | GO:0045296 | cadherin binding(GO:0045296) |
| 0.0 | 0.1 | GO:0004652 | polynucleotide adenylyltransferase activity(GO:0004652) |
| 0.0 | 0.2 | GO:0008430 | selenium binding(GO:0008430) |
| 0.0 | 0.7 | GO:0005546 | phosphatidylinositol-4,5-bisphosphate binding(GO:0005546) |
| 0.0 | 1.3 | GO:0008013 | beta-catenin binding(GO:0008013) |
| 0.0 | 2.0 | GO:0035591 | signaling adaptor activity(GO:0035591) |
| 0.0 | 0.6 | GO:0036002 | pre-mRNA binding(GO:0036002) |
| 0.0 | 0.2 | GO:0015125 | bile acid transmembrane transporter activity(GO:0015125) |
| 0.0 | 0.1 | GO:0001162 | RNA polymerase II intronic transcription regulatory region sequence-specific DNA binding(GO:0001162) |
| 0.0 | 2.1 | GO:0019838 | growth factor binding(GO:0019838) |
| 0.0 | 0.1 | GO:0005223 | intracellular cGMP activated cation channel activity(GO:0005223) |
Gene overrepresentation in curated gene sets: canonical pathways category:
| Log-likelihood per target | Total log-likelihood | Term | Description |
|---|---|---|---|
| 0.2 | 3.0 | SA G2 AND M PHASES | Cdc25 activates the cdc2/cyclin B complex to induce the G2/M transition. |
| 0.1 | 3.2 | PID NEPHRIN NEPH1 PATHWAY | Nephrin/Neph1 signaling in the kidney podocyte |
| 0.1 | 6.2 | PID RHOA PATHWAY | RhoA signaling pathway |
| 0.1 | 2.9 | PID EPHB FWD PATHWAY | EPHB forward signaling |
| 0.1 | 7.4 | PID ANGIOPOIETIN RECEPTOR PATHWAY | Angiopoietin receptor Tie2-mediated signaling |
| 0.0 | 1.1 | PID P38 MK2 PATHWAY | p38 signaling mediated by MAPKAP kinases |
| 0.0 | 1.1 | PID PTP1B PATHWAY | Signaling events mediated by PTP1B |
| 0.0 | 2.2 | SIG PIP3 SIGNALING IN CARDIAC MYOCTES | Genes related to PIP3 signaling in cardiac myocytes |
| 0.0 | 1.0 | SIG CD40PATHWAYMAP | Genes related to CD40 signaling |
| 0.0 | 1.2 | PID IL2 PI3K PATHWAY | IL2 signaling events mediated by PI3K |
| 0.0 | 3.5 | ST INTEGRIN SIGNALING PATHWAY | Integrin Signaling Pathway |
| 0.0 | 1.2 | PID IL23 PATHWAY | IL23-mediated signaling events |
| 0.0 | 2.3 | PID FGF PATHWAY | FGF signaling pathway |
| 0.0 | 0.8 | PID HEDGEHOG 2PATHWAY | Signaling events mediated by the Hedgehog family |
| 0.0 | 1.0 | PID ALK1 PATHWAY | ALK1 signaling events |
| 0.0 | 0.6 | PID RET PATHWAY | Signaling events regulated by Ret tyrosine kinase |
| 0.0 | 0.8 | PID IL12 STAT4 PATHWAY | IL12 signaling mediated by STAT4 |
| 0.0 | 0.8 | PID CONE PATHWAY | Visual signal transduction: Cones |
| 0.0 | 1.4 | PID LKB1 PATHWAY | LKB1 signaling events |
| 0.0 | 1.5 | PID CDC42 REG PATHWAY | Regulation of CDC42 activity |
| 0.0 | 2.7 | PID MYC REPRESS PATHWAY | Validated targets of C-MYC transcriptional repression |
| 0.0 | 1.3 | PID ILK PATHWAY | Integrin-linked kinase signaling |
| 0.0 | 0.7 | PID CDC42 PATHWAY | CDC42 signaling events |
| 0.0 | 0.5 | PID NETRIN PATHWAY | Netrin-mediated signaling events |
| 0.0 | 0.8 | ST T CELL SIGNAL TRANSDUCTION | T Cell Signal Transduction |
| 0.0 | 1.5 | PID RHOA REG PATHWAY | Regulation of RhoA activity |
| 0.0 | 0.7 | PID INTEGRIN A4B1 PATHWAY | Alpha4 beta1 integrin signaling events |
| 0.0 | 0.6 | PID BMP PATHWAY | BMP receptor signaling |
Gene overrepresentation in curated gene sets: REACTOME pathways category:
| Log-likelihood per target | Total log-likelihood | Term | Description |
|---|---|---|---|
| 0.2 | 4.9 | REACTOME REGULATION OF PYRUVATE DEHYDROGENASE PDH COMPLEX | Genes involved in Regulation of pyruvate dehydrogenase (PDH) complex |
| 0.2 | 6.9 | REACTOME AMINO ACID SYNTHESIS AND INTERCONVERSION TRANSAMINATION | Genes involved in Amino acid synthesis and interconversion (transamination) |
| 0.1 | 3.6 | REACTOME ABCA TRANSPORTERS IN LIPID HOMEOSTASIS | Genes involved in ABCA transporters in lipid homeostasis |
| 0.1 | 5.8 | REACTOME TIE2 SIGNALING | Genes involved in Tie2 Signaling |
| 0.1 | 4.1 | REACTOME AKT PHOSPHORYLATES TARGETS IN THE CYTOSOL | Genes involved in AKT phosphorylates targets in the cytosol |
| 0.1 | 2.0 | REACTOME KERATAN SULFATE DEGRADATION | Genes involved in Keratan sulfate degradation |
| 0.1 | 3.2 | REACTOME NOREPINEPHRINE NEUROTRANSMITTER RELEASE CYCLE | Genes involved in Norepinephrine Neurotransmitter Release Cycle |
| 0.1 | 3.0 | REACTOME APOPTOTIC CLEAVAGE OF CELL ADHESION PROTEINS | Genes involved in Apoptotic cleavage of cell adhesion proteins |
| 0.1 | 2.3 | REACTOME REGULATION OF INSULIN LIKE GROWTH FACTOR IGF ACTIVITY BY INSULIN LIKE GROWTH FACTOR BINDING PROTEINS IGFBPS | Genes involved in Regulation of Insulin-like Growth Factor (IGF) Activity by Insulin-like Growth Factor Binding Proteins (IGFBPs) |
| 0.1 | 5.1 | REACTOME STRIATED MUSCLE CONTRACTION | Genes involved in Striated Muscle Contraction |
| 0.1 | 1.8 | REACTOME HORMONE SENSITIVE LIPASE HSL MEDIATED TRIACYLGLYCEROL HYDROLYSIS | Genes involved in Hormone-sensitive lipase (HSL)-mediated triacylglycerol hydrolysis |
| 0.1 | 4.2 | REACTOME DARPP 32 EVENTS | Genes involved in DARPP-32 events |
| 0.1 | 2.1 | REACTOME PROLACTIN RECEPTOR SIGNALING | Genes involved in Prolactin receptor signaling |
| 0.1 | 2.7 | REACTOME MUSCLE CONTRACTION | Genes involved in Muscle contraction |
| 0.1 | 5.0 | REACTOME GOLGI ASSOCIATED VESICLE BIOGENESIS | Genes involved in Golgi Associated Vesicle Biogenesis |
| 0.0 | 2.5 | REACTOME EGFR DOWNREGULATION | Genes involved in EGFR downregulation |
| 0.0 | 0.5 | REACTOME DSCAM INTERACTIONS | Genes involved in DSCAM interactions |
| 0.0 | 2.5 | REACTOME ASSOCIATION OF TRIC CCT WITH TARGET PROTEINS DURING BIOSYNTHESIS | Genes involved in Association of TriC/CCT with target proteins during biosynthesis |
| 0.0 | 2.5 | REACTOME INTERACTION BETWEEN L1 AND ANKYRINS | Genes involved in Interaction between L1 and Ankyrins |
| 0.0 | 0.7 | REACTOME REVERSIBLE HYDRATION OF CARBON DIOXIDE | Genes involved in Reversible Hydration of Carbon Dioxide |
| 0.0 | 1.1 | REACTOME ACTIVATED TAK1 MEDIATES P38 MAPK ACTIVATION | Genes involved in activated TAK1 mediates p38 MAPK activation |
| 0.0 | 1.1 | REACTOME REGULATION OF AMPK ACTIVITY VIA LKB1 | Genes involved in Regulation of AMPK activity via LKB1 |
| 0.0 | 1.3 | REACTOME CELL EXTRACELLULAR MATRIX INTERACTIONS | Genes involved in Cell-extracellular matrix interactions |
| 0.0 | 1.0 | REACTOME IONOTROPIC ACTIVITY OF KAINATE RECEPTORS | Genes involved in Ionotropic activity of Kainate Receptors |
| 0.0 | 1.0 | REACTOME PIP3 ACTIVATES AKT SIGNALING | Genes involved in PIP3 activates AKT signaling |
| 0.0 | 1.7 | REACTOME SIGNAL TRANSDUCTION BY L1 | Genes involved in Signal transduction by L1 |
| 0.0 | 1.0 | REACTOME ACTIVATION OF THE AP1 FAMILY OF TRANSCRIPTION FACTORS | Genes involved in Activation of the AP-1 family of transcription factors |
| 0.0 | 0.8 | REACTOME OTHER SEMAPHORIN INTERACTIONS | Genes involved in Other semaphorin interactions |
| 0.0 | 1.2 | REACTOME GABA A RECEPTOR ACTIVATION | Genes involved in GABA A receptor activation |
| 0.0 | 0.8 | REACTOME PD1 SIGNALING | Genes involved in PD-1 signaling |
| 0.0 | 0.6 | REACTOME PRESYNAPTIC NICOTINIC ACETYLCHOLINE RECEPTORS | Genes involved in Presynaptic nicotinic acetylcholine receptors |
| 0.0 | 0.3 | REACTOME NEF MEDIATES DOWN MODULATION OF CELL SURFACE RECEPTORS BY RECRUITING THEM TO CLATHRIN ADAPTERS | Genes involved in Nef-mediates down modulation of cell surface receptors by recruiting them to clathrin adapters |
| 0.0 | 2.5 | REACTOME INTERFERON ALPHA BETA SIGNALING | Genes involved in Interferon alpha/beta signaling |
| 0.0 | 1.1 | REACTOME BASIGIN INTERACTIONS | Genes involved in Basigin interactions |
| 0.0 | 0.5 | REACTOME SIGNALING BY FGFR1 FUSION MUTANTS | Genes involved in Signaling by FGFR1 fusion mutants |
| 0.0 | 2.5 | REACTOME MHC CLASS II ANTIGEN PRESENTATION | Genes involved in MHC class II antigen presentation |
| 0.0 | 0.3 | REACTOME SLBP DEPENDENT PROCESSING OF REPLICATION DEPENDENT HISTONE PRE MRNAS | Genes involved in SLBP Dependent Processing of Replication-Dependent Histone Pre-mRNAs |
| 0.0 | 1.6 | REACTOME MYOGENESIS | Genes involved in Myogenesis |
| 0.0 | 0.5 | REACTOME SIGNALING BY HIPPO | Genes involved in Signaling by Hippo |
| 0.0 | 0.5 | REACTOME INTEGRIN CELL SURFACE INTERACTIONS | Genes involved in Integrin cell surface interactions |
| 0.0 | 4.1 | REACTOME METABOLISM OF AMINO ACIDS AND DERIVATIVES | Genes involved in Metabolism of amino acids and derivatives |
| 0.0 | 0.5 | REACTOME ADHERENS JUNCTIONS INTERACTIONS | Genes involved in Adherens junctions interactions |
| 0.0 | 0.3 | REACTOME DOWNSTREAM SIGNALING EVENTS OF B CELL RECEPTOR BCR | Genes involved in Downstream Signaling Events Of B Cell Receptor (BCR) |
| 0.0 | 0.2 | REACTOME RECYCLING OF BILE ACIDS AND SALTS | Genes involved in Recycling of bile acids and salts |
| 0.0 | 1.0 | REACTOME NETRIN1 SIGNALING | Genes involved in Netrin-1 signaling |
| 0.0 | 0.4 | REACTOME EXTRINSIC PATHWAY FOR APOPTOSIS | Genes involved in Extrinsic Pathway for Apoptosis |
| 0.0 | 0.3 | REACTOME GLUCURONIDATION | Genes involved in Glucuronidation |
| 0.0 | 0.1 | REACTOME SIGNALING BY CONSTITUTIVELY ACTIVE EGFR | Genes involved in Signaling by constitutively active EGFR |
| 0.0 | 0.3 | REACTOME DEPOSITION OF NEW CENPA CONTAINING NUCLEOSOMES AT THE CENTROMERE | Genes involved in Deposition of New CENPA-containing Nucleosomes at the Centromere |