Project
Illumina Body Map 2 (GSE30611)
Navigation
Downloads
Results for GAGAUGA
Z-value: 0.49
Motif logo

miRNA associated with seed GAGAUGA
| Name | miRBASE accession |
|---|---|
|
hsa-miR-143-3p
|
MIMAT0000435 |
|
hsa-miR-4770
|
MIMAT0019924 |
|
hsa-miR-6088
|
MIMAT0023713 |
Activity profile of GAGAUGA motif
Sorted Z-values of GAGAUGA motif
Network of associatons between targets according to the STRING database.

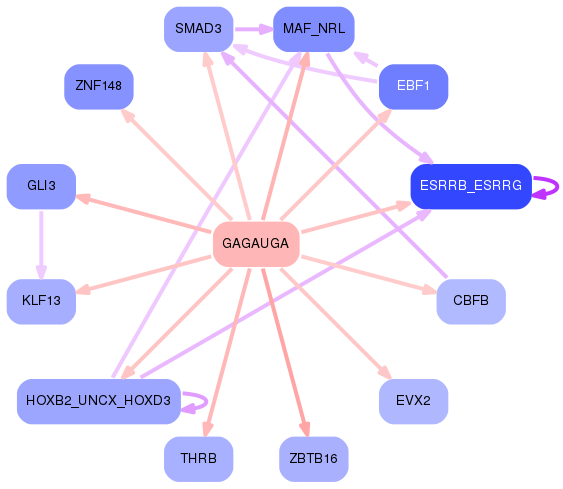
First level regulatory network of GAGAUGA
Gene Ontology Analysis
Gene overrepresentation in biological process category:
| Log-likelihood per target | Total log-likelihood | Term | Description |
|---|---|---|---|
| 0.5 | 1.5 | GO:1904204 | regulation of skeletal muscle hypertrophy(GO:1904204) |
| 0.2 | 1.2 | GO:0061073 | ciliary body morphogenesis(GO:0061073) |
| 0.2 | 0.9 | GO:0042360 | vitamin E metabolic process(GO:0042360) |
| 0.2 | 0.6 | GO:1905229 | cellular response to glycoprotein(GO:1904588) cellular response to thyrotropin-releasing hormone(GO:1905229) |
| 0.1 | 0.7 | GO:1903352 | L-ornithine transmembrane transport(GO:1903352) |
| 0.1 | 0.4 | GO:0032289 | central nervous system myelin formation(GO:0032289) |
| 0.1 | 0.7 | GO:0051138 | positive regulation of NK T cell differentiation(GO:0051138) |
| 0.1 | 0.4 | GO:0044691 | tooth eruption(GO:0044691) |
| 0.1 | 1.3 | GO:0070327 | thyroid hormone transport(GO:0070327) |
| 0.1 | 0.8 | GO:0050882 | voluntary musculoskeletal movement(GO:0050882) |
| 0.1 | 0.3 | GO:0022018 | subpallium cell proliferation in forebrain(GO:0022012) lateral ganglionic eminence cell proliferation(GO:0022018) lambdoid suture morphogenesis(GO:0060366) sagittal suture morphogenesis(GO:0060367) anterior semicircular canal development(GO:0060873) lateral semicircular canal development(GO:0060875) |
| 0.1 | 1.4 | GO:0002158 | osteoclast proliferation(GO:0002158) |
| 0.1 | 0.4 | GO:0010701 | positive regulation of norepinephrine secretion(GO:0010701) |
| 0.1 | 0.3 | GO:1903225 | negative regulation of endodermal cell differentiation(GO:1903225) |
| 0.1 | 0.4 | GO:0048861 | leukemia inhibitory factor signaling pathway(GO:0048861) |
| 0.1 | 0.2 | GO:0019072 | viral genome packaging(GO:0019072) viral RNA genome packaging(GO:0019074) |
| 0.0 | 0.4 | GO:0008050 | female courtship behavior(GO:0008050) |
| 0.0 | 0.3 | GO:0070236 | negative regulation of activation-induced cell death of T cells(GO:0070236) |
| 0.0 | 0.2 | GO:0061687 | detoxification of inorganic compound(GO:0061687) |
| 0.0 | 0.1 | GO:0021569 | rhombomere 3 development(GO:0021569) |
| 0.0 | 0.1 | GO:2000298 | regulation of Rho-dependent protein serine/threonine kinase activity(GO:2000298) |
| 0.0 | 0.4 | GO:0008354 | germ cell migration(GO:0008354) |
| 0.0 | 0.1 | GO:1902630 | regulation of membrane hyperpolarization(GO:1902630) |
| 0.0 | 0.2 | GO:0015015 | heparan sulfate proteoglycan biosynthetic process, enzymatic modification(GO:0015015) |
| 0.0 | 0.1 | GO:0043375 | negative regulation of cellular pH reduction(GO:0032848) CD8-positive, alpha-beta T cell lineage commitment(GO:0043375) negative regulation of retinal cell programmed cell death(GO:0046671) |
| 0.0 | 0.1 | GO:0051463 | negative regulation of cortisol secretion(GO:0051463) |
| 0.0 | 0.3 | GO:0060385 | axonogenesis involved in innervation(GO:0060385) |
| 0.0 | 0.4 | GO:0015727 | lactate transport(GO:0015727) lactate transmembrane transport(GO:0035873) |
| 0.0 | 0.4 | GO:0042340 | keratan sulfate catabolic process(GO:0042340) |
| 0.0 | 0.2 | GO:0019236 | response to pheromone(GO:0019236) |
| 0.0 | 0.1 | GO:0035790 | platelet-derived growth factor receptor-alpha signaling pathway(GO:0035790) |
| 0.0 | 0.5 | GO:1904262 | negative regulation of TORC1 signaling(GO:1904262) |
| 0.0 | 0.1 | GO:0090310 | negative regulation of methylation-dependent chromatin silencing(GO:0090310) |
| 0.0 | 0.2 | GO:1900169 | regulation of glucocorticoid mediated signaling pathway(GO:1900169) |
| 0.0 | 0.3 | GO:0006987 | activation of signaling protein activity involved in unfolded protein response(GO:0006987) |
| 0.0 | 0.1 | GO:0046909 | intermembrane transport(GO:0046909) protein transport from ciliary membrane to plasma membrane(GO:1903445) |
| 0.0 | 0.2 | GO:0032328 | alanine transport(GO:0032328) |
| 0.0 | 0.2 | GO:0072383 | plus-end-directed vesicle transport along microtubule(GO:0072383) |
| 0.0 | 0.1 | GO:0048378 | tricuspid valve morphogenesis(GO:0003186) lateral mesodermal cell fate commitment(GO:0048372) lateral mesodermal cell fate specification(GO:0048377) regulation of lateral mesodermal cell fate specification(GO:0048378) |
| 0.0 | 0.1 | GO:0060448 | neural plate elongation(GO:0014022) convergent extension involved in neural plate elongation(GO:0022007) dichotomous subdivision of terminal units involved in lung branching(GO:0060448) |
| 0.0 | 0.1 | GO:0050823 | peptide stabilization(GO:0050822) peptide antigen stabilization(GO:0050823) |
| 0.0 | 0.2 | GO:0001867 | complement activation, lectin pathway(GO:0001867) |
| 0.0 | 0.1 | GO:0072752 | cellular response to rapamycin(GO:0072752) |
| 0.0 | 0.1 | GO:0045048 | protein insertion into ER membrane(GO:0045048) |
| 0.0 | 0.2 | GO:0048739 | cardiac muscle fiber development(GO:0048739) |
| 0.0 | 0.4 | GO:0070886 | positive regulation of calcineurin-NFAT signaling cascade(GO:0070886) |
| 0.0 | 0.1 | GO:0097676 | histone H3-K36 dimethylation(GO:0097676) |
Gene overrepresentation in cellular component category:
| Log-likelihood per target | Total log-likelihood | Term | Description |
|---|---|---|---|
| 0.1 | 0.4 | GO:0005584 | collagen type I trimer(GO:0005584) |
| 0.1 | 1.5 | GO:0042567 | insulin-like growth factor ternary complex(GO:0042567) |
| 0.1 | 0.4 | GO:0005588 | collagen type V trimer(GO:0005588) |
| 0.1 | 0.2 | GO:0016939 | kinesin II complex(GO:0016939) |
| 0.0 | 0.1 | GO:0060187 | cell pole(GO:0060187) |
| 0.0 | 0.4 | GO:0034663 | endoplasmic reticulum chaperone complex(GO:0034663) |
| 0.0 | 0.1 | GO:0034681 | integrin alpha11-beta1 complex(GO:0034681) |
| 0.0 | 0.3 | GO:0016461 | unconventional myosin complex(GO:0016461) |
| 0.0 | 0.0 | GO:0034686 | integrin alphav-beta8 complex(GO:0034686) |
Gene overrepresentation in molecular function category:
| Log-likelihood per target | Total log-likelihood | Term | Description |
|---|---|---|---|
| 0.2 | 0.9 | GO:0008431 | vitamin E binding(GO:0008431) |
| 0.2 | 1.4 | GO:0016941 | natriuretic peptide receptor activity(GO:0016941) |
| 0.1 | 1.3 | GO:0015349 | thyroid hormone transmembrane transporter activity(GO:0015349) |
| 0.1 | 1.5 | GO:0031995 | insulin-like growth factor II binding(GO:0031995) |
| 0.1 | 0.7 | GO:0000064 | L-ornithine transmembrane transporter activity(GO:0000064) |
| 0.1 | 0.4 | GO:0004923 | leukemia inhibitory factor receptor activity(GO:0004923) |
| 0.1 | 0.6 | GO:0004996 | thyroid-stimulating hormone receptor activity(GO:0004996) |
| 0.1 | 0.4 | GO:0042392 | sphingosine-1-phosphate phosphatase activity(GO:0042392) |
| 0.1 | 0.8 | GO:0046790 | virion binding(GO:0046790) |
| 0.0 | 0.2 | GO:0060001 | minus-end directed microfilament motor activity(GO:0060001) |
| 0.0 | 0.2 | GO:0005477 | pyruvate secondary active transmembrane transporter activity(GO:0005477) |
| 0.0 | 0.4 | GO:0008449 | N-acetylglucosamine-6-sulfatase activity(GO:0008449) |
| 0.0 | 0.3 | GO:0043426 | MRF binding(GO:0043426) |
| 0.0 | 0.7 | GO:0001206 | transcriptional repressor activity, RNA polymerase II distal enhancer sequence-specific binding(GO:0001206) |
| 0.0 | 0.4 | GO:0038132 | neuregulin binding(GO:0038132) |
| 0.0 | 0.2 | GO:0008467 | [heparan sulfate]-glucosamine 3-sulfotransferase 1 activity(GO:0008467) |
| 0.0 | 0.5 | GO:0048407 | platelet-derived growth factor binding(GO:0048407) |
| 0.0 | 0.1 | GO:0003829 | beta-1,3-galactosyl-O-glycosyl-glycoprotein beta-1,6-N-acetylglucosaminyltransferase activity(GO:0003829) |
| 0.0 | 0.4 | GO:0070324 | thyroid hormone binding(GO:0070324) |
| 0.0 | 0.2 | GO:0050682 | AF-2 domain binding(GO:0050682) |
| 0.0 | 0.1 | GO:0004618 | phosphoglycerate kinase activity(GO:0004618) |
| 0.0 | 0.4 | GO:0015037 | peptide disulfide oxidoreductase activity(GO:0015037) |
| 0.0 | 0.2 | GO:0015129 | lactate transmembrane transporter activity(GO:0015129) |
| 0.0 | 0.2 | GO:0004075 | biotin carboxylase activity(GO:0004075) |
| 0.0 | 0.2 | GO:0005537 | mannose binding(GO:0005537) |
| 0.0 | 0.1 | GO:0015433 | peptide antigen-transporting ATPase activity(GO:0015433) |
| 0.0 | 0.1 | GO:0034235 | GPI anchor binding(GO:0034235) |
| 0.0 | 0.0 | GO:0004307 | ethanolaminephosphotransferase activity(GO:0004307) |
| 0.0 | 0.0 | GO:0072545 | tyrosine binding(GO:0072545) |
| 0.0 | 0.1 | GO:0070579 | methylcytosine dioxygenase activity(GO:0070579) |
| 0.0 | 0.4 | GO:0015347 | sodium-independent organic anion transmembrane transporter activity(GO:0015347) |
| 0.0 | 0.4 | GO:0005251 | delayed rectifier potassium channel activity(GO:0005251) |
| 0.0 | 0.1 | GO:0047134 | protein-disulfide reductase activity(GO:0047134) |
Gene overrepresentation in curated gene sets: canonical pathways category:
| Log-likelihood per target | Total log-likelihood | Term | Description |
|---|---|---|---|
| 0.0 | 1.2 | NABA COLLAGENS | Genes encoding collagen proteins |
Gene overrepresentation in curated gene sets: REACTOME pathways category:
| Log-likelihood per target | Total log-likelihood | Term | Description |
|---|---|---|---|
| 0.1 | 1.5 | REACTOME REGULATION OF INSULIN LIKE GROWTH FACTOR IGF ACTIVITY BY INSULIN LIKE GROWTH FACTOR BINDING PROTEINS IGFBPS | Genes involved in Regulation of Insulin-like Growth Factor (IGF) Activity by Insulin-like Growth Factor Binding Proteins (IGFBPs) |
| 0.0 | 0.6 | REACTOME HORMONE LIGAND BINDING RECEPTORS | Genes involved in Hormone ligand-binding receptors |
| 0.0 | 0.4 | REACTOME KERATAN SULFATE DEGRADATION | Genes involved in Keratan sulfate degradation |
| 0.0 | 0.4 | REACTOME PLATELET ADHESION TO EXPOSED COLLAGEN | Genes involved in Platelet Adhesion to exposed collagen |
| 0.0 | 0.4 | REACTOME ORGANIC CATION ANION ZWITTERION TRANSPORT | Genes involved in Organic cation/anion/zwitterion transport |