Project
Illumina Body Map 2 (GSE30611)
Navigation
Downloads
Results for GAGGUAG
Z-value: 0.90
Motif logo

miRNA associated with seed GAGGUAG
| Name | miRBASE accession |
|---|---|
|
hsa-let-7a-5p
|
MIMAT0000062 |
|
hsa-let-7b-5p
|
MIMAT0000063 |
|
hsa-let-7c-5p
|
MIMAT0000064 |
|
hsa-let-7d-5p
|
MIMAT0000065 |
|
hsa-let-7e-5p
|
MIMAT0000066 |
|
hsa-let-7f-5p
|
MIMAT0000067 |
|
hsa-let-7g-5p
|
MIMAT0000414 |
|
hsa-let-7i-5p
|
MIMAT0000415 |
|
hsa-miR-4458
|
MIMAT0018980 |
|
hsa-miR-4500
|
MIMAT0019036 |
|
hsa-miR-98-5p
|
MIMAT0000096 |
Activity profile of GAGGUAG motif
Sorted Z-values of GAGGUAG motif
| Promoter | Log-likelihood | Transcript | Gene | Gene Info |
|---|---|---|---|---|
| chr2_+_188974364 | 3.05 |
ENST00000304636.9
ENST00000317840.9 |
COL3A1
|
collagen type III alpha 1 chain |
| chr9_-_127122623 | 2.84 |
ENST00000373417.1
ENST00000373425.8 |
ANGPTL2
|
angiopoietin like 2 |
| chr17_-_50201618 | 2.78 |
ENST00000225964.10
|
COL1A1
|
collagen type I alpha 1 chain |
| chr6_-_53665748 | 2.67 |
ENST00000370905.4
|
KLHL31
|
kelch like family member 31 |
| chr21_-_26967057 | 2.60 |
ENST00000284987.6
|
ADAMTS5
|
ADAM metallopeptidase with thrombospondin type 1 motif 5 |
| chr7_+_94394886 | 2.46 |
ENST00000297268.11
ENST00000620463.1 |
COL1A2
|
collagen type I alpha 2 chain |
| chr11_+_78063851 | 2.16 |
ENST00000281030.2
|
THRSP
|
thyroid hormone responsive |
| chr9_+_98943898 | 2.12 |
ENST00000375001.8
|
COL15A1
|
collagen type XV alpha 1 chain |
| chr5_+_42423433 | 2.11 |
ENST00000230882.9
|
GHR
|
growth hormone receptor |
| chr2_-_1744442 | 2.00 |
ENST00000433670.5
ENST00000425171.1 ENST00000252804.9 |
PXDN
|
peroxidasin |
| chr11_-_86955385 | 1.91 |
ENST00000531380.2
|
FZD4
|
frizzled class receptor 4 |
| chr13_+_110307276 | 1.90 |
ENST00000360467.7
ENST00000650540.1 |
COL4A2
|
collagen type IV alpha 2 chain |
| chr11_+_130448633 | 1.84 |
ENST00000299164.4
|
ADAMTS15
|
ADAM metallopeptidase with thrombospondin type 1 motif 15 |
| chrX_+_2828808 | 1.81 |
ENST00000381163.7
|
GYG2
|
glycogenin 2 |
| chr15_+_74173693 | 1.66 |
ENST00000249842.8
|
ISLR
|
immunoglobulin superfamily containing leucine rich repeat |
| chr14_+_24398986 | 1.64 |
ENST00000382554.4
|
NYNRIN
|
NYN domain and retroviral integrase containing |
| chr15_-_51338575 | 1.61 |
ENST00000557858.5
ENST00000558328.5 ENST00000396402.6 ENST00000396404.8 ENST00000561075.5 ENST00000405011.6 ENST00000559980.5 ENST00000453807.6 |
CYP19A1
|
cytochrome P450 family 19 subfamily A member 1 |
| chrX_+_105822531 | 1.57 |
ENST00000243300.14
ENST00000536164.5 |
NRK
|
Nik related kinase |
| chr8_-_123541197 | 1.51 |
ENST00000517956.5
ENST00000443022.2 |
FBXO32
|
F-box protein 32 |
| chr1_+_170663134 | 1.50 |
ENST00000367760.7
|
PRRX1
|
paired related homeobox 1 |
| chr7_-_132576493 | 1.48 |
ENST00000321063.8
|
PLXNA4
|
plexin A4 |
| chr3_-_86991135 | 1.47 |
ENST00000398399.7
|
VGLL3
|
vestigial like family member 3 |
| chr17_+_8310220 | 1.42 |
ENST00000583529.1
ENST00000361926.8 |
ARHGEF15
|
Rho guanine nucleotide exchange factor 15 |
| chr3_+_16174628 | 1.36 |
ENST00000339732.10
|
GALNT15
|
polypeptide N-acetylgalactosaminyltransferase 15 |
| chr14_-_52069039 | 1.34 |
ENST00000216286.10
|
NID2
|
nidogen 2 |
| chr3_+_49171590 | 1.32 |
ENST00000332780.4
|
KLHDC8B
|
kelch domain containing 8B |
| chr11_-_27472698 | 1.29 |
ENST00000389858.4
ENST00000379214.9 |
LGR4
|
leucine rich repeat containing G protein-coupled receptor 4 |
| chr8_-_37966582 | 1.26 |
ENST00000345060.5
|
ADRB3
|
adrenoceptor beta 3 |
| chr4_-_173530219 | 1.22 |
ENST00000359562.4
|
HAND2
|
heart and neural crest derivatives expressed 2 |
| chr9_+_106863121 | 1.22 |
ENST00000472574.1
ENST00000277225.10 |
ZNF462
|
zinc finger protein 462 |
| chr1_+_164559766 | 1.22 |
ENST00000367897.5
ENST00000559240.5 |
PBX1
|
PBX homeobox 1 |
| chr10_+_71964373 | 1.22 |
ENST00000373115.5
|
CHST3
|
carbohydrate sulfotransferase 3 |
| chr11_-_10568650 | 1.16 |
ENST00000256178.8
|
LYVE1
|
lymphatic vessel endothelial hyaluronan receptor 1 |
| chr2_-_189179754 | 1.16 |
ENST00000374866.9
ENST00000618828.1 |
COL5A2
|
collagen type V alpha 2 chain |
| chr5_-_147453888 | 1.13 |
ENST00000398514.7
|
DPYSL3
|
dihydropyrimidinase like 3 |
| chr21_-_26845402 | 1.13 |
ENST00000284984.8
ENST00000676955.1 |
ADAMTS1
|
ADAM metallopeptidase with thrombospondin type 1 motif 1 |
| chr1_+_56645299 | 1.11 |
ENST00000371244.9
ENST00000610361.1 |
PRKAA2
|
protein kinase AMP-activated catalytic subunit alpha 2 |
| chr9_-_16870662 | 1.10 |
ENST00000380672.9
|
BNC2
|
basonuclin 2 |
| chr16_+_22206255 | 1.08 |
ENST00000263026.10
|
EEF2K
|
eukaryotic elongation factor 2 kinase |
| chr1_-_115338231 | 1.05 |
ENST00000369512.3
ENST00000680116.1 ENST00000681124.1 ENST00000675637.2 ENST00000676038.2 |
NGF
|
nerve growth factor |
| chr1_-_91886144 | 1.05 |
ENST00000212355.9
|
TGFBR3
|
transforming growth factor beta receptor 3 |
| chr9_+_19409000 | 1.05 |
ENST00000340967.3
|
ACER2
|
alkaline ceramidase 2 |
| chr5_+_38846002 | 1.05 |
ENST00000274276.8
|
OSMR
|
oncostatin M receptor |
| chr22_+_23772839 | 1.01 |
ENST00000215743.8
|
MMP11
|
matrix metallopeptidase 11 |
| chrX_-_33128360 | 1.00 |
ENST00000378677.6
|
DMD
|
dystrophin |
| chr1_+_29236544 | 1.00 |
ENST00000428026.6
ENST00000460170.2 |
PTPRU
|
protein tyrosine phosphatase receptor type U |
| chr10_-_98268186 | 0.99 |
ENST00000260702.4
|
LOXL4
|
lysyl oxidase like 4 |
| chr7_-_139036017 | 0.99 |
ENST00000275766.2
|
ZC3HAV1L
|
zinc finger CCCH-type containing, antiviral 1 like |
| chr12_-_58919493 | 0.99 |
ENST00000379141.8
|
LRIG3
|
leucine rich repeats and immunoglobulin like domains 3 |
| chr1_-_9129085 | 0.98 |
ENST00000377411.5
|
GPR157
|
G protein-coupled receptor 157 |
| chr7_+_90403386 | 0.97 |
ENST00000287916.8
ENST00000394604.5 ENST00000496677.6 ENST00000394605.2 ENST00000480135.1 |
CLDN12
ENSG00000273299.1
|
claudin 12 novel transcript |
| chr15_-_82806054 | 0.96 |
ENST00000541889.1
ENST00000334574.12 ENST00000561368.1 |
FSD2
|
fibronectin type III and SPRY domain containing 2 |
| chrX_+_56232343 | 0.95 |
ENST00000468660.6
|
KLF8
|
Kruppel like factor 8 |
| chr18_-_61892997 | 0.95 |
ENST00000312828.4
|
RNF152
|
ring finger protein 152 |
| chr18_+_6834473 | 0.89 |
ENST00000581099.5
ENST00000419673.6 ENST00000531294.5 |
ARHGAP28
|
Rho GTPase activating protein 28 |
| chr13_-_110307131 | 0.88 |
ENST00000543140.6
ENST00000375820.10 |
COL4A1
|
collagen type IV alpha 1 chain |
| chr8_-_13514821 | 0.87 |
ENST00000276297.9
|
DLC1
|
DLC1 Rho GTPase activating protein |
| chr2_+_119223815 | 0.86 |
ENST00000393106.6
ENST00000393110.7 ENST00000409811.5 ENST00000393107.2 |
STEAP3
|
STEAP3 metalloreductase |
| chr12_-_102480552 | 0.85 |
ENST00000337514.11
ENST00000307046.8 |
IGF1
|
insulin like growth factor 1 |
| chr22_-_35840218 | 0.85 |
ENST00000414461.6
ENST00000416721.6 ENST00000449924.6 ENST00000262829.11 ENST00000397305.3 |
RBFOX2
|
RNA binding fox-1 homolog 2 |
| chr9_+_114155526 | 0.84 |
ENST00000356083.8
|
COL27A1
|
collagen type XXVII alpha 1 chain |
| chr2_-_230068905 | 0.84 |
ENST00000457406.5
ENST00000295190.9 |
SLC16A14
|
solute carrier family 16 member 14 |
| chr22_-_23751080 | 0.83 |
ENST00000341976.5
|
ZNF70
|
zinc finger protein 70 |
| chr19_-_48363914 | 0.83 |
ENST00000377431.6
ENST00000293261.8 |
TMEM143
|
transmembrane protein 143 |
| chr8_-_121641424 | 0.82 |
ENST00000303924.5
|
HAS2
|
hyaluronan synthase 2 |
| chr5_-_132227808 | 0.81 |
ENST00000401867.5
ENST00000379086.5 ENST00000379100.7 ENST00000418055.5 ENST00000453286.5 ENST00000360568.8 ENST00000379104.7 ENST00000166534.8 |
P4HA2
|
prolyl 4-hydroxylase subunit alpha 2 |
| chr6_+_41638438 | 0.79 |
ENST00000441667.5
ENST00000230321.11 ENST00000373050.8 ENST00000446650.1 ENST00000435476.1 |
MDFI
|
MyoD family inhibitor |
| chr1_-_227947924 | 0.78 |
ENST00000272164.6
|
WNT9A
|
Wnt family member 9A |
| chr2_-_157628852 | 0.77 |
ENST00000243349.13
|
ACVR1C
|
activin A receptor type 1C |
| chr10_+_100347225 | 0.76 |
ENST00000370355.3
|
SCD
|
stearoyl-CoA desaturase |
| chr12_-_68933161 | 0.74 |
ENST00000549781.1
ENST00000551568.6 ENST00000548262.5 |
CPM
|
carboxypeptidase M |
| chr15_+_84817346 | 0.72 |
ENST00000258888.6
|
ALPK3
|
alpha kinase 3 |
| chrX_-_45200828 | 0.70 |
ENST00000398000.7
|
DIPK2B
|
divergent protein kinase domain 2B |
| chr19_+_46297032 | 0.70 |
ENST00000377670.9
|
HIF3A
|
hypoxia inducible factor 3 subunit alpha |
| chr3_-_69013639 | 0.68 |
ENST00000456376.2
ENST00000383701.8 |
EOGT
|
EGF domain specific O-linked N-acetylglucosamine transferase |
| chr7_+_3301242 | 0.68 |
ENST00000404826.7
|
SDK1
|
sidekick cell adhesion molecule 1 |
| chr12_+_122078740 | 0.68 |
ENST00000319080.12
|
MLXIP
|
MLX interacting protein |
| chr13_-_30307539 | 0.68 |
ENST00000380615.8
|
KATNAL1
|
katanin catalytic subunit A1 like 1 |
| chr11_+_69641146 | 0.68 |
ENST00000227507.3
ENST00000536559.1 |
CCND1
|
cyclin D1 |
| chr3_-_79019444 | 0.67 |
ENST00000618833.4
ENST00000436010.6 ENST00000618846.4 |
ROBO1
|
roundabout guidance receptor 1 |
| chr3_-_127823177 | 0.67 |
ENST00000434178.6
|
MGLL
|
monoglyceride lipase |
| chr1_-_108200335 | 0.66 |
ENST00000565488.6
|
SLC25A24
|
solute carrier family 25 member 24 |
| chr14_-_34713788 | 0.66 |
ENST00000341223.8
|
CFL2
|
cofilin 2 |
| chr15_-_65422894 | 0.66 |
ENST00000352385.3
|
IGDCC4
|
immunoglobulin superfamily DCC subclass member 4 |
| chr4_+_185143258 | 0.63 |
ENST00000281456.11
|
SLC25A4
|
solute carrier family 25 member 4 |
| chr17_+_40062956 | 0.63 |
ENST00000450525.7
|
THRA
|
thyroid hormone receptor alpha |
| chrX_-_118116746 | 0.63 |
ENST00000371882.5
ENST00000545703.5 ENST00000540167.5 |
KLHL13
|
kelch like family member 13 |
| chr4_+_74933095 | 0.63 |
ENST00000513238.5
|
PARM1
|
prostate androgen-regulated mucin-like protein 1 |
| chr8_-_69834970 | 0.62 |
ENST00000260126.9
|
SLCO5A1
|
solute carrier organic anion transporter family member 5A1 |
| chr13_-_33285682 | 0.62 |
ENST00000336934.10
|
STARD13
|
StAR related lipid transfer domain containing 13 |
| chr3_-_160565560 | 0.61 |
ENST00000334256.9
ENST00000676866.1 ENST00000469804.1 |
KPNA4
|
karyopherin subunit alpha 4 |
| chr2_-_241272812 | 0.61 |
ENST00000427007.5
ENST00000458564.5 ENST00000452065.5 ENST00000427183.6 ENST00000426343.5 ENST00000422080.5 ENST00000449504.5 ENST00000449864.5 ENST00000391975.5 |
HDLBP
|
high density lipoprotein binding protein |
| chr16_+_397183 | 0.61 |
ENST00000620944.4
ENST00000621774.4 ENST00000219479.7 |
NME4
|
NME/NM23 nucleoside diphosphate kinase 4 |
| chr10_+_113854610 | 0.60 |
ENST00000369301.3
|
NHLRC2
|
NHL repeat containing 2 |
| chr22_+_29073024 | 0.59 |
ENST00000400335.9
|
KREMEN1
|
kringle containing transmembrane protein 1 |
| chr1_-_156082412 | 0.59 |
ENST00000532414.3
|
MEX3A
|
mex-3 RNA binding family member A |
| chr9_+_101533840 | 0.59 |
ENST00000389120.8
ENST00000374819.6 ENST00000479306.5 |
RNF20
|
ring finger protein 20 |
| chr8_+_73294594 | 0.59 |
ENST00000240285.10
|
RDH10
|
retinol dehydrogenase 10 |
| chr8_+_120125093 | 0.58 |
ENST00000297848.8
ENST00000309791.8 |
COL14A1
|
collagen type XIV alpha 1 chain |
| chr2_+_99337364 | 0.58 |
ENST00000617677.1
ENST00000289371.11 |
EIF5B
|
eukaryotic translation initiation factor 5B |
| chrX_-_108438407 | 0.58 |
ENST00000334504.12
ENST00000621266.4 ENST00000538570.5 ENST00000394872.6 ENST00000545689.2 |
COL4A6
|
collagen type IV alpha 6 chain |
| chr12_+_119593758 | 0.58 |
ENST00000426426.3
|
TMEM233
|
transmembrane protein 233 |
| chr15_+_36594868 | 0.58 |
ENST00000566807.5
ENST00000643612.1 ENST00000567389.5 ENST00000562877.5 |
CDIN1
|
CDAN1 interacting nuclease 1 |
| chr11_+_114059702 | 0.57 |
ENST00000335953.9
ENST00000684612.1 ENST00000682810.1 ENST00000544220.1 |
ZBTB16
|
zinc finger and BTB domain containing 16 |
| chr12_-_56258327 | 0.56 |
ENST00000267116.8
|
ANKRD52
|
ankyrin repeat domain 52 |
| chr6_+_46652968 | 0.55 |
ENST00000371347.10
|
SLC25A27
|
solute carrier family 25 member 27 |
| chr4_-_99657820 | 0.55 |
ENST00000511828.2
|
C4orf54
|
chromosome 4 open reading frame 54 |
| chr22_-_41446777 | 0.55 |
ENST00000434408.1
ENST00000327492.4 |
TOB2
|
transducer of ERBB2, 2 |
| chr11_+_45847406 | 0.54 |
ENST00000443527.6
ENST00000616623.4 ENST00000616080.2 |
CRY2
|
cryptochrome circadian regulator 2 |
| chr3_+_172040554 | 0.54 |
ENST00000336824.8
ENST00000423424.5 |
FNDC3B
|
fibronectin type III domain containing 3B |
| chr2_+_11534039 | 0.54 |
ENST00000381486.7
|
GREB1
|
growth regulating estrogen receptor binding 1 |
| chrX_-_133415478 | 0.53 |
ENST00000370828.4
|
GPC4
|
glypican 4 |
| chr15_-_37098281 | 0.53 |
ENST00000559085.5
ENST00000397624.7 |
MEIS2
|
Meis homeobox 2 |
| chr16_-_4116403 | 0.53 |
ENST00000294016.8
|
ADCY9
|
adenylate cyclase 9 |
| chr8_+_22599586 | 0.53 |
ENST00000289989.10
ENST00000409586.7 ENST00000614574.4 |
C8orf58
|
chromosome 8 open reading frame 58 |
| chr11_+_36567997 | 0.53 |
ENST00000299440.6
|
RAG1
|
recombination activating 1 |
| chr2_+_32165841 | 0.51 |
ENST00000357055.7
ENST00000435660.5 ENST00000440718.5 ENST00000379343.6 ENST00000282587.9 ENST00000406369.2 |
SLC30A6
|
solute carrier family 30 member 6 |
| chr7_+_16646131 | 0.50 |
ENST00000415365.5
ENST00000433922.6 ENST00000630952.2 ENST00000258761.8 ENST00000405202.5 |
BZW2
|
basic leucine zipper and W2 domains 2 |
| chr5_-_32312913 | 0.50 |
ENST00000280285.9
ENST00000382142.8 ENST00000264934.5 |
MTMR12
|
myotubularin related protein 12 |
| chr2_+_74834113 | 0.50 |
ENST00000290573.7
|
HK2
|
hexokinase 2 |
| chr15_+_57376497 | 0.50 |
ENST00000281282.6
|
CGNL1
|
cingulin like 1 |
| chr7_-_27165517 | 0.49 |
ENST00000396345.1
ENST00000343483.7 |
HOXA9
|
homeobox A9 |
| chr1_-_151826085 | 0.49 |
ENST00000356728.11
|
RORC
|
RAR related orphan receptor C |
| chr5_-_41510554 | 0.49 |
ENST00000377801.8
|
PLCXD3
|
phosphatidylinositol specific phospholipase C X domain containing 3 |
| chr11_+_87037820 | 0.49 |
ENST00000340353.11
|
TMEM135
|
transmembrane protein 135 |
| chr12_-_64752871 | 0.49 |
ENST00000418919.6
|
GNS
|
glucosamine (N-acetyl)-6-sulfatase |
| chr8_+_22089140 | 0.49 |
ENST00000289921.8
|
FAM160B2
|
family with sequence similarity 160 member B2 |
| chr6_-_89412219 | 0.48 |
ENST00000369415.9
|
RRAGD
|
Ras related GTP binding D |
| chr12_+_56521798 | 0.48 |
ENST00000262031.10
|
RBMS2
|
RNA binding motif single stranded interacting protein 2 |
| chr19_-_40690629 | 0.48 |
ENST00000252891.8
|
NUMBL
|
NUMB like endocytic adaptor protein |
| chr13_+_98142552 | 0.48 |
ENST00000595437.5
|
FARP1
|
FERM, ARH/RhoGEF and pleckstrin domain protein 1 |
| chr17_+_2055094 | 0.47 |
ENST00000399849.4
ENST00000619757.5 |
HIC1
|
HIC ZBTB transcriptional repressor 1 |
| chr2_+_219434825 | 0.47 |
ENST00000312358.12
|
SPEG
|
striated muscle enriched protein kinase |
| chr10_-_59709842 | 0.47 |
ENST00000395348.8
|
SLC16A9
|
solute carrier family 16 member 9 |
| chr6_+_36678699 | 0.47 |
ENST00000405375.5
ENST00000244741.10 ENST00000373711.3 |
CDKN1A
|
cyclin dependent kinase inhibitor 1A |
| chr20_+_58692767 | 0.46 |
ENST00000356091.11
|
NPEPL1
|
aminopeptidase like 1 |
| chr3_+_184155310 | 0.46 |
ENST00000313143.9
|
DVL3
|
dishevelled segment polarity protein 3 |
| chr2_+_128091166 | 0.45 |
ENST00000259253.11
|
UGGT1
|
UDP-glucose glycoprotein glucosyltransferase 1 |
| chr18_+_48539017 | 0.45 |
ENST00000256413.8
|
CTIF
|
cap binding complex dependent translation initiation factor |
| chr14_-_75126964 | 0.45 |
ENST00000678037.1
ENST00000553823.6 ENST00000678531.1 ENST00000238616.10 |
NEK9
|
NIMA related kinase 9 |
| chr7_+_120988683 | 0.45 |
ENST00000340646.9
ENST00000310396.10 |
CPED1
|
cadherin like and PC-esterase domain containing 1 |
| chr8_+_69466617 | 0.45 |
ENST00000525061.5
ENST00000260128.8 ENST00000458141.6 |
SULF1
|
sulfatase 1 |
| chr13_-_109786567 | 0.45 |
ENST00000375856.5
|
IRS2
|
insulin receptor substrate 2 |
| chr14_+_52730154 | 0.45 |
ENST00000354586.5
ENST00000442123.6 |
STYX
|
serine/threonine/tyrosine interacting protein |
| chr9_+_125747345 | 0.45 |
ENST00000342287.9
ENST00000373489.10 ENST00000373487.8 |
PBX3
|
PBX homeobox 3 |
| chr12_-_24949026 | 0.45 |
ENST00000539780.5
ENST00000546285.1 ENST00000342945.9 ENST00000261192.12 |
BCAT1
|
branched chain amino acid transaminase 1 |
| chr14_+_74881887 | 0.44 |
ENST00000334220.9
ENST00000626051.1 ENST00000554806.5 |
DLST
|
dihydrolipoamide S-succinyltransferase |
| chr17_+_9021501 | 0.44 |
ENST00000173229.7
|
NTN1
|
netrin 1 |
| chr8_-_97277890 | 0.44 |
ENST00000322128.5
|
TSPYL5
|
TSPY like 5 |
| chr12_+_56118241 | 0.43 |
ENST00000551790.5
ENST00000552345.1 ENST00000257940.7 ENST00000551880.1 |
ESYT1
ZC3H10
|
extended synaptotagmin 1 zinc finger CCCH-type containing 10 |
| chr3_-_15859771 | 0.43 |
ENST00000399451.6
|
ANKRD28
|
ankyrin repeat domain 28 |
| chr15_-_50119215 | 0.43 |
ENST00000284509.11
ENST00000674213.1 |
ATP8B4
|
ATPase phospholipid transporting 8B4 (putative) |
| chr8_+_27633884 | 0.43 |
ENST00000301904.4
|
SCARA3
|
scavenger receptor class A member 3 |
| chr5_-_131796921 | 0.43 |
ENST00000307968.11
ENST00000307954.12 |
FNIP1
|
folliculin interacting protein 1 |
| chr10_+_86756580 | 0.42 |
ENST00000372037.8
|
BMPR1A
|
bone morphogenetic protein receptor type 1A |
| chr18_+_21363593 | 0.42 |
ENST00000580732.6
|
GREB1L
|
GREB1 like retinoic acid receptor coactivator |
| chr6_+_124962420 | 0.42 |
ENST00000521654.7
ENST00000560949.5 |
RNF217
|
ring finger protein 217 |
| chr12_+_72272360 | 0.42 |
ENST00000547300.2
ENST00000261180.10 |
TRHDE
|
thyrotropin releasing hormone degrading enzyme |
| chr3_-_142225556 | 0.42 |
ENST00000392993.7
|
GK5
|
glycerol kinase 5 |
| chr2_-_27212256 | 0.42 |
ENST00000414408.5
ENST00000310574.8 |
SLC5A6
|
solute carrier family 5 member 6 |
| chr1_+_203305510 | 0.41 |
ENST00000290551.5
|
BTG2
|
BTG anti-proliferation factor 2 |
| chr7_+_130293134 | 0.40 |
ENST00000445470.6
ENST00000492072.5 ENST00000222482.10 ENST00000473956.5 ENST00000493259.5 ENST00000486598.1 |
CPA4
|
carboxypeptidase A4 |
| chr6_+_27388748 | 0.40 |
ENST00000244576.9
|
ZNF391
|
zinc finger protein 391 |
| chr14_+_55051639 | 0.40 |
ENST00000395468.9
ENST00000622254.1 |
MAPK1IP1L
|
mitogen-activated protein kinase 1 interacting protein 1 like |
| chr16_+_70346856 | 0.40 |
ENST00000302243.12
ENST00000417604.6 |
DDX19A
|
DEAD-box helicase 19A |
| chr1_-_177969907 | 0.39 |
ENST00000308284.10
|
SEC16B
|
SEC16 homolog B, endoplasmic reticulum export factor |
| chr2_-_163735989 | 0.38 |
ENST00000333129.4
ENST00000409634.5 |
FIGN
|
fidgetin, microtubule severing factor |
| chr2_+_169733811 | 0.38 |
ENST00000392647.7
|
KLHL23
|
kelch like family member 23 |
| chr16_+_84648502 | 0.38 |
ENST00000564996.6
ENST00000258157.9 ENST00000567410.5 |
KLHL36
|
kelch like family member 36 |
| chr9_-_70414657 | 0.38 |
ENST00000377126.4
|
KLF9
|
Kruppel like factor 9 |
| chr16_-_20900319 | 0.38 |
ENST00000564349.5
ENST00000324344.9 |
ERI2
DCUN1D3
|
ERI1 exoribonuclease family member 2 defective in cullin neddylation 1 domain containing 3 |
| chr1_-_6235945 | 0.38 |
ENST00000343813.10
|
ICMT
|
isoprenylcysteine carboxyl methyltransferase |
| chr4_-_86849366 | 0.38 |
ENST00000273905.7
|
SLC10A6
|
solute carrier family 10 member 6 |
| chr3_+_33114007 | 0.38 |
ENST00000320954.11
|
CRTAP
|
cartilage associated protein |
| chrX_+_153334146 | 0.37 |
ENST00000370249.3
ENST00000650114.2 ENST00000370251.3 |
ZNF275
|
zinc finger protein 275 |
| chr3_-_101320558 | 0.37 |
ENST00000193391.8
|
IMPG2
|
interphotoreceptor matrix proteoglycan 2 |
| chr20_-_47786553 | 0.37 |
ENST00000467815.5
ENST00000359930.8 ENST00000484875.5 |
SULF2
|
sulfatase 2 |
| chr3_-_48847797 | 0.37 |
ENST00000454963.5
ENST00000296446.12 ENST00000419216.1 ENST00000265563.13 |
PRKAR2A
|
protein kinase cAMP-dependent type II regulatory subunit alpha |
| chr1_-_119648165 | 0.36 |
ENST00000421812.3
|
ZNF697
|
zinc finger protein 697 |
| chr2_-_70994809 | 0.36 |
ENST00000272438.9
|
TEX261
|
testis expressed 261 |
| chr10_+_70478761 | 0.36 |
ENST00000263563.7
|
PALD1
|
phosphatase domain containing paladin 1 |
| chr2_+_147845020 | 0.36 |
ENST00000241416.12
|
ACVR2A
|
activin A receptor type 2A |
| chr19_-_40348510 | 0.36 |
ENST00000582006.5
ENST00000582783.5 |
C19orf47
|
chromosome 19 open reading frame 47 |
| chr5_+_62578810 | 0.36 |
ENST00000334994.6
ENST00000409534.1 |
LRRC70
IPO11
|
leucine rich repeat containing 70 importin 11 |
| chr17_+_43398984 | 0.36 |
ENST00000320033.5
|
ARL4D
|
ADP ribosylation factor like GTPase 4D |
| chr2_-_39437264 | 0.36 |
ENST00000263881.8
ENST00000341681.9 |
MAP4K3
|
mitogen-activated protein kinase kinase kinase kinase 3 |
| chr1_-_45206594 | 0.35 |
ENST00000359600.6
|
ZSWIM5
|
zinc finger SWIM-type containing 5 |
| chr1_+_40783776 | 0.35 |
ENST00000347132.10
|
KCNQ4
|
potassium voltage-gated channel subfamily Q member 4 |
| chr7_-_138981307 | 0.35 |
ENST00000440172.5
ENST00000422774.2 |
KIAA1549
|
KIAA1549 |
| chr2_+_66435558 | 0.34 |
ENST00000488550.5
|
MEIS1
|
Meis homeobox 1 |
| chr5_+_172834225 | 0.34 |
ENST00000393784.8
|
ERGIC1
|
endoplasmic reticulum-golgi intermediate compartment 1 |
| chr1_+_203626775 | 0.34 |
ENST00000367218.7
|
ATP2B4
|
ATPase plasma membrane Ca2+ transporting 4 |
| chr5_-_154478218 | 0.34 |
ENST00000231121.3
|
HAND1
|
heart and neural crest derivatives expressed 1 |
| chr1_+_15617415 | 0.34 |
ENST00000480945.6
|
DDI2
|
DNA damage inducible 1 homolog 2 |
| chr14_+_55027200 | 0.34 |
ENST00000395472.2
ENST00000555846.2 |
SOCS4
|
suppressor of cytokine signaling 4 |
| chr1_-_204151884 | 0.33 |
ENST00000367201.7
|
ETNK2
|
ethanolamine kinase 2 |
| chr4_+_82900679 | 0.33 |
ENST00000302236.10
|
THAP9
|
THAP domain containing 9 |
| chr21_-_44801813 | 0.33 |
ENST00000345496.7
|
UBE2G2
|
ubiquitin conjugating enzyme E2 G2 |
| chr1_+_64745089 | 0.33 |
ENST00000294428.7
ENST00000371072.8 |
RAVER2
|
ribonucleoprotein, PTB binding 2 |
| chr11_+_32091065 | 0.33 |
ENST00000054950.4
|
RCN1
|
reticulocalbin 1 |
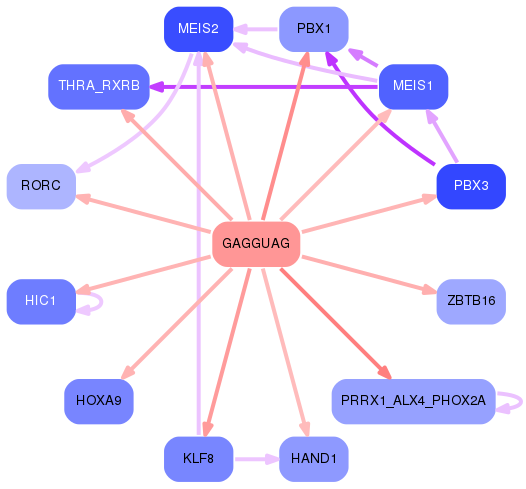
Network of associatons between targets according to the STRING database.

First level regulatory network of GAGGUAG
Gene Ontology Analysis
Gene overrepresentation in biological process category:
| Log-likelihood per target | Total log-likelihood | Term | Description |
|---|---|---|---|
| 1.3 | 5.4 | GO:0044691 | tooth eruption(GO:0044691) |
| 0.6 | 1.9 | GO:0061300 | cerebellum vasculature development(GO:0061300) |
| 0.5 | 1.6 | GO:0002025 | vasodilation by norepinephrine-epinephrine involved in regulation of systemic arterial blood pressure(GO:0002025) |
| 0.5 | 1.6 | GO:0060720 | spongiotrophoblast cell proliferation(GO:0060720) regulation of spongiotrophoblast cell proliferation(GO:0060721) cell proliferation involved in embryonic placenta development(GO:0060722) regulation of cell proliferation involved in embryonic placenta development(GO:0060723) |
| 0.5 | 1.5 | GO:0021793 | chemorepulsion of branchiomotor axon(GO:0021793) |
| 0.4 | 1.1 | GO:0034059 | response to anoxia(GO:0034059) |
| 0.4 | 1.4 | GO:2000297 | negative regulation of synapse maturation(GO:2000297) |
| 0.3 | 3.0 | GO:0060414 | aorta smooth muscle tissue morphogenesis(GO:0060414) |
| 0.3 | 1.6 | GO:2000866 | positive regulation of estrogen secretion(GO:2000863) positive regulation of estradiol secretion(GO:2000866) |
| 0.3 | 1.6 | GO:0003219 | cardiac right ventricle formation(GO:0003219) |
| 0.3 | 0.9 | GO:1904425 | negative regulation of GTP binding(GO:1904425) |
| 0.3 | 1.2 | GO:1903225 | negative regulation of endodermal cell differentiation(GO:1903225) |
| 0.3 | 1.0 | GO:0090285 | negative regulation of protein glycosylation in Golgi(GO:0090285) |
| 0.3 | 1.3 | GO:0072204 | cell-cell signaling involved in kidney development(GO:0060995) Wnt signaling pathway involved in kidney development(GO:0061289) canonical Wnt signaling pathway involved in metanephric kidney development(GO:0061290) cell-cell signaling involved in metanephros development(GO:0072204) |
| 0.3 | 0.8 | GO:1901383 | negative regulation of chorionic trophoblast cell proliferation(GO:1901383) |
| 0.3 | 0.5 | GO:1901526 | positive regulation of macromitophagy(GO:1901526) positive regulation of mitophagy in response to mitochondrial depolarization(GO:1904925) |
| 0.2 | 1.0 | GO:0032474 | otolith morphogenesis(GO:0032474) |
| 0.2 | 2.1 | GO:0000255 | allantoin metabolic process(GO:0000255) |
| 0.2 | 0.9 | GO:0061304 | retinal blood vessel morphogenesis(GO:0061304) |
| 0.2 | 1.0 | GO:0007181 | transforming growth factor beta receptor complex assembly(GO:0007181) |
| 0.2 | 0.2 | GO:1990009 | retinal cell apoptotic process(GO:1990009) |
| 0.2 | 0.8 | GO:0045226 | extracellular polysaccharide biosynthetic process(GO:0045226) extracellular polysaccharide metabolic process(GO:0046379) |
| 0.2 | 0.5 | GO:2000118 | regulation of sodium-dependent phosphate transport(GO:2000118) |
| 0.2 | 0.9 | GO:1904073 | regulation of trophectodermal cell proliferation(GO:1904073) positive regulation of trophectodermal cell proliferation(GO:1904075) |
| 0.2 | 0.2 | GO:0061152 | trachea submucosa development(GO:0061152) trachea gland development(GO:0061153) |
| 0.2 | 2.5 | GO:0043589 | skin morphogenesis(GO:0043589) |
| 0.1 | 0.1 | GO:1902809 | regulation of skeletal muscle fiber differentiation(GO:1902809) |
| 0.1 | 0.1 | GO:0046619 | optic placode formation involved in camera-type eye formation(GO:0046619) |
| 0.1 | 0.8 | GO:0003431 | growth plate cartilage chondrocyte development(GO:0003431) |
| 0.1 | 3.6 | GO:0006853 | carnitine shuttle(GO:0006853) |
| 0.1 | 0.8 | GO:0014846 | esophagus smooth muscle contraction(GO:0014846) |
| 0.1 | 1.0 | GO:0038165 | oncostatin-M-mediated signaling pathway(GO:0038165) |
| 0.1 | 0.4 | GO:0006481 | C-terminal protein methylation(GO:0006481) |
| 0.1 | 0.4 | GO:1901874 | negative regulation of post-translational protein modification(GO:1901874) |
| 0.1 | 0.9 | GO:0097461 | ferric iron import into cell(GO:0097461) ferric iron import across plasma membrane(GO:0098706) |
| 0.1 | 0.5 | GO:0021849 | neuroblast division in subventricular zone(GO:0021849) |
| 0.1 | 1.1 | GO:0032455 | nerve growth factor processing(GO:0032455) |
| 0.1 | 0.6 | GO:0051138 | positive regulation of NK T cell differentiation(GO:0051138) |
| 0.1 | 0.6 | GO:0045925 | positive regulation of female receptivity(GO:0045925) |
| 0.1 | 0.3 | GO:1903249 | regulation of cellular amine catabolic process(GO:0033241) negative regulation of cellular amine catabolic process(GO:0033242) negative regulation of the force of heart contraction(GO:0098736) regulation of arginine catabolic process(GO:1900081) negative regulation of arginine catabolic process(GO:1900082) regulation of citrulline biosynthetic process(GO:1903248) negative regulation of citrulline biosynthetic process(GO:1903249) negative regulation of cellular amino acid biosynthetic process(GO:2000283) |
| 0.1 | 0.7 | GO:0021827 | cerebral cortex tangential migration using cell-cell interactions(GO:0021823) postnatal olfactory bulb interneuron migration(GO:0021827) chemorepulsion involved in postnatal olfactory bulb interneuron migration(GO:0021836) negative regulation of negative chemotaxis(GO:0050925) |
| 0.1 | 0.6 | GO:0051562 | negative regulation of mitochondrial calcium ion concentration(GO:0051562) |
| 0.1 | 2.0 | GO:0015074 | DNA integration(GO:0015074) |
| 0.1 | 0.3 | GO:0097051 | establishment of protein localization to endoplasmic reticulum membrane(GO:0097051) positive regulation of protein lipidation(GO:1903061) |
| 0.1 | 0.3 | GO:0002581 | negative regulation of antigen processing and presentation of peptide or polysaccharide antigen via MHC class II(GO:0002581) negative regulation of endothelial cell chemotaxis(GO:2001027) |
| 0.1 | 0.4 | GO:0003186 | tricuspid valve morphogenesis(GO:0003186) lateral mesodermal cell fate commitment(GO:0048372) lateral mesodermal cell fate specification(GO:0048377) regulation of lateral mesodermal cell fate specification(GO:0048378) |
| 0.1 | 0.6 | GO:0015853 | adenine transport(GO:0015853) |
| 0.1 | 0.6 | GO:0097498 | endothelial tube lumen extension(GO:0097498) |
| 0.1 | 0.9 | GO:0010724 | regulation of definitive erythrocyte differentiation(GO:0010724) |
| 0.1 | 1.4 | GO:0048664 | neuron fate determination(GO:0048664) |
| 0.1 | 0.4 | GO:0007386 | compartment pattern specification(GO:0007386) |
| 0.1 | 0.4 | GO:0009098 | branched-chain amino acid biosynthetic process(GO:0009082) leucine biosynthetic process(GO:0009098) valine biosynthetic process(GO:0009099) |
| 0.1 | 0.4 | GO:0018242 | protein O-linked glycosylation via serine(GO:0018242) |
| 0.1 | 0.4 | GO:0033512 | L-lysine catabolic process to acetyl-CoA via saccharopine(GO:0033512) |
| 0.1 | 0.5 | GO:0002331 | pre-B cell allelic exclusion(GO:0002331) |
| 0.1 | 0.6 | GO:2001168 | regulation of histone H2B ubiquitination(GO:2001166) positive regulation of histone H2B ubiquitination(GO:2001168) |
| 0.1 | 0.4 | GO:0046167 | glycerol-3-phosphate biosynthetic process(GO:0046167) |
| 0.1 | 0.4 | GO:0015878 | biotin transport(GO:0015878) pantothenate transmembrane transport(GO:0015887) |
| 0.1 | 0.8 | GO:0071926 | endocannabinoid signaling pathway(GO:0071926) |
| 0.1 | 1.5 | GO:0014877 | response to muscle inactivity involved in regulation of muscle adaptation(GO:0014877) response to denervation involved in regulation of muscle adaptation(GO:0014894) |
| 0.1 | 0.2 | GO:0090526 | regulation of gluconeogenesis involved in cellular glucose homeostasis(GO:0090526) |
| 0.1 | 0.4 | GO:2000973 | regulation of pro-B cell differentiation(GO:2000973) |
| 0.1 | 0.2 | GO:0021758 | caudate nucleus development(GO:0021757) putamen development(GO:0021758) |
| 0.1 | 0.4 | GO:0045586 | regulation of gamma-delta T cell differentiation(GO:0045586) |
| 0.1 | 1.0 | GO:0014809 | regulation of skeletal muscle contraction by regulation of release of sequestered calcium ion(GO:0014809) |
| 0.1 | 0.7 | GO:0007185 | transmembrane receptor protein tyrosine phosphatase signaling pathway(GO:0007185) |
| 0.1 | 0.3 | GO:0014022 | neural plate elongation(GO:0014022) convergent extension involved in neural plate elongation(GO:0022007) dichotomous subdivision of terminal units involved in lung branching(GO:0060448) |
| 0.1 | 0.7 | GO:0015866 | ADP transport(GO:0015866) |
| 0.1 | 0.2 | GO:0051097 | negative regulation of helicase activity(GO:0051097) |
| 0.1 | 0.4 | GO:0051414 | response to cortisol(GO:0051414) |
| 0.1 | 0.4 | GO:0042713 | sperm ejaculation(GO:0042713) |
| 0.1 | 0.6 | GO:0010746 | regulation of plasma membrane long-chain fatty acid transport(GO:0010746) negative regulation of plasma membrane long-chain fatty acid transport(GO:0010748) |
| 0.1 | 1.8 | GO:0038063 | collagen-activated tyrosine kinase receptor signaling pathway(GO:0038063) |
| 0.1 | 0.2 | GO:0003365 | establishment of cell polarity involved in ameboidal cell migration(GO:0003365) |
| 0.1 | 0.7 | GO:0051013 | microtubule severing(GO:0051013) |
| 0.1 | 0.2 | GO:0046338 | phosphatidylethanolamine catabolic process(GO:0046338) |
| 0.1 | 0.2 | GO:0006210 | pyrimidine nucleobase catabolic process(GO:0006208) thymine catabolic process(GO:0006210) thymine metabolic process(GO:0019859) |
| 0.1 | 0.5 | GO:1990253 | cellular response to leucine(GO:0071233) cellular response to leucine starvation(GO:1990253) |
| 0.1 | 2.0 | GO:0042744 | hydrogen peroxide catabolic process(GO:0042744) |
| 0.1 | 0.5 | GO:0060574 | intestinal epithelial cell maturation(GO:0060574) |
| 0.1 | 1.1 | GO:0001542 | ovulation from ovarian follicle(GO:0001542) |
| 0.1 | 0.9 | GO:1900119 | positive regulation of execution phase of apoptosis(GO:1900119) |
| 0.1 | 2.4 | GO:0071711 | basement membrane organization(GO:0071711) |
| 0.0 | 0.1 | GO:1904674 | positive regulation of somatic stem cell population maintenance(GO:1904674) |
| 0.0 | 0.4 | GO:0033564 | anterior/posterior axon guidance(GO:0033564) |
| 0.0 | 1.0 | GO:0009950 | dorsal/ventral axis specification(GO:0009950) |
| 0.0 | 0.3 | GO:0061428 | negative regulation of transcription from RNA polymerase II promoter in response to hypoxia(GO:0061428) |
| 0.0 | 0.6 | GO:0060431 | primary lung bud formation(GO:0060431) |
| 0.0 | 1.0 | GO:0060019 | radial glial cell differentiation(GO:0060019) |
| 0.0 | 0.3 | GO:0033615 | mitochondrial proton-transporting ATP synthase complex assembly(GO:0033615) |
| 0.0 | 1.1 | GO:0043586 | tongue development(GO:0043586) |
| 0.0 | 1.9 | GO:0010971 | positive regulation of G2/M transition of mitotic cell cycle(GO:0010971) |
| 0.0 | 1.0 | GO:0072498 | embryonic skeletal joint development(GO:0072498) |
| 0.0 | 0.1 | GO:0051541 | elastin metabolic process(GO:0051541) |
| 0.0 | 0.8 | GO:1904262 | negative regulation of TORC1 signaling(GO:1904262) |
| 0.0 | 0.1 | GO:0071930 | negative regulation of transcription involved in G1/S transition of mitotic cell cycle(GO:0071930) |
| 0.0 | 0.7 | GO:0030043 | actin filament fragmentation(GO:0030043) |
| 0.0 | 0.1 | GO:0051182 | coenzyme transport(GO:0051182) |
| 0.0 | 0.2 | GO:0036233 | glycine import(GO:0036233) |
| 0.0 | 0.2 | GO:0006546 | glycine catabolic process(GO:0006546) glycine decarboxylation via glycine cleavage system(GO:0019464) |
| 0.0 | 0.3 | GO:0070973 | protein localization to endoplasmic reticulum exit site(GO:0070973) |
| 0.0 | 0.2 | GO:0034093 | positive regulation of maintenance of sister chromatid cohesion(GO:0034093) positive regulation of maintenance of mitotic sister chromatid cohesion(GO:0034184) |
| 0.0 | 0.2 | GO:0016240 | autophagosome docking(GO:0016240) |
| 0.0 | 0.1 | GO:1903526 | negative regulation of membrane tubulation(GO:1903526) |
| 0.0 | 0.1 | GO:0009107 | lipoate biosynthetic process(GO:0009107) |
| 0.0 | 0.2 | GO:0006740 | NADPH regeneration(GO:0006740) |
| 0.0 | 0.2 | GO:0042986 | positive regulation of amyloid precursor protein biosynthetic process(GO:0042986) |
| 0.0 | 0.1 | GO:0034148 | regulation of toll-like receptor 5 signaling pathway(GO:0034147) negative regulation of toll-like receptor 5 signaling pathway(GO:0034148) negative regulation of nucleotide-binding oligomerization domain containing 1 signaling pathway(GO:0070429) |
| 0.0 | 2.7 | GO:0030574 | collagen catabolic process(GO:0030574) |
| 0.0 | 0.6 | GO:0006228 | UTP biosynthetic process(GO:0006228) |
| 0.0 | 0.5 | GO:0006011 | UDP-glucose metabolic process(GO:0006011) |
| 0.0 | 1.1 | GO:0030214 | hyaluronan catabolic process(GO:0030214) |
| 0.0 | 0.1 | GO:0046778 | modification by virus of host mRNA processing(GO:0046778) |
| 0.0 | 0.0 | GO:0006097 | glyoxylate cycle(GO:0006097) |
| 0.0 | 0.4 | GO:0070863 | positive regulation of protein exit from endoplasmic reticulum(GO:0070863) |
| 0.0 | 1.1 | GO:0051764 | actin crosslink formation(GO:0051764) |
| 0.0 | 0.2 | GO:2000234 | positive regulation of ribosome biogenesis(GO:0090070) positive regulation of rRNA processing(GO:2000234) |
| 0.0 | 0.3 | GO:0061042 | vascular wound healing(GO:0061042) |
| 0.0 | 0.6 | GO:0045116 | protein neddylation(GO:0045116) |
| 0.0 | 0.2 | GO:0030311 | poly-N-acetyllactosamine biosynthetic process(GO:0030311) |
| 0.0 | 0.8 | GO:0006607 | NLS-bearing protein import into nucleus(GO:0006607) |
| 0.0 | 0.5 | GO:2000480 | negative regulation of cAMP-dependent protein kinase activity(GO:2000480) |
| 0.0 | 0.5 | GO:0009650 | UV protection(GO:0009650) |
| 0.0 | 0.3 | GO:0038031 | non-canonical Wnt signaling pathway via JNK cascade(GO:0038031) |
| 0.0 | 0.3 | GO:0010533 | regulation of activation of Janus kinase activity(GO:0010533) |
| 0.0 | 0.6 | GO:0034384 | high-density lipoprotein particle clearance(GO:0034384) |
| 0.0 | 1.3 | GO:0030206 | chondroitin sulfate biosynthetic process(GO:0030206) |
| 0.0 | 0.4 | GO:0042340 | keratan sulfate catabolic process(GO:0042340) |
| 0.0 | 1.0 | GO:0016338 | calcium-independent cell-cell adhesion via plasma membrane cell-adhesion molecules(GO:0016338) |
| 0.0 | 0.5 | GO:0046415 | urate metabolic process(GO:0046415) |
| 0.0 | 0.3 | GO:0042985 | negative regulation of amyloid precursor protein biosynthetic process(GO:0042985) |
| 0.0 | 0.5 | GO:0019511 | peptidyl-proline hydroxylation(GO:0019511) |
| 0.0 | 0.2 | GO:0017182 | peptidyl-diphthamide metabolic process(GO:0017182) peptidyl-diphthamide biosynthetic process from peptidyl-histidine(GO:0017183) |
| 0.0 | 0.1 | GO:0032927 | positive regulation of activin receptor signaling pathway(GO:0032927) |
| 0.0 | 0.1 | GO:0097156 | fasciculation of motor neuron axon(GO:0097156) |
| 0.0 | 0.2 | GO:0097012 | cellular response to granulocyte macrophage colony-stimulating factor stimulus(GO:0097011) response to granulocyte macrophage colony-stimulating factor(GO:0097012) |
| 0.0 | 0.2 | GO:0070649 | formin-nucleated actin cable assembly(GO:0070649) |
| 0.0 | 0.2 | GO:0060174 | limb bud formation(GO:0060174) |
| 0.0 | 0.5 | GO:0034199 | activation of protein kinase A activity(GO:0034199) |
| 0.0 | 0.2 | GO:0090625 | mRNA cleavage involved in gene silencing by siRNA(GO:0090625) |
| 0.0 | 0.6 | GO:0045880 | positive regulation of smoothened signaling pathway(GO:0045880) |
| 0.0 | 0.4 | GO:0006610 | ribosomal protein import into nucleus(GO:0006610) |
| 0.0 | 0.1 | GO:0070966 | nuclear-transcribed mRNA catabolic process, no-go decay(GO:0070966) |
| 0.0 | 0.5 | GO:0036315 | cellular response to sterol(GO:0036315) |
| 0.0 | 0.1 | GO:2000616 | negative regulation of histone H3-K9 acetylation(GO:2000616) |
| 0.0 | 0.3 | GO:1990440 | positive regulation of transcription from RNA polymerase II promoter in response to endoplasmic reticulum stress(GO:1990440) |
| 0.0 | 0.7 | GO:0048148 | behavioral response to cocaine(GO:0048148) |
| 0.0 | 0.5 | GO:0042118 | endothelial cell activation(GO:0042118) |
| 0.0 | 0.0 | GO:0045645 | regulation of eosinophil differentiation(GO:0045643) positive regulation of eosinophil differentiation(GO:0045645) |
| 0.0 | 0.3 | GO:0060044 | negative regulation of cardiac muscle cell proliferation(GO:0060044) |
| 0.0 | 0.3 | GO:0045023 | G0 to G1 transition(GO:0045023) |
| 0.0 | 0.1 | GO:0015811 | L-cystine transport(GO:0015811) |
| 0.0 | 0.1 | GO:0006104 | succinyl-CoA metabolic process(GO:0006104) |
| 0.0 | 0.3 | GO:0098719 | sodium ion import across plasma membrane(GO:0098719) sodium ion import into cell(GO:1990118) |
| 0.0 | 0.6 | GO:0043252 | sodium-independent organic anion transport(GO:0043252) |
| 0.0 | 0.1 | GO:2000503 | positive regulation of natural killer cell chemotaxis(GO:2000503) |
| 0.0 | 0.7 | GO:0005980 | glycogen catabolic process(GO:0005980) |
| 0.0 | 0.4 | GO:0045332 | phospholipid translocation(GO:0045332) |
| 0.0 | 0.1 | GO:0002071 | glandular epithelial cell maturation(GO:0002071) |
| 0.0 | 0.0 | GO:0009386 | translational attenuation(GO:0009386) |
| 0.0 | 0.6 | GO:0045671 | negative regulation of osteoclast differentiation(GO:0045671) |
| 0.0 | 0.1 | GO:2000049 | positive regulation of cell-cell adhesion mediated by cadherin(GO:2000049) |
| 0.0 | 0.3 | GO:0032354 | response to follicle-stimulating hormone(GO:0032354) |
| 0.0 | 0.8 | GO:0043392 | negative regulation of DNA binding(GO:0043392) |
| 0.0 | 0.2 | GO:0090435 | protein localization to nuclear envelope(GO:0090435) |
| 0.0 | 0.2 | GO:0061088 | regulation of sequestering of zinc ion(GO:0061088) |
| 0.0 | 0.2 | GO:1904424 | regulation of GTP binding(GO:1904424) |
| 0.0 | 0.1 | GO:0017196 | N-terminal peptidyl-methionine acetylation(GO:0017196) |
| 0.0 | 0.5 | GO:0006027 | glycosaminoglycan catabolic process(GO:0006027) |
| 0.0 | 0.3 | GO:0008655 | pyrimidine-containing compound salvage(GO:0008655) pyrimidine nucleoside salvage(GO:0043097) |
| 0.0 | 0.4 | GO:2000178 | negative regulation of neural precursor cell proliferation(GO:2000178) |
| 0.0 | 0.5 | GO:0032094 | response to food(GO:0032094) |
| 0.0 | 0.1 | GO:0031118 | rRNA pseudouridine synthesis(GO:0031118) |
| 0.0 | 0.3 | GO:0030199 | collagen fibril organization(GO:0030199) |
| 0.0 | 0.8 | GO:0046949 | fatty-acyl-CoA biosynthetic process(GO:0046949) |
| 0.0 | 0.1 | GO:1903593 | regulation of histamine secretion by mast cell(GO:1903593) |
| 0.0 | 0.1 | GO:0033504 | floor plate development(GO:0033504) |
| 0.0 | 0.1 | GO:0072396 | response to cell cycle checkpoint signaling(GO:0072396) response to DNA integrity checkpoint signaling(GO:0072402) response to DNA damage checkpoint signaling(GO:0072423) |
| 0.0 | 0.6 | GO:0051973 | positive regulation of telomerase activity(GO:0051973) |
| 0.0 | 0.1 | GO:1990314 | cellular response to insulin-like growth factor stimulus(GO:1990314) |
| 0.0 | 0.2 | GO:0072553 | terminal button organization(GO:0072553) |
| 0.0 | 0.4 | GO:0010569 | regulation of double-strand break repair via homologous recombination(GO:0010569) |
| 0.0 | 0.2 | GO:0007084 | mitotic nuclear envelope reassembly(GO:0007084) |
| 0.0 | 0.3 | GO:0048681 | negative regulation of axon regeneration(GO:0048681) |
Gene overrepresentation in cellular component category:
| Log-likelihood per target | Total log-likelihood | Term | Description |
|---|---|---|---|
| 1.7 | 5.2 | GO:0005584 | collagen type I trimer(GO:0005584) |
| 0.7 | 2.1 | GO:0070195 | growth hormone receptor complex(GO:0070195) |
| 0.4 | 5.1 | GO:0005583 | fibrillar collagen trimer(GO:0005583) banded collagen fibril(GO:0098643) |
| 0.3 | 1.0 | GO:0005900 | oncostatin-M receptor complex(GO:0005900) |
| 0.3 | 5.4 | GO:0098651 | basement membrane collagen trimer(GO:0098651) |
| 0.2 | 1.4 | GO:0034673 | inhibin-betaglycan-ActRII complex(GO:0034673) |
| 0.1 | 1.7 | GO:0002116 | semaphorin receptor complex(GO:0002116) |
| 0.1 | 0.6 | GO:0048179 | activin receptor complex(GO:0048179) |
| 0.1 | 0.5 | GO:0070557 | PCNA-p21 complex(GO:0070557) |
| 0.1 | 0.3 | GO:0060187 | cell pole(GO:0060187) |
| 0.1 | 0.6 | GO:0030934 | anchoring collagen complex(GO:0030934) |
| 0.1 | 0.5 | GO:1990131 | Gtr1-Gtr2 GTPase complex(GO:1990131) |
| 0.1 | 1.8 | GO:0031588 | nucleotide-activated protein kinase complex(GO:0031588) |
| 0.1 | 0.9 | GO:0042567 | insulin-like growth factor ternary complex(GO:0042567) |
| 0.1 | 0.6 | GO:0033503 | HULC complex(GO:0033503) |
| 0.1 | 1.0 | GO:0016013 | syntrophin complex(GO:0016013) |
| 0.1 | 0.2 | GO:1990723 | cytoplasmic periphery of the nuclear pore complex(GO:1990723) |
| 0.0 | 0.4 | GO:0033165 | interphotoreceptor matrix(GO:0033165) |
| 0.0 | 0.4 | GO:0045252 | oxoglutarate dehydrogenase complex(GO:0045252) |
| 0.0 | 0.1 | GO:0035189 | Rb-E2F complex(GO:0035189) |
| 0.0 | 4.3 | GO:0031463 | Cul3-RING ubiquitin ligase complex(GO:0031463) |
| 0.0 | 0.2 | GO:0090571 | RNA polymerase II transcription repressor complex(GO:0090571) |
| 0.0 | 0.2 | GO:0005956 | protein kinase CK2 complex(GO:0005956) |
| 0.0 | 0.4 | GO:1990712 | HFE-transferrin receptor complex(GO:1990712) |
| 0.0 | 0.1 | GO:0034665 | integrin alpha1-beta1 complex(GO:0034665) |
| 0.0 | 0.5 | GO:0008074 | guanylate cyclase complex, soluble(GO:0008074) |
| 0.0 | 0.3 | GO:0031313 | extrinsic component of endosome membrane(GO:0031313) |
| 0.0 | 0.3 | GO:0005577 | fibrinogen complex(GO:0005577) |
| 0.0 | 0.1 | GO:0044308 | axonal spine(GO:0044308) |
| 0.0 | 0.3 | GO:0033018 | sarcoplasmic reticulum lumen(GO:0033018) |
| 0.0 | 1.6 | GO:0030173 | integral component of Golgi membrane(GO:0030173) |
| 0.0 | 0.2 | GO:0030868 | smooth endoplasmic reticulum membrane(GO:0030868) smooth endoplasmic reticulum part(GO:0097425) |
| 0.0 | 0.1 | GO:0030062 | mitochondrial tricarboxylic acid cycle enzyme complex(GO:0030062) |
| 0.0 | 2.2 | GO:0031093 | platelet alpha granule lumen(GO:0031093) |
| 0.0 | 0.2 | GO:0097452 | GAIT complex(GO:0097452) |
| 0.0 | 10.8 | GO:0005578 | proteinaceous extracellular matrix(GO:0005578) |
| 0.0 | 0.1 | GO:0031417 | NatC complex(GO:0031417) |
| 0.0 | 0.1 | GO:0032444 | activin responsive factor complex(GO:0032444) |
| 0.0 | 0.2 | GO:0030915 | Smc5-Smc6 complex(GO:0030915) |
| 0.0 | 0.1 | GO:0097422 | tubular endosome(GO:0097422) |
| 0.0 | 1.5 | GO:0030669 | clathrin-coated endocytic vesicle membrane(GO:0030669) |
| 0.0 | 0.6 | GO:0034364 | high-density lipoprotein particle(GO:0034364) |
| 0.0 | 0.1 | GO:0000110 | nucleotide-excision repair factor 1 complex(GO:0000110) |
| 0.0 | 1.0 | GO:0016235 | aggresome(GO:0016235) |
| 0.0 | 1.1 | GO:0005796 | Golgi lumen(GO:0005796) |
| 0.0 | 0.2 | GO:0000322 | storage vacuole(GO:0000322) |
| 0.0 | 0.1 | GO:0005851 | eukaryotic translation initiation factor 2B complex(GO:0005851) |
| 0.0 | 0.2 | GO:0005677 | chromatin silencing complex(GO:0005677) |
| 0.0 | 0.2 | GO:0005847 | mRNA cleavage and polyadenylation specificity factor complex(GO:0005847) |
| 0.0 | 0.9 | GO:0005771 | multivesicular body(GO:0005771) |
| 0.0 | 0.4 | GO:0044322 | endoplasmic reticulum quality control compartment(GO:0044322) |
| 0.0 | 0.6 | GO:0005581 | collagen trimer(GO:0005581) |
Gene overrepresentation in molecular function category:
| Log-likelihood per target | Total log-likelihood | Term | Description |
|---|---|---|---|
| 0.5 | 1.6 | GO:0004939 | beta-adrenergic receptor activity(GO:0004939) |
| 0.5 | 9.1 | GO:0048407 | platelet-derived growth factor binding(GO:0048407) |
| 0.4 | 2.0 | GO:0005152 | interleukin-1 receptor antagonist activity(GO:0005152) |
| 0.4 | 1.1 | GO:0047322 | [hydroxymethylglutaryl-CoA reductase (NADPH)] kinase activity(GO:0047322) [acetyl-CoA carboxylase] kinase activity(GO:0050405) |
| 0.4 | 1.8 | GO:0008466 | glycogenin glucosyltransferase activity(GO:0008466) |
| 0.3 | 1.0 | GO:0070123 | transforming growth factor beta receptor activity, type III(GO:0070123) |
| 0.3 | 1.1 | GO:0005163 | nerve growth factor receptor binding(GO:0005163) |
| 0.3 | 0.8 | GO:0038100 | nodal binding(GO:0038100) |
| 0.2 | 1.0 | GO:0004924 | oncostatin-M receptor activity(GO:0004924) |
| 0.2 | 0.8 | GO:0050501 | hyaluronan synthase activity(GO:0050501) |
| 0.2 | 0.6 | GO:0005471 | ATP:ADP antiporter activity(GO:0005471) adenine transmembrane transporter activity(GO:0015207) |
| 0.1 | 1.3 | GO:0008449 | N-acetylglucosamine-6-sulfatase activity(GO:0008449) |
| 0.1 | 0.9 | GO:0052851 | cupric reductase activity(GO:0008823) ferric-chelate reductase (NADPH) activity(GO:0052851) |
| 0.1 | 0.7 | GO:0016262 | protein N-acetylglucosaminyltransferase activity(GO:0016262) |
| 0.1 | 1.2 | GO:0001517 | N-acetylglucosamine 6-O-sulfotransferase activity(GO:0001517) |
| 0.1 | 0.4 | GO:0003880 | protein C-terminal carboxyl O-methyltransferase activity(GO:0003880) |
| 0.1 | 0.3 | GO:0036487 | nitric-oxide synthase inhibitor activity(GO:0036487) |
| 0.1 | 0.8 | GO:0016215 | stearoyl-CoA 9-desaturase activity(GO:0004768) acyl-CoA desaturase activity(GO:0016215) |
| 0.1 | 0.8 | GO:0004656 | procollagen-proline 4-dioxygenase activity(GO:0004656) |
| 0.1 | 0.5 | GO:0019912 | cyclin-dependent protein kinase activating kinase activity(GO:0019912) |
| 0.1 | 0.4 | GO:0004084 | branched-chain-amino-acid transaminase activity(GO:0004084) L-leucine transaminase activity(GO:0052654) L-valine transaminase activity(GO:0052655) L-isoleucine transaminase activity(GO:0052656) |
| 0.1 | 0.8 | GO:0098821 | BMP receptor activity(GO:0098821) |
| 0.1 | 0.4 | GO:0004370 | glycerol kinase activity(GO:0004370) |
| 0.1 | 0.5 | GO:0042030 | ATPase inhibitor activity(GO:0042030) |
| 0.1 | 0.8 | GO:0017040 | ceramidase activity(GO:0017040) |
| 0.1 | 1.1 | GO:0035374 | chondroitin sulfate binding(GO:0035374) |
| 0.1 | 0.3 | GO:0055100 | adiponectin binding(GO:0055100) |
| 0.1 | 0.4 | GO:0016748 | succinyltransferase activity(GO:0016748) |
| 0.1 | 0.2 | GO:0004047 | aminomethyltransferase activity(GO:0004047) |
| 0.1 | 3.1 | GO:0070064 | proline-rich region binding(GO:0070064) |
| 0.1 | 0.2 | GO:0008746 | NAD(P)+ transhydrogenase activity(GO:0008746) oxidoreductase activity, acting on NAD(P)H, NAD(P) as acceptor(GO:0016652) |
| 0.1 | 0.3 | GO:0004803 | transposase activity(GO:0004803) |
| 0.1 | 0.7 | GO:0005347 | ATP transmembrane transporter activity(GO:0005347) ADP transmembrane transporter activity(GO:0015217) |
| 0.1 | 0.2 | GO:0008330 | protein tyrosine/threonine phosphatase activity(GO:0008330) |
| 0.1 | 0.3 | GO:0070051 | fibrinogen binding(GO:0070051) collagen V binding(GO:0070052) |
| 0.1 | 1.6 | GO:0042813 | Wnt-activated receptor activity(GO:0042813) |
| 0.1 | 0.4 | GO:0008523 | sodium-dependent multivitamin transmembrane transporter activity(GO:0008523) |
| 0.1 | 0.5 | GO:1904929 | coreceptor activity involved in Wnt signaling pathway(GO:0071936) coreceptor activity involved in Wnt signaling pathway, planar cell polarity pathway(GO:1904929) |
| 0.1 | 7.4 | GO:0005201 | extracellular matrix structural constituent(GO:0005201) |
| 0.1 | 0.7 | GO:0008046 | axon guidance receptor activity(GO:0008046) |
| 0.1 | 1.6 | GO:0070330 | aromatase activity(GO:0070330) |
| 0.1 | 0.4 | GO:0008508 | bile acid:sodium symporter activity(GO:0008508) |
| 0.1 | 0.5 | GO:0004340 | glucokinase activity(GO:0004340) hexokinase activity(GO:0004396) fructokinase activity(GO:0008865) mannokinase activity(GO:0019158) |
| 0.0 | 0.7 | GO:0008568 | microtubule-severing ATPase activity(GO:0008568) |
| 0.0 | 0.6 | GO:0003680 | AT DNA binding(GO:0003680) |
| 0.0 | 0.3 | GO:0004366 | glycerol-3-phosphate O-acyltransferase activity(GO:0004366) |
| 0.0 | 0.2 | GO:0015375 | glycine:sodium symporter activity(GO:0015375) |
| 0.0 | 1.4 | GO:0004653 | polypeptide N-acetylgalactosaminyltransferase activity(GO:0004653) |
| 0.0 | 1.0 | GO:0008349 | MAP kinase kinase kinase kinase activity(GO:0008349) |
| 0.0 | 0.8 | GO:0047372 | acylglycerol lipase activity(GO:0047372) |
| 0.0 | 4.2 | GO:0050840 | extracellular matrix binding(GO:0050840) |
| 0.0 | 0.5 | GO:0008142 | oxysterol binding(GO:0008142) |
| 0.0 | 0.6 | GO:1901612 | cardiolipin binding(GO:1901612) |
| 0.0 | 0.6 | GO:0052650 | NADP-retinol dehydrogenase activity(GO:0052650) |
| 0.0 | 1.1 | GO:0005540 | hyaluronic acid binding(GO:0005540) |
| 0.0 | 0.7 | GO:0017154 | semaphorin receptor activity(GO:0017154) |
| 0.0 | 1.0 | GO:0050998 | nitric-oxide synthase binding(GO:0050998) |
| 0.0 | 0.2 | GO:0004741 | [pyruvate dehydrogenase (lipoamide)] phosphatase activity(GO:0004741) |
| 0.0 | 0.1 | GO:0098639 | collagen binding involved in cell-matrix adhesion(GO:0098639) |
| 0.0 | 1.0 | GO:0016641 | oxidoreductase activity, acting on the CH-NH2 group of donors, oxygen as acceptor(GO:0016641) |
| 0.0 | 1.5 | GO:0071837 | HMG box domain binding(GO:0071837) |
| 0.0 | 0.6 | GO:0070324 | thyroid hormone binding(GO:0070324) |
| 0.0 | 0.1 | GO:0003963 | RNA-3'-phosphate cyclase activity(GO:0003963) |
| 0.0 | 0.1 | GO:0030158 | protein xylosyltransferase activity(GO:0030158) |
| 0.0 | 1.1 | GO:0005109 | frizzled binding(GO:0005109) |
| 0.0 | 0.4 | GO:0008603 | cAMP-dependent protein kinase regulator activity(GO:0008603) |
| 0.0 | 0.5 | GO:0004383 | guanylate cyclase activity(GO:0004383) |
| 0.0 | 0.3 | GO:0071532 | ankyrin repeat binding(GO:0071532) |
| 0.0 | 0.6 | GO:0042809 | vitamin D receptor binding(GO:0042809) |
| 0.0 | 0.3 | GO:0004679 | AMP-activated protein kinase activity(GO:0004679) |
| 0.0 | 0.1 | GO:0061676 | importin-alpha family protein binding(GO:0061676) |
| 0.0 | 0.1 | GO:0004774 | succinate-CoA ligase activity(GO:0004774) |
| 0.0 | 0.4 | GO:0005149 | interleukin-1 receptor binding(GO:0005149) |
| 0.0 | 1.2 | GO:0005159 | insulin-like growth factor receptor binding(GO:0005159) |
| 0.0 | 0.1 | GO:0000702 | oxidized base lesion DNA N-glycosylase activity(GO:0000702) |
| 0.0 | 0.8 | GO:0004181 | metallocarboxypeptidase activity(GO:0004181) |
| 0.0 | 0.3 | GO:0015386 | potassium:proton antiporter activity(GO:0015386) |
| 0.0 | 0.1 | GO:0005168 | neurotrophin TRKA receptor binding(GO:0005168) |
| 0.0 | 0.1 | GO:0036033 | mediator complex binding(GO:0036033) |
| 0.0 | 0.9 | GO:0008235 | metalloexopeptidase activity(GO:0008235) |
| 0.0 | 0.1 | GO:0050510 | N-acetylgalactosaminyl-proteoglycan 3-beta-glucuronosyltransferase activity(GO:0050510) |
| 0.0 | 0.1 | GO:0042285 | UDP-xylosyltransferase activity(GO:0035252) xylosyltransferase activity(GO:0042285) |
| 0.0 | 0.5 | GO:0071949 | FAD binding(GO:0071949) |
| 0.0 | 0.1 | GO:0017002 | activin-activated receptor activity(GO:0017002) |
| 0.0 | 0.1 | GO:0010521 | telomerase inhibitor activity(GO:0010521) |
| 0.0 | 0.7 | GO:0005001 | transmembrane receptor protein tyrosine phosphatase activity(GO:0005001) transmembrane receptor protein phosphatase activity(GO:0019198) |
| 0.0 | 0.1 | GO:0015184 | L-cystine transmembrane transporter activity(GO:0015184) |
| 0.0 | 0.2 | GO:0000990 | transcription factor activity, core RNA polymerase binding(GO:0000990) |
| 0.0 | 0.8 | GO:0008139 | nuclear localization sequence binding(GO:0008139) |
| 0.0 | 0.2 | GO:0004862 | cAMP-dependent protein kinase inhibitor activity(GO:0004862) |
| 0.0 | 0.6 | GO:0015347 | sodium-independent organic anion transmembrane transporter activity(GO:0015347) |
| 0.0 | 0.1 | GO:0031726 | CCR1 chemokine receptor binding(GO:0031726) |
| 0.0 | 0.4 | GO:0004012 | phospholipid-translocating ATPase activity(GO:0004012) |
| 0.0 | 0.1 | GO:0035251 | UDP-glucosyltransferase activity(GO:0035251) |
| 0.0 | 0.8 | GO:0031624 | ubiquitin conjugating enzyme binding(GO:0031624) |
| 0.0 | 0.3 | GO:0043225 | anion transmembrane-transporting ATPase activity(GO:0043225) |
| 0.0 | 0.2 | GO:0008526 | phosphatidylinositol transporter activity(GO:0008526) |
| 0.0 | 0.2 | GO:0043522 | leucine zipper domain binding(GO:0043522) |
| 0.0 | 0.2 | GO:0047499 | calcium-independent phospholipase A2 activity(GO:0047499) |
| 0.0 | 2.0 | GO:0004222 | metalloendopeptidase activity(GO:0004222) |
| 0.0 | 0.2 | GO:0001075 | transcription factor activity, RNA polymerase II core promoter sequence-specific binding involved in preinitiation complex assembly(GO:0001075) |
Gene overrepresentation in curated gene sets: canonical pathways category:
| Log-likelihood per target | Total log-likelihood | Term | Description |
|---|---|---|---|
| 0.2 | 16.2 | NABA COLLAGENS | Genes encoding collagen proteins |
| 0.1 | 1.8 | PID P38 GAMMA DELTA PATHWAY | Signaling mediated by p38-gamma and p38-delta |
| 0.1 | 1.0 | ST TYPE I INTERFERON PATHWAY | Type I Interferon (alpha/beta IFN) Pathway |
| 0.1 | 2.4 | PID WNT SIGNALING PATHWAY | Wnt signaling network |
| 0.0 | 1.8 | NABA BASEMENT MEMBRANES | Genes encoding structural components of basement membranes |
| 0.0 | 1.7 | SA TRKA RECEPTOR | The TrkA receptor binds nerve growth factor to activate MAP kinase pathways and promote cell growth. |
| 0.0 | 3.0 | SIG REGULATION OF THE ACTIN CYTOSKELETON BY RHO GTPASES | Genes related to regulation of the actin cytoskeleton |
| 0.0 | 0.9 | PID HIF1A PATHWAY | Hypoxic and oxygen homeostasis regulation of HIF-1-alpha |
| 0.0 | 8.6 | NABA ECM REGULATORS | Genes encoding enzymes and their regulators involved in the remodeling of the extracellular matrix |
| 0.0 | 0.6 | PID ALK1 PATHWAY | ALK1 signaling events |
| 0.0 | 0.5 | PID CIRCADIAN PATHWAY | Circadian rhythm pathway |
| 0.0 | 1.7 | PID HES HEY PATHWAY | Notch-mediated HES/HEY network |
| 0.0 | 0.6 | PID LPA4 PATHWAY | LPA4-mediated signaling events |
| 0.0 | 1.4 | PID IGF1 PATHWAY | IGF1 pathway |
| 0.0 | 2.0 | PID RHOA REG PATHWAY | Regulation of RhoA activity |
| 0.0 | 0.2 | PID RANBP2 PATHWAY | Sumoylation by RanBP2 regulates transcriptional repression |
| 0.0 | 0.5 | PID BETA CATENIN DEG PATHWAY | Degradation of beta catenin |
| 0.0 | 0.3 | SIG IL4RECEPTOR IN B LYPHOCYTES | Genes related to IL4 rceptor signaling in B lymphocytes |
| 0.0 | 1.0 | PID LKB1 PATHWAY | LKB1 signaling events |
| 0.0 | 0.9 | PID FOXO PATHWAY | FoxO family signaling |
| 0.0 | 1.1 | PID TGFBR PATHWAY | TGF-beta receptor signaling |
| 0.0 | 0.9 | PID FAK PATHWAY | Signaling events mediated by focal adhesion kinase |
Gene overrepresentation in curated gene sets: REACTOME pathways category:
| Log-likelihood per target | Total log-likelihood | Term | Description |
|---|---|---|---|
| 0.2 | 5.2 | REACTOME PLATELET ADHESION TO EXPOSED COLLAGEN | Genes involved in Platelet Adhesion to exposed collagen |
| 0.1 | 11.3 | REACTOME COLLAGEN FORMATION | Genes involved in Collagen formation |
| 0.1 | 1.4 | REACTOME REGULATION OF RHEB GTPASE ACTIVITY BY AMPK | Genes involved in Regulation of Rheb GTPase activity by AMPK |
| 0.1 | 1.9 | REACTOME HYALURONAN METABOLISM | Genes involved in Hyaluronan metabolism |
| 0.1 | 1.1 | REACTOME P75NTR RECRUITS SIGNALLING COMPLEXES | Genes involved in p75NTR recruits signalling complexes |
| 0.1 | 2.1 | REACTOME PROLACTIN RECEPTOR SIGNALING | Genes involved in Prolactin receptor signaling |
| 0.1 | 1.3 | REACTOME ENDOGENOUS STEROLS | Genes involved in Endogenous sterols |
| 0.1 | 1.1 | REACTOME MTORC1 MEDIATED SIGNALLING | Genes involved in mTORC1-mediated signalling |
| 0.1 | 1.6 | REACTOME GLYCOGEN BREAKDOWN GLYCOGENOLYSIS | Genes involved in Glycogen breakdown (glycogenolysis) |
| 0.0 | 1.4 | REACTOME CRMPS IN SEMA3A SIGNALING | Genes involved in CRMPs in Sema3A signaling |
| 0.0 | 0.4 | REACTOME ROLE OF SECOND MESSENGERS IN NETRIN1 SIGNALING | Genes involved in Role of second messengers in netrin-1 signaling |
| 0.0 | 0.6 | REACTOME ADENYLATE CYCLASE ACTIVATING PATHWAY | Genes involved in Adenylate cyclase activating pathway |
| 0.0 | 1.3 | REACTOME SIGNALING BY NODAL | Genes involved in Signaling by NODAL |
| 0.0 | 1.3 | REACTOME CHONDROITIN SULFATE BIOSYNTHESIS | Genes involved in Chondroitin sulfate biosynthesis |
| 0.0 | 1.5 | REACTOME AMINE LIGAND BINDING RECEPTORS | Genes involved in Amine ligand-binding receptors |
| 0.0 | 0.8 | REACTOME CITRIC ACID CYCLE TCA CYCLE | Genes involved in Citric acid cycle (TCA cycle) |
| 0.0 | 1.0 | REACTOME DEGRADATION OF THE EXTRACELLULAR MATRIX | Genes involved in Degradation of the extracellular matrix |
| 0.0 | 0.7 | REACTOME GROWTH HORMONE RECEPTOR SIGNALING | Genes involved in Growth hormone receptor signaling |
| 0.0 | 0.4 | REACTOME CALNEXIN CALRETICULIN CYCLE | Genes involved in Calnexin/calreticulin cycle |
| 0.0 | 0.4 | REACTOME KERATAN SULFATE DEGRADATION | Genes involved in Keratan sulfate degradation |
| 0.0 | 0.7 | REACTOME BRANCHED CHAIN AMINO ACID CATABOLISM | Genes involved in Branched-chain amino acid catabolism |
| 0.0 | 0.7 | REACTOME AKT PHOSPHORYLATES TARGETS IN THE CYTOSOL | Genes involved in AKT phosphorylates targets in the cytosol |
| 0.0 | 0.4 | REACTOME VITAMIN B5 PANTOTHENATE METABOLISM | Genes involved in Vitamin B5 (pantothenate) metabolism |
| 0.0 | 0.4 | REACTOME PKA MEDIATED PHOSPHORYLATION OF CREB | Genes involved in PKA-mediated phosphorylation of CREB |
| 0.0 | 0.8 | REACTOME TRANSFERRIN ENDOCYTOSIS AND RECYCLING | Genes involved in Transferrin endocytosis and recycling |
| 0.0 | 0.9 | REACTOME PRE NOTCH TRANSCRIPTION AND TRANSLATION | Genes involved in Pre-NOTCH Transcription and Translation |
| 0.0 | 0.5 | REACTOME HS GAG DEGRADATION | Genes involved in HS-GAG degradation |
| 0.0 | 0.4 | REACTOME BILE SALT AND ORGANIC ANION SLC TRANSPORTERS | Genes involved in Bile salt and organic anion SLC transporters |
| 0.0 | 0.7 | REACTOME REGULATION OF HYPOXIA INDUCIBLE FACTOR HIF BY OXYGEN | Genes involved in Regulation of Hypoxia-inducible Factor (HIF) by Oxygen |
| 0.0 | 0.7 | REACTOME HORMONE SENSITIVE LIPASE HSL MEDIATED TRIACYLGLYCEROL HYDROLYSIS | Genes involved in Hormone-sensitive lipase (HSL)-mediated triacylglycerol hydrolysis |
| 0.0 | 0.8 | REACTOME SPHINGOLIPID DE NOVO BIOSYNTHESIS | Genes involved in Sphingolipid de novo biosynthesis |
| 0.0 | 2.2 | REACTOME CLASS B 2 SECRETIN FAMILY RECEPTORS | Genes involved in Class B/2 (Secretin family receptors) |
| 0.0 | 0.4 | REACTOME SIGNALING BY BMP | Genes involved in Signaling by BMP |
| 0.0 | 0.2 | REACTOME APOPTOSIS INDUCED DNA FRAGMENTATION | Genes involved in Apoptosis induced DNA fragmentation |
| 0.0 | 0.3 | REACTOME ACTIVATION OF CHAPERONES BY ATF6 ALPHA | Genes involved in Activation of Chaperones by ATF6-alpha |
| 0.0 | 1.0 | REACTOME STRIATED MUSCLE CONTRACTION | Genes involved in Striated Muscle Contraction |
| 0.0 | 0.6 | REACTOME TIGHT JUNCTION INTERACTIONS | Genes involved in Tight junction interactions |
| 0.0 | 0.2 | REACTOME SIGNAL TRANSDUCTION BY L1 | Genes involved in Signal transduction by L1 |
| 0.0 | 0.3 | REACTOME REGULATION OF INSULIN LIKE GROWTH FACTOR IGF ACTIVITY BY INSULIN LIKE GROWTH FACTOR BINDING PROTEINS IGFBPS | Genes involved in Regulation of Insulin-like Growth Factor (IGF) Activity by Insulin-like Growth Factor Binding Proteins (IGFBPs) |
| 0.0 | 0.2 | REACTOME REGULATION OF PYRUVATE DEHYDROGENASE PDH COMPLEX | Genes involved in Regulation of pyruvate dehydrogenase (PDH) complex |
| 0.0 | 0.7 | REACTOME GLUCOSE TRANSPORT | Genes involved in Glucose transport |
| 0.0 | 0.8 | REACTOME NETRIN1 SIGNALING | Genes involved in Netrin-1 signaling |