Project
Illumina Body Map 2 (GSE30611)
Navigation
Downloads
Results for GATA1_GATA4
Z-value: 2.30
Motif logo
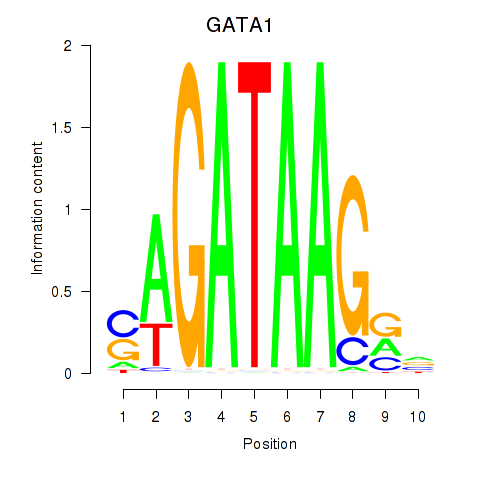
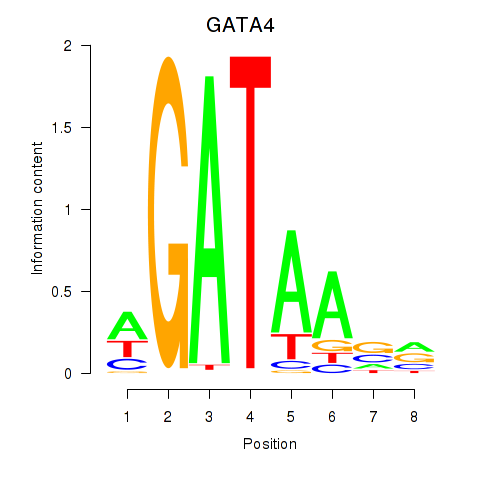
Transcription factors associated with GATA1_GATA4
| Gene Symbol | Gene ID | Gene Info |
|---|---|---|
|
GATA1
|
ENSG00000102145.15 | GATA binding protein 1 |
|
GATA4
|
ENSG00000136574.19 | GATA binding protein 4 |
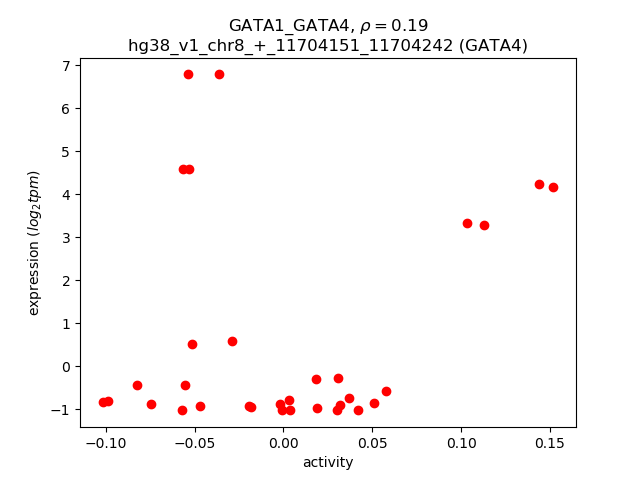
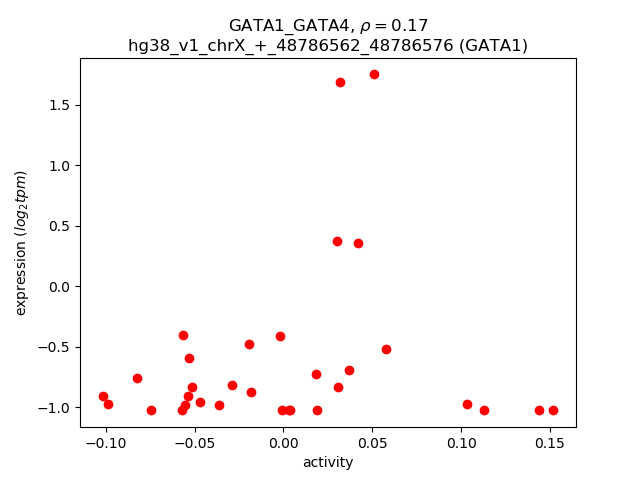
Activity-expression correlation:
| Gene | Promoter | Pearson corr. coef. | P-value | Plot |
|---|---|---|---|---|
| GATA4 | hg38_v1_chr8_+_11704151_11704242 | 0.19 | 2.9e-01 | Click! |
| GATA1 | hg38_v1_chrX_+_48786562_48786576 | 0.17 | 3.6e-01 | Click! |
Activity profile of GATA1_GATA4 motif
Sorted Z-values of GATA1_GATA4 motif
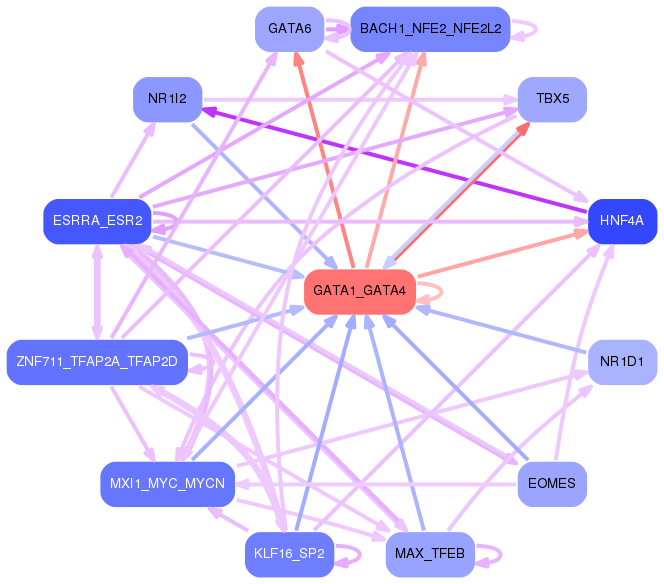
Network of associatons between targets according to the STRING database.

First level regulatory network of GATA1_GATA4
Gene Ontology Analysis
Gene overrepresentation in biological process category:
| Log-likelihood per target | Total log-likelihood | Term | Description |
|---|---|---|---|
| 3.7 | 14.6 | GO:0009822 | alkaloid catabolic process(GO:0009822) |
| 2.6 | 7.9 | GO:0003218 | cardiac left ventricle formation(GO:0003218) |
| 2.0 | 6.1 | GO:0052331 | hemolysis by symbiont of host erythrocytes(GO:0019836) hemolysis in other organism(GO:0044179) hemolysis in other organism involved in symbiotic interaction(GO:0052331) |
| 1.9 | 7.7 | GO:1904479 | negative regulation of intestinal absorption(GO:1904479) |
| 1.7 | 8.6 | GO:0010903 | negative regulation of very-low-density lipoprotein particle remodeling(GO:0010903) |
| 1.5 | 6.0 | GO:0032912 | negative regulation of transforming growth factor beta2 production(GO:0032912) |
| 1.3 | 9.2 | GO:0032971 | regulation of muscle filament sliding(GO:0032971) |
| 1.3 | 3.9 | GO:0003050 | regulation of systemic arterial blood pressure by atrial natriuretic peptide(GO:0003050) |
| 1.3 | 3.8 | GO:0038162 | erythropoietin-mediated signaling pathway(GO:0038162) |
| 1.1 | 3.4 | GO:0002432 | granuloma formation(GO:0002432) |
| 1.1 | 8.6 | GO:0072513 | positive regulation of secondary heart field cardioblast proliferation(GO:0072513) |
| 1.0 | 4.2 | GO:0002933 | lipid hydroxylation(GO:0002933) |
| 1.0 | 7.0 | GO:0044333 | Wnt signaling pathway involved in digestive tract morphogenesis(GO:0044333) |
| 0.8 | 4.8 | GO:0033489 | cholesterol biosynthetic process via desmosterol(GO:0033489) cholesterol biosynthetic process via lathosterol(GO:0033490) |
| 0.8 | 4.6 | GO:0097460 | ferrous iron import into cell(GO:0097460) ferrous iron import across plasma membrane(GO:0098707) |
| 0.8 | 15.9 | GO:0032780 | negative regulation of ATPase activity(GO:0032780) |
| 0.7 | 4.2 | GO:0036100 | leukotriene catabolic process(GO:0036100) leukotriene B4 catabolic process(GO:0036101) leukotriene B4 metabolic process(GO:0036102) icosanoid catabolic process(GO:1901523) fatty acid derivative catabolic process(GO:1901569) |
| 0.7 | 4.9 | GO:0006651 | diacylglycerol biosynthetic process(GO:0006651) |
| 0.7 | 2.0 | GO:1990451 | cellular stress response to acidic pH(GO:1990451) |
| 0.6 | 11.4 | GO:0034196 | acylglycerol transport(GO:0034196) triglyceride transport(GO:0034197) |
| 0.6 | 11.3 | GO:0001867 | complement activation, lectin pathway(GO:0001867) |
| 0.6 | 7.3 | GO:0003228 | atrial cardiac muscle tissue development(GO:0003228) atrial cardiac muscle tissue morphogenesis(GO:0055009) |
| 0.6 | 6.9 | GO:2000189 | positive regulation of cholesterol homeostasis(GO:2000189) |
| 0.6 | 2.3 | GO:0002879 | positive regulation of acute inflammatory response to non-antigenic stimulus(GO:0002879) |
| 0.5 | 1.1 | GO:0042418 | epinephrine biosynthetic process(GO:0042418) |
| 0.5 | 2.6 | GO:0002528 | regulation of vascular permeability involved in acute inflammatory response(GO:0002528) |
| 0.5 | 2.1 | GO:0090119 | vesicle-mediated cholesterol transport(GO:0090119) |
| 0.5 | 5.9 | GO:0042866 | pyruvate biosynthetic process(GO:0042866) |
| 0.5 | 1.9 | GO:1902544 | regulation of DNA N-glycosylase activity(GO:1902544) |
| 0.5 | 3.3 | GO:0019557 | histidine catabolic process to glutamate and formamide(GO:0019556) histidine catabolic process to glutamate and formate(GO:0019557) formamide metabolic process(GO:0043606) |
| 0.4 | 5.4 | GO:0052696 | flavonoid glucuronidation(GO:0052696) xenobiotic glucuronidation(GO:0052697) |
| 0.4 | 3.6 | GO:0038172 | interleukin-33-mediated signaling pathway(GO:0038172) |
| 0.4 | 1.7 | GO:0016098 | monoterpenoid metabolic process(GO:0016098) |
| 0.4 | 10.7 | GO:0042761 | very long-chain fatty acid biosynthetic process(GO:0042761) |
| 0.4 | 2.5 | GO:0015842 | aminergic neurotransmitter loading into synaptic vesicle(GO:0015842) |
| 0.4 | 4.2 | GO:0000821 | regulation of arginine metabolic process(GO:0000821) |
| 0.4 | 2.1 | GO:0061113 | pancreas morphogenesis(GO:0061113) |
| 0.4 | 5.3 | GO:0098735 | positive regulation of the force of heart contraction(GO:0098735) |
| 0.4 | 2.4 | GO:0098937 | dendritic transport(GO:0098935) anterograde dendritic transport(GO:0098937) |
| 0.4 | 0.8 | GO:1900005 | positive regulation of serine-type endopeptidase activity(GO:1900005) positive regulation of serine-type peptidase activity(GO:1902573) |
| 0.4 | 3.9 | GO:0051694 | pointed-end actin filament capping(GO:0051694) |
| 0.4 | 1.1 | GO:1990172 | CVT pathway(GO:0032258) G-protein coupled receptor catabolic process(GO:1990172) |
| 0.3 | 1.7 | GO:0002074 | extraocular skeletal muscle development(GO:0002074) |
| 0.3 | 1.0 | GO:0060913 | visceral motor neuron differentiation(GO:0021524) cardiac cell fate determination(GO:0060913) positive regulation of granulocyte colony-stimulating factor production(GO:0071657) positive regulation of macrophage colony-stimulating factor production(GO:1901258) |
| 0.3 | 1.9 | GO:0033088 | negative regulation of immature T cell proliferation in thymus(GO:0033088) |
| 0.3 | 6.7 | GO:0006558 | L-phenylalanine metabolic process(GO:0006558) L-phenylalanine catabolic process(GO:0006559) erythrose 4-phosphate/phosphoenolpyruvate family amino acid metabolic process(GO:1902221) erythrose 4-phosphate/phosphoenolpyruvate family amino acid catabolic process(GO:1902222) |
| 0.3 | 3.8 | GO:0052695 | cellular glucuronidation(GO:0052695) |
| 0.3 | 1.2 | GO:0061580 | colon epithelial cell migration(GO:0061580) |
| 0.3 | 2.1 | GO:2001295 | malonyl-CoA biosynthetic process(GO:2001295) |
| 0.3 | 0.9 | GO:0033364 | mast cell secretory granule organization(GO:0033364) |
| 0.3 | 0.9 | GO:1903718 | carbamoyl phosphate metabolic process(GO:0070408) carbamoyl phosphate biosynthetic process(GO:0070409) response to ammonia(GO:1903717) cellular response to ammonia(GO:1903718) |
| 0.3 | 0.9 | GO:0097272 | ammonia homeostasis(GO:0097272) |
| 0.3 | 0.9 | GO:0061402 | asparagine transport(GO:0006867) positive regulation of transcription from RNA polymerase II promoter in response to acidic pH(GO:0061402) regulation of glutamine transport(GO:2000485) |
| 0.3 | 1.1 | GO:0060708 | spongiotrophoblast differentiation(GO:0060708) |
| 0.3 | 6.0 | GO:0017187 | peptidyl-glutamic acid carboxylation(GO:0017187) protein carboxylation(GO:0018214) |
| 0.3 | 0.8 | GO:0001808 | negative regulation of type IV hypersensitivity(GO:0001808) |
| 0.3 | 2.2 | GO:0045918 | negative regulation of cytolysis(GO:0045918) |
| 0.3 | 1.3 | GO:0045872 | positive regulation of rhodopsin gene expression(GO:0045872) |
| 0.3 | 0.8 | GO:1902303 | regulation of heart rate by hormone(GO:0003064) negative regulation of potassium ion export(GO:1902303) |
| 0.3 | 1.3 | GO:1904428 | negative regulation of tubulin deacetylation(GO:1904428) |
| 0.3 | 1.3 | GO:0090107 | regulation of high-density lipoprotein particle assembly(GO:0090107) |
| 0.3 | 14.4 | GO:0061049 | physiological muscle hypertrophy(GO:0003298) physiological cardiac muscle hypertrophy(GO:0003301) cell growth involved in cardiac muscle cell development(GO:0061049) |
| 0.2 | 2.0 | GO:0071918 | urea transmembrane transport(GO:0071918) |
| 0.2 | 3.2 | GO:1903944 | regulation of hepatocyte apoptotic process(GO:1903943) negative regulation of hepatocyte apoptotic process(GO:1903944) |
| 0.2 | 1.0 | GO:0002215 | defense response to nematode(GO:0002215) |
| 0.2 | 4.5 | GO:0044241 | lipid digestion(GO:0044241) |
| 0.2 | 0.7 | GO:1903015 | regulation of exo-alpha-sialidase activity(GO:1903015) |
| 0.2 | 1.9 | GO:0070171 | negative regulation of tooth mineralization(GO:0070171) |
| 0.2 | 0.9 | GO:0006480 | N-terminal protein amino acid methylation(GO:0006480) |
| 0.2 | 2.1 | GO:0030450 | regulation of complement activation, classical pathway(GO:0030450) negative regulation of complement activation, classical pathway(GO:0045959) |
| 0.2 | 3.7 | GO:0046951 | ketone body biosynthetic process(GO:0046951) |
| 0.2 | 2.0 | GO:0007168 | receptor guanylyl cyclase signaling pathway(GO:0007168) |
| 0.2 | 0.7 | GO:1904638 | flavone metabolic process(GO:0051552) cellular response to nitrite(GO:0071250) response to nitrite(GO:0080033) glomerular visceral epithelial cell apoptotic process(GO:1903210) regulation of glomerular visceral epithelial cell apoptotic process(GO:1904633) positive regulation of glomerular visceral epithelial cell apoptotic process(GO:1904635) response to resveratrol(GO:1904638) cellular response to resveratrol(GO:1904639) positive regulation of progesterone biosynthetic process(GO:2000184) |
| 0.2 | 0.6 | GO:0036323 | vascular endothelial growth factor receptor-1 signaling pathway(GO:0036323) |
| 0.2 | 0.6 | GO:1904887 | regulation of thioredoxin peroxidase activity(GO:1903123) negative regulation of thioredoxin peroxidase activity(GO:1903124) negative regulation of thioredoxin peroxidase activity by peptidyl-threonine phosphorylation(GO:1903125) Wnt signalosome assembly(GO:1904887) negative regulation of peroxidase activity(GO:2000469) |
| 0.2 | 3.7 | GO:0019532 | oxalate transport(GO:0019532) |
| 0.2 | 0.4 | GO:0001545 | primary ovarian follicle growth(GO:0001545) |
| 0.2 | 0.6 | GO:0072248 | metanephric glomerular epithelium development(GO:0072244) metanephric glomerular visceral epithelial cell differentiation(GO:0072248) metanephric glomerular visceral epithelial cell development(GO:0072249) metanephric glomerular epithelial cell differentiation(GO:0072312) metanephric glomerular epithelial cell development(GO:0072313) |
| 0.2 | 0.6 | GO:1903988 | spleen trabecula formation(GO:0060345) iron cation export(GO:1903414) ferrous iron export(GO:1903988) |
| 0.2 | 0.8 | GO:0007499 | ectoderm and mesoderm interaction(GO:0007499) |
| 0.2 | 0.7 | GO:0086097 | phospholipase C-activating angiotensin-activated signaling pathway(GO:0086097) |
| 0.2 | 4.9 | GO:0051531 | NFAT protein import into nucleus(GO:0051531) |
| 0.2 | 6.5 | GO:0045603 | positive regulation of endothelial cell differentiation(GO:0045603) |
| 0.2 | 0.7 | GO:0051413 | response to cortisone(GO:0051413) |
| 0.2 | 3.3 | GO:0032000 | positive regulation of fatty acid beta-oxidation(GO:0032000) |
| 0.2 | 5.7 | GO:0042359 | vitamin D metabolic process(GO:0042359) |
| 0.2 | 0.5 | GO:0030974 | thiamine pyrophosphate transport(GO:0030974) |
| 0.2 | 0.4 | GO:1902445 | regulation of mitochondrial membrane permeability involved in programmed necrotic cell death(GO:1902445) |
| 0.2 | 0.9 | GO:0044778 | meiotic DNA integrity checkpoint(GO:0044778) |
| 0.2 | 2.4 | GO:0006477 | protein sulfation(GO:0006477) |
| 0.2 | 0.8 | GO:0010159 | specification of organ position(GO:0010159) |
| 0.2 | 1.0 | GO:0071504 | cellular response to heparin(GO:0071504) |
| 0.2 | 0.5 | GO:0019364 | NADP catabolic process(GO:0006742) pyridine nucleotide catabolic process(GO:0019364) |
| 0.2 | 0.8 | GO:0045590 | negative regulation of regulatory T cell differentiation(GO:0045590) |
| 0.2 | 0.6 | GO:0002426 | immunoglobulin production in mucosal tissue(GO:0002426) |
| 0.2 | 0.8 | GO:0071393 | cellular response to progesterone stimulus(GO:0071393) |
| 0.2 | 1.2 | GO:0006701 | progesterone biosynthetic process(GO:0006701) |
| 0.2 | 0.5 | GO:0070541 | response to platinum ion(GO:0070541) |
| 0.2 | 1.5 | GO:0060235 | lens induction in camera-type eye(GO:0060235) |
| 0.2 | 0.6 | GO:0006045 | N-acetylglucosamine biosynthetic process(GO:0006045) glucosamine-containing compound biosynthetic process(GO:1901073) |
| 0.2 | 0.5 | GO:0018160 | peptidyl-pyrromethane cofactor linkage(GO:0018160) |
| 0.1 | 1.5 | GO:0010898 | positive regulation of triglyceride catabolic process(GO:0010898) |
| 0.1 | 1.3 | GO:0033132 | negative regulation of glucokinase activity(GO:0033132) negative regulation of hexokinase activity(GO:1903300) |
| 0.1 | 1.0 | GO:0018032 | protein amidation(GO:0018032) |
| 0.1 | 0.7 | GO:0072086 | specification of loop of Henle identity(GO:0072086) |
| 0.1 | 0.7 | GO:0034378 | chylomicron assembly(GO:0034378) |
| 0.1 | 1.4 | GO:0051599 | response to hydrostatic pressure(GO:0051599) |
| 0.1 | 1.5 | GO:1902897 | regulation of postsynaptic density protein 95 clustering(GO:1902897) |
| 0.1 | 1.2 | GO:0035865 | cellular response to potassium ion(GO:0035865) |
| 0.1 | 1.8 | GO:0043950 | positive regulation of cAMP-mediated signaling(GO:0043950) |
| 0.1 | 1.3 | GO:2000535 | regulation of entry of bacterium into host cell(GO:2000535) |
| 0.1 | 1.2 | GO:0036343 | negative regulation of extracellular matrix disassembly(GO:0010716) psychomotor behavior(GO:0036343) |
| 0.1 | 0.5 | GO:0036269 | swimming behavior(GO:0036269) |
| 0.1 | 2.4 | GO:1990440 | positive regulation of transcription from RNA polymerase II promoter in response to endoplasmic reticulum stress(GO:1990440) |
| 0.1 | 2.2 | GO:1990573 | potassium ion import across plasma membrane(GO:1990573) |
| 0.1 | 0.4 | GO:0017186 | peptidyl-pyroglutamic acid biosynthetic process, using glutaminyl-peptide cyclotransferase(GO:0017186) |
| 0.1 | 2.4 | GO:0010623 | programmed cell death involved in cell development(GO:0010623) |
| 0.1 | 1.1 | GO:0014807 | regulation of somitogenesis(GO:0014807) |
| 0.1 | 0.9 | GO:0036438 | maintenance of lens transparency(GO:0036438) |
| 0.1 | 3.5 | GO:0015671 | oxygen transport(GO:0015671) |
| 0.1 | 0.3 | GO:0001812 | positive regulation of type I hypersensitivity(GO:0001812) |
| 0.1 | 0.7 | GO:0015853 | adenine transport(GO:0015853) |
| 0.1 | 1.9 | GO:0060088 | auditory receptor cell stereocilium organization(GO:0060088) |
| 0.1 | 0.6 | GO:2000471 | regulation of hematopoietic stem cell migration(GO:2000471) positive regulation of hematopoietic stem cell migration(GO:2000473) |
| 0.1 | 0.3 | GO:0043490 | malate-aspartate shuttle(GO:0043490) |
| 0.1 | 0.3 | GO:0016094 | polyprenol biosynthetic process(GO:0016094) |
| 0.1 | 4.1 | GO:0016338 | calcium-independent cell-cell adhesion via plasma membrane cell-adhesion molecules(GO:0016338) |
| 0.1 | 0.8 | GO:0097428 | protein maturation by iron-sulfur cluster transfer(GO:0097428) |
| 0.1 | 0.8 | GO:0055011 | atrial cardiac muscle cell differentiation(GO:0055011) atrial cardiac muscle cell development(GO:0055014) |
| 0.1 | 1.1 | GO:0031022 | nuclear migration along microfilament(GO:0031022) |
| 0.1 | 0.6 | GO:0002729 | positive regulation of natural killer cell cytokine production(GO:0002729) |
| 0.1 | 0.6 | GO:0071955 | recycling endosome to Golgi transport(GO:0071955) |
| 0.1 | 2.9 | GO:0003334 | keratinocyte development(GO:0003334) |
| 0.1 | 0.2 | GO:0042640 | anagen(GO:0042640) |
| 0.1 | 0.4 | GO:0060741 | prostate gland stromal morphogenesis(GO:0060741) |
| 0.1 | 0.6 | GO:1904222 | regulation of CDP-diacylglycerol-serine O-phosphatidyltransferase activity(GO:1904217) positive regulation of CDP-diacylglycerol-serine O-phosphatidyltransferase activity(GO:1904219) positive regulation of serine C-palmitoyltransferase activity(GO:1904222) |
| 0.1 | 1.5 | GO:0014809 | regulation of skeletal muscle contraction by regulation of release of sequestered calcium ion(GO:0014809) |
| 0.1 | 1.2 | GO:0006189 | 'de novo' IMP biosynthetic process(GO:0006189) |
| 0.1 | 0.6 | GO:0042738 | exogenous drug catabolic process(GO:0042738) |
| 0.1 | 0.5 | GO:0071894 | histone H2B conserved C-terminal lysine ubiquitination(GO:0071894) |
| 0.1 | 0.6 | GO:0071287 | cellular response to manganese ion(GO:0071287) |
| 0.1 | 1.1 | GO:0035021 | negative regulation of Rac protein signal transduction(GO:0035021) |
| 0.1 | 0.3 | GO:0070175 | positive regulation of enamel mineralization(GO:0070175) |
| 0.1 | 0.3 | GO:0006097 | glyoxylate cycle(GO:0006097) |
| 0.1 | 0.4 | GO:0018352 | protein-pyridoxal-5-phosphate linkage(GO:0018352) |
| 0.1 | 0.2 | GO:1901301 | regulation of cargo loading into COPII-coated vesicle(GO:1901301) |
| 0.1 | 0.3 | GO:1902310 | positive regulation of peptidyl-serine dephosphorylation(GO:1902310) |
| 0.1 | 0.3 | GO:1904049 | negative regulation of spontaneous neurotransmitter secretion(GO:1904049) |
| 0.1 | 1.0 | GO:0032364 | oxygen homeostasis(GO:0032364) |
| 0.1 | 0.5 | GO:1901097 | negative regulation of autophagosome maturation(GO:1901097) |
| 0.1 | 0.5 | GO:0045875 | negative regulation of sister chromatid cohesion(GO:0045875) |
| 0.1 | 1.9 | GO:0090527 | actin filament reorganization(GO:0090527) |
| 0.1 | 0.7 | GO:1903237 | negative regulation of leukocyte tethering or rolling(GO:1903237) |
| 0.1 | 1.0 | GO:0071073 | positive regulation of phospholipid biosynthetic process(GO:0071073) |
| 0.1 | 0.5 | GO:2000983 | regulation of ATP citrate synthase activity(GO:2000983) negative regulation of ATP citrate synthase activity(GO:2000984) |
| 0.1 | 1.4 | GO:0015886 | heme transport(GO:0015886) |
| 0.1 | 0.2 | GO:0098976 | excitatory chemical synaptic transmission(GO:0098976) regulation of AMPA glutamate receptor clustering(GO:1904717) positive regulation of AMPA glutamate receptor clustering(GO:1904719) |
| 0.1 | 0.9 | GO:0060056 | mammary gland involution(GO:0060056) |
| 0.1 | 2.5 | GO:0046597 | negative regulation of viral entry into host cell(GO:0046597) |
| 0.1 | 0.5 | GO:1904274 | tricellular tight junction assembly(GO:1904274) |
| 0.1 | 0.2 | GO:0044725 | chromatin reprogramming in the zygote(GO:0044725) |
| 0.1 | 1.9 | GO:0070886 | positive regulation of calcineurin-NFAT signaling cascade(GO:0070886) |
| 0.1 | 0.3 | GO:0051344 | negative regulation of cyclic-nucleotide phosphodiesterase activity(GO:0051344) |
| 0.1 | 0.4 | GO:0034421 | post-translational protein acetylation(GO:0034421) |
| 0.1 | 0.2 | GO:0070634 | transepithelial ammonium transport(GO:0070634) |
| 0.1 | 0.3 | GO:0035377 | transepithelial water transport(GO:0035377) positive regulation of cyclic nucleotide-gated ion channel activity(GO:1902161) |
| 0.1 | 0.8 | GO:0070574 | cadmium ion transport(GO:0015691) cadmium ion transmembrane transport(GO:0070574) |
| 0.1 | 0.3 | GO:0018874 | benzoate metabolic process(GO:0018874) |
| 0.1 | 0.6 | GO:0060754 | positive regulation of mast cell chemotaxis(GO:0060754) |
| 0.1 | 0.4 | GO:2001106 | regulation of Rho guanyl-nucleotide exchange factor activity(GO:2001106) |
| 0.1 | 1.0 | GO:0098789 | pre-mRNA cleavage required for polyadenylation(GO:0098789) |
| 0.1 | 0.3 | GO:0003366 | cell-matrix adhesion involved in ameboidal cell migration(GO:0003366) |
| 0.1 | 1.2 | GO:0006122 | mitochondrial electron transport, ubiquinol to cytochrome c(GO:0006122) |
| 0.1 | 1.4 | GO:0006069 | ethanol oxidation(GO:0006069) |
| 0.1 | 1.8 | GO:0006123 | mitochondrial electron transport, cytochrome c to oxygen(GO:0006123) |
| 0.1 | 0.8 | GO:0045048 | protein insertion into ER membrane(GO:0045048) |
| 0.1 | 2.2 | GO:0090023 | positive regulation of neutrophil chemotaxis(GO:0090023) |
| 0.1 | 0.5 | GO:0030311 | poly-N-acetyllactosamine biosynthetic process(GO:0030311) |
| 0.1 | 0.8 | GO:0032782 | bile acid secretion(GO:0032782) |
| 0.1 | 0.2 | GO:0001777 | T cell homeostatic proliferation(GO:0001777) regulation of T cell homeostatic proliferation(GO:0046013) |
| 0.1 | 0.7 | GO:0071847 | TNFSF11-mediated signaling pathway(GO:0071847) |
| 0.1 | 0.3 | GO:0021849 | neuroblast division in subventricular zone(GO:0021849) |
| 0.1 | 1.9 | GO:1901687 | glutathione derivative metabolic process(GO:1901685) glutathione derivative biosynthetic process(GO:1901687) |
| 0.1 | 0.7 | GO:0086024 | adrenergic receptor signaling pathway involved in positive regulation of heart rate(GO:0086024) |
| 0.1 | 0.6 | GO:0099566 | regulation of postsynaptic cytosolic calcium ion concentration(GO:0099566) |
| 0.1 | 1.0 | GO:0042407 | cristae formation(GO:0042407) |
| 0.1 | 7.1 | GO:0098869 | cellular oxidant detoxification(GO:0098869) cellular detoxification(GO:1990748) |
| 0.1 | 0.4 | GO:0090362 | positive regulation of platelet-derived growth factor production(GO:0090362) |
| 0.1 | 0.9 | GO:0019371 | cyclooxygenase pathway(GO:0019371) |
| 0.1 | 0.3 | GO:1990523 | bone regeneration(GO:1990523) |
| 0.1 | 0.2 | GO:2000502 | negative regulation of natural killer cell chemotaxis(GO:2000502) |
| 0.1 | 0.3 | GO:1904799 | regulation of neuron remodeling(GO:1904799) negative regulation of neuron remodeling(GO:1904800) negative regulation of branching morphogenesis of a nerve(GO:2000173) |
| 0.1 | 0.4 | GO:0044878 | mitotic cytokinesis checkpoint(GO:0044878) |
| 0.1 | 0.7 | GO:0097475 | motor neuron migration(GO:0097475) |
| 0.1 | 0.4 | GO:0035696 | monocyte extravasation(GO:0035696) |
| 0.1 | 2.2 | GO:0015721 | bile acid and bile salt transport(GO:0015721) |
| 0.1 | 0.3 | GO:0060335 | positive regulation of response to interferon-gamma(GO:0060332) positive regulation of interferon-gamma-mediated signaling pathway(GO:0060335) |
| 0.1 | 0.9 | GO:0007263 | nitric oxide mediated signal transduction(GO:0007263) |
| 0.1 | 1.4 | GO:0002003 | angiotensin maturation(GO:0002003) |
| 0.0 | 1.4 | GO:0055003 | cardiac myofibril assembly(GO:0055003) |
| 0.0 | 0.4 | GO:0071895 | odontoblast differentiation(GO:0071895) |
| 0.0 | 1.3 | GO:0035855 | megakaryocyte development(GO:0035855) |
| 0.0 | 0.4 | GO:0072658 | maintenance of protein location in membrane(GO:0072658) maintenance of protein location in plasma membrane(GO:0072660) positive regulation of membrane depolarization during cardiac muscle cell action potential(GO:1900827) |
| 0.0 | 0.3 | GO:0001880 | Mullerian duct regression(GO:0001880) |
| 0.0 | 1.8 | GO:0048596 | embryonic camera-type eye morphogenesis(GO:0048596) |
| 0.0 | 1.6 | GO:0030220 | platelet formation(GO:0030220) |
| 0.0 | 1.5 | GO:0035162 | embryonic hemopoiesis(GO:0035162) |
| 0.0 | 0.7 | GO:0018206 | peptidyl-methionine modification(GO:0018206) |
| 0.0 | 2.1 | GO:0043403 | skeletal muscle tissue regeneration(GO:0043403) |
| 0.0 | 0.5 | GO:0060372 | regulation of atrial cardiac muscle cell membrane repolarization(GO:0060372) |
| 0.0 | 2.0 | GO:0001556 | oocyte maturation(GO:0001556) |
| 0.0 | 0.8 | GO:0006924 | activation-induced cell death of T cells(GO:0006924) |
| 0.0 | 0.1 | GO:0048058 | compound eye corneal lens development(GO:0048058) |
| 0.0 | 0.1 | GO:0036451 | cap mRNA methylation(GO:0036451) |
| 0.0 | 1.9 | GO:0006882 | cellular zinc ion homeostasis(GO:0006882) |
| 0.0 | 1.4 | GO:0030011 | maintenance of cell polarity(GO:0030011) |
| 0.0 | 1.1 | GO:0035589 | G-protein coupled purinergic nucleotide receptor signaling pathway(GO:0035589) |
| 0.0 | 0.2 | GO:0051673 | membrane disruption in other organism(GO:0051673) |
| 0.0 | 2.2 | GO:0032728 | positive regulation of interferon-beta production(GO:0032728) |
| 0.0 | 0.6 | GO:2000543 | positive regulation of gastrulation(GO:2000543) |
| 0.0 | 4.5 | GO:0031100 | organ regeneration(GO:0031100) |
| 0.0 | 0.8 | GO:0006525 | arginine metabolic process(GO:0006525) |
| 0.0 | 0.2 | GO:0030579 | ubiquitin-dependent SMAD protein catabolic process(GO:0030579) |
| 0.0 | 0.4 | GO:0086043 | bundle of His cell to Purkinje myocyte signaling(GO:0086028) bundle of His cell action potential(GO:0086043) |
| 0.0 | 0.3 | GO:0070836 | caveola assembly(GO:0070836) |
| 0.0 | 0.2 | GO:2001013 | epithelial cell proliferation involved in renal tubule morphogenesis(GO:2001013) |
| 0.0 | 0.1 | GO:1990654 | sebum secreting cell proliferation(GO:1990654) |
| 0.0 | 0.2 | GO:0002322 | B cell proliferation involved in immune response(GO:0002322) |
| 0.0 | 0.1 | GO:0044339 | canonical Wnt signaling pathway involved in osteoblast differentiation(GO:0044339) |
| 0.0 | 0.7 | GO:0071888 | macrophage apoptotic process(GO:0071888) |
| 0.0 | 4.2 | GO:0046849 | bone remodeling(GO:0046849) |
| 0.0 | 5.0 | GO:0030521 | androgen receptor signaling pathway(GO:0030521) |
| 0.0 | 0.2 | GO:0090188 | negative regulation of pancreatic juice secretion(GO:0090188) |
| 0.0 | 0.4 | GO:0036444 | calcium ion transmembrane import into mitochondrion(GO:0036444) |
| 0.0 | 0.2 | GO:0061107 | seminal vesicle development(GO:0061107) |
| 0.0 | 0.2 | GO:0015677 | copper ion import(GO:0015677) ferric iron import(GO:0033216) ferric iron import into cell(GO:0097461) ferric iron import across plasma membrane(GO:0098706) |
| 0.0 | 1.1 | GO:0050860 | negative regulation of T cell receptor signaling pathway(GO:0050860) |
| 0.0 | 4.1 | GO:0002027 | regulation of heart rate(GO:0002027) |
| 0.0 | 0.3 | GO:0018401 | peptidyl-proline hydroxylation to 4-hydroxy-L-proline(GO:0018401) |
| 0.0 | 0.7 | GO:2000480 | negative regulation of cAMP-dependent protein kinase activity(GO:2000480) |
| 0.0 | 0.2 | GO:0060315 | negative regulation of ryanodine-sensitive calcium-release channel activity(GO:0060315) |
| 0.0 | 0.6 | GO:0016540 | protein autoprocessing(GO:0016540) |
| 0.0 | 1.6 | GO:0006730 | one-carbon metabolic process(GO:0006730) |
| 0.0 | 0.8 | GO:0046716 | muscle cell cellular homeostasis(GO:0046716) |
| 0.0 | 0.3 | GO:0006983 | ER overload response(GO:0006983) |
| 0.0 | 0.5 | GO:0006957 | complement activation, alternative pathway(GO:0006957) |
| 0.0 | 0.2 | GO:0090022 | regulation of neutrophil chemotaxis(GO:0090022) |
| 0.0 | 1.1 | GO:0055008 | cardiac muscle tissue morphogenesis(GO:0055008) |
| 0.0 | 0.1 | GO:0042986 | positive regulation of amyloid precursor protein biosynthetic process(GO:0042986) |
| 0.0 | 0.8 | GO:0045109 | intermediate filament organization(GO:0045109) |
| 0.0 | 2.1 | GO:0050829 | defense response to Gram-negative bacterium(GO:0050829) |
| 0.0 | 0.4 | GO:0045725 | positive regulation of glycogen biosynthetic process(GO:0045725) |
| 0.0 | 0.3 | GO:0045218 | zonula adherens maintenance(GO:0045218) |
| 0.0 | 0.4 | GO:0036342 | post-anal tail morphogenesis(GO:0036342) |
| 0.0 | 0.7 | GO:0006337 | nucleosome disassembly(GO:0006337) |
| 0.0 | 0.6 | GO:0060670 | branching involved in labyrinthine layer morphogenesis(GO:0060670) |
| 0.0 | 0.2 | GO:0014053 | negative regulation of gamma-aminobutyric acid secretion(GO:0014053) aspartate secretion(GO:0061528) positive regulation of prolactin secretion(GO:1902722) regulation of aspartate secretion(GO:1904448) positive regulation of aspartate secretion(GO:1904450) |
| 0.0 | 0.6 | GO:0050850 | positive regulation of calcium-mediated signaling(GO:0050850) |
| 0.0 | 0.1 | GO:0030200 | heparan sulfate proteoglycan catabolic process(GO:0030200) |
| 0.0 | 0.3 | GO:0036155 | acylglycerol acyl-chain remodeling(GO:0036155) |
| 0.0 | 0.7 | GO:0051482 | positive regulation of cytosolic calcium ion concentration involved in phospholipase C-activating G-protein coupled signaling pathway(GO:0051482) |
| 0.0 | 0.6 | GO:0035902 | response to immobilization stress(GO:0035902) |
| 0.0 | 0.6 | GO:0008535 | respiratory chain complex IV assembly(GO:0008535) |
| 0.0 | 0.5 | GO:0007175 | negative regulation of epidermal growth factor-activated receptor activity(GO:0007175) |
| 0.0 | 7.3 | GO:0050911 | detection of chemical stimulus involved in sensory perception of smell(GO:0050911) |
| 0.0 | 0.6 | GO:0050908 | detection of light stimulus involved in visual perception(GO:0050908) detection of light stimulus involved in sensory perception(GO:0050962) |
| 0.0 | 0.1 | GO:0071461 | cellular response to redox state(GO:0071461) |
| 0.0 | 0.4 | GO:0010990 | regulation of SMAD protein complex assembly(GO:0010990) negative regulation of SMAD protein complex assembly(GO:0010991) |
| 0.0 | 2.1 | GO:0006968 | cellular defense response(GO:0006968) |
| 0.0 | 2.3 | GO:0070125 | mitochondrial translational elongation(GO:0070125) |
| 0.0 | 2.5 | GO:0060333 | interferon-gamma-mediated signaling pathway(GO:0060333) |
| 0.0 | 0.4 | GO:0019321 | pentose metabolic process(GO:0019321) |
| 0.0 | 0.9 | GO:0007339 | binding of sperm to zona pellucida(GO:0007339) |
| 0.0 | 1.1 | GO:0002687 | positive regulation of leukocyte migration(GO:0002687) |
| 0.0 | 0.5 | GO:0022400 | regulation of rhodopsin mediated signaling pathway(GO:0022400) |
| 0.0 | 2.1 | GO:0046718 | viral entry into host cell(GO:0046718) |
| 0.0 | 0.6 | GO:0030033 | microvillus assembly(GO:0030033) |
| 0.0 | 1.0 | GO:0006953 | acute-phase response(GO:0006953) |
| 0.0 | 0.1 | GO:0035022 | positive regulation of Rac protein signal transduction(GO:0035022) |
| 0.0 | 0.8 | GO:0030206 | chondroitin sulfate biosynthetic process(GO:0030206) |
| 0.0 | 0.6 | GO:0031581 | hemidesmosome assembly(GO:0031581) |
| 0.0 | 0.1 | GO:0021817 | nucleokinesis involved in cell motility in cerebral cortex radial glia guided migration(GO:0021817) nuclear migration along microtubule(GO:0030473) |
| 0.0 | 0.9 | GO:0015804 | neutral amino acid transport(GO:0015804) |
| 0.0 | 0.1 | GO:0061511 | centriole elongation(GO:0061511) |
| 0.0 | 0.7 | GO:0050732 | negative regulation of peptidyl-tyrosine phosphorylation(GO:0050732) |
| 0.0 | 0.3 | GO:0017121 | phospholipid scrambling(GO:0017121) |
| 0.0 | 0.5 | GO:0001580 | detection of chemical stimulus involved in sensory perception of bitter taste(GO:0001580) |
| 0.0 | 0.1 | GO:0051697 | protein delipidation(GO:0051697) |
| 0.0 | 0.8 | GO:0006376 | mRNA splice site selection(GO:0006376) |
| 0.0 | 0.3 | GO:0045662 | negative regulation of myoblast differentiation(GO:0045662) |
| 0.0 | 0.1 | GO:1904706 | negative regulation of vascular smooth muscle cell proliferation(GO:1904706) |
| 0.0 | 0.5 | GO:0009235 | cobalamin metabolic process(GO:0009235) |
| 0.0 | 0.8 | GO:0045599 | negative regulation of fat cell differentiation(GO:0045599) |
| 0.0 | 0.6 | GO:0050982 | detection of mechanical stimulus(GO:0050982) |
| 0.0 | 0.4 | GO:0001945 | lymph vessel development(GO:0001945) |
| 0.0 | 0.2 | GO:2001288 | positive regulation of caveolin-mediated endocytosis(GO:2001288) |
| 0.0 | 1.0 | GO:0035914 | skeletal muscle cell differentiation(GO:0035914) |
| 0.0 | 0.5 | GO:0090200 | positive regulation of release of cytochrome c from mitochondria(GO:0090200) |
| 0.0 | 0.5 | GO:0048286 | lung alveolus development(GO:0048286) |
| 0.0 | 0.4 | GO:0034142 | toll-like receptor 4 signaling pathway(GO:0034142) |
| 0.0 | 0.2 | GO:0043508 | negative regulation of JUN kinase activity(GO:0043508) |
| 0.0 | 0.4 | GO:0090383 | phagosome acidification(GO:0090383) |
| 0.0 | 0.1 | GO:0006707 | cholesterol catabolic process(GO:0006707) sterol catabolic process(GO:0016127) |
Gene overrepresentation in cellular component category:
| Log-likelihood per target | Total log-likelihood | Term | Description |
|---|---|---|---|
| 2.4 | 9.6 | GO:0005863 | striated muscle myosin thick filament(GO:0005863) |
| 2.3 | 13.9 | GO:1990584 | cardiac Troponin complex(GO:1990584) |
| 2.2 | 8.6 | GO:0034365 | discoidal high-density lipoprotein particle(GO:0034365) |
| 0.5 | 4.9 | GO:1990578 | perinuclear endoplasmic reticulum membrane(GO:1990578) |
| 0.5 | 6.4 | GO:0043190 | ATP-binding cassette (ABC) transporter complex(GO:0043190) |
| 0.4 | 8.1 | GO:0031089 | platelet dense granule lumen(GO:0031089) |
| 0.3 | 5.3 | GO:0005833 | hemoglobin complex(GO:0005833) |
| 0.3 | 4.6 | GO:1990712 | HFE-transferrin receptor complex(GO:1990712) |
| 0.3 | 1.1 | GO:0034272 | phosphatidylinositol 3-kinase complex, class III, type I(GO:0034271) phosphatidylinositol 3-kinase complex, class III, type II(GO:0034272) |
| 0.2 | 1.8 | GO:0005947 | mitochondrial alpha-ketoglutarate dehydrogenase complex(GO:0005947) |
| 0.2 | 0.7 | GO:1990843 | subsarcolemmal mitochondrion(GO:1990843) interfibrillar mitochondrion(GO:1990844) |
| 0.2 | 2.6 | GO:0000015 | phosphopyruvate hydratase complex(GO:0000015) |
| 0.2 | 0.6 | GO:0032473 | cytoplasmic side of mitochondrial outer membrane(GO:0032473) caveola neck(GO:0099400) |
| 0.2 | 10.3 | GO:0031092 | platelet alpha granule membrane(GO:0031092) |
| 0.2 | 2.2 | GO:0008282 | ATP-sensitive potassium channel complex(GO:0008282) |
| 0.2 | 1.7 | GO:0016012 | sarcoglycan complex(GO:0016012) |
| 0.2 | 0.6 | GO:0097679 | symbiont-containing vacuole membrane(GO:0020005) other organism cytoplasm(GO:0097679) |
| 0.2 | 3.3 | GO:0045179 | apical cortex(GO:0045179) |
| 0.2 | 3.2 | GO:0071438 | invadopodium membrane(GO:0071438) |
| 0.2 | 0.6 | GO:0038038 | G-protein coupled receptor homodimeric complex(GO:0038038) |
| 0.2 | 0.8 | GO:1902937 | inward rectifier potassium channel complex(GO:1902937) |
| 0.1 | 7.2 | GO:0080008 | Cul4-RING E3 ubiquitin ligase complex(GO:0080008) |
| 0.1 | 2.5 | GO:0032982 | myosin filament(GO:0032982) |
| 0.1 | 0.9 | GO:0061617 | MICOS complex(GO:0061617) |
| 0.1 | 3.2 | GO:0031265 | CD95 death-inducing signaling complex(GO:0031265) |
| 0.1 | 1.4 | GO:0033018 | sarcoplasmic reticulum lumen(GO:0033018) |
| 0.1 | 13.1 | GO:0031672 | A band(GO:0031672) |
| 0.1 | 31.8 | GO:0030018 | Z disc(GO:0030018) |
| 0.1 | 12.8 | GO:0031093 | platelet alpha granule lumen(GO:0031093) |
| 0.1 | 0.2 | GO:1990617 | CHOP-ATF4 complex(GO:1990617) |
| 0.1 | 0.9 | GO:0031466 | Cul5-RING ubiquitin ligase complex(GO:0031466) |
| 0.1 | 0.9 | GO:0030896 | checkpoint clamp complex(GO:0030896) |
| 0.1 | 1.2 | GO:0045275 | mitochondrial respiratory chain complex III(GO:0005750) respiratory chain complex III(GO:0045275) |
| 0.1 | 0.3 | GO:0036457 | keratohyalin granule(GO:0036457) |
| 0.1 | 0.7 | GO:0036021 | endolysosome lumen(GO:0036021) |
| 0.1 | 0.3 | GO:0016222 | procollagen-proline 4-dioxygenase complex(GO:0016222) |
| 0.1 | 0.4 | GO:0005899 | insulin receptor complex(GO:0005899) |
| 0.1 | 0.3 | GO:0001674 | female germ cell nucleus(GO:0001674) |
| 0.1 | 1.1 | GO:0005916 | fascia adherens(GO:0005916) |
| 0.1 | 1.1 | GO:0070081 | clathrin-sculpted monoamine transport vesicle(GO:0070081) clathrin-sculpted monoamine transport vesicle membrane(GO:0070083) |
| 0.1 | 20.5 | GO:0032993 | protein-DNA complex(GO:0032993) |
| 0.1 | 1.8 | GO:0045277 | respiratory chain complex IV(GO:0045277) |
| 0.1 | 0.3 | GO:0034669 | integrin alpha4-beta7 complex(GO:0034669) |
| 0.1 | 0.6 | GO:0036056 | filtration diaphragm(GO:0036056) slit diaphragm(GO:0036057) |
| 0.1 | 0.8 | GO:0046581 | intercellular canaliculus(GO:0046581) |
| 0.1 | 1.2 | GO:0042589 | zymogen granule membrane(GO:0042589) |
| 0.1 | 1.1 | GO:0043020 | NADPH oxidase complex(GO:0043020) |
| 0.1 | 0.2 | GO:0036025 | protein C inhibitor-TMPRSS7 complex(GO:0036024) protein C inhibitor-TMPRSS11E complex(GO:0036025) protein C inhibitor-PLAT complex(GO:0036026) protein C inhibitor-PLAU complex(GO:0036027) protein C inhibitor-thrombin complex(GO:0036028) protein C inhibitor-KLK3 complex(GO:0036029) protein C inhibitor-plasma kallikrein complex(GO:0036030) serine protease inhibitor complex(GO:0097180) protein C inhibitor-coagulation factor V complex(GO:0097181) protein C inhibitor-coagulation factor Xa complex(GO:0097182) protein C inhibitor-coagulation factor XI complex(GO:0097183) |
| 0.1 | 0.6 | GO:0005610 | laminin-5 complex(GO:0005610) |
| 0.1 | 0.4 | GO:1990246 | uniplex complex(GO:1990246) |
| 0.1 | 0.3 | GO:0044326 | dendritic spine neck(GO:0044326) |
| 0.1 | 0.6 | GO:0031595 | nuclear proteasome complex(GO:0031595) |
| 0.0 | 1.0 | GO:0005847 | mRNA cleavage and polyadenylation specificity factor complex(GO:0005847) |
| 0.0 | 0.3 | GO:0031205 | endoplasmic reticulum Sec complex(GO:0031205) |
| 0.0 | 1.2 | GO:0031254 | uropod(GO:0001931) cell trailing edge(GO:0031254) |
| 0.0 | 8.1 | GO:0016605 | PML body(GO:0016605) |
| 0.0 | 0.6 | GO:0033588 | Elongator holoenzyme complex(GO:0033588) |
| 0.0 | 0.5 | GO:0061689 | tricellular tight junction(GO:0061689) |
| 0.0 | 0.1 | GO:0014802 | terminal cisterna(GO:0014802) |
| 0.0 | 6.5 | GO:0043202 | lysosomal lumen(GO:0043202) |
| 0.0 | 1.3 | GO:0034364 | high-density lipoprotein particle(GO:0034364) |
| 0.0 | 0.8 | GO:0043220 | Schmidt-Lanterman incisure(GO:0043220) |
| 0.0 | 0.2 | GO:0032437 | cuticular plate(GO:0032437) |
| 0.0 | 1.9 | GO:0033017 | sarcoplasmic reticulum membrane(GO:0033017) |
| 0.0 | 0.6 | GO:0042613 | MHC class II protein complex(GO:0042613) |
| 0.0 | 2.3 | GO:0045095 | keratin filament(GO:0045095) |
| 0.0 | 0.2 | GO:0001939 | female pronucleus(GO:0001939) |
| 0.0 | 0.6 | GO:0097225 | sperm midpiece(GO:0097225) |
| 0.0 | 0.4 | GO:0031618 | nuclear pericentric heterochromatin(GO:0031618) |
| 0.0 | 3.2 | GO:0035578 | azurophil granule lumen(GO:0035578) |
| 0.0 | 0.5 | GO:0030137 | COPI-coated vesicle(GO:0030137) |
| 0.0 | 4.1 | GO:0070821 | tertiary granule membrane(GO:0070821) |
| 0.0 | 0.4 | GO:0000940 | condensed chromosome outer kinetochore(GO:0000940) |
| 0.0 | 0.3 | GO:0097486 | multivesicular body lumen(GO:0097486) |
| 0.0 | 6.1 | GO:0070160 | occluding junction(GO:0070160) |
| 0.0 | 2.5 | GO:0010494 | cytoplasmic stress granule(GO:0010494) |
| 0.0 | 0.2 | GO:0032144 | 4-aminobutyrate transaminase complex(GO:0032144) |
| 0.0 | 1.8 | GO:0031228 | intrinsic component of Golgi membrane(GO:0031228) |
| 0.0 | 0.8 | GO:0005839 | proteasome core complex(GO:0005839) |
| 0.0 | 0.4 | GO:0071439 | clathrin complex(GO:0071439) |
| 0.0 | 0.6 | GO:0005922 | connexon complex(GO:0005922) |
| 0.0 | 3.1 | GO:0005604 | basement membrane(GO:0005604) |
| 0.0 | 30.4 | GO:0005789 | endoplasmic reticulum membrane(GO:0005789) |
| 0.0 | 1.6 | GO:0031594 | neuromuscular junction(GO:0031594) |
| 0.0 | 9.5 | GO:0005667 | transcription factor complex(GO:0005667) |
| 0.0 | 0.1 | GO:0005683 | U7 snRNP(GO:0005683) |
| 0.0 | 0.1 | GO:0005945 | 6-phosphofructokinase complex(GO:0005945) |
| 0.0 | 0.4 | GO:0016471 | vacuolar proton-transporting V-type ATPase complex(GO:0016471) |
| 0.0 | 1.0 | GO:0031941 | filamentous actin(GO:0031941) |
| 0.0 | 0.3 | GO:0005915 | zonula adherens(GO:0005915) |
| 0.0 | 0.3 | GO:0042622 | photoreceptor outer segment membrane(GO:0042622) |
| 0.0 | 0.9 | GO:0009295 | nucleoid(GO:0009295) mitochondrial nucleoid(GO:0042645) |
| 0.0 | 0.2 | GO:0031080 | nuclear pore outer ring(GO:0031080) |
| 0.0 | 0.2 | GO:0072357 | PTW/PP1 phosphatase complex(GO:0072357) |
| 0.0 | 0.9 | GO:0031526 | brush border membrane(GO:0031526) |
| 0.0 | 0.2 | GO:0014731 | spectrin-associated cytoskeleton(GO:0014731) |
| 0.0 | 0.8 | GO:0031907 | peroxisomal matrix(GO:0005782) microbody lumen(GO:0031907) |
| 0.0 | 0.1 | GO:0097413 | Lewy body(GO:0097413) |
Gene overrepresentation in molecular function category:
| Log-likelihood per target | Total log-likelihood | Term | Description |
|---|---|---|---|
| 2.3 | 9.2 | GO:0070643 | vitamin D3 25-hydroxylase activity(GO:0030343) vitamin D 25-hydroxylase activity(GO:0070643) |
| 2.1 | 12.7 | GO:0030172 | troponin C binding(GO:0030172) |
| 1.7 | 8.6 | GO:0070653 | high-density lipoprotein particle receptor binding(GO:0070653) |
| 1.6 | 4.8 | GO:0000247 | C-8 sterol isomerase activity(GO:0000247) cholestenol delta-isomerase activity(GO:0047750) |
| 1.5 | 4.6 | GO:0004998 | transferrin receptor activity(GO:0004998) |
| 1.4 | 5.7 | GO:1902271 | D3 vitamins binding(GO:1902271) |
| 1.4 | 4.2 | GO:0052871 | tocopherol omega-hydroxylase activity(GO:0052870) alpha-tocopherol omega-hydroxylase activity(GO:0052871) 20-hydroxy-leukotriene B4 omega oxidase activity(GO:0097258) 20-aldehyde-leukotriene B4 20-monooxygenase activity(GO:0097259) |
| 1.2 | 3.7 | GO:0004421 | hydroxymethylglutaryl-CoA synthase activity(GO:0004421) |
| 1.2 | 3.6 | GO:0002113 | interleukin-33 binding(GO:0002113) |
| 0.8 | 2.4 | GO:0004411 | homogentisate 1,2-dioxygenase activity(GO:0004411) |
| 0.8 | 2.4 | GO:0005128 | erythropoietin receptor binding(GO:0005128) |
| 0.8 | 4.7 | GO:0004882 | androgen receptor activity(GO:0004882) |
| 0.7 | 4.3 | GO:0004505 | phenylalanine 4-monooxygenase activity(GO:0004505) |
| 0.7 | 2.6 | GO:0004341 | gluconolactonase activity(GO:0004341) |
| 0.6 | 3.9 | GO:0060230 | lipoprotein lipase activator activity(GO:0060230) |
| 0.6 | 2.5 | GO:0015222 | serotonin transmembrane transporter activity(GO:0015222) |
| 0.6 | 1.9 | GO:0043739 | G/U mismatch-specific uracil-DNA glycosylase activity(GO:0043739) |
| 0.6 | 7.5 | GO:0070892 | lipoteichoic acid receptor activity(GO:0070892) |
| 0.6 | 3.0 | GO:0001069 | regulatory region RNA binding(GO:0001069) |
| 0.6 | 5.3 | GO:0099580 | ion antiporter activity involved in regulation of postsynaptic membrane potential(GO:0099580) |
| 0.6 | 1.7 | GO:0033695 | oxidoreductase activity, acting on CH or CH2 groups, quinone or similar compound as acceptor(GO:0033695) caffeine oxidase activity(GO:0034875) |
| 0.6 | 4.0 | GO:0004743 | pyruvate kinase activity(GO:0004743) |
| 0.6 | 4.0 | GO:0016936 | galactoside binding(GO:0016936) |
| 0.5 | 4.9 | GO:0003846 | 2-acylglycerol O-acyltransferase activity(GO:0003846) |
| 0.5 | 3.3 | GO:0005324 | long-chain fatty acid transporter activity(GO:0005324) |
| 0.5 | 3.3 | GO:0016841 | ammonia-lyase activity(GO:0016841) |
| 0.4 | 2.1 | GO:0047374 | methylumbelliferyl-acetate deacetylase activity(GO:0047374) |
| 0.4 | 1.2 | GO:0004507 | steroid 11-beta-monooxygenase activity(GO:0004507) corticosterone 18-monooxygenase activity(GO:0047783) |
| 0.4 | 18.0 | GO:0008093 | cytoskeletal adaptor activity(GO:0008093) |
| 0.4 | 2.2 | GO:0017098 | sulfonylurea receptor binding(GO:0017098) |
| 0.4 | 1.8 | GO:0042015 | interleukin-20 binding(GO:0042015) |
| 0.3 | 6.2 | GO:0031433 | telethonin binding(GO:0031433) |
| 0.3 | 8.4 | GO:0070330 | aromatase activity(GO:0070330) |
| 0.3 | 1.3 | GO:0070095 | fructose-6-phosphate binding(GO:0070095) |
| 0.3 | 8.0 | GO:0032036 | myosin heavy chain binding(GO:0032036) |
| 0.3 | 0.3 | GO:0004144 | diacylglycerol O-acyltransferase activity(GO:0004144) |
| 0.3 | 4.9 | GO:0046935 | 1-phosphatidylinositol-3-kinase regulator activity(GO:0046935) |
| 0.3 | 2.2 | GO:0015254 | glycerol channel activity(GO:0015254) |
| 0.3 | 5.0 | GO:0045236 | CXCR chemokine receptor binding(GO:0045236) |
| 0.3 | 2.5 | GO:0017018 | myosin phosphatase activity(GO:0017018) |
| 0.3 | 0.9 | GO:0036134 | thromboxane-A synthase activity(GO:0004796) 12-hydroxyheptadecatrienoic acid synthase activity(GO:0036134) |
| 0.3 | 1.2 | GO:0004637 | phosphoribosylamine-glycine ligase activity(GO:0004637) phosphoribosylformylglycinamidine cyclo-ligase activity(GO:0004641) phosphoribosylglycinamide formyltransferase activity(GO:0004644) |
| 0.3 | 2.1 | GO:0003989 | acetyl-CoA carboxylase activity(GO:0003989) |
| 0.3 | 1.8 | GO:0008453 | alanine-glyoxylate transaminase activity(GO:0008453) |
| 0.3 | 5.8 | GO:0042975 | peroxisome proliferator activated receptor binding(GO:0042975) |
| 0.3 | 0.9 | GO:0015182 | L-histidine transmembrane transporter activity(GO:0005290) L-asparagine transmembrane transporter activity(GO:0015182) |
| 0.3 | 2.0 | GO:0030171 | voltage-gated proton channel activity(GO:0030171) |
| 0.3 | 6.1 | GO:0015643 | toxic substance binding(GO:0015643) |
| 0.3 | 7.0 | GO:0042813 | Wnt-activated receptor activity(GO:0042813) |
| 0.3 | 2.6 | GO:0004687 | myosin light chain kinase activity(GO:0004687) |
| 0.2 | 0.7 | GO:0001596 | angiotensin type I receptor activity(GO:0001596) |
| 0.2 | 1.2 | GO:0003943 | N-acetylgalactosamine-4-sulfatase activity(GO:0003943) |
| 0.2 | 0.9 | GO:0071885 | N-terminal protein N-methyltransferase activity(GO:0071885) |
| 0.2 | 6.3 | GO:0005523 | tropomyosin binding(GO:0005523) |
| 0.2 | 2.1 | GO:0001517 | N-acetylglucosamine 6-O-sulfotransferase activity(GO:0001517) |
| 0.2 | 1.1 | GO:0070051 | fibrinogen binding(GO:0070051) |
| 0.2 | 1.4 | GO:0042030 | ATPase inhibitor activity(GO:0042030) |
| 0.2 | 0.9 | GO:0004087 | carbamoyl-phosphate synthase (ammonia) activity(GO:0004087) carbamoyl-phosphate synthase (glutamine-hydrolyzing) activity(GO:0004088) |
| 0.2 | 0.7 | GO:0003845 | 11-beta-hydroxysteroid dehydrogenase [NAD(P)] activity(GO:0003845) |
| 0.2 | 2.6 | GO:0004634 | phosphopyruvate hydratase activity(GO:0004634) |
| 0.2 | 0.6 | GO:0036327 | VEGF-A-activated receptor activity(GO:0036326) VEGF-B-activated receptor activity(GO:0036327) placental growth factor-activated receptor activity(GO:0036332) |
| 0.2 | 0.6 | GO:0034211 | GTP-dependent protein kinase activity(GO:0034211) peroxidase inhibitor activity(GO:0036479) |
| 0.2 | 3.7 | GO:0019531 | oxalate transmembrane transporter activity(GO:0019531) |
| 0.2 | 1.3 | GO:0030197 | extracellular matrix constituent, lubricant activity(GO:0030197) |
| 0.2 | 1.3 | GO:0034186 | apolipoprotein A-I binding(GO:0034186) |
| 0.2 | 0.6 | GO:0047225 | acetylgalactosaminyl-O-glycosyl-glycoprotein beta-1,6-N-acetylglucosaminyltransferase activity(GO:0047225) |
| 0.2 | 1.2 | GO:0031014 | troponin T binding(GO:0031014) |
| 0.2 | 0.6 | GO:0008761 | UDP-N-acetylglucosamine 2-epimerase activity(GO:0008761) N-acylmannosamine kinase activity(GO:0009384) |
| 0.2 | 7.5 | GO:0004602 | glutathione peroxidase activity(GO:0004602) |
| 0.2 | 1.0 | GO:0003870 | 5-aminolevulinate synthase activity(GO:0003870) N-succinyltransferase activity(GO:0016749) |
| 0.2 | 1.0 | GO:0016262 | protein N-acetylglucosaminyltransferase activity(GO:0016262) |
| 0.2 | 0.6 | GO:0097689 | iron channel activity(GO:0097689) |
| 0.2 | 1.7 | GO:0004024 | alcohol dehydrogenase activity, zinc-dependent(GO:0004024) |
| 0.2 | 1.5 | GO:0045029 | UDP-activated nucleotide receptor activity(GO:0045029) |
| 0.2 | 0.5 | GO:0090422 | thiamine pyrophosphate transporter activity(GO:0090422) |
| 0.2 | 0.7 | GO:0030492 | hemoglobin binding(GO:0030492) |
| 0.2 | 0.7 | GO:0015207 | ATP:ADP antiporter activity(GO:0005471) adenine transmembrane transporter activity(GO:0015207) |
| 0.2 | 8.7 | GO:0015020 | glucuronosyltransferase activity(GO:0015020) |
| 0.2 | 1.0 | GO:0008109 | N-acetyllactosaminide beta-1,6-N-acetylglucosaminyltransferase activity(GO:0008109) |
| 0.2 | 3.4 | GO:0015174 | basic amino acid transmembrane transporter activity(GO:0015174) |
| 0.2 | 0.5 | GO:1904854 | proteasome core complex binding(GO:1904854) |
| 0.2 | 3.8 | GO:0017127 | cholesterol transporter activity(GO:0017127) |
| 0.2 | 0.5 | GO:0004418 | hydroxymethylbilane synthase activity(GO:0004418) |
| 0.2 | 3.5 | GO:0005344 | oxygen transporter activity(GO:0005344) |
| 0.1 | 1.0 | GO:0004598 | peptidylglycine monooxygenase activity(GO:0004504) peptidylamidoglycolate lyase activity(GO:0004598) |
| 0.1 | 0.7 | GO:0004348 | glucosylceramidase activity(GO:0004348) |
| 0.1 | 1.2 | GO:0034481 | chondroitin sulfotransferase activity(GO:0034481) chondroitin 4-sulfotransferase activity(GO:0047756) |
| 0.1 | 0.7 | GO:0031735 | CCR10 chemokine receptor binding(GO:0031735) |
| 0.1 | 1.2 | GO:0016681 | ubiquinol-cytochrome-c reductase activity(GO:0008121) oxidoreductase activity, acting on diphenols and related substances as donors(GO:0016679) oxidoreductase activity, acting on diphenols and related substances as donors, cytochrome as acceptor(GO:0016681) |
| 0.1 | 0.9 | GO:0000293 | ferric-chelate reductase activity(GO:0000293) |
| 0.1 | 11.2 | GO:0016627 | oxidoreductase activity, acting on the CH-CH group of donors(GO:0016627) |
| 0.1 | 0.5 | GO:0052810 | 1-phosphatidylinositol-5-kinase activity(GO:0052810) |
| 0.1 | 0.4 | GO:0016603 | glutaminyl-peptide cyclotransferase activity(GO:0016603) |
| 0.1 | 1.3 | GO:1902282 | voltage-gated potassium channel activity involved in ventricular cardiac muscle cell action potential repolarization(GO:1902282) |
| 0.1 | 4.3 | GO:0004806 | triglyceride lipase activity(GO:0004806) |
| 0.1 | 1.4 | GO:0015232 | heme transporter activity(GO:0015232) |
| 0.1 | 0.8 | GO:0008508 | bile acid:sodium symporter activity(GO:0008508) |
| 0.1 | 1.1 | GO:0001042 | RNA polymerase I core binding(GO:0001042) |
| 0.1 | 1.1 | GO:0004064 | arylesterase activity(GO:0004064) |
| 0.1 | 0.4 | GO:0004963 | follicle-stimulating hormone receptor activity(GO:0004963) |
| 0.1 | 1.9 | GO:0016500 | protein-hormone receptor activity(GO:0016500) |
| 0.1 | 0.3 | GO:0008511 | sodium:potassium:chloride symporter activity(GO:0008511) |
| 0.1 | 6.5 | GO:0005504 | fatty acid binding(GO:0005504) |
| 0.1 | 0.8 | GO:0004514 | nicotinate-nucleotide diphosphorylase (carboxylating) activity(GO:0004514) |
| 0.1 | 0.3 | GO:0000035 | acyl binding(GO:0000035) |
| 0.1 | 2.0 | GO:0016175 | superoxide-generating NADPH oxidase activity(GO:0016175) |
| 0.1 | 0.8 | GO:0043120 | interleukin-8 binding(GO:0019959) tumor necrosis factor binding(GO:0043120) |
| 0.1 | 0.3 | GO:0008502 | melatonin receptor activity(GO:0008502) |
| 0.1 | 0.8 | GO:0003956 | NAD(P)+-protein-arginine ADP-ribosyltransferase activity(GO:0003956) |
| 0.1 | 0.3 | GO:0051990 | isocitrate dehydrogenase (NADP+) activity(GO:0004450) (R)-2-hydroxyglutarate dehydrogenase activity(GO:0051990) |
| 0.1 | 3.2 | GO:0097200 | cysteine-type endopeptidase activity involved in execution phase of apoptosis(GO:0097200) |
| 0.1 | 6.0 | GO:0001103 | RNA polymerase II repressing transcription factor binding(GO:0001103) |
| 0.1 | 1.1 | GO:0038132 | neuregulin binding(GO:0038132) |
| 0.1 | 1.2 | GO:0032393 | MHC class I receptor activity(GO:0032393) |
| 0.1 | 1.6 | GO:0043522 | leucine zipper domain binding(GO:0043522) |
| 0.1 | 2.8 | GO:0004364 | glutathione transferase activity(GO:0004364) |
| 0.1 | 1.1 | GO:0008526 | phosphatidylinositol transporter activity(GO:0008526) |
| 0.1 | 0.9 | GO:0032052 | bile acid binding(GO:0032052) |
| 0.1 | 2.4 | GO:0050811 | GABA receptor binding(GO:0050811) |
| 0.1 | 0.3 | GO:0005260 | channel-conductance-controlling ATPase activity(GO:0005260) |
| 0.1 | 0.3 | GO:0015183 | L-aspartate transmembrane transporter activity(GO:0015183) |
| 0.1 | 2.0 | GO:0051371 | muscle alpha-actinin binding(GO:0051371) |
| 0.1 | 0.4 | GO:0003680 | AT DNA binding(GO:0003680) |
| 0.1 | 0.6 | GO:0099583 | neurotransmitter receptor activity involved in regulation of postsynaptic cytosolic calcium ion concentration(GO:0099583) |
| 0.1 | 2.1 | GO:0035497 | cAMP response element binding(GO:0035497) |
| 0.1 | 0.6 | GO:0004305 | ethanolamine kinase activity(GO:0004305) |
| 0.1 | 0.3 | GO:0016524 | latrotoxin receptor activity(GO:0016524) |
| 0.1 | 1.4 | GO:0005537 | mannose binding(GO:0005537) |
| 0.1 | 0.8 | GO:0097371 | MDM2/MDM4 family protein binding(GO:0097371) |
| 0.1 | 0.3 | GO:0005497 | androgen binding(GO:0005497) |
| 0.1 | 0.3 | GO:0004647 | phosphoserine phosphatase activity(GO:0004647) |
| 0.1 | 0.5 | GO:0008048 | calcium sensitive guanylate cyclase activator activity(GO:0008048) |
| 0.1 | 2.6 | GO:0005385 | zinc ion transmembrane transporter activity(GO:0005385) |
| 0.1 | 0.5 | GO:0004704 | NF-kappaB-inducing kinase activity(GO:0004704) |
| 0.1 | 1.2 | GO:0045295 | gamma-catenin binding(GO:0045295) |
| 0.1 | 0.9 | GO:0004791 | thioredoxin-disulfide reductase activity(GO:0004791) |
| 0.1 | 1.8 | GO:0004129 | cytochrome-c oxidase activity(GO:0004129) heme-copper terminal oxidase activity(GO:0015002) oxidoreductase activity, acting on a heme group of donors, oxygen as acceptor(GO:0016676) |
| 0.1 | 5.5 | GO:0048306 | calcium-dependent protein binding(GO:0048306) |
| 0.1 | 1.5 | GO:0030247 | pattern binding(GO:0001871) polysaccharide binding(GO:0030247) |
| 0.1 | 0.7 | GO:0022850 | serotonin-gated cation channel activity(GO:0022850) |
| 0.1 | 0.3 | GO:0070180 | large ribosomal subunit rRNA binding(GO:0070180) |
| 0.0 | 0.8 | GO:0071837 | HMG box domain binding(GO:0071837) |
| 0.0 | 3.2 | GO:0050699 | WW domain binding(GO:0050699) |
| 0.0 | 1.0 | GO:0070410 | co-SMAD binding(GO:0070410) |
| 0.0 | 0.2 | GO:0004949 | cannabinoid receptor activity(GO:0004949) |
| 0.0 | 0.6 | GO:0005172 | vascular endothelial growth factor receptor binding(GO:0005172) |
| 0.0 | 0.4 | GO:0019958 | C-X-C chemokine binding(GO:0019958) |
| 0.0 | 0.6 | GO:0008607 | phosphorylase kinase regulator activity(GO:0008607) |
| 0.0 | 0.5 | GO:0008131 | primary amine oxidase activity(GO:0008131) |
| 0.0 | 0.8 | GO:0043125 | ErbB-3 class receptor binding(GO:0043125) |
| 0.0 | 0.4 | GO:0004468 | lysine N-acetyltransferase activity, acting on acetyl phosphate as donor(GO:0004468) |
| 0.0 | 1.5 | GO:0005031 | tumor necrosis factor-activated receptor activity(GO:0005031) death receptor activity(GO:0005035) |
| 0.0 | 0.1 | GO:0004483 | mRNA (nucleoside-2'-O-)-methyltransferase activity(GO:0004483) |
| 0.0 | 0.3 | GO:0019763 | immunoglobulin receptor activity(GO:0019763) |
| 0.0 | 0.3 | GO:0030618 | transforming growth factor beta receptor, pathway-specific cytoplasmic mediator activity(GO:0030618) |
| 0.0 | 1.1 | GO:0070888 | E-box binding(GO:0070888) |
| 0.0 | 1.4 | GO:0002162 | dystroglycan binding(GO:0002162) |
| 0.0 | 0.2 | GO:0008823 | cupric reductase activity(GO:0008823) ferric-chelate reductase (NADPH) activity(GO:0052851) |
| 0.0 | 0.6 | GO:0004128 | cytochrome-b5 reductase activity, acting on NAD(P)H(GO:0004128) |
| 0.0 | 1.5 | GO:0008157 | protein phosphatase 1 binding(GO:0008157) |
| 0.0 | 7.9 | GO:0004725 | protein tyrosine phosphatase activity(GO:0004725) |
| 0.0 | 1.3 | GO:0031489 | myosin V binding(GO:0031489) |
| 0.0 | 0.8 | GO:0042301 | phosphate ion binding(GO:0042301) |
| 0.0 | 0.6 | GO:0015194 | L-serine transmembrane transporter activity(GO:0015194) serine transmembrane transporter activity(GO:0022889) |
| 0.0 | 0.4 | GO:0008553 | hydrogen-exporting ATPase activity, phosphorylative mechanism(GO:0008553) |
| 0.0 | 0.3 | GO:0004656 | procollagen-proline 4-dioxygenase activity(GO:0004656) |
| 0.0 | 1.2 | GO:0005229 | intracellular calcium activated chloride channel activity(GO:0005229) |
| 0.0 | 0.4 | GO:0036312 | phosphatidylinositol 3-kinase regulatory subunit binding(GO:0036312) |
| 0.0 | 0.6 | GO:0004089 | carbonate dehydratase activity(GO:0004089) |
| 0.0 | 1.2 | GO:0043325 | phosphatidylinositol-3,4-bisphosphate binding(GO:0043325) |
| 0.0 | 0.4 | GO:0030280 | structural constituent of epidermis(GO:0030280) |
| 0.0 | 0.3 | GO:0030021 | extracellular matrix structural constituent conferring compression resistance(GO:0030021) structural constituent of tooth enamel(GO:0030345) |
| 0.0 | 1.2 | GO:0008239 | dipeptidyl-peptidase activity(GO:0008239) |
| 0.0 | 1.2 | GO:0005328 | neurotransmitter:sodium symporter activity(GO:0005328) |
| 0.0 | 0.2 | GO:0043208 | glycosphingolipid binding(GO:0043208) |
| 0.0 | 2.7 | GO:0005160 | transforming growth factor beta receptor binding(GO:0005160) |
| 0.0 | 9.5 | GO:0004866 | endopeptidase inhibitor activity(GO:0004866) |
| 0.0 | 0.9 | GO:0008242 | omega peptidase activity(GO:0008242) |
| 0.0 | 0.4 | GO:0016846 | carbon-sulfur lyase activity(GO:0016846) |
| 0.0 | 0.3 | GO:0044547 | DNA topoisomerase binding(GO:0044547) |
| 0.0 | 0.3 | GO:0001594 | trace-amine receptor activity(GO:0001594) |
| 0.0 | 0.2 | GO:0032184 | SUMO polymer binding(GO:0032184) |
| 0.0 | 0.3 | GO:0004969 | histamine receptor activity(GO:0004969) |
| 0.0 | 0.6 | GO:0005243 | gap junction channel activity(GO:0005243) |
| 0.0 | 1.0 | GO:0016922 | ligand-dependent nuclear receptor binding(GO:0016922) |
| 0.0 | 5.6 | GO:0005178 | integrin binding(GO:0005178) |
| 0.0 | 0.8 | GO:0004190 | aspartic-type endopeptidase activity(GO:0004190) |
| 0.0 | 0.1 | GO:0015562 | efflux transmembrane transporter activity(GO:0015562) |
| 0.0 | 0.1 | GO:0005148 | prolactin receptor binding(GO:0005148) |
| 0.0 | 0.7 | GO:0004862 | cAMP-dependent protein kinase inhibitor activity(GO:0004862) |
| 0.0 | 0.8 | GO:0051537 | 2 iron, 2 sulfur cluster binding(GO:0051537) |
| 0.0 | 0.7 | GO:0019871 | sodium channel inhibitor activity(GO:0019871) |
| 0.0 | 0.7 | GO:0031698 | beta-2 adrenergic receptor binding(GO:0031698) |
| 0.0 | 0.2 | GO:0032810 | sterol response element binding(GO:0032810) |
| 0.0 | 0.2 | GO:0032145 | 4-aminobutyrate transaminase activity(GO:0003867) succinate-semialdehyde dehydrogenase binding(GO:0032145) (S)-3-amino-2-methylpropionate transaminase activity(GO:0047298) |
| 0.0 | 2.4 | GO:0001618 | virus receptor activity(GO:0001618) |
| 0.0 | 0.4 | GO:0001730 | 2'-5'-oligoadenylate synthetase activity(GO:0001730) |
| 0.0 | 0.3 | GO:0017128 | phospholipid scramblase activity(GO:0017128) |
| 0.0 | 8.7 | GO:0030246 | carbohydrate binding(GO:0030246) |
| 0.0 | 0.2 | GO:0019869 | chloride channel inhibitor activity(GO:0019869) |
| 0.0 | 0.5 | GO:0019992 | diacylglycerol binding(GO:0019992) |
| 0.0 | 0.5 | GO:0033038 | bitter taste receptor activity(GO:0033038) |
| 0.0 | 7.3 | GO:0004984 | olfactory receptor activity(GO:0004984) |
| 0.0 | 1.0 | GO:0004177 | aminopeptidase activity(GO:0004177) |
| 0.0 | 0.9 | GO:0000900 | translation repressor activity, nucleic acid binding(GO:0000900) |
| 0.0 | 0.1 | GO:0034736 | sterol O-acyltransferase activity(GO:0004772) cholesterol O-acyltransferase activity(GO:0034736) |
| 0.0 | 2.1 | GO:0004197 | cysteine-type endopeptidase activity(GO:0004197) |
| 0.0 | 0.1 | GO:0001135 | transcription factor activity, RNA polymerase II transcription factor recruiting(GO:0001135) |
| 0.0 | 0.2 | GO:0019864 | IgG binding(GO:0019864) |
| 0.0 | 14.1 | GO:0001228 | transcriptional activator activity, RNA polymerase II transcription regulatory region sequence-specific binding(GO:0001228) |
| 0.0 | 1.4 | GO:0004521 | endoribonuclease activity(GO:0004521) |
| 0.0 | 0.2 | GO:0004875 | complement receptor activity(GO:0004875) |
| 0.0 | 1.5 | GO:0097110 | scaffold protein binding(GO:0097110) |
| 0.0 | 0.1 | GO:0016176 | superoxide-generating NADPH oxidase activator activity(GO:0016176) |
| 0.0 | 0.3 | GO:0045294 | alpha-catenin binding(GO:0045294) |
| 0.0 | 0.6 | GO:0042605 | peptide antigen binding(GO:0042605) |
| 0.0 | 0.8 | GO:0036002 | pre-mRNA binding(GO:0036002) |
| 0.0 | 1.3 | GO:0004520 | endodeoxyribonuclease activity(GO:0004520) |
| 0.0 | 0.1 | GO:0055131 | C3HC4-type RING finger domain binding(GO:0055131) |
| 0.0 | 0.3 | GO:0070300 | phosphatidic acid binding(GO:0070300) |
| 0.0 | 0.3 | GO:0042809 | vitamin D receptor binding(GO:0042809) |
| 0.0 | 0.5 | GO:0000993 | RNA polymerase II core binding(GO:0000993) |
| 0.0 | 0.4 | GO:0070577 | lysine-acetylated histone binding(GO:0070577) |
| 0.0 | 0.4 | GO:0016638 | oxidoreductase activity, acting on the CH-NH2 group of donors(GO:0016638) |
| 0.0 | 0.2 | GO:0046965 | retinoid X receptor binding(GO:0046965) |
| 0.0 | 0.8 | GO:0000980 | RNA polymerase II distal enhancer sequence-specific DNA binding(GO:0000980) |
| 0.0 | 0.9 | GO:0050681 | androgen receptor binding(GO:0050681) |
| 0.0 | 0.1 | GO:0005094 | Rho GDP-dissociation inhibitor activity(GO:0005094) |
| 0.0 | 0.2 | GO:0004321 | fatty-acyl-CoA synthase activity(GO:0004321) |
| 0.0 | 0.1 | GO:0015250 | water channel activity(GO:0015250) |
| 0.0 | 0.4 | GO:0005388 | calcium-transporting ATPase activity(GO:0005388) |
| 0.0 | 0.1 | GO:0036402 | proteasome-activating ATPase activity(GO:0036402) |
| 0.0 | 0.3 | GO:0070003 | threonine-type endopeptidase activity(GO:0004298) threonine-type peptidase activity(GO:0070003) |
| 0.0 | 0.8 | GO:0016831 | carboxy-lyase activity(GO:0016831) |
| 0.0 | 3.3 | GO:0004252 | serine-type endopeptidase activity(GO:0004252) |
Gene overrepresentation in curated gene sets: canonical pathways category:
| Log-likelihood per target | Total log-likelihood | Term | Description |
|---|---|---|---|
| 0.3 | 25.3 | PID HNF3B PATHWAY | FOXA2 and FOXA3 transcription factor networks |
| 0.2 | 5.1 | PID ERB GENOMIC PATHWAY | Validated nuclear estrogen receptor beta network |
| 0.1 | 8.4 | PID IL23 PATHWAY | IL23-mediated signaling events |
| 0.1 | 6.3 | PID ALK1 PATHWAY | ALK1 signaling events |
| 0.1 | 5.2 | PID EPO PATHWAY | EPO signaling pathway |
| 0.1 | 2.1 | SA PROGRAMMED CELL DEATH | Programmed cell death, or apoptosis, eliminates damaged or unneeded cells. |
| 0.1 | 3.2 | SA FAS SIGNALING | The TNF-type receptor Fas induces apoptosis on ligand binding. |
| 0.1 | 6.3 | PID HES HEY PATHWAY | Notch-mediated HES/HEY network |
| 0.1 | 6.5 | PID DELTA NP63 PATHWAY | Validated transcriptional targets of deltaNp63 isoforms |
| 0.1 | 0.7 | ST TYPE I INTERFERON PATHWAY | Type I Interferon (alpha/beta IFN) Pathway |
| 0.0 | 1.6 | PID HDAC CLASSIII PATHWAY | Signaling events mediated by HDAC Class III |
| 0.0 | 3.9 | PID REG GR PATHWAY | Glucocorticoid receptor regulatory network |
| 0.0 | 1.0 | SA MMP CYTOKINE CONNECTION | Cytokines can induce activation of matrix metalloproteinases, which degrade extracellular matrix. |
| 0.0 | 2.1 | PID ERBB2 ERBB3 PATHWAY | ErbB2/ErbB3 signaling events |
| 0.0 | 3.1 | PID PTP1B PATHWAY | Signaling events mediated by PTP1B |
| 0.0 | 0.6 | PID VEGF VEGFR PATHWAY | VEGF and VEGFR signaling network |
| 0.0 | 10.2 | NABA ECM AFFILIATED | Genes encoding proteins affiliated structurally or functionally to extracellular matrix proteins |
| 0.0 | 2.1 | NABA PROTEOGLYCANS | Genes encoding proteoglycans |
| 0.0 | 1.3 | PID IL6 7 PATHWAY | IL6-mediated signaling events |
| 0.0 | 1.3 | PID PI3KCI PATHWAY | Class I PI3K signaling events |
| 0.0 | 0.4 | SIG INSULIN RECEPTOR PATHWAY IN CARDIAC MYOCYTES | Genes related to the insulin receptor pathway |
| 0.0 | 0.6 | PID INTEGRIN4 PATHWAY | Alpha6 beta4 integrin-ligand interactions |
| 0.0 | 3.6 | PID CMYB PATHWAY | C-MYB transcription factor network |
| 0.0 | 1.0 | PID ANGIOPOIETIN RECEPTOR PATHWAY | Angiopoietin receptor Tie2-mediated signaling |
| 0.0 | 2.7 | PID MYC REPRESS PATHWAY | Validated targets of C-MYC transcriptional repression |
| 0.0 | 0.5 | PID AR NONGENOMIC PATHWAY | Nongenotropic Androgen signaling |
| 0.0 | 0.3 | SA G2 AND M PHASES | Cdc25 activates the cdc2/cyclin B complex to induce the G2/M transition. |
| 0.0 | 1.6 | PID HNF3A PATHWAY | FOXA1 transcription factor network |
| 0.0 | 0.5 | PID LPA4 PATHWAY | LPA4-mediated signaling events |
| 0.0 | 0.9 | PID RHODOPSIN PATHWAY | Visual signal transduction: Rods |
| 0.0 | 7.4 | NABA ECM REGULATORS | Genes encoding enzymes and their regulators involved in the remodeling of the extracellular matrix |
| 0.0 | 0.6 | PID CXCR3 PATHWAY | CXCR3-mediated signaling events |
| 0.0 | 0.3 | PID THROMBIN PAR4 PATHWAY | PAR4-mediated thrombin signaling events |
| 0.0 | 1.6 | PID RAC1 PATHWAY | RAC1 signaling pathway |
| 0.0 | 0.9 | PID FANCONI PATHWAY | Fanconi anemia pathway |
| 0.0 | 0.1 | ST JAK STAT PATHWAY | Jak-STAT Pathway |
| 0.0 | 1.1 | ST T CELL SIGNAL TRANSDUCTION | T Cell Signal Transduction |
| 0.0 | 0.7 | ST MYOCYTE AD PATHWAY | Myocyte Adrenergic Pathway is a specific case of the generalized Adrenergic Pathway. |
| 0.0 | 1.1 | SIG PIP3 SIGNALING IN CARDIAC MYOCTES | Genes related to PIP3 signaling in cardiac myocytes |
| 0.0 | 5.1 | NABA MATRISOME ASSOCIATED | Ensemble of genes encoding ECM-associated proteins including ECM-affilaited proteins, ECM regulators and secreted factors |
| 0.0 | 0.3 | PID PRL SIGNALING EVENTS PATHWAY | Signaling events mediated by PRL |
| 0.0 | 0.4 | PID INTEGRIN CS PATHWAY | Integrin family cell surface interactions |
| 0.0 | 0.5 | PID FCER1 PATHWAY | Fc-epsilon receptor I signaling in mast cells |
Gene overrepresentation in curated gene sets: REACTOME pathways category:
| Log-likelihood per target | Total log-likelihood | Term | Description |
|---|---|---|---|
| 1.1 | 20.6 | REACTOME XENOBIOTICS | Genes involved in Xenobiotics |
| 0.7 | 9.6 | REACTOME CREATION OF C4 AND C2 ACTIVATORS | Genes involved in Creation of C4 and C2 activators |
| 0.6 | 16.8 | REACTOME HDL MEDIATED LIPID TRANSPORT | Genes involved in HDL-mediated lipid transport |
| 0.3 | 6.6 | REACTOME COMMON PATHWAY | Genes involved in Common Pathway |
| 0.3 | 9.2 | REACTOME GLUCURONIDATION | Genes involved in Glucuronidation |
| 0.3 | 6.2 | REACTOME ABCA TRANSPORTERS IN LIPID HOMEOSTASIS | Genes involved in ABCA transporters in lipid homeostasis |
| 0.2 | 12.9 | REACTOME REGULATION OF GENE EXPRESSION IN BETA CELLS | Genes involved in Regulation of gene expression in beta cells |
| 0.2 | 3.6 | REACTOME SYNTHESIS SECRETION AND INACTIVATION OF GIP | Genes involved in Synthesis, Secretion, and Inactivation of Glucose-dependent Insulinotropic Polypeptide (GIP) |
| 0.2 | 11.5 | REACTOME STRIATED MUSCLE CONTRACTION | Genes involved in Striated Muscle Contraction |
| 0.1 | 4.9 | REACTOME IL 7 SIGNALING | Genes involved in Interleukin-7 signaling |
| 0.1 | 5.3 | REACTOME PLATELET CALCIUM HOMEOSTASIS | Genes involved in Platelet calcium homeostasis |
| 0.1 | 2.4 | REACTOME PASSIVE TRANSPORT BY AQUAPORINS | Genes involved in Passive Transport by Aquaporins |
| 0.1 | 4.0 | REACTOME METABOLISM OF STEROID HORMONES AND VITAMINS A AND D | Genes involved in Metabolism of steroid hormones and vitamins A and D |
| 0.1 | 4.4 | REACTOME CHOLESTEROL BIOSYNTHESIS | Genes involved in Cholesterol biosynthesis |
| 0.1 | 5.3 | REACTOME YAP1 AND WWTR1 TAZ STIMULATED GENE EXPRESSION | Genes involved in YAP1- and WWTR1 (TAZ)-stimulated gene expression |
| 0.1 | 3.8 | REACTOME NA CL DEPENDENT NEUROTRANSMITTER TRANSPORTERS | Genes involved in Na+/Cl- dependent neurotransmitter transporters |
| 0.1 | 16.9 | REACTOME PPARA ACTIVATES GENE EXPRESSION | Genes involved in PPARA Activates Gene Expression |
| 0.1 | 1.6 | REACTOME REVERSIBLE HYDRATION OF CARBON DIOXIDE | Genes involved in Reversible Hydration of Carbon Dioxide |
| 0.1 | 3.0 | REACTOME DOWNREGULATION OF ERBB2 ERBB3 SIGNALING | Genes involved in Downregulation of ERBB2:ERBB3 signaling |
| 0.1 | 3.2 | REACTOME EXTRINSIC PATHWAY FOR APOPTOSIS | Genes involved in Extrinsic Pathway for Apoptosis |
| 0.1 | 4.1 | REACTOME TIGHT JUNCTION INTERACTIONS | Genes involved in Tight junction interactions |
| 0.1 | 2.1 | REACTOME REGULATION OF COMPLEMENT CASCADE | Genes involved in Regulation of Complement cascade |
| 0.1 | 1.4 | REACTOME ETHANOL OXIDATION | Genes involved in Ethanol oxidation |
| 0.1 | 2.6 | REACTOME ZINC TRANSPORTERS | Genes involved in Zinc transporters |
| 0.1 | 1.6 | REACTOME P2Y RECEPTORS | Genes involved in P2Y receptors |
| 0.1 | 7.3 | REACTOME NUCLEAR RECEPTOR TRANSCRIPTION PATHWAY | Genes involved in Nuclear Receptor transcription pathway |
| 0.1 | 4.0 | REACTOME AMINO ACID TRANSPORT ACROSS THE PLASMA MEMBRANE | Genes involved in Amino acid transport across the plasma membrane |
| 0.1 | 1.2 | REACTOME PURINE RIBONUCLEOSIDE MONOPHOSPHATE BIOSYNTHESIS | Genes involved in Purine ribonucleoside monophosphate biosynthesis |
| 0.1 | 0.8 | REACTOME HORMONE LIGAND BINDING RECEPTORS | Genes involved in Hormone ligand-binding receptors |
| 0.1 | 0.9 | REACTOME INCRETIN SYNTHESIS SECRETION AND INACTIVATION | Genes involved in Incretin Synthesis, Secretion, and Inactivation |
| 0.1 | 2.9 | REACTOME CYTOCHROME P450 ARRANGED BY SUBSTRATE TYPE | Genes involved in Cytochrome P450 - arranged by substrate type |
| 0.1 | 4.3 | REACTOME CHEMOKINE RECEPTORS BIND CHEMOKINES | Genes involved in Chemokine receptors bind chemokines |
| 0.1 | 2.2 | REACTOME GLUTATHIONE CONJUGATION | Genes involved in Glutathione conjugation |
| 0.1 | 2.4 | REACTOME REGULATION OF HYPOXIA INDUCIBLE FACTOR HIF BY OXYGEN | Genes involved in Regulation of Hypoxia-inducible Factor (HIF) by Oxygen |
| 0.1 | 0.8 | REACTOME RECYCLING OF BILE ACIDS AND SALTS | Genes involved in Recycling of bile acids and salts |
| 0.1 | 0.7 | REACTOME INTERACTIONS OF VPR WITH HOST CELLULAR PROTEINS | Genes involved in Interactions of Vpr with host cellular proteins |
| 0.0 | 0.9 | REACTOME ACYL CHAIN REMODELLING OF PS | Genes involved in Acyl chain remodelling of PS |
| 0.0 | 1.6 | REACTOME REGULATION OF KIT SIGNALING | Genes involved in Regulation of KIT signaling |
| 0.0 | 1.1 | REACTOME AMINE DERIVED HORMONES | Genes involved in Amine-derived hormones |
| 0.0 | 0.9 | REACTOME THE ACTIVATION OF ARYLSULFATASES | Genes involved in The activation of arylsulfatases |
| 0.0 | 12.4 | REACTOME METABOLISM OF AMINO ACIDS AND DERIVATIVES | Genes involved in Metabolism of amino acids and derivatives |
| 0.0 | 0.7 | REACTOME KERATAN SULFATE DEGRADATION | Genes involved in Keratan sulfate degradation |
| 0.0 | 2.7 | REACTOME GLYCOLYSIS | Genes involved in Glycolysis |
| 0.0 | 1.4 | REACTOME ACTIVATED AMPK STIMULATES FATTY ACID OXIDATION IN MUSCLE | Genes involved in Activated AMPK stimulates fatty-acid oxidation in muscle |
| 0.0 | 0.8 | REACTOME BASE FREE SUGAR PHOSPHATE REMOVAL VIA THE SINGLE NUCLEOTIDE REPLACEMENT PATHWAY | Genes involved in Base-free sugar-phosphate removal via the single-nucleotide replacement pathway |
| 0.0 | 0.6 | REACTOME VEGF LIGAND RECEPTOR INTERACTIONS | Genes involved in VEGF ligand-receptor interactions |
| 0.0 | 1.0 | REACTOME PHOSPHORYLATION OF CD3 AND TCR ZETA CHAINS | Genes involved in Phosphorylation of CD3 and TCR zeta chains |
| 0.0 | 3.5 | REACTOME INTERFERON GAMMA SIGNALING | Genes involved in Interferon gamma signaling |
| 0.0 | 1.3 | REACTOME REGULATION OF GLUCOKINASE BY GLUCOKINASE REGULATORY PROTEIN | Genes involved in Regulation of Glucokinase by Glucokinase Regulatory Protein |
| 0.0 | 3.0 | REACTOME IMMUNOREGULATORY INTERACTIONS BETWEEN A LYMPHOID AND A NON LYMPHOID CELL | Genes involved in Immunoregulatory interactions between a Lymphoid and a non-Lymphoid cell |
| 0.0 | 1.1 | REACTOME DEGRADATION OF THE EXTRACELLULAR MATRIX | Genes involved in Degradation of the extracellular matrix |
| 0.0 | 0.6 | REACTOME CLASS C 3 METABOTROPIC GLUTAMATE PHEROMONE RECEPTORS | Genes involved in Class C/3 (Metabotropic glutamate/pheromone receptors) |
| 0.0 | 6.6 | REACTOME OLFACTORY SIGNALING PATHWAY | Genes involved in Olfactory Signaling Pathway |
| 0.0 | 4.5 | REACTOME FACTORS INVOLVED IN MEGAKARYOCYTE DEVELOPMENT AND PLATELET PRODUCTION | Genes involved in Factors involved in megakaryocyte development and platelet production |
| 0.0 | 2.0 | REACTOME RESPIRATORY ELECTRON TRANSPORT | Genes involved in Respiratory electron transport |
| 0.0 | 0.9 | REACTOME AMYLOIDS | Genes involved in Amyloids |
| 0.0 | 0.3 | REACTOME AMINE COMPOUND SLC TRANSPORTERS | Genes involved in Amine compound SLC transporters |
| 0.0 | 0.6 | REACTOME GAP JUNCTION ASSEMBLY | Genes involved in Gap junction assembly |
| 0.0 | 0.7 | REACTOME LIPID DIGESTION MOBILIZATION AND TRANSPORT | Genes involved in Lipid digestion, mobilization, and transport |
| 0.0 | 0.8 | REACTOME EFFECTS OF PIP2 HYDROLYSIS | Genes involved in Effects of PIP2 hydrolysis |
| 0.0 | 0.8 | REACTOME CHONDROITIN SULFATE BIOSYNTHESIS | Genes involved in Chondroitin sulfate biosynthesis |
| 0.0 | 0.2 | REACTOME ACTIVATION OF CHAPERONE GENES BY ATF6 ALPHA | Genes involved in Activation of Chaperone Genes by ATF6-alpha |
| 0.0 | 0.9 | REACTOME ACTIVATION OF ATR IN RESPONSE TO REPLICATION STRESS | Genes involved in Activation of ATR in response to replication stress |
| 0.0 | 0.7 | REACTOME GLYCOSPHINGOLIPID METABOLISM | Genes involved in Glycosphingolipid metabolism |
| 0.0 | 1.9 | REACTOME RESPONSE TO ELEVATED PLATELET CYTOSOLIC CA2 | Genes involved in Response to elevated platelet cytosolic Ca2+ |
| 0.0 | 0.3 | REACTOME APOPTOTIC CLEAVAGE OF CELL ADHESION PROTEINS | Genes involved in Apoptotic cleavage of cell adhesion proteins |
| 0.0 | 0.4 | REACTOME FACILITATIVE NA INDEPENDENT GLUCOSE TRANSPORTERS | Genes involved in Facilitative Na+-independent glucose transporters |
| 0.0 | 1.2 | REACTOME O LINKED GLYCOSYLATION OF MUCINS | Genes involved in O-linked glycosylation of mucins |
| 0.0 | 0.4 | REACTOME INSULIN RECEPTOR RECYCLING | Genes involved in Insulin receptor recycling |
| 0.0 | 0.4 | REACTOME MUSCLE CONTRACTION | Genes involved in Muscle contraction |
| 0.0 | 0.9 | REACTOME MEIOTIC SYNAPSIS | Genes involved in Meiotic Synapsis |
| 0.0 | 0.4 | REACTOME ACTIVATED NOTCH1 TRANSMITS SIGNAL TO THE NUCLEUS | Genes involved in Activated NOTCH1 Transmits Signal to the Nucleus |
| 0.0 | 0.3 | REACTOME G PROTEIN ACTIVATION | Genes involved in G-protein activation |