Project
Illumina Body Map 2 (GSE30611)
Navigation
Downloads
Results for GAUUGUC
Z-value: 0.41
Motif logo

miRNA associated with seed GAUUGUC
| Name | miRBASE accession |
|---|---|
|
hsa-miR-219a-5p
|
MIMAT0000276 |
|
hsa-miR-4782-3p
|
MIMAT0019945 |
|
hsa-miR-6766-3p
|
MIMAT0027433 |
Activity profile of GAUUGUC motif
Sorted Z-values of GAUUGUC motif
Network of associatons between targets according to the STRING database.

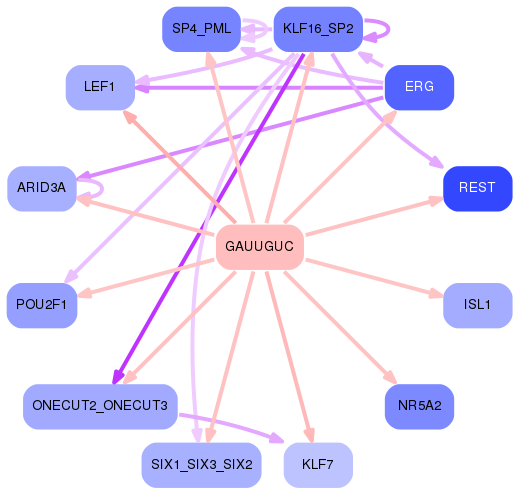
First level regulatory network of GAUUGUC
Gene Ontology Analysis
Gene overrepresentation in biological process category:
| Log-likelihood per target | Total log-likelihood | Term | Description |
|---|---|---|---|
| 0.4 | 1.6 | GO:1990086 | lens fiber cell apoptotic process(GO:1990086) |
| 0.2 | 1.2 | GO:0061152 | trachea submucosa development(GO:0061152) trachea gland development(GO:0061153) |
| 0.2 | 0.5 | GO:0061300 | cerebellum vasculature development(GO:0061300) |
| 0.1 | 0.4 | GO:2000798 | amniotic stem cell differentiation(GO:0097086) negative regulation of dense core granule biogenesis(GO:2000706) negative regulation of mesenchymal stem cell differentiation(GO:2000740) regulation of amniotic stem cell differentiation(GO:2000797) negative regulation of amniotic stem cell differentiation(GO:2000798) |
| 0.1 | 0.7 | GO:0032911 | negative regulation of transforming growth factor beta1 production(GO:0032911) |
| 0.1 | 0.1 | GO:0061033 | secretion by lung epithelial cell involved in lung growth(GO:0061033) |
| 0.1 | 0.3 | GO:0060913 | visceral motor neuron differentiation(GO:0021524) cardiac cell fate determination(GO:0060913) positive regulation of granulocyte colony-stimulating factor production(GO:0071657) positive regulation of macrophage colony-stimulating factor production(GO:1901258) |
| 0.1 | 0.3 | GO:1904017 | cellular response to Thyroglobulin triiodothyronine(GO:1904017) |
| 0.1 | 0.3 | GO:0060876 | semicircular canal formation(GO:0060876) |
| 0.1 | 0.2 | GO:0090273 | regulation of somatostatin secretion(GO:0090273) positive regulation of somatostatin secretion(GO:0090274) |
| 0.1 | 0.5 | GO:1900042 | positive regulation of interleukin-2 secretion(GO:1900042) |
| 0.1 | 0.4 | GO:0090076 | relaxation of skeletal muscle(GO:0090076) |
| 0.1 | 0.7 | GO:0006848 | pyruvate transport(GO:0006848) pyruvate transmembrane transport(GO:1901475) |
| 0.1 | 0.2 | GO:0021526 | medial motor column neuron differentiation(GO:0021526) |
| 0.1 | 0.2 | GO:0071314 | cellular response to cocaine(GO:0071314) |
| 0.1 | 0.4 | GO:0003199 | endocardial cushion to mesenchymal transition involved in heart valve formation(GO:0003199) |
| 0.1 | 0.5 | GO:1904684 | negative regulation of metalloendopeptidase activity(GO:1904684) |
| 0.1 | 1.0 | GO:1903715 | regulation of aerobic respiration(GO:1903715) |
| 0.1 | 0.3 | GO:0014004 | microglia differentiation(GO:0014004) microglia development(GO:0014005) |
| 0.0 | 0.1 | GO:0032811 | negative regulation of epinephrine secretion(GO:0032811) |
| 0.0 | 0.3 | GO:0071883 | activation of MAPK activity by adrenergic receptor signaling pathway(GO:0071883) |
| 0.0 | 0.4 | GO:0061113 | pancreas morphogenesis(GO:0061113) |
| 0.0 | 0.1 | GO:0007402 | ganglion mother cell fate determination(GO:0007402) |
| 0.0 | 0.2 | GO:0021849 | neuroblast division in subventricular zone(GO:0021849) |
| 0.0 | 0.1 | GO:1904562 | phosphatidylinositol 5-phosphate metabolic process(GO:1904562) |
| 0.0 | 0.2 | GO:0035790 | platelet-derived growth factor receptor-alpha signaling pathway(GO:0035790) |
| 0.0 | 0.1 | GO:0002415 | immunoglobulin transcytosis in epithelial cells mediated by polymeric immunoglobulin receptor(GO:0002415) |
| 0.0 | 0.2 | GO:0035854 | regulation of primitive erythrocyte differentiation(GO:0010725) eosinophil fate commitment(GO:0035854) regulation of forebrain neuron differentiation(GO:2000977) |
| 0.0 | 0.2 | GO:0003221 | right ventricular cardiac muscle tissue morphogenesis(GO:0003221) |
| 0.0 | 0.1 | GO:0001555 | oocyte growth(GO:0001555) |
| 0.0 | 0.3 | GO:0072502 | cellular phosphate ion homeostasis(GO:0030643) cellular trivalent inorganic anion homeostasis(GO:0072502) |
| 0.0 | 0.1 | GO:2000597 | optic nerve formation(GO:0021634) optic chiasma development(GO:0061360) regulation of optic nerve formation(GO:2000595) positive regulation of optic nerve formation(GO:2000597) |
| 0.0 | 0.1 | GO:0061386 | closure of optic fissure(GO:0061386) |
| 0.0 | 0.2 | GO:0021979 | hypothalamus cell differentiation(GO:0021979) |
| 0.0 | 0.3 | GO:0031087 | deadenylation-independent decapping of nuclear-transcribed mRNA(GO:0031087) |
| 0.0 | 0.2 | GO:0010961 | cellular magnesium ion homeostasis(GO:0010961) |
| 0.0 | 0.1 | GO:0050925 | cerebral cortex tangential migration using cell-cell interactions(GO:0021823) postnatal olfactory bulb interneuron migration(GO:0021827) chemorepulsion involved in postnatal olfactory bulb interneuron migration(GO:0021836) negative regulation of negative chemotaxis(GO:0050925) |
| 0.0 | 0.2 | GO:0090210 | regulation of establishment of blood-brain barrier(GO:0090210) |
| 0.0 | 0.5 | GO:0031507 | heterochromatin assembly(GO:0031507) |
| 0.0 | 0.3 | GO:0048227 | plasma membrane to endosome transport(GO:0048227) |
| 0.0 | 0.2 | GO:0072513 | positive regulation of secondary heart field cardioblast proliferation(GO:0072513) |
| 0.0 | 0.1 | GO:0051088 | PMA-inducible membrane protein ectodomain proteolysis(GO:0051088) |
| 0.0 | 0.1 | GO:1900248 | cytoplasmic translational elongation(GO:0002182) regulation of cytoplasmic translational elongation(GO:1900247) negative regulation of cytoplasmic translational elongation(GO:1900248) |
| 0.0 | 0.2 | GO:2000790 | regulation of mesenchymal cell proliferation involved in lung development(GO:2000790) negative regulation of mesenchymal cell proliferation involved in lung development(GO:2000791) negative regulation of epithelial cell proliferation involved in lung morphogenesis(GO:2000795) |
| 0.0 | 0.2 | GO:0044387 | negative regulation of protein kinase activity by regulation of protein phosphorylation(GO:0044387) |
| 0.0 | 0.8 | GO:0071526 | semaphorin-plexin signaling pathway(GO:0071526) |
| 0.0 | 0.1 | GO:0061087 | positive regulation of histone H3-K27 methylation(GO:0061087) |
| 0.0 | 0.1 | GO:2000077 | negative regulation of dopaminergic neuron differentiation(GO:1904339) negative regulation of type B pancreatic cell development(GO:2000077) |
| 0.0 | 0.1 | GO:0035627 | ceramide transport(GO:0035627) |
| 0.0 | 0.5 | GO:0048148 | behavioral response to cocaine(GO:0048148) |
| 0.0 | 0.2 | GO:0002315 | marginal zone B cell differentiation(GO:0002315) |
| 0.0 | 0.1 | GO:0042997 | negative regulation of Golgi to plasma membrane protein transport(GO:0042997) |
Gene overrepresentation in cellular component category:
| Log-likelihood per target | Total log-likelihood | Term | Description |
|---|---|---|---|
| 0.2 | 1.2 | GO:0070022 | transforming growth factor beta receptor homodimeric complex(GO:0070022) |
| 0.1 | 1.2 | GO:1990907 | beta-catenin-TCF complex(GO:1990907) |
| 0.1 | 0.2 | GO:0035370 | UBC13-UEV1A complex(GO:0035370) |
| 0.1 | 0.5 | GO:0032437 | cuticular plate(GO:0032437) |
| 0.0 | 0.3 | GO:0070435 | Shc-EGFR complex(GO:0070435) |
| 0.0 | 0.1 | GO:0002945 | cyclin K-CDK13 complex(GO:0002945) |
| 0.0 | 0.4 | GO:0005677 | chromatin silencing complex(GO:0005677) |
| 0.0 | 0.2 | GO:0097524 | sperm plasma membrane(GO:0097524) |
| 0.0 | 0.2 | GO:0016600 | flotillin complex(GO:0016600) |
| 0.0 | 0.3 | GO:0042788 | polysomal ribosome(GO:0042788) |
| 0.0 | 0.2 | GO:0001940 | male pronucleus(GO:0001940) |
| 0.0 | 0.3 | GO:0000177 | cytoplasmic exosome (RNase complex)(GO:0000177) |
| 0.0 | 0.3 | GO:0035102 | PRC1 complex(GO:0035102) |
Gene overrepresentation in molecular function category:
| Log-likelihood per target | Total log-likelihood | Term | Description |
|---|---|---|---|
| 0.4 | 1.2 | GO:0005026 | transforming growth factor beta receptor activity, type II(GO:0005026) |
| 0.2 | 0.7 | GO:0005477 | pyruvate secondary active transmembrane transporter activity(GO:0005477) |
| 0.1 | 0.3 | GO:0000822 | inositol hexakisphosphate binding(GO:0000822) |
| 0.1 | 1.2 | GO:0030284 | estrogen receptor activity(GO:0030284) |
| 0.1 | 0.2 | GO:0033142 | progesterone receptor binding(GO:0033142) |
| 0.0 | 0.1 | GO:0004938 | alpha2-adrenergic receptor activity(GO:0004938) |
| 0.0 | 0.2 | GO:0001069 | regulatory region RNA binding(GO:0001069) |
| 0.0 | 0.2 | GO:0033829 | O-fucosylpeptide 3-beta-N-acetylglucosaminyltransferase activity(GO:0033829) |
| 0.0 | 0.8 | GO:0017154 | semaphorin receptor activity(GO:0017154) |
| 0.0 | 0.2 | GO:0005017 | platelet-derived growth factor-activated receptor activity(GO:0005017) |
| 0.0 | 0.3 | GO:0048408 | epidermal growth factor binding(GO:0048408) |
| 0.0 | 0.5 | GO:0005172 | vascular endothelial growth factor receptor binding(GO:0005172) |
| 0.0 | 0.1 | GO:0035614 | snRNA stem-loop binding(GO:0035614) |
| 0.0 | 0.4 | GO:0015271 | outward rectifier potassium channel activity(GO:0015271) |
| 0.0 | 0.1 | GO:0030375 | thyroid hormone receptor activator activity(GO:0010861) thyroid hormone receptor coactivator activity(GO:0030375) |
| 0.0 | 0.5 | GO:0008191 | metalloendopeptidase inhibitor activity(GO:0008191) |
| 0.0 | 0.1 | GO:0072345 | NAADP-sensitive calcium-release channel activity(GO:0072345) |
| 0.0 | 0.5 | GO:0001222 | transcription corepressor binding(GO:0001222) |
| 0.0 | 0.3 | GO:0005078 | MAP-kinase scaffold activity(GO:0005078) |
| 0.0 | 0.2 | GO:1904929 | coreceptor activity involved in Wnt signaling pathway, planar cell polarity pathway(GO:1904929) |
| 0.0 | 0.2 | GO:0042285 | UDP-xylosyltransferase activity(GO:0035252) xylosyltransferase activity(GO:0042285) |
| 0.0 | 0.2 | GO:0043023 | ribosomal large subunit binding(GO:0043023) |
| 0.0 | 0.4 | GO:0015467 | G-protein activated inward rectifier potassium channel activity(GO:0015467) voltage-gated potassium channel activity involved in cardiac muscle cell action potential repolarization(GO:0086008) |
| 0.0 | 0.1 | GO:0019763 | immunoglobulin receptor activity(GO:0019763) |
| 0.0 | 0.0 | GO:0032427 | GBD domain binding(GO:0032427) |
| 0.0 | 0.2 | GO:0047372 | acylglycerol lipase activity(GO:0047372) |
| 0.0 | 0.1 | GO:0008046 | axon guidance receptor activity(GO:0008046) |
| 0.0 | 0.1 | GO:0017089 | glycolipid transporter activity(GO:0017089) |
| 0.0 | 0.2 | GO:0048406 | nerve growth factor binding(GO:0048406) |
| 0.0 | 0.8 | GO:0001205 | transcriptional activator activity, RNA polymerase II distal enhancer sequence-specific binding(GO:0001205) |
| 0.0 | 0.5 | GO:0030506 | ankyrin binding(GO:0030506) |
Gene overrepresentation in curated gene sets: canonical pathways category:
| Log-likelihood per target | Total log-likelihood | Term | Description |
|---|---|---|---|
| 0.0 | 1.2 | PID ALK1 PATHWAY | ALK1 signaling events |
| 0.0 | 0.3 | PID ERB GENOMIC PATHWAY | Validated nuclear estrogen receptor beta network |
| 0.0 | 0.5 | PID VEGFR1 PATHWAY | VEGFR1 specific signals |
| 0.0 | 1.3 | PID ERBB4 PATHWAY | ErbB4 signaling events |
Gene overrepresentation in curated gene sets: REACTOME pathways category:
| Log-likelihood per target | Total log-likelihood | Term | Description |
|---|---|---|---|
| 0.0 | 1.2 | REACTOME TGF BETA RECEPTOR SIGNALING IN EMT EPITHELIAL TO MESENCHYMAL TRANSITION | Genes involved in TGF-beta receptor signaling in EMT (epithelial to mesenchymal transition) |
| 0.0 | 0.7 | REACTOME BILE SALT AND ORGANIC ANION SLC TRANSPORTERS | Genes involved in Bile salt and organic anion SLC transporters |
| 0.0 | 0.8 | REACTOME OTHER SEMAPHORIN INTERACTIONS | Genes involved in Other semaphorin interactions |
| 0.0 | 1.0 | REACTOME NEPHRIN INTERACTIONS | Genes involved in Nephrin interactions |
| 0.0 | 0.3 | REACTOME SYNTHESIS SECRETION AND INACTIVATION OF GIP | Genes involved in Synthesis, Secretion, and Inactivation of Glucose-dependent Insulinotropic Polypeptide (GIP) |
| 0.0 | 0.1 | REACTOME RECEPTOR LIGAND BINDING INITIATES THE SECOND PROTEOLYTIC CLEAVAGE OF NOTCH RECEPTOR | Genes involved in Receptor-ligand binding initiates the second proteolytic cleavage of Notch receptor |
| 0.0 | 0.2 | REACTOME RNA POL III TRANSCRIPTION TERMINATION | Genes involved in RNA Polymerase III Transcription Termination |
| 0.0 | 0.3 | REACTOME SIGNAL ATTENUATION | Genes involved in Signal attenuation |
| 0.0 | 0.4 | REACTOME PRE NOTCH PROCESSING IN GOLGI | Genes involved in Pre-NOTCH Processing in Golgi |
| 0.0 | 0.8 | REACTOME REGULATION OF BETA CELL DEVELOPMENT | Genes involved in Regulation of beta-cell development |