Project
Illumina Body Map 2 (GSE30611)
Navigation
Downloads
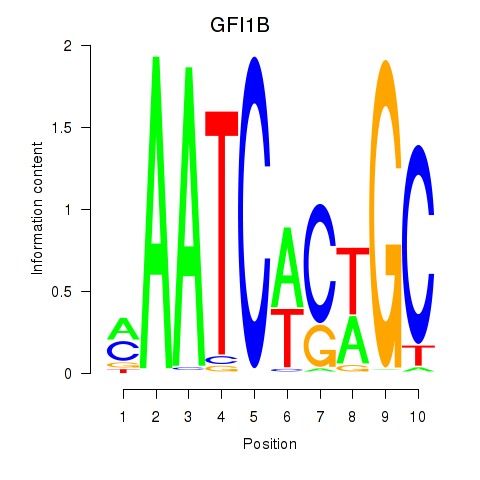
Results for GFI1B
Z-value: 1.35
Motif logo
Transcription factors associated with GFI1B
| Gene Symbol | Gene ID | Gene Info |
|---|---|---|
|
GFI1B
|
ENSG00000165702.15 | growth factor independent 1B transcriptional repressor |
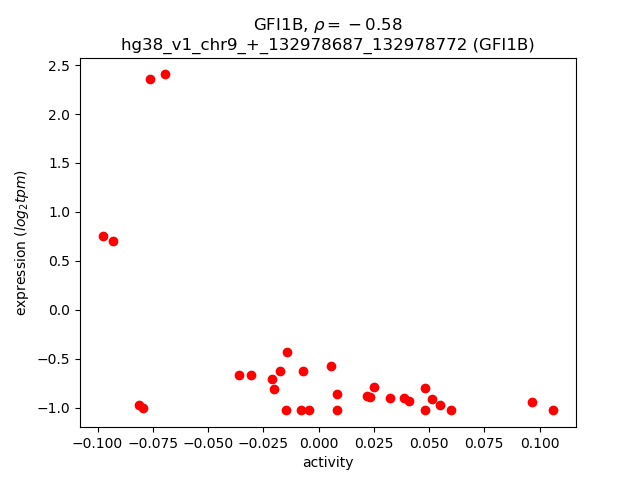
Activity-expression correlation:
| Gene | Promoter | Pearson corr. coef. | P-value | Plot |
|---|---|---|---|---|
| GFI1B | hg38_v1_chr9_+_132978687_132978772 | -0.58 | 4.8e-04 | Click! |
Activity profile of GFI1B motif
Sorted Z-values of GFI1B motif
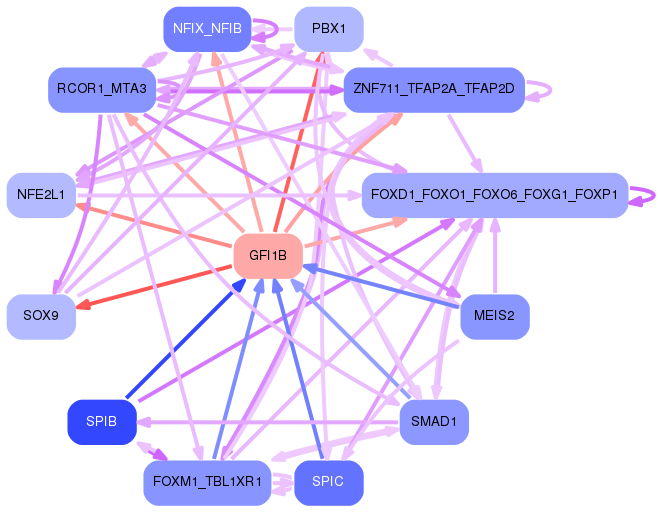
Network of associatons between targets according to the STRING database.

First level regulatory network of GFI1B
Gene Ontology Analysis
Gene overrepresentation in biological process category:
| Log-likelihood per target | Total log-likelihood | Term | Description |
|---|---|---|---|
| 1.3 | 3.9 | GO:0072034 | primary prostatic bud elongation(GO:0060516) renal vesicle induction(GO:0072034) |
| 1.2 | 5.0 | GO:0031455 | glycine betaine biosynthetic process from choline(GO:0019285) glycine betaine metabolic process(GO:0031455) glycine betaine biosynthetic process(GO:0031456) |
| 0.9 | 4.6 | GO:1901846 | positive regulation of cell communication by electrical coupling involved in cardiac conduction(GO:1901846) |
| 0.9 | 5.3 | GO:0093001 | glycolysis from storage polysaccharide through glucose-1-phosphate(GO:0093001) |
| 0.5 | 0.5 | GO:2000393 | negative regulation of lamellipodium morphogenesis(GO:2000393) |
| 0.4 | 2.7 | GO:0033615 | mitochondrial proton-transporting ATP synthase complex assembly(GO:0033615) |
| 0.4 | 1.7 | GO:0070124 | mitochondrial translational initiation(GO:0070124) |
| 0.3 | 3.0 | GO:0031444 | slow-twitch skeletal muscle fiber contraction(GO:0031444) |
| 0.3 | 2.8 | GO:0021940 | positive regulation of cerebellar granule cell precursor proliferation(GO:0021940) |
| 0.3 | 1.3 | GO:0060585 | nitric oxide transport(GO:0030185) rhythmic synaptic transmission(GO:0060024) regulation of prostaglandin-endoperoxide synthase activity(GO:0060584) positive regulation of prostaglandin-endoperoxide synthase activity(GO:0060585) |
| 0.3 | 0.6 | GO:0061055 | myotome development(GO:0061055) |
| 0.3 | 0.9 | GO:1901877 | regulation of calcium ion binding(GO:1901876) negative regulation of calcium ion binding(GO:1901877) |
| 0.3 | 0.9 | GO:0043438 | acetoacetic acid metabolic process(GO:0043438) |
| 0.3 | 0.9 | GO:0046709 | IDP metabolic process(GO:0046707) IDP catabolic process(GO:0046709) negative regulation of ribosome biogenesis(GO:0090071) |
| 0.3 | 3.1 | GO:0006537 | glutamate biosynthetic process(GO:0006537) |
| 0.3 | 1.0 | GO:0097115 | cytoskeletal matrix organization at active zone(GO:0048789) neurexin clustering involved in presynaptic membrane assembly(GO:0097115) retrograde trans-synaptic signaling by trans-synaptic protein complex(GO:0098942) |
| 0.2 | 5.4 | GO:0045162 | clustering of voltage-gated sodium channels(GO:0045162) |
| 0.2 | 0.7 | GO:0003186 | tricuspid valve morphogenesis(GO:0003186) |
| 0.2 | 4.2 | GO:0001514 | selenocysteine incorporation(GO:0001514) translational readthrough(GO:0006451) |
| 0.2 | 1.5 | GO:0033133 | positive regulation of glucokinase activity(GO:0033133) |
| 0.2 | 1.5 | GO:0072156 | distal tubule morphogenesis(GO:0072156) |
| 0.2 | 3.2 | GO:1900028 | negative regulation of ruffle assembly(GO:1900028) |
| 0.2 | 1.1 | GO:1904491 | protein localization to ciliary transition zone(GO:1904491) |
| 0.2 | 2.7 | GO:0045329 | carnitine biosynthetic process(GO:0045329) |
| 0.2 | 9.1 | GO:0035162 | embryonic hemopoiesis(GO:0035162) |
| 0.2 | 0.8 | GO:1903644 | regulation of chaperone-mediated protein folding(GO:1903644) |
| 0.2 | 3.9 | GO:0090091 | positive regulation of extracellular matrix disassembly(GO:0090091) |
| 0.2 | 4.5 | GO:0008090 | retrograde axonal transport(GO:0008090) |
| 0.2 | 2.5 | GO:0015705 | iodide transport(GO:0015705) |
| 0.2 | 1.8 | GO:0016560 | protein import into peroxisome matrix, docking(GO:0016560) |
| 0.2 | 0.7 | GO:0070681 | glutaminyl-tRNAGln biosynthesis via transamidation(GO:0070681) |
| 0.2 | 2.5 | GO:0010993 | regulation of ubiquitin homeostasis(GO:0010993) free ubiquitin chain polymerization(GO:0010994) |
| 0.2 | 0.7 | GO:0043006 | activation of phospholipase A2 activity by calcium-mediated signaling(GO:0043006) |
| 0.2 | 1.9 | GO:2000795 | negative regulation of epithelial cell proliferation involved in lung morphogenesis(GO:2000795) |
| 0.2 | 0.5 | GO:0046338 | phosphatidylethanolamine catabolic process(GO:0046338) |
| 0.2 | 2.8 | GO:0015727 | lactate transport(GO:0015727) lactate transmembrane transport(GO:0035873) |
| 0.2 | 0.5 | GO:0090290 | positive regulation of osteoclast proliferation(GO:0090290) |
| 0.2 | 4.8 | GO:1904778 | regulation of protein localization to cell cortex(GO:1904776) positive regulation of protein localization to cell cortex(GO:1904778) |
| 0.2 | 2.2 | GO:0060681 | branch elongation involved in ureteric bud branching(GO:0060681) |
| 0.2 | 0.6 | GO:0090158 | endoplasmic reticulum membrane organization(GO:0090158) |
| 0.2 | 0.6 | GO:0036269 | swimming behavior(GO:0036269) |
| 0.2 | 1.4 | GO:0035494 | SNARE complex disassembly(GO:0035494) |
| 0.2 | 2.0 | GO:0051451 | myoblast migration(GO:0051451) |
| 0.1 | 7.8 | GO:0003298 | physiological muscle hypertrophy(GO:0003298) physiological cardiac muscle hypertrophy(GO:0003301) cell growth involved in cardiac muscle cell development(GO:0061049) |
| 0.1 | 0.7 | GO:0048319 | mesodermal cell migration(GO:0008078) axial mesoderm morphogenesis(GO:0048319) |
| 0.1 | 0.6 | GO:0016480 | negative regulation of transcription from RNA polymerase III promoter(GO:0016480) |
| 0.1 | 0.4 | GO:0061357 | positive regulation of Wnt protein secretion(GO:0061357) |
| 0.1 | 2.5 | GO:0006228 | UTP biosynthetic process(GO:0006228) |
| 0.1 | 0.4 | GO:1901388 | regulation of transforming growth factor beta activation(GO:1901388) negative regulation of transforming growth factor beta activation(GO:1901389) |
| 0.1 | 1.1 | GO:1902774 | late endosome to lysosome transport(GO:1902774) |
| 0.1 | 0.5 | GO:0032474 | otolith morphogenesis(GO:0032474) |
| 0.1 | 1.9 | GO:0090394 | negative regulation of excitatory postsynaptic potential(GO:0090394) |
| 0.1 | 3.2 | GO:0070262 | peptidyl-serine dephosphorylation(GO:0070262) |
| 0.1 | 1.3 | GO:0042866 | pyruvate biosynthetic process(GO:0042866) |
| 0.1 | 0.7 | GO:0070940 | dephosphorylation of RNA polymerase II C-terminal domain(GO:0070940) |
| 0.1 | 1.2 | GO:0061591 | calcium activated phospholipid scrambling(GO:0061588) calcium activated phosphatidylcholine scrambling(GO:0061590) calcium activated galactosylceramide scrambling(GO:0061591) |
| 0.1 | 4.9 | GO:0006783 | heme biosynthetic process(GO:0006783) |
| 0.1 | 0.9 | GO:0010265 | SCF complex assembly(GO:0010265) |
| 0.1 | 0.8 | GO:2000230 | negative regulation of pancreatic stellate cell proliferation(GO:2000230) |
| 0.1 | 0.4 | GO:0007538 | primary sex determination(GO:0007538) |
| 0.1 | 3.2 | GO:0006833 | water transport(GO:0006833) |
| 0.1 | 0.6 | GO:0006102 | isocitrate metabolic process(GO:0006102) |
| 0.1 | 1.0 | GO:1901297 | positive regulation of ephrin receptor signaling pathway(GO:1901189) positive regulation of canonical Wnt signaling pathway involved in cardiac muscle cell fate commitment(GO:1901297) positive regulation of canonical Wnt signaling pathway involved in heart development(GO:1905068) |
| 0.1 | 1.7 | GO:0071205 | protein localization to juxtaparanode region of axon(GO:0071205) |
| 0.1 | 1.0 | GO:0006545 | glycine biosynthetic process(GO:0006545) |
| 0.1 | 0.2 | GO:1903031 | regulation of microtubule plus-end binding(GO:1903031) positive regulation of microtubule plus-end binding(GO:1903033) |
| 0.1 | 0.6 | GO:0097368 | establishment of Sertoli cell barrier(GO:0097368) |
| 0.1 | 0.6 | GO:0021780 | oligodendrocyte cell fate specification(GO:0021778) oligodendrocyte cell fate commitment(GO:0021779) glial cell fate specification(GO:0021780) |
| 0.1 | 0.4 | GO:0050960 | detection of temperature stimulus involved in thermoception(GO:0050960) response to capsazepine(GO:1901594) |
| 0.1 | 0.8 | GO:0099566 | regulation of postsynaptic cytosolic calcium ion concentration(GO:0099566) |
| 0.1 | 0.2 | GO:0046108 | uridine metabolic process(GO:0046108) |
| 0.1 | 0.6 | GO:0001951 | intestinal D-glucose absorption(GO:0001951) |
| 0.1 | 0.8 | GO:0030321 | transepithelial chloride transport(GO:0030321) |
| 0.1 | 0.7 | GO:0045602 | negative regulation of endothelial cell differentiation(GO:0045602) |
| 0.1 | 0.6 | GO:0000255 | allantoin metabolic process(GO:0000255) |
| 0.1 | 4.9 | GO:0051491 | positive regulation of filopodium assembly(GO:0051491) |
| 0.1 | 1.9 | GO:0016024 | CDP-diacylglycerol biosynthetic process(GO:0016024) |
| 0.1 | 0.4 | GO:0006127 | glycerophosphate shuttle(GO:0006127) |
| 0.1 | 1.4 | GO:0006089 | lactate metabolic process(GO:0006089) |
| 0.1 | 0.3 | GO:0034414 | tRNA 3'-trailer cleavage, endonucleolytic(GO:0034414) tRNA 3'-trailer cleavage(GO:0042779) |
| 0.1 | 1.9 | GO:0030208 | dermatan sulfate biosynthetic process(GO:0030208) |
| 0.1 | 0.3 | GO:0051257 | meiotic metaphase I plate congression(GO:0043060) meiotic spindle midzone assembly(GO:0051257) meiotic metaphase plate congression(GO:0051311) |
| 0.1 | 1.9 | GO:0071420 | cellular response to histamine(GO:0071420) |
| 0.1 | 0.7 | GO:0036371 | protein localization to T-tubule(GO:0036371) |
| 0.1 | 0.5 | GO:0033353 | S-adenosylmethionine cycle(GO:0033353) |
| 0.1 | 0.2 | GO:0036265 | RNA (guanine-N7)-methylation(GO:0036265) rRNA (guanine-N7)-methylation(GO:0070476) |
| 0.1 | 3.3 | GO:0097352 | autophagosome maturation(GO:0097352) |
| 0.0 | 2.1 | GO:0005980 | glycogen catabolic process(GO:0005980) |
| 0.0 | 1.3 | GO:0048934 | peripheral nervous system neuron differentiation(GO:0048934) peripheral nervous system neuron development(GO:0048935) |
| 0.0 | 0.7 | GO:0051096 | positive regulation of helicase activity(GO:0051096) |
| 0.0 | 0.2 | GO:1903371 | regulation of endoplasmic reticulum tubular network organization(GO:1903371) |
| 0.0 | 0.6 | GO:0031339 | negative regulation of vesicle fusion(GO:0031339) |
| 0.0 | 1.0 | GO:0048172 | regulation of short-term neuronal synaptic plasticity(GO:0048172) |
| 0.0 | 0.5 | GO:0006572 | tyrosine catabolic process(GO:0006572) |
| 0.0 | 1.1 | GO:0040015 | negative regulation of multicellular organism growth(GO:0040015) |
| 0.0 | 0.4 | GO:0080009 | mRNA methylation(GO:0080009) |
| 0.0 | 0.2 | GO:0009236 | cobalamin biosynthetic process(GO:0009236) |
| 0.0 | 0.6 | GO:0046600 | negative regulation of centriole replication(GO:0046600) |
| 0.0 | 0.2 | GO:0006420 | arginyl-tRNA aminoacylation(GO:0006420) |
| 0.0 | 1.6 | GO:0045662 | negative regulation of myoblast differentiation(GO:0045662) |
| 0.0 | 0.9 | GO:0042984 | amyloid precursor protein biosynthetic process(GO:0042983) regulation of amyloid precursor protein biosynthetic process(GO:0042984) |
| 0.0 | 0.7 | GO:0045086 | positive regulation of interleukin-2 biosynthetic process(GO:0045086) |
| 0.0 | 0.2 | GO:1900114 | histone H3-K27 trimethylation(GO:0098532) positive regulation of histone H3-K9 trimethylation(GO:1900114) |
| 0.0 | 2.1 | GO:0006471 | protein ADP-ribosylation(GO:0006471) |
| 0.0 | 2.5 | GO:0050690 | regulation of defense response to virus by virus(GO:0050690) |
| 0.0 | 0.4 | GO:0048022 | negative regulation of melanin biosynthetic process(GO:0048022) negative regulation of secondary metabolite biosynthetic process(GO:1900377) |
| 0.0 | 0.2 | GO:0048630 | skeletal muscle tissue growth(GO:0048630) |
| 0.0 | 0.4 | GO:0072383 | plus-end-directed vesicle transport along microtubule(GO:0072383) |
| 0.0 | 0.2 | GO:0060011 | Sertoli cell proliferation(GO:0060011) |
| 0.0 | 0.6 | GO:0018206 | peptidyl-methionine modification(GO:0018206) |
| 0.0 | 0.3 | GO:0007217 | tachykinin receptor signaling pathway(GO:0007217) |
| 0.0 | 1.3 | GO:0090129 | positive regulation of synapse maturation(GO:0090129) |
| 0.0 | 0.7 | GO:2000096 | positive regulation of Wnt signaling pathway, planar cell polarity pathway(GO:2000096) |
| 0.0 | 1.3 | GO:0007191 | adenylate cyclase-activating dopamine receptor signaling pathway(GO:0007191) |
| 0.0 | 0.2 | GO:0051673 | membrane disruption in other organism(GO:0051673) |
| 0.0 | 0.4 | GO:0032966 | negative regulation of collagen biosynthetic process(GO:0032966) |
| 0.0 | 1.4 | GO:0030866 | cortical actin cytoskeleton organization(GO:0030866) |
| 0.0 | 0.3 | GO:0000270 | peptidoglycan metabolic process(GO:0000270) peptidoglycan catabolic process(GO:0009253) |
| 0.0 | 1.3 | GO:0006700 | C21-steroid hormone biosynthetic process(GO:0006700) |
| 0.0 | 0.2 | GO:1904428 | negative regulation of tubulin deacetylation(GO:1904428) |
| 0.0 | 0.4 | GO:0006621 | protein retention in ER lumen(GO:0006621) |
| 0.0 | 0.3 | GO:0015860 | purine nucleoside transmembrane transport(GO:0015860) |
| 0.0 | 0.8 | GO:1904262 | negative regulation of TORC1 signaling(GO:1904262) |
| 0.0 | 0.1 | GO:0097536 | peripheral T cell tolerance induction(GO:0002458) peripheral tolerance induction(GO:0002465) thymus epithelium morphogenesis(GO:0097536) |
| 0.0 | 1.4 | GO:0031122 | cytoplasmic microtubule organization(GO:0031122) |
| 0.0 | 1.1 | GO:0010971 | positive regulation of G2/M transition of mitotic cell cycle(GO:0010971) |
| 0.0 | 2.8 | GO:0006636 | unsaturated fatty acid biosynthetic process(GO:0006636) |
| 0.0 | 0.4 | GO:1905232 | cellular response to L-glutamate(GO:1905232) |
| 0.0 | 2.4 | GO:0000381 | regulation of alternative mRNA splicing, via spliceosome(GO:0000381) |
| 0.0 | 0.4 | GO:0006689 | ganglioside catabolic process(GO:0006689) |
| 0.0 | 0.9 | GO:0001696 | gastric acid secretion(GO:0001696) |
| 0.0 | 0.5 | GO:0006450 | regulation of translational fidelity(GO:0006450) |
| 0.0 | 0.6 | GO:0016048 | detection of temperature stimulus(GO:0016048) |
| 0.0 | 0.1 | GO:1905224 | clathrin-coated pit assembly(GO:1905224) |
| 0.0 | 5.2 | GO:0030010 | establishment of cell polarity(GO:0030010) |
| 0.0 | 0.2 | GO:0055129 | L-proline biosynthetic process(GO:0055129) |
| 0.0 | 0.6 | GO:0015937 | coenzyme A biosynthetic process(GO:0015937) |
| 0.0 | 0.3 | GO:0014894 | response to muscle inactivity involved in regulation of muscle adaptation(GO:0014877) response to denervation involved in regulation of muscle adaptation(GO:0014894) |
| 0.0 | 1.4 | GO:0046847 | filopodium assembly(GO:0046847) |
| 0.0 | 0.3 | GO:0098703 | calcium ion import across plasma membrane(GO:0098703) calcium ion import into cell(GO:1990035) |
| 0.0 | 0.5 | GO:0002021 | response to dietary excess(GO:0002021) |
| 0.0 | 1.0 | GO:0014911 | positive regulation of smooth muscle cell migration(GO:0014911) |
| 0.0 | 0.1 | GO:0016557 | peroxisome membrane biogenesis(GO:0016557) |
| 0.0 | 0.7 | GO:0048012 | hepatocyte growth factor receptor signaling pathway(GO:0048012) |
| 0.0 | 0.9 | GO:0006622 | protein targeting to lysosome(GO:0006622) |
| 0.0 | 1.3 | GO:0006120 | mitochondrial electron transport, NADH to ubiquinone(GO:0006120) |
| 0.0 | 1.9 | GO:0007218 | neuropeptide signaling pathway(GO:0007218) |
| 0.0 | 0.6 | GO:0060766 | negative regulation of androgen receptor signaling pathway(GO:0060766) |
| 0.0 | 0.4 | GO:0031167 | rRNA methylation(GO:0031167) |
| 0.0 | 1.3 | GO:0050771 | negative regulation of axonogenesis(GO:0050771) |
| 0.0 | 1.3 | GO:0036092 | phosphatidylinositol-3-phosphate biosynthetic process(GO:0036092) |
| 0.0 | 0.2 | GO:0007185 | transmembrane receptor protein tyrosine phosphatase signaling pathway(GO:0007185) |
| 0.0 | 0.1 | GO:0042989 | sequestering of actin monomers(GO:0042989) |
| 0.0 | 0.1 | GO:0006398 | mRNA 3'-end processing by stem-loop binding and cleavage(GO:0006398) |
| 0.0 | 2.9 | GO:0007224 | smoothened signaling pathway(GO:0007224) |
| 0.0 | 1.1 | GO:1904893 | negative regulation of JAK-STAT cascade(GO:0046426) negative regulation of STAT cascade(GO:1904893) |
| 0.0 | 1.4 | GO:2000649 | regulation of sodium ion transmembrane transporter activity(GO:2000649) |
| 0.0 | 1.5 | GO:0071300 | cellular response to retinoic acid(GO:0071300) |
| 0.0 | 0.0 | GO:0050717 | positive regulation of interleukin-1 alpha secretion(GO:0050717) |
| 0.0 | 1.8 | GO:0010923 | negative regulation of phosphatase activity(GO:0010923) |
| 0.0 | 0.1 | GO:0061668 | mitochondrial ribosome assembly(GO:0061668) |
| 0.0 | 1.4 | GO:0001578 | microtubule bundle formation(GO:0001578) |
| 0.0 | 0.3 | GO:0006349 | regulation of gene expression by genetic imprinting(GO:0006349) |
| 0.0 | 0.3 | GO:0010990 | regulation of SMAD protein complex assembly(GO:0010990) negative regulation of SMAD protein complex assembly(GO:0010991) |
| 0.0 | 0.3 | GO:0044342 | type B pancreatic cell proliferation(GO:0044342) |
| 0.0 | 0.4 | GO:1903861 | positive regulation of dendrite extension(GO:1903861) |
| 0.0 | 2.5 | GO:0007156 | homophilic cell adhesion via plasma membrane adhesion molecules(GO:0007156) |
| 0.0 | 0.2 | GO:0034312 | diol biosynthetic process(GO:0034312) sphingosine biosynthetic process(GO:0046512) |
| 0.0 | 0.7 | GO:0006904 | vesicle docking involved in exocytosis(GO:0006904) |
Gene overrepresentation in cellular component category:
| Log-likelihood per target | Total log-likelihood | Term | Description |
|---|---|---|---|
| 0.8 | 5.3 | GO:0005945 | 6-phosphofructokinase complex(GO:0005945) |
| 0.5 | 4.5 | GO:0031673 | H zone(GO:0031673) |
| 0.4 | 1.3 | GO:0048237 | rough endoplasmic reticulum lumen(GO:0048237) |
| 0.4 | 1.9 | GO:0097454 | Schwann cell microvillus(GO:0097454) |
| 0.3 | 4.6 | GO:0033018 | junctional membrane complex(GO:0030314) sarcoplasmic reticulum lumen(GO:0033018) |
| 0.3 | 1.3 | GO:1902912 | pyruvate kinase complex(GO:1902912) |
| 0.2 | 0.7 | GO:0097489 | multivesicular body, internal vesicle lumen(GO:0097489) |
| 0.2 | 0.8 | GO:0038038 | G-protein coupled receptor homodimeric complex(GO:0038038) |
| 0.2 | 2.1 | GO:0005964 | phosphorylase kinase complex(GO:0005964) |
| 0.2 | 0.7 | GO:0030956 | glutamyl-tRNA(Gln) amidotransferase complex(GO:0030956) |
| 0.2 | 3.9 | GO:0036038 | MKS complex(GO:0036038) |
| 0.2 | 1.1 | GO:0036021 | endolysosome lumen(GO:0036021) |
| 0.1 | 3.0 | GO:0005861 | troponin complex(GO:0005861) |
| 0.1 | 5.6 | GO:0044295 | axonal growth cone(GO:0044295) |
| 0.1 | 0.4 | GO:1990913 | sperm head plasma membrane(GO:1990913) ooplasm(GO:1990917) |
| 0.1 | 2.5 | GO:0008091 | spectrin(GO:0008091) |
| 0.1 | 3.9 | GO:0043194 | axon initial segment(GO:0043194) |
| 0.1 | 1.6 | GO:0030478 | actin cap(GO:0030478) |
| 0.1 | 0.4 | GO:0036396 | MIS complex(GO:0036396) mRNA editing complex(GO:0045293) |
| 0.1 | 1.1 | GO:0005828 | kinetochore microtubule(GO:0005828) |
| 0.1 | 0.9 | GO:0097442 | CA3 pyramidal cell dendrite(GO:0097442) |
| 0.1 | 0.9 | GO:0072687 | meiotic spindle(GO:0072687) |
| 0.1 | 1.0 | GO:0002193 | MAML1-RBP-Jkappa- ICN1 complex(GO:0002193) |
| 0.1 | 0.3 | GO:0005715 | late recombination nodule(GO:0005715) |
| 0.1 | 0.6 | GO:0016012 | sarcoglycan complex(GO:0016012) |
| 0.1 | 1.9 | GO:0044300 | cerebellar mossy fiber(GO:0044300) |
| 0.1 | 1.1 | GO:0030123 | AP-3 adaptor complex(GO:0030123) |
| 0.1 | 3.2 | GO:0000159 | protein phosphatase type 2A complex(GO:0000159) |
| 0.1 | 0.9 | GO:0000137 | Golgi cis cisterna(GO:0000137) |
| 0.1 | 0.4 | GO:0009331 | glycerol-3-phosphate dehydrogenase complex(GO:0009331) |
| 0.1 | 0.9 | GO:0033010 | paranodal junction(GO:0033010) |
| 0.1 | 0.7 | GO:0031464 | Cul4A-RING E3 ubiquitin ligase complex(GO:0031464) |
| 0.1 | 1.4 | GO:0032591 | dendritic spine membrane(GO:0032591) |
| 0.0 | 1.2 | GO:0033270 | paranode region of axon(GO:0033270) |
| 0.0 | 0.6 | GO:0030991 | intraciliary transport particle A(GO:0030991) |
| 0.0 | 0.7 | GO:1990712 | HFE-transferrin receptor complex(GO:1990712) |
| 0.0 | 1.2 | GO:0000786 | nucleosome(GO:0000786) |
| 0.0 | 1.0 | GO:0017146 | NMDA selective glutamate receptor complex(GO:0017146) |
| 0.0 | 1.9 | GO:1902711 | GABA-A receptor complex(GO:1902711) |
| 0.0 | 0.8 | GO:0061700 | GATOR2 complex(GO:0061700) |
| 0.0 | 1.0 | GO:0032045 | guanyl-nucleotide exchange factor complex(GO:0032045) |
| 0.0 | 0.9 | GO:0071004 | U2-type prespliceosome(GO:0071004) |
| 0.0 | 0.9 | GO:0045009 | melanosome membrane(GO:0033162) chitosome(GO:0045009) |
| 0.0 | 11.0 | GO:0031674 | I band(GO:0031674) |
| 0.0 | 0.7 | GO:0032590 | dendrite membrane(GO:0032590) |
| 0.0 | 0.3 | GO:0001739 | sex chromatin(GO:0001739) |
| 0.0 | 9.9 | GO:0044798 | nuclear transcription factor complex(GO:0044798) |
| 0.0 | 0.2 | GO:0034673 | inhibin-betaglycan-ActRII complex(GO:0034673) |
| 0.0 | 1.4 | GO:0097546 | ciliary base(GO:0097546) |
| 0.0 | 1.5 | GO:0030131 | clathrin adaptor complex(GO:0030131) |
| 0.0 | 3.2 | GO:0043195 | terminal bouton(GO:0043195) |
| 0.0 | 6.3 | GO:0031225 | anchored component of membrane(GO:0031225) |
| 0.0 | 2.8 | GO:0005778 | peroxisomal membrane(GO:0005778) microbody membrane(GO:0031903) |
| 0.0 | 0.2 | GO:0005786 | signal recognition particle, endoplasmic reticulum targeting(GO:0005786) |
| 0.0 | 0.7 | GO:0000145 | exocyst(GO:0000145) |
| 0.0 | 1.8 | GO:0005834 | heterotrimeric G-protein complex(GO:0005834) |
| 0.0 | 0.6 | GO:0000242 | pericentriolar material(GO:0000242) |
| 0.0 | 1.3 | GO:0030964 | mitochondrial respiratory chain complex I(GO:0005747) NADH dehydrogenase complex(GO:0030964) respiratory chain complex I(GO:0045271) |
| 0.0 | 0.6 | GO:0030118 | clathrin coat(GO:0030118) |
| 0.0 | 1.0 | GO:0043198 | dendritic shaft(GO:0043198) |
| 0.0 | 0.8 | GO:0030669 | clathrin-coated endocytic vesicle membrane(GO:0030669) |
| 0.0 | 0.4 | GO:0005682 | U5 snRNP(GO:0005682) |
| 0.0 | 0.9 | GO:0033017 | sarcoplasmic reticulum membrane(GO:0033017) |
| 0.0 | 0.6 | GO:0030057 | desmosome(GO:0030057) |
| 0.0 | 0.5 | GO:0035145 | exon-exon junction complex(GO:0035145) |
| 0.0 | 10.2 | GO:0005759 | mitochondrial matrix(GO:0005759) |
| 0.0 | 0.3 | GO:0016281 | eukaryotic translation initiation factor 4F complex(GO:0016281) |
| 0.0 | 1.6 | GO:0036126 | sperm flagellum(GO:0036126) |
| 0.0 | 0.6 | GO:0031201 | SNARE complex(GO:0031201) |
| 0.0 | 0.4 | GO:0030120 | vesicle coat(GO:0030120) |
| 0.0 | 1.3 | GO:0031463 | Cul3-RING ubiquitin ligase complex(GO:0031463) |
| 0.0 | 4.5 | GO:0001726 | ruffle(GO:0001726) |
| 0.0 | 3.1 | GO:0005802 | trans-Golgi network(GO:0005802) |
| 0.0 | 0.1 | GO:0097149 | centralspindlin complex(GO:0097149) |
Gene overrepresentation in molecular function category:
| Log-likelihood per target | Total log-likelihood | Term | Description |
|---|---|---|---|
| 0.9 | 2.8 | GO:0036505 | prosaposin receptor activity(GO:0036505) |
| 0.7 | 2.7 | GO:0008336 | gamma-butyrobetaine dioxygenase activity(GO:0008336) |
| 0.6 | 4.2 | GO:0004800 | thyroxine 5'-deiodinase activity(GO:0004800) |
| 0.6 | 5.3 | GO:0003872 | 6-phosphofructokinase activity(GO:0003872) |
| 0.4 | 2.1 | GO:0004447 | iodide peroxidase activity(GO:0004447) |
| 0.4 | 1.6 | GO:0061769 | ribosylnicotinamide kinase activity(GO:0050262) ribosylnicotinate kinase activity(GO:0061769) |
| 0.3 | 3.9 | GO:0097157 | pre-mRNA intronic binding(GO:0097157) |
| 0.3 | 2.1 | GO:0004768 | stearoyl-CoA 9-desaturase activity(GO:0004768) acyl-CoA desaturase activity(GO:0016215) |
| 0.3 | 0.8 | GO:0010698 | acetyltransferase activator activity(GO:0010698) |
| 0.3 | 3.3 | GO:0042731 | PH domain binding(GO:0042731) |
| 0.2 | 1.0 | GO:0004146 | dihydrofolate reductase activity(GO:0004146) |
| 0.2 | 2.1 | GO:0003956 | NAD(P)+-protein-arginine ADP-ribosyltransferase activity(GO:0003956) |
| 0.2 | 0.9 | GO:0016716 | oxidoreductase activity, acting on paired donors, with incorporation or reduction of molecular oxygen, another compound as one donor, and incorporation of one atom of oxygen(GO:0016716) |
| 0.2 | 3.0 | GO:0031014 | troponin T binding(GO:0031014) |
| 0.2 | 1.3 | GO:0031708 | endothelin B receptor binding(GO:0031708) |
| 0.2 | 3.1 | GO:0015501 | glutamate:sodium symporter activity(GO:0015501) |
| 0.2 | 5.4 | GO:0086080 | protein binding involved in heterotypic cell-cell adhesion(GO:0086080) |
| 0.2 | 1.8 | GO:0005052 | peroxisome matrix targeting signal-1 binding(GO:0005052) |
| 0.2 | 2.1 | GO:0004689 | phosphorylase kinase activity(GO:0004689) |
| 0.2 | 0.8 | GO:0050508 | glucuronosyl-N-acetylglucosaminyl-proteoglycan 4-alpha-N-acetylglucosaminyltransferase activity(GO:0050508) |
| 0.2 | 2.8 | GO:0015129 | lactate transmembrane transporter activity(GO:0015129) |
| 0.2 | 1.3 | GO:0004743 | pyruvate kinase activity(GO:0004743) |
| 0.2 | 8.2 | GO:0008093 | cytoskeletal adaptor activity(GO:0008093) |
| 0.2 | 0.7 | GO:0050567 | amidase activity(GO:0004040) glutaminyl-tRNA synthase (glutamine-hydrolyzing) activity(GO:0050567) |
| 0.2 | 1.5 | GO:0003873 | 6-phosphofructo-2-kinase activity(GO:0003873) |
| 0.2 | 0.9 | GO:0098519 | nucleotide phosphatase activity, acting on free nucleotides(GO:0098519) |
| 0.2 | 2.8 | GO:0038062 | protein tyrosine kinase collagen receptor activity(GO:0038062) |
| 0.2 | 0.6 | GO:0004773 | steryl-sulfatase activity(GO:0004773) |
| 0.2 | 1.1 | GO:0008273 | calcium, potassium:sodium antiporter activity(GO:0008273) |
| 0.1 | 5.0 | GO:0004029 | aldehyde dehydrogenase (NAD) activity(GO:0004029) |
| 0.1 | 2.8 | GO:0015250 | water channel activity(GO:0015250) |
| 0.1 | 0.6 | GO:0051538 | 3 iron, 4 sulfur cluster binding(GO:0051538) |
| 0.1 | 0.7 | GO:0005006 | epidermal growth factor-activated receptor activity(GO:0005006) |
| 0.1 | 0.4 | GO:0016422 | mRNA (2'-O-methyladenosine-N6-)-methyltransferase activity(GO:0016422) |
| 0.1 | 1.3 | GO:0043813 | phosphatidylinositol-3,5-bisphosphate 5-phosphatase activity(GO:0043813) |
| 0.1 | 1.2 | GO:0042835 | BRE binding(GO:0042835) |
| 0.1 | 1.4 | GO:0004459 | L-lactate dehydrogenase activity(GO:0004459) |
| 0.1 | 3.7 | GO:0050321 | tau-protein kinase activity(GO:0050321) |
| 0.1 | 5.6 | GO:0051010 | microtubule plus-end binding(GO:0051010) |
| 0.1 | 0.4 | GO:0002135 | CTP binding(GO:0002135) |
| 0.1 | 1.9 | GO:0022851 | GABA-gated chloride ion channel activity(GO:0022851) |
| 0.1 | 0.4 | GO:0005415 | nucleoside:sodium symporter activity(GO:0005415) |
| 0.1 | 0.9 | GO:0098821 | BMP receptor activity(GO:0098821) |
| 0.1 | 2.0 | GO:0043024 | ribosomal small subunit binding(GO:0043024) |
| 0.1 | 0.8 | GO:0008379 | thioredoxin peroxidase activity(GO:0008379) |
| 0.1 | 1.6 | GO:0031821 | G-protein coupled serotonin receptor binding(GO:0031821) |
| 0.1 | 0.6 | GO:0004594 | pantothenate kinase activity(GO:0004594) |
| 0.1 | 0.4 | GO:0052591 | sn-glycerol-3-phosphate:ubiquinone oxidoreductase activity(GO:0052590) sn-glycerol-3-phosphate:ubiquinone-8 oxidoreductase activity(GO:0052591) |
| 0.1 | 0.8 | GO:0099583 | neurotransmitter receptor activity involved in regulation of postsynaptic cytosolic calcium ion concentration(GO:0099583) |
| 0.1 | 0.2 | GO:0004850 | uridine phosphorylase activity(GO:0004850) |
| 0.1 | 0.4 | GO:0045485 | omega-6 fatty acid desaturase activity(GO:0045485) |
| 0.1 | 2.5 | GO:0044548 | S100 protein binding(GO:0044548) |
| 0.1 | 0.5 | GO:0016802 | adenosylhomocysteinase activity(GO:0004013) trialkylsulfonium hydrolase activity(GO:0016802) |
| 0.1 | 0.3 | GO:0004995 | tachykinin receptor activity(GO:0004995) |
| 0.1 | 0.6 | GO:0004704 | NF-kappaB-inducing kinase activity(GO:0004704) |
| 0.1 | 0.3 | GO:0042781 | 3'-tRNA processing endoribonuclease activity(GO:0042781) |
| 0.1 | 1.6 | GO:0005523 | tropomyosin binding(GO:0005523) |
| 0.1 | 0.7 | GO:0008158 | hedgehog receptor activity(GO:0008158) |
| 0.1 | 0.6 | GO:0061665 | SUMO ligase activity(GO:0061665) |
| 0.1 | 3.4 | GO:0003785 | actin monomer binding(GO:0003785) |
| 0.1 | 4.9 | GO:0001205 | transcriptional activator activity, RNA polymerase II distal enhancer sequence-specific binding(GO:0001205) |
| 0.1 | 0.8 | GO:0050692 | DBD domain binding(GO:0050692) |
| 0.1 | 0.9 | GO:0046935 | 1-phosphatidylinositol-3-kinase regulator activity(GO:0046935) |
| 0.1 | 0.7 | GO:0008420 | CTD phosphatase activity(GO:0008420) |
| 0.1 | 2.2 | GO:0004550 | nucleoside diphosphate kinase activity(GO:0004550) |
| 0.1 | 1.0 | GO:0052629 | phosphatidylinositol-3,5-bisphosphate 3-phosphatase activity(GO:0052629) |
| 0.1 | 2.0 | GO:0005229 | intracellular calcium activated chloride channel activity(GO:0005229) |
| 0.1 | 0.6 | GO:0005412 | glucose:sodium symporter activity(GO:0005412) |
| 0.1 | 0.6 | GO:0030249 | guanylate cyclase regulator activity(GO:0030249) |
| 0.1 | 1.7 | GO:0031489 | myosin V binding(GO:0031489) |
| 0.1 | 0.4 | GO:0031852 | mu-type opioid receptor binding(GO:0031852) |
| 0.1 | 0.4 | GO:0097603 | temperature-gated ion channel activity(GO:0097603) |
| 0.0 | 0.4 | GO:0070568 | guanylyltransferase activity(GO:0070568) |
| 0.0 | 0.4 | GO:0052796 | exo-alpha-(2->3)-sialidase activity(GO:0052794) exo-alpha-(2->6)-sialidase activity(GO:0052795) exo-alpha-(2->8)-sialidase activity(GO:0052796) |
| 0.0 | 1.9 | GO:0003841 | 1-acylglycerol-3-phosphate O-acyltransferase activity(GO:0003841) |
| 0.0 | 0.5 | GO:0046912 | transferase activity, transferring acyl groups, acyl groups converted into alkyl on transfer(GO:0046912) |
| 0.0 | 0.2 | GO:0004814 | arginine-tRNA ligase activity(GO:0004814) |
| 0.0 | 1.0 | GO:0000150 | recombinase activity(GO:0000150) |
| 0.0 | 0.3 | GO:0008422 | beta-glucosidase activity(GO:0008422) |
| 0.0 | 0.1 | GO:0004618 | phosphoglycerate kinase activity(GO:0004618) |
| 0.0 | 1.3 | GO:0051537 | 2 iron, 2 sulfur cluster binding(GO:0051537) |
| 0.0 | 0.5 | GO:0002161 | aminoacyl-tRNA editing activity(GO:0002161) |
| 0.0 | 0.4 | GO:0016433 | rRNA (adenine) methyltransferase activity(GO:0016433) |
| 0.0 | 1.0 | GO:0004185 | serine-type carboxypeptidase activity(GO:0004185) |
| 0.0 | 0.4 | GO:0004983 | neuropeptide Y receptor activity(GO:0004983) |
| 0.0 | 7.3 | GO:0005262 | calcium channel activity(GO:0005262) |
| 0.0 | 0.4 | GO:0046923 | ER retention sequence binding(GO:0046923) |
| 0.0 | 1.4 | GO:0005092 | GDP-dissociation inhibitor activity(GO:0005092) |
| 0.0 | 0.5 | GO:0047499 | calcium-independent phospholipase A2 activity(GO:0047499) |
| 0.0 | 1.1 | GO:0097109 | neuroligin family protein binding(GO:0097109) |
| 0.0 | 0.8 | GO:0030215 | semaphorin receptor binding(GO:0030215) |
| 0.0 | 0.9 | GO:0002162 | dystroglycan binding(GO:0002162) |
| 0.0 | 0.2 | GO:0030942 | signal recognition particle binding(GO:0005047) endoplasmic reticulum signal peptide binding(GO:0030942) |
| 0.0 | 2.2 | GO:0005547 | phosphatidylinositol-3,4,5-trisphosphate binding(GO:0005547) |
| 0.0 | 0.2 | GO:0016435 | rRNA (guanine) methyltransferase activity(GO:0016435) |
| 0.0 | 3.2 | GO:0004722 | protein serine/threonine phosphatase activity(GO:0004722) |
| 0.0 | 0.8 | GO:0080025 | phosphatidylinositol-3,5-bisphosphate binding(GO:0080025) |
| 0.0 | 0.2 | GO:0004735 | pyrroline-5-carboxylate reductase activity(GO:0004735) |
| 0.0 | 1.4 | GO:0017075 | syntaxin-1 binding(GO:0017075) |
| 0.0 | 0.1 | GO:0004450 | isocitrate dehydrogenase (NADP+) activity(GO:0004450) |
| 0.0 | 0.1 | GO:0071987 | WD40-repeat domain binding(GO:0071987) |
| 0.0 | 1.3 | GO:0008137 | NADH dehydrogenase (ubiquinone) activity(GO:0008137) NADH dehydrogenase (quinone) activity(GO:0050136) |
| 0.0 | 1.0 | GO:0004435 | phosphatidylinositol phospholipase C activity(GO:0004435) |
| 0.0 | 0.3 | GO:0032137 | guanine/thymine mispair binding(GO:0032137) |
| 0.0 | 0.3 | GO:0046976 | histone methyltransferase activity (H3-K27 specific)(GO:0046976) |
| 0.0 | 0.4 | GO:0055106 | ubiquitin-protein transferase regulator activity(GO:0055106) |
| 0.0 | 0.6 | GO:0042043 | neurexin family protein binding(GO:0042043) |
| 0.0 | 0.7 | GO:0031683 | G-protein beta/gamma-subunit complex binding(GO:0031683) |
| 0.0 | 6.1 | GO:0030674 | protein binding, bridging(GO:0030674) |
| 0.0 | 0.2 | GO:0017056 | structural constituent of nuclear pore(GO:0017056) |
| 0.0 | 0.2 | GO:0017040 | ceramidase activity(GO:0017040) |
| 0.0 | 1.7 | GO:0004407 | histone deacetylase activity(GO:0004407) |
| 0.0 | 0.2 | GO:0031419 | cobalamin binding(GO:0031419) |
| 0.0 | 0.3 | GO:0003796 | lysozyme activity(GO:0003796) |
| 0.0 | 1.4 | GO:0017080 | sodium channel regulator activity(GO:0017080) |
| 0.0 | 3.4 | GO:0005089 | Rho guanyl-nucleotide exchange factor activity(GO:0005089) |
| 0.0 | 2.2 | GO:0005179 | hormone activity(GO:0005179) |
| 0.0 | 0.1 | GO:0035612 | AP-2 adaptor complex binding(GO:0035612) |
| 0.0 | 0.8 | GO:0005487 | nucleocytoplasmic transporter activity(GO:0005487) |
| 0.0 | 0.0 | GO:0031628 | opioid receptor binding(GO:0031628) |
| 0.0 | 0.2 | GO:0042834 | peptidoglycan binding(GO:0042834) |
| 0.0 | 0.1 | GO:0004396 | glucokinase activity(GO:0004340) hexokinase activity(GO:0004396) fructokinase activity(GO:0008865) mannokinase activity(GO:0019158) |
| 0.0 | 1.4 | GO:0005201 | extracellular matrix structural constituent(GO:0005201) |
| 0.0 | 8.0 | GO:0004842 | ubiquitin-protein transferase activity(GO:0004842) |
| 0.0 | 2.5 | GO:0017137 | Rab GTPase binding(GO:0017137) |
| 0.0 | 0.5 | GO:0016702 | oxidoreductase activity, acting on single donors with incorporation of molecular oxygen, incorporation of two atoms of oxygen(GO:0016702) |
| 0.0 | 0.0 | GO:0016428 | tRNA (cytosine-5-)-methyltransferase activity(GO:0016428) |
| 0.0 | 0.1 | GO:0016167 | glial cell-derived neurotrophic factor receptor activity(GO:0016167) |
Gene overrepresentation in curated gene sets: canonical pathways category:
| Log-likelihood per target | Total log-likelihood | Term | Description |
|---|---|---|---|
| 0.0 | 1.3 | PID LPA4 PATHWAY | LPA4-mediated signaling events |
| 0.0 | 2.9 | PID ATR PATHWAY | ATR signaling pathway |
| 0.0 | 0.9 | PID S1P S1P4 PATHWAY | S1P4 pathway |
| 0.0 | 3.6 | PID TAP63 PATHWAY | Validated transcriptional targets of TAp63 isoforms |
| 0.0 | 5.3 | PID REG GR PATHWAY | Glucocorticoid receptor regulatory network |
| 0.0 | 1.9 | PID ENDOTHELIN PATHWAY | Endothelins |
| 0.0 | 1.7 | NABA PROTEOGLYCANS | Genes encoding proteoglycans |
| 0.0 | 2.3 | PID FGF PATHWAY | FGF signaling pathway |
| 0.0 | 1.8 | PID PI3K PLC TRK PATHWAY | Trk receptor signaling mediated by PI3K and PLC-gamma |
| 0.0 | 0.6 | PID RANBP2 PATHWAY | Sumoylation by RanBP2 regulates transcriptional repression |
| 0.0 | 1.9 | PID HNF3A PATHWAY | FOXA1 transcription factor network |
| 0.0 | 1.0 | PID IL8 CXCR2 PATHWAY | IL8- and CXCR2-mediated signaling events |
| 0.0 | 0.6 | PID PI3KCI AKT PATHWAY | Class I PI3K signaling events mediated by Akt |
| 0.0 | 1.4 | PID BMP PATHWAY | BMP receptor signaling |
| 0.0 | 0.7 | PID ECADHERIN KERATINOCYTE PATHWAY | E-cadherin signaling in keratinocytes |
| 0.0 | 2.3 | PID MYC ACTIV PATHWAY | Validated targets of C-MYC transcriptional activation |
| 0.0 | 0.8 | PID WNT NONCANONICAL PATHWAY | Noncanonical Wnt signaling pathway |
| 0.0 | 1.3 | PID ERA GENOMIC PATHWAY | Validated nuclear estrogen receptor alpha network |
| 0.0 | 0.5 | PID HEDGEHOG 2PATHWAY | Signaling events mediated by the Hedgehog family |
| 0.0 | 0.7 | ST WNT BETA CATENIN PATHWAY | Wnt/beta-catenin Pathway |
| 0.0 | 0.9 | PID LKB1 PATHWAY | LKB1 signaling events |
| 0.0 | 0.3 | PID P38 MK2 PATHWAY | p38 signaling mediated by MAPKAP kinases |
| 0.0 | 1.0 | PID HES HEY PATHWAY | Notch-mediated HES/HEY network |
| 0.0 | 0.8 | SIG REGULATION OF THE ACTIN CYTOSKELETON BY RHO GTPASES | Genes related to regulation of the actin cytoskeleton |
Gene overrepresentation in curated gene sets: REACTOME pathways category:
| Log-likelihood per target | Total log-likelihood | Term | Description |
|---|---|---|---|
| 0.2 | 6.2 | REACTOME AMINE DERIVED HORMONES | Genes involved in Amine-derived hormones |
| 0.2 | 2.8 | REACTOME PASSIVE TRANSPORT BY AQUAPORINS | Genes involved in Passive Transport by Aquaporins |
| 0.1 | 2.3 | REACTOME SIGNALING BY FGFR3 MUTANTS | Genes involved in Signaling by FGFR3 mutants |
| 0.1 | 7.0 | REACTOME GLYCOLYSIS | Genes involved in Glycolysis |
| 0.1 | 2.3 | REACTOME ADENYLATE CYCLASE INHIBITORY PATHWAY | Genes involved in Adenylate cyclase inhibitory pathway |
| 0.1 | 1.5 | REACTOME NEF MEDIATED DOWNREGULATION OF MHC CLASS I COMPLEX CELL SURFACE EXPRESSION | Genes involved in Nef mediated downregulation of MHC class I complex cell surface expression |
| 0.1 | 2.2 | REACTOME CS DS DEGRADATION | Genes involved in CS/DS degradation |
| 0.1 | 1.1 | REACTOME TRAFFICKING AND PROCESSING OF ENDOSOMAL TLR | Genes involved in Trafficking and processing of endosomal TLR |
| 0.1 | 2.1 | REACTOME GLYCOGEN BREAKDOWN GLYCOGENOLYSIS | Genes involved in Glycogen breakdown (glycogenolysis) |
| 0.1 | 1.0 | REACTOME SYNTHESIS OF PIPS AT THE LATE ENDOSOME MEMBRANE | Genes involved in Synthesis of PIPs at the late endosome membrane |
| 0.0 | 2.7 | REACTOME INTERACTION BETWEEN L1 AND ANKYRINS | Genes involved in Interaction between L1 and Ankyrins |
| 0.0 | 1.8 | REACTOME RNA POL III TRANSCRIPTION TERMINATION | Genes involved in RNA Polymerase III Transcription Termination |
| 0.0 | 1.9 | REACTOME SYNTHESIS OF PA | Genes involved in Synthesis of PA |
| 0.0 | 1.9 | REACTOME GABA A RECEPTOR ACTIVATION | Genes involved in GABA A receptor activation |
| 0.0 | 3.2 | REACTOME SIGNALING BY ROBO RECEPTOR | Genes involved in Signaling by Robo receptor |
| 0.0 | 3.0 | REACTOME STRIATED MUSCLE CONTRACTION | Genes involved in Striated Muscle Contraction |
| 0.0 | 1.6 | REACTOME SMOOTH MUSCLE CONTRACTION | Genes involved in Smooth Muscle Contraction |
| 0.0 | 0.6 | REACTOME THE ACTIVATION OF ARYLSULFATASES | Genes involved in The activation of arylsulfatases |
| 0.0 | 1.7 | REACTOME SIGNALING BY BMP | Genes involved in Signaling by BMP |
| 0.0 | 1.0 | REACTOME NOTCH HLH TRANSCRIPTION PATHWAY | Genes involved in Notch-HLH transcription pathway |
| 0.0 | 1.0 | REACTOME THE ROLE OF NEF IN HIV1 REPLICATION AND DISEASE PATHOGENESIS | Genes involved in The role of Nef in HIV-1 replication and disease pathogenesis |
| 0.0 | 1.4 | REACTOME PYRUVATE METABOLISM | Genes involved in Pyruvate metabolism |
| 0.0 | 1.3 | REACTOME CELL EXTRACELLULAR MATRIX INTERACTIONS | Genes involved in Cell-extracellular matrix interactions |
| 0.0 | 0.8 | REACTOME CLASS C 3 METABOTROPIC GLUTAMATE PHEROMONE RECEPTORS | Genes involved in Class C/3 (Metabotropic glutamate/pheromone receptors) |
| 0.0 | 1.4 | REACTOME TRAFFICKING OF GLUR2 CONTAINING AMPA RECEPTORS | Genes involved in Trafficking of GluR2-containing AMPA receptors |
| 0.0 | 0.8 | REACTOME ABCA TRANSPORTERS IN LIPID HOMEOSTASIS | Genes involved in ABCA transporters in lipid homeostasis |
| 0.0 | 0.8 | REACTOME SYNTHESIS OF GLYCOSYLPHOSPHATIDYLINOSITOL GPI | Genes involved in Synthesis of glycosylphosphatidylinositol (GPI) |
| 0.0 | 0.6 | REACTOME VITAMIN B5 PANTOTHENATE METABOLISM | Genes involved in Vitamin B5 (pantothenate) metabolism |
| 0.0 | 1.4 | REACTOME TRAFFICKING OF AMPA RECEPTORS | Genes involved in Trafficking of AMPA receptors |
| 0.0 | 0.6 | REACTOME CITRIC ACID CYCLE TCA CYCLE | Genes involved in Citric acid cycle (TCA cycle) |
| 0.0 | 0.7 | REACTOME SHC1 EVENTS IN EGFR SIGNALING | Genes involved in SHC1 events in EGFR signaling |
| 0.0 | 2.8 | REACTOME NRAGE SIGNALS DEATH THROUGH JNK | Genes involved in NRAGE signals death through JNK |
| 0.0 | 6.7 | REACTOME METABOLISM OF AMINO ACIDS AND DERIVATIVES | Genes involved in Metabolism of amino acids and derivatives |
| 0.0 | 0.7 | REACTOME INSULIN SYNTHESIS AND PROCESSING | Genes involved in Insulin Synthesis and Processing |
| 0.0 | 1.3 | REACTOME SYNTHESIS OF PIPS AT THE PLASMA MEMBRANE | Genes involved in Synthesis of PIPs at the plasma membrane |
| 0.0 | 0.5 | REACTOME MITOCHONDRIAL TRNA AMINOACYLATION | Genes involved in Mitochondrial tRNA aminoacylation |
| 0.0 | 0.4 | REACTOME THE NLRP3 INFLAMMASOME | Genes involved in The NLRP3 inflammasome |
| 0.0 | 0.4 | REACTOME ALPHA LINOLENIC ACID ALA METABOLISM | Genes involved in alpha-linolenic acid (ALA) metabolism |
| 0.0 | 0.9 | REACTOME ADHERENS JUNCTIONS INTERACTIONS | Genes involved in Adherens junctions interactions |
| 0.0 | 0.2 | REACTOME PYRIMIDINE CATABOLISM | Genes involved in Pyrimidine catabolism |
| 0.0 | 0.7 | REACTOME MRNA 3 END PROCESSING | Genes involved in mRNA 3'-end processing |
| 0.0 | 6.1 | REACTOME GENERIC TRANSCRIPTION PATHWAY | Genes involved in Generic Transcription Pathway |