Project
Illumina Body Map 2 (GSE30611)
Navigation
Downloads
Results for GGAAUGU
Z-value: 2.33
Motif logo

miRNA associated with seed GGAAUGU
| Name | miRBASE accession |
|---|---|
|
hsa-miR-1-3p
|
MIMAT0000416 |
|
hsa-miR-206
|
MIMAT0000462 |
|
hsa-miR-613
|
MIMAT0003281 |
Activity profile of GGAAUGU motif
Sorted Z-values of GGAAUGU motif
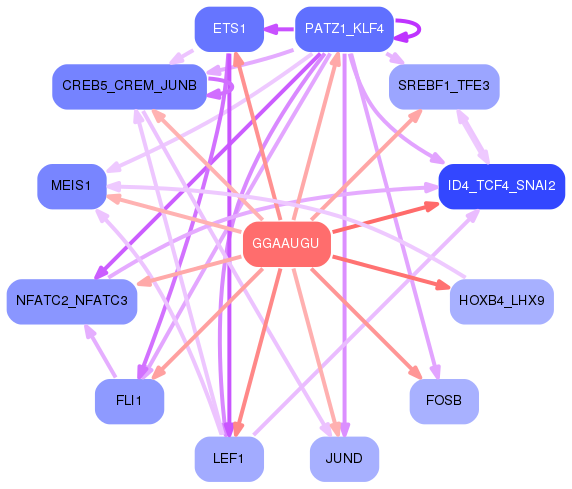
Network of associatons between targets according to the STRING database.

First level regulatory network of GGAAUGU
Gene Ontology Analysis
Gene overrepresentation in biological process category:
| Log-likelihood per target | Total log-likelihood | Term | Description |
|---|---|---|---|
| 2.1 | 6.3 | GO:0005999 | xylulose biosynthetic process(GO:0005999) |
| 1.9 | 7.5 | GO:0019322 | pentose biosynthetic process(GO:0019322) |
| 1.6 | 4.8 | GO:0002581 | negative regulation of antigen processing and presentation of peptide or polysaccharide antigen via MHC class II(GO:0002581) |
| 1.1 | 3.4 | GO:0070563 | negative regulation of vitamin D receptor signaling pathway(GO:0070563) |
| 0.9 | 2.8 | GO:0014034 | neural crest cell fate commitment(GO:0014034) regulation of midbrain dopaminergic neuron differentiation(GO:1904956) |
| 0.8 | 2.4 | GO:0031247 | actin rod assembly(GO:0031247) |
| 0.8 | 2.4 | GO:0061182 | negative regulation of chondrocyte development(GO:0061182) |
| 0.8 | 2.3 | GO:0045041 | B cell cytokine production(GO:0002368) protein import into mitochondrial intermembrane space(GO:0045041) |
| 0.7 | 5.1 | GO:0060979 | vasculogenesis involved in coronary vascular morphogenesis(GO:0060979) |
| 0.7 | 2.9 | GO:1904381 | Golgi apparatus mannose trimming(GO:1904381) |
| 0.7 | 2.1 | GO:0015993 | L-ascorbic acid transport(GO:0015882) molecular hydrogen transport(GO:0015993) transepithelial L-ascorbic acid transport(GO:0070904) |
| 0.7 | 3.4 | GO:1903615 | regulation of protein tyrosine phosphatase activity(GO:1903613) positive regulation of protein tyrosine phosphatase activity(GO:1903615) |
| 0.6 | 2.6 | GO:0010652 | regulation of cell communication by chemical coupling(GO:0010645) positive regulation of cell communication by chemical coupling(GO:0010652) |
| 0.6 | 2.5 | GO:1904761 | negative regulation of myofibroblast differentiation(GO:1904761) |
| 0.5 | 2.2 | GO:1901873 | regulation of post-translational protein modification(GO:1901873) |
| 0.5 | 2.1 | GO:0052214 | multi-organism catabolic process(GO:0044035) development of symbiont involved in interaction with host(GO:0044115) modulation of development of symbiont involved in interaction with host(GO:0044145) negative regulation of development of symbiont involved in interaction with host(GO:0044147) metabolism of substance in other organism involved in symbiotic interaction(GO:0052214) catabolism of substance in other organism involved in symbiotic interaction(GO:0052227) metabolism of macromolecule in other organism involved in symbiotic interaction(GO:0052229) catabolism by host of symbiont macromolecule(GO:0052360) catabolism by organism of macromolecule in other organism involved in symbiotic interaction(GO:0052361) catabolism by host of symbiont protein(GO:0052362) catabolism by organism of protein in other organism involved in symbiotic interaction(GO:0052363) catabolism by host of substance in symbiont(GO:0052364) metabolism by host of symbiont macromolecule(GO:0052416) metabolism by host of symbiont protein(GO:0052417) metabolism by organism of protein in other organism involved in symbiotic interaction(GO:0052418) metabolism by host of substance in symbiont(GO:0052419) |
| 0.5 | 2.1 | GO:1902269 | positive regulation of polyamine transmembrane transport(GO:1902269) |
| 0.5 | 1.5 | GO:0035526 | retrograde transport, plasma membrane to Golgi(GO:0035526) |
| 0.5 | 4.4 | GO:0046726 | positive regulation by virus of viral protein levels in host cell(GO:0046726) |
| 0.5 | 3.3 | GO:0072526 | pyridine-containing compound catabolic process(GO:0072526) |
| 0.5 | 1.8 | GO:2000681 | negative regulation of rubidium ion transport(GO:2000681) negative regulation of rubidium ion transmembrane transporter activity(GO:2000687) |
| 0.4 | 1.8 | GO:1902378 | vestibulocochlear nerve structural organization(GO:0021649) positive regulation of cytokine activity(GO:0060301) ganglion morphogenesis(GO:0061552) VEGF-activated neuropilin signaling pathway involved in axon guidance(GO:1902378) dorsal root ganglion morphogenesis(GO:1904835) otic placode development(GO:1905040) |
| 0.4 | 5.0 | GO:2000483 | negative regulation of interleukin-8 secretion(GO:2000483) |
| 0.4 | 2.4 | GO:0043456 | regulation of pentose-phosphate shunt(GO:0043456) |
| 0.4 | 3.1 | GO:0006620 | posttranslational protein targeting to membrane(GO:0006620) |
| 0.4 | 1.9 | GO:0030047 | actin modification(GO:0030047) |
| 0.4 | 2.3 | GO:1903553 | positive regulation of extracellular exosome assembly(GO:1903553) |
| 0.4 | 1.4 | GO:1902962 | regulation of metalloendopeptidase activity involved in amyloid precursor protein catabolic process(GO:1902962) negative regulation of metalloendopeptidase activity involved in amyloid precursor protein catabolic process(GO:1902963) |
| 0.3 | 2.4 | GO:0061152 | trachea submucosa development(GO:0061152) trachea gland development(GO:0061153) |
| 0.3 | 2.0 | GO:0098746 | fast, calcium ion-dependent exocytosis of neurotransmitter(GO:0098746) |
| 0.3 | 2.0 | GO:0014846 | esophagus smooth muscle contraction(GO:0014846) |
| 0.3 | 1.0 | GO:1990709 | presynaptic active zone organization(GO:1990709) |
| 0.3 | 1.6 | GO:1905224 | clathrin-coated pit assembly(GO:1905224) |
| 0.3 | 1.2 | GO:2000342 | negative regulation of chemokine (C-X-C motif) ligand 2 production(GO:2000342) |
| 0.3 | 1.2 | GO:0045053 | protein retention in Golgi apparatus(GO:0045053) |
| 0.3 | 0.6 | GO:1904204 | regulation of skeletal muscle hypertrophy(GO:1904204) |
| 0.3 | 1.2 | GO:1904017 | cellular response to Thyroglobulin triiodothyronine(GO:1904017) |
| 0.3 | 1.1 | GO:0090285 | negative regulation of protein glycosylation in Golgi(GO:0090285) |
| 0.3 | 2.6 | GO:0097577 | intracellular sequestering of iron ion(GO:0006880) sequestering of iron ion(GO:0097577) |
| 0.3 | 3.9 | GO:0006477 | protein sulfation(GO:0006477) |
| 0.3 | 1.1 | GO:0033037 | polysaccharide localization(GO:0033037) |
| 0.3 | 1.9 | GO:2001166 | regulation of histone H2B ubiquitination(GO:2001166) positive regulation of histone H2B ubiquitination(GO:2001168) |
| 0.3 | 3.2 | GO:0051549 | positive regulation of keratinocyte migration(GO:0051549) |
| 0.3 | 2.1 | GO:0006741 | NADP biosynthetic process(GO:0006741) |
| 0.3 | 0.8 | GO:0060829 | regulation of canonical Wnt signaling pathway involved in neural plate anterior/posterior pattern formation(GO:0060827) negative regulation of canonical Wnt signaling pathway involved in neural plate anterior/posterior pattern formation(GO:0060829) |
| 0.3 | 3.1 | GO:0048539 | bone marrow development(GO:0048539) |
| 0.2 | 1.2 | GO:0046963 | 3'-phosphoadenosine 5'-phosphosulfate transport(GO:0046963) 3'-phospho-5'-adenylyl sulfate transmembrane transport(GO:1902559) |
| 0.2 | 2.2 | GO:0060414 | aorta smooth muscle tissue morphogenesis(GO:0060414) |
| 0.2 | 2.8 | GO:0090168 | Golgi reassembly(GO:0090168) |
| 0.2 | 0.5 | GO:1904684 | negative regulation of metalloendopeptidase activity(GO:1904684) |
| 0.2 | 0.9 | GO:1905045 | Schwann cell proliferation involved in axon regeneration(GO:0014011) negative regulation of Schwann cell migration(GO:1900148) regulation of Schwann cell proliferation involved in axon regeneration(GO:1905044) negative regulation of Schwann cell proliferation involved in axon regeneration(GO:1905045) |
| 0.2 | 0.7 | GO:1901805 | beta-glucoside metabolic process(GO:1901804) beta-glucoside catabolic process(GO:1901805) positive regulation of neuronal action potential(GO:1904457) |
| 0.2 | 0.7 | GO:0098507 | polynucleotide 5' dephosphorylation(GO:0098507) |
| 0.2 | 1.1 | GO:0090341 | negative regulation of secretion of lysosomal enzymes(GO:0090341) |
| 0.2 | 0.9 | GO:0018008 | N-terminal peptidyl-glycine N-myristoylation(GO:0018008) |
| 0.2 | 1.3 | GO:1903588 | negative regulation of blood vessel endothelial cell proliferation involved in sprouting angiogenesis(GO:1903588) |
| 0.2 | 1.3 | GO:0032911 | negative regulation of transforming growth factor beta1 production(GO:0032911) |
| 0.2 | 1.9 | GO:0016191 | synaptic vesicle uncoating(GO:0016191) |
| 0.2 | 0.6 | GO:0021793 | chemorepulsion of branchiomotor axon(GO:0021793) |
| 0.2 | 0.6 | GO:0060382 | release from viral latency(GO:0019046) regulation of DNA strand elongation(GO:0060382) |
| 0.2 | 1.0 | GO:0072369 | regulation of lipid transport by positive regulation of transcription from RNA polymerase II promoter(GO:0072369) |
| 0.2 | 1.6 | GO:1903593 | regulation of histamine secretion by mast cell(GO:1903593) |
| 0.2 | 1.0 | GO:0038098 | sequestering of BMP from receptor via BMP binding(GO:0038098) |
| 0.2 | 2.4 | GO:0010739 | positive regulation of protein kinase A signaling(GO:0010739) |
| 0.2 | 1.2 | GO:0097501 | detoxification of inorganic compound(GO:0061687) stress response to metal ion(GO:0097501) |
| 0.2 | 0.2 | GO:0046619 | optic placode formation involved in camera-type eye formation(GO:0046619) |
| 0.2 | 1.3 | GO:0071896 | protein localization to adherens junction(GO:0071896) |
| 0.2 | 1.7 | GO:0034316 | negative regulation of Arp2/3 complex-mediated actin nucleation(GO:0034316) |
| 0.2 | 0.9 | GO:1904073 | regulation of trophectodermal cell proliferation(GO:1904073) positive regulation of trophectodermal cell proliferation(GO:1904075) |
| 0.2 | 2.8 | GO:1904627 | response to phorbol 13-acetate 12-myristate(GO:1904627) cellular response to phorbol 13-acetate 12-myristate(GO:1904628) |
| 0.2 | 0.6 | GO:0061300 | cerebellum vasculature development(GO:0061300) |
| 0.2 | 2.9 | GO:0043568 | positive regulation of insulin-like growth factor receptor signaling pathway(GO:0043568) |
| 0.2 | 3.6 | GO:0033148 | positive regulation of intracellular estrogen receptor signaling pathway(GO:0033148) |
| 0.2 | 1.6 | GO:0015677 | copper ion import(GO:0015677) cellular response to cisplatin(GO:0072719) |
| 0.2 | 0.9 | GO:0010193 | response to ozone(GO:0010193) |
| 0.2 | 2.4 | GO:0061179 | negative regulation of insulin secretion involved in cellular response to glucose stimulus(GO:0061179) |
| 0.2 | 0.5 | GO:0006864 | pyrimidine nucleotide transport(GO:0006864) mitochondrial pyrimidine nucleotide import(GO:1990519) |
| 0.2 | 2.1 | GO:1904996 | positive regulation of leukocyte adhesion to vascular endothelial cell(GO:1904996) |
| 0.2 | 0.7 | GO:0097534 | lymphoid lineage cell migration(GO:0097534) lymphoid lineage cell migration into thymus(GO:0097535) |
| 0.2 | 0.5 | GO:0002949 | tRNA threonylcarbamoyladenosine modification(GO:0002949) |
| 0.2 | 1.4 | GO:0097491 | sympathetic neuron projection extension(GO:0097490) sympathetic neuron projection guidance(GO:0097491) |
| 0.2 | 1.4 | GO:2000394 | positive regulation of lamellipodium morphogenesis(GO:2000394) |
| 0.2 | 0.6 | GO:0006933 | negative regulation of cell adhesion involved in substrate-bound cell migration(GO:0006933) |
| 0.2 | 1.4 | GO:0070164 | negative regulation of adiponectin secretion(GO:0070164) |
| 0.1 | 2.8 | GO:0036010 | protein localization to endosome(GO:0036010) |
| 0.1 | 0.6 | GO:0015788 | UDP-N-acetylglucosamine transport(GO:0015788) UDP-N-acetylglucosamine transmembrane transport(GO:1990569) |
| 0.1 | 0.9 | GO:0015015 | heparan sulfate proteoglycan biosynthetic process, enzymatic modification(GO:0015015) |
| 0.1 | 1.6 | GO:0010637 | negative regulation of mitochondrial fusion(GO:0010637) |
| 0.1 | 1.4 | GO:0002329 | pre-B cell differentiation(GO:0002329) |
| 0.1 | 0.7 | GO:1900110 | negative regulation of histone H3-K9 dimethylation(GO:1900110) |
| 0.1 | 0.4 | GO:0000350 | generation of catalytic spliceosome for second transesterification step(GO:0000350) |
| 0.1 | 2.4 | GO:0007221 | positive regulation of transcription of Notch receptor target(GO:0007221) |
| 0.1 | 1.4 | GO:1904798 | positive regulation of core promoter binding(GO:1904798) |
| 0.1 | 1.0 | GO:0090649 | response to oxygen-glucose deprivation(GO:0090649) cellular response to oxygen-glucose deprivation(GO:0090650) |
| 0.1 | 1.3 | GO:0038028 | insulin receptor signaling pathway via phosphatidylinositol 3-kinase(GO:0038028) |
| 0.1 | 0.3 | GO:0010512 | negative regulation of phosphatidylinositol biosynthetic process(GO:0010512) |
| 0.1 | 2.0 | GO:0060158 | phospholipase C-activating dopamine receptor signaling pathway(GO:0060158) |
| 0.1 | 1.8 | GO:0036089 | cleavage furrow formation(GO:0036089) |
| 0.1 | 1.2 | GO:0048280 | vesicle fusion with Golgi apparatus(GO:0048280) |
| 0.1 | 1.1 | GO:0042426 | choline catabolic process(GO:0042426) |
| 0.1 | 2.1 | GO:0090161 | Golgi ribbon formation(GO:0090161) |
| 0.1 | 0.6 | GO:2000286 | receptor internalization involved in canonical Wnt signaling pathway(GO:2000286) |
| 0.1 | 1.3 | GO:1901409 | positive regulation of phosphorylation of RNA polymerase II C-terminal domain(GO:1901409) |
| 0.1 | 0.4 | GO:0060018 | astrocyte fate commitment(GO:0060018) |
| 0.1 | 0.6 | GO:0001757 | somite specification(GO:0001757) |
| 0.1 | 2.3 | GO:0032780 | negative regulation of ATPase activity(GO:0032780) |
| 0.1 | 0.4 | GO:1901073 | N-acetylglucosamine biosynthetic process(GO:0006045) glucosamine-containing compound biosynthetic process(GO:1901073) |
| 0.1 | 3.5 | GO:0060008 | Sertoli cell differentiation(GO:0060008) |
| 0.1 | 7.5 | GO:0046949 | fatty-acyl-CoA biosynthetic process(GO:0046949) |
| 0.1 | 1.0 | GO:0010792 | DNA double-strand break processing involved in repair via single-strand annealing(GO:0010792) |
| 0.1 | 1.7 | GO:0098870 | neuronal action potential propagation(GO:0019227) action potential propagation(GO:0098870) |
| 0.1 | 0.9 | GO:0010265 | SCF complex assembly(GO:0010265) |
| 0.1 | 0.6 | GO:1903361 | protein localization to basolateral plasma membrane(GO:1903361) |
| 0.1 | 0.7 | GO:0006543 | glutamine catabolic process(GO:0006543) |
| 0.1 | 1.8 | GO:0060124 | positive regulation of growth hormone secretion(GO:0060124) |
| 0.1 | 0.3 | GO:0034729 | histone H3-K79 methylation(GO:0034729) |
| 0.1 | 0.2 | GO:2000669 | negative regulation of dendritic cell apoptotic process(GO:2000669) |
| 0.1 | 0.6 | GO:0048194 | Golgi vesicle budding(GO:0048194) |
| 0.1 | 3.1 | GO:0036295 | cellular response to increased oxygen levels(GO:0036295) |
| 0.1 | 0.4 | GO:1903971 | mammary gland fat development(GO:0060611) positive regulation of macrophage colony-stimulating factor signaling pathway(GO:1902228) positive regulation of response to macrophage colony-stimulating factor(GO:1903971) positive regulation of cellular response to macrophage colony-stimulating factor stimulus(GO:1903974) positive regulation of microglial cell migration(GO:1904141) |
| 0.1 | 0.5 | GO:0021691 | cerebellar Purkinje cell layer maturation(GO:0021691) |
| 0.1 | 0.3 | GO:1990926 | short-term synaptic potentiation(GO:1990926) |
| 0.1 | 0.7 | GO:0051684 | maintenance of Golgi location(GO:0051684) |
| 0.1 | 0.3 | GO:0016256 | N-glycan processing to lysosome(GO:0016256) |
| 0.1 | 0.5 | GO:0030037 | actin filament reorganization involved in cell cycle(GO:0030037) |
| 0.1 | 0.3 | GO:0006408 | snRNA export from nucleus(GO:0006408) |
| 0.1 | 2.2 | GO:0070734 | histone H3-K27 methylation(GO:0070734) |
| 0.1 | 2.5 | GO:0035855 | megakaryocyte development(GO:0035855) |
| 0.1 | 0.7 | GO:0015712 | hexose phosphate transport(GO:0015712) glucose-6-phosphate transport(GO:0015760) |
| 0.1 | 0.8 | GO:0039663 | fusion of virus membrane with host plasma membrane(GO:0019064) membrane fusion involved in viral entry into host cell(GO:0039663) multi-organism membrane fusion(GO:0044800) |
| 0.1 | 3.2 | GO:0048025 | negative regulation of mRNA splicing, via spliceosome(GO:0048025) |
| 0.1 | 1.4 | GO:0071670 | smooth muscle cell chemotaxis(GO:0071670) |
| 0.1 | 1.3 | GO:0035562 | negative regulation of chromatin binding(GO:0035562) |
| 0.1 | 0.9 | GO:1902019 | regulation of cilium movement involved in cell motility(GO:0060295) regulation of cilium beat frequency involved in ciliary motility(GO:0060296) regulation of cilium-dependent cell motility(GO:1902019) |
| 0.1 | 0.2 | GO:0090365 | regulation of mRNA modification(GO:0090365) |
| 0.1 | 1.8 | GO:0071481 | cellular response to X-ray(GO:0071481) |
| 0.1 | 0.8 | GO:0051451 | myoblast migration(GO:0051451) |
| 0.1 | 2.1 | GO:0030208 | dermatan sulfate biosynthetic process(GO:0030208) |
| 0.1 | 1.2 | GO:0031584 | activation of phospholipase D activity(GO:0031584) |
| 0.1 | 2.6 | GO:0089711 | L-glutamate transmembrane transport(GO:0089711) |
| 0.1 | 1.7 | GO:0071397 | cellular response to cholesterol(GO:0071397) |
| 0.1 | 0.7 | GO:1902730 | regulation of heparan sulfate proteoglycan biosynthetic process(GO:0010908) positive regulation of heparan sulfate proteoglycan biosynthetic process(GO:0010909) positive regulation of proteoglycan biosynthetic process(GO:1902730) |
| 0.1 | 0.4 | GO:1904177 | regulation of adipose tissue development(GO:1904177) positive regulation of adipose tissue development(GO:1904179) |
| 0.1 | 2.4 | GO:0051016 | barbed-end actin filament capping(GO:0051016) |
| 0.1 | 0.9 | GO:0046520 | sphingoid biosynthetic process(GO:0046520) |
| 0.1 | 0.7 | GO:0006857 | oligopeptide transport(GO:0006857) |
| 0.1 | 0.8 | GO:0034498 | early endosome to Golgi transport(GO:0034498) |
| 0.1 | 3.1 | GO:0016601 | Rac protein signal transduction(GO:0016601) |
| 0.1 | 1.2 | GO:0042953 | lipoprotein transport(GO:0042953) lipoprotein localization(GO:0044872) |
| 0.1 | 0.4 | GO:0000395 | mRNA 5'-splice site recognition(GO:0000395) |
| 0.1 | 1.0 | GO:0010839 | negative regulation of keratinocyte proliferation(GO:0010839) |
| 0.1 | 3.1 | GO:0014072 | response to isoquinoline alkaloid(GO:0014072) response to morphine(GO:0043278) |
| 0.1 | 1.3 | GO:0015812 | gamma-aminobutyric acid transport(GO:0015812) |
| 0.1 | 0.4 | GO:0097052 | L-kynurenine metabolic process(GO:0097052) |
| 0.1 | 0.5 | GO:0045647 | negative regulation of erythrocyte differentiation(GO:0045647) |
| 0.1 | 4.1 | GO:0046326 | positive regulation of glucose import(GO:0046326) |
| 0.1 | 0.4 | GO:0009838 | abscission(GO:0009838) |
| 0.0 | 1.7 | GO:0045671 | negative regulation of osteoclast differentiation(GO:0045671) |
| 0.0 | 0.9 | GO:0051923 | sulfation(GO:0051923) |
| 0.0 | 0.7 | GO:0015866 | ADP transport(GO:0015866) |
| 0.0 | 1.4 | GO:0032486 | Rap protein signal transduction(GO:0032486) |
| 0.0 | 0.5 | GO:0097338 | response to clozapine(GO:0097338) |
| 0.0 | 0.5 | GO:0070212 | protein poly-ADP-ribosylation(GO:0070212) |
| 0.0 | 5.6 | GO:0006890 | retrograde vesicle-mediated transport, Golgi to ER(GO:0006890) |
| 0.0 | 0.6 | GO:0042373 | vitamin K metabolic process(GO:0042373) |
| 0.0 | 5.5 | GO:0045454 | cell redox homeostasis(GO:0045454) |
| 0.0 | 3.3 | GO:0002755 | MyD88-dependent toll-like receptor signaling pathway(GO:0002755) |
| 0.0 | 0.6 | GO:0006903 | vesicle targeting(GO:0006903) |
| 0.0 | 0.9 | GO:0051085 | chaperone mediated protein folding requiring cofactor(GO:0051085) |
| 0.0 | 0.4 | GO:0034315 | regulation of Arp2/3 complex-mediated actin nucleation(GO:0034315) |
| 0.0 | 2.4 | GO:0019835 | cytolysis(GO:0019835) |
| 0.0 | 0.7 | GO:0040015 | negative regulation of multicellular organism growth(GO:0040015) |
| 0.0 | 0.6 | GO:0070934 | CRD-mediated mRNA stabilization(GO:0070934) |
| 0.0 | 1.1 | GO:0035518 | histone H2A monoubiquitination(GO:0035518) |
| 0.0 | 1.2 | GO:1901741 | positive regulation of myoblast fusion(GO:1901741) |
| 0.0 | 0.9 | GO:0046827 | positive regulation of protein export from nucleus(GO:0046827) |
| 0.0 | 2.4 | GO:0006611 | protein export from nucleus(GO:0006611) |
| 0.0 | 2.1 | GO:0006735 | NADH regeneration(GO:0006735) canonical glycolysis(GO:0061621) glucose catabolic process to pyruvate(GO:0061718) |
| 0.0 | 0.1 | GO:0016333 | morphogenesis of follicular epithelium(GO:0016333) establishment or maintenance of polarity of follicular epithelium(GO:0016334) establishment of planar polarity of follicular epithelium(GO:0042247) |
| 0.0 | 1.1 | GO:0048240 | sperm capacitation(GO:0048240) |
| 0.0 | 0.5 | GO:0031937 | positive regulation of chromatin silencing(GO:0031937) |
| 0.0 | 2.0 | GO:0006409 | tRNA export from nucleus(GO:0006409) tRNA-containing ribonucleoprotein complex export from nucleus(GO:0071431) |
| 0.0 | 0.2 | GO:0090625 | mRNA cleavage involved in gene silencing by siRNA(GO:0090625) |
| 0.0 | 1.8 | GO:0014037 | Schwann cell differentiation(GO:0014037) |
| 0.0 | 1.8 | GO:0050690 | regulation of defense response to virus by virus(GO:0050690) |
| 0.0 | 1.7 | GO:0071549 | cellular response to dexamethasone stimulus(GO:0071549) |
| 0.0 | 0.5 | GO:0051573 | negative regulation of histone H3-K9 methylation(GO:0051573) |
| 0.0 | 0.5 | GO:0034035 | purine ribonucleoside bisphosphate metabolic process(GO:0034035) 3'-phosphoadenosine 5'-phosphosulfate metabolic process(GO:0050427) |
| 0.0 | 0.4 | GO:0090219 | negative regulation of lipid kinase activity(GO:0090219) |
| 0.0 | 0.6 | GO:0021796 | cerebral cortex regionalization(GO:0021796) |
| 0.0 | 0.2 | GO:0035166 | post-embryonic hemopoiesis(GO:0035166) |
| 0.0 | 0.5 | GO:0018342 | protein prenylation(GO:0018342) prenylation(GO:0097354) |
| 0.0 | 0.1 | GO:0072014 | proximal tubule development(GO:0072014) |
| 0.0 | 0.3 | GO:0030854 | positive regulation of granulocyte differentiation(GO:0030854) |
| 0.0 | 0.2 | GO:0061739 | protein lipidation involved in autophagosome assembly(GO:0061739) |
| 0.0 | 0.7 | GO:0007520 | myoblast fusion(GO:0007520) |
| 0.0 | 1.9 | GO:0007566 | embryo implantation(GO:0007566) |
| 0.0 | 0.5 | GO:0036158 | outer dynein arm assembly(GO:0036158) |
| 0.0 | 0.3 | GO:0045876 | positive regulation of sister chromatid cohesion(GO:0045876) |
| 0.0 | 0.7 | GO:0033599 | regulation of mammary gland epithelial cell proliferation(GO:0033599) |
| 0.0 | 1.1 | GO:1900740 | regulation of protein insertion into mitochondrial membrane involved in apoptotic signaling pathway(GO:1900739) positive regulation of protein insertion into mitochondrial membrane involved in apoptotic signaling pathway(GO:1900740) |
| 0.0 | 1.4 | GO:0009409 | response to cold(GO:0009409) |
| 0.0 | 1.5 | GO:0043171 | peptide catabolic process(GO:0043171) |
| 0.0 | 0.1 | GO:1903385 | regulation of homophilic cell adhesion(GO:1903385) |
| 0.0 | 1.3 | GO:0045670 | regulation of osteoclast differentiation(GO:0045670) |
| 0.0 | 1.3 | GO:0001953 | negative regulation of cell-matrix adhesion(GO:0001953) |
| 0.0 | 0.7 | GO:0032620 | interleukin-17 production(GO:0032620) |
| 0.0 | 0.6 | GO:0034389 | lipid particle organization(GO:0034389) |
| 0.0 | 0.9 | GO:0060325 | face morphogenesis(GO:0060325) |
| 0.0 | 0.4 | GO:0006610 | ribosomal protein import into nucleus(GO:0006610) |
| 0.0 | 0.1 | GO:0035063 | nuclear speck organization(GO:0035063) |
| 0.0 | 1.4 | GO:0046473 | phosphatidic acid metabolic process(GO:0046473) |
| 0.0 | 0.5 | GO:0034656 | nucleobase-containing small molecule catabolic process(GO:0034656) |
| 0.0 | 0.1 | GO:2001271 | negative regulation of cysteine-type endopeptidase activity involved in execution phase of apoptosis(GO:2001271) |
| 0.0 | 0.8 | GO:0043536 | positive regulation of blood vessel endothelial cell migration(GO:0043536) |
| 0.0 | 0.1 | GO:0006621 | protein retention in ER lumen(GO:0006621) maintenance of protein localization in endoplasmic reticulum(GO:0035437) |
| 0.0 | 0.5 | GO:0015991 | ATP hydrolysis coupled proton transport(GO:0015991) |
| 0.0 | 0.4 | GO:0070828 | heterochromatin organization(GO:0070828) |
| 0.0 | 0.1 | GO:0015798 | myo-inositol transport(GO:0015798) |
| 0.0 | 0.1 | GO:1900224 | positive regulation of nodal signaling pathway involved in determination of lateral mesoderm left/right asymmetry(GO:1900224) |
| 0.0 | 0.4 | GO:0006895 | Golgi to endosome transport(GO:0006895) |
| 0.0 | 2.7 | GO:0035335 | peptidyl-tyrosine dephosphorylation(GO:0035335) |
| 0.0 | 3.7 | GO:0006888 | ER to Golgi vesicle-mediated transport(GO:0006888) |
| 0.0 | 2.1 | GO:0038096 | immune response-regulating cell surface receptor signaling pathway involved in phagocytosis(GO:0002433) Fc-gamma receptor signaling pathway involved in phagocytosis(GO:0038096) |
| 0.0 | 0.1 | GO:0034214 | protein hexamerization(GO:0034214) |
| 0.0 | 0.8 | GO:0033344 | cholesterol efflux(GO:0033344) |
| 0.0 | 2.4 | GO:0031623 | receptor internalization(GO:0031623) |
| 0.0 | 0.0 | GO:0036493 | positive regulation of translation in response to endoplasmic reticulum stress(GO:0036493) |
| 0.0 | 0.3 | GO:0006607 | NLS-bearing protein import into nucleus(GO:0006607) |
| 0.0 | 2.2 | GO:0002576 | platelet degranulation(GO:0002576) |
| 0.0 | 0.6 | GO:1901998 | toxin transport(GO:1901998) |
| 0.0 | 0.4 | GO:0034314 | Arp2/3 complex-mediated actin nucleation(GO:0034314) |
| 0.0 | 0.7 | GO:0010470 | regulation of gastrulation(GO:0010470) |
| 0.0 | 1.0 | GO:0071277 | cellular response to calcium ion(GO:0071277) |
| 0.0 | 1.1 | GO:0021766 | hippocampus development(GO:0021766) |
| 0.0 | 0.2 | GO:2000096 | positive regulation of Wnt signaling pathway, planar cell polarity pathway(GO:2000096) |
| 0.0 | 0.6 | GO:0070536 | protein K63-linked deubiquitination(GO:0070536) |
| 0.0 | 1.4 | GO:0006334 | nucleosome assembly(GO:0006334) |
| 0.0 | 0.4 | GO:0061003 | positive regulation of dendritic spine morphogenesis(GO:0061003) |
| 0.0 | 0.5 | GO:0033137 | negative regulation of peptidyl-serine phosphorylation(GO:0033137) |
| 0.0 | 6.7 | GO:0002283 | neutrophil activation involved in immune response(GO:0002283) neutrophil degranulation(GO:0043312) |
| 0.0 | 0.4 | GO:0010863 | positive regulation of phospholipase C activity(GO:0010863) |
Gene overrepresentation in cellular component category:
| Log-likelihood per target | Total log-likelihood | Term | Description |
|---|---|---|---|
| 0.4 | 2.1 | GO:1990667 | PCSK9-AnxA2 complex(GO:1990667) |
| 0.4 | 4.8 | GO:0005577 | fibrinogen complex(GO:0005577) |
| 0.3 | 1.6 | GO:0070044 | synaptobrevin 2-SNAP-25-syntaxin-1a complex(GO:0070044) |
| 0.3 | 2.6 | GO:0097129 | cyclin D2-CDK4 complex(GO:0097129) |
| 0.3 | 4.5 | GO:0042584 | chromaffin granule membrane(GO:0042584) |
| 0.3 | 2.1 | GO:0034673 | inhibin-betaglycan-ActRII complex(GO:0034673) |
| 0.3 | 1.4 | GO:0070381 | endosome to plasma membrane transport vesicle(GO:0070381) |
| 0.3 | 3.8 | GO:0002116 | semaphorin receptor complex(GO:0002116) |
| 0.3 | 3.6 | GO:0033180 | proton-transporting V-type ATPase, V1 domain(GO:0033180) |
| 0.2 | 4.6 | GO:0034663 | endoplasmic reticulum chaperone complex(GO:0034663) |
| 0.2 | 2.3 | GO:0019907 | cyclin-dependent protein kinase activating kinase holoenzyme complex(GO:0019907) |
| 0.2 | 1.7 | GO:0030121 | AP-1 adaptor complex(GO:0030121) |
| 0.2 | 1.3 | GO:0000308 | cytoplasmic cyclin-dependent protein kinase holoenzyme complex(GO:0000308) |
| 0.2 | 2.4 | GO:1990907 | beta-catenin-TCF complex(GO:1990907) |
| 0.2 | 3.3 | GO:0030127 | COPII vesicle coat(GO:0030127) |
| 0.2 | 2.4 | GO:0008290 | F-actin capping protein complex(GO:0008290) |
| 0.1 | 1.5 | GO:0042567 | insulin-like growth factor ternary complex(GO:0042567) |
| 0.1 | 2.5 | GO:0016600 | flotillin complex(GO:0016600) |
| 0.1 | 0.9 | GO:0016272 | prefoldin complex(GO:0016272) |
| 0.1 | 1.0 | GO:0035976 | AP1 complex(GO:0035976) |
| 0.1 | 1.0 | GO:0033503 | HULC complex(GO:0033503) |
| 0.1 | 1.4 | GO:0097550 | transcriptional preinitiation complex(GO:0097550) |
| 0.1 | 2.6 | GO:0005916 | fascia adherens(GO:0005916) |
| 0.1 | 0.8 | GO:0005797 | Golgi medial cisterna(GO:0005797) |
| 0.1 | 1.7 | GO:0033391 | chromatoid body(GO:0033391) |
| 0.1 | 0.3 | GO:0055087 | Ski complex(GO:0055087) |
| 0.1 | 1.1 | GO:0097524 | sperm plasma membrane(GO:0097524) |
| 0.1 | 0.3 | GO:0070032 | synaptobrevin 2-SNAP-25-syntaxin-1a-complexin I complex(GO:0070032) |
| 0.1 | 0.8 | GO:0030905 | retromer, tubulation complex(GO:0030905) |
| 0.1 | 2.1 | GO:0030285 | integral component of synaptic vesicle membrane(GO:0030285) intrinsic component of synaptic vesicle membrane(GO:0098563) |
| 0.1 | 1.0 | GO:0008024 | cyclin/CDK positive transcription elongation factor complex(GO:0008024) |
| 0.1 | 2.4 | GO:0071141 | SMAD protein complex(GO:0071141) |
| 0.1 | 5.5 | GO:0030173 | integral component of Golgi membrane(GO:0030173) |
| 0.1 | 0.7 | GO:0001739 | sex chromatin(GO:0001739) |
| 0.1 | 0.9 | GO:0061673 | mitotic spindle astral microtubule(GO:0061673) |
| 0.1 | 0.9 | GO:0061202 | clathrin-sculpted gamma-aminobutyric acid transport vesicle(GO:0061200) clathrin-sculpted gamma-aminobutyric acid transport vesicle membrane(GO:0061202) |
| 0.1 | 0.2 | GO:0071598 | neuronal ribonucleoprotein granule(GO:0071598) |
| 0.1 | 0.9 | GO:0017059 | serine C-palmitoyltransferase complex(GO:0017059) endoplasmic reticulum palmitoyltransferase complex(GO:0031211) |
| 0.1 | 0.6 | GO:0071014 | post-mRNA release spliceosomal complex(GO:0071014) |
| 0.1 | 2.3 | GO:0000307 | cyclin-dependent protein kinase holoenzyme complex(GO:0000307) |
| 0.1 | 0.7 | GO:0042612 | MHC class I protein complex(GO:0042612) |
| 0.1 | 0.6 | GO:0098559 | cytoplasmic side of early endosome membrane(GO:0098559) |
| 0.1 | 1.6 | GO:0097038 | perinuclear endoplasmic reticulum(GO:0097038) |
| 0.1 | 0.4 | GO:1990682 | CSF1-CSF1R complex(GO:1990682) |
| 0.1 | 4.2 | GO:0002102 | podosome(GO:0002102) |
| 0.1 | 0.2 | GO:0048237 | rough endoplasmic reticulum lumen(GO:0048237) |
| 0.1 | 11.8 | GO:0101002 | ficolin-1-rich granule(GO:0101002) ficolin-1-rich granule lumen(GO:1904813) |
| 0.0 | 2.0 | GO:1990124 | messenger ribonucleoprotein complex(GO:1990124) |
| 0.0 | 0.5 | GO:0036157 | outer dynein arm(GO:0036157) |
| 0.0 | 0.6 | GO:0005862 | muscle thin filament tropomyosin(GO:0005862) |
| 0.0 | 0.9 | GO:0000812 | Swr1 complex(GO:0000812) |
| 0.0 | 1.0 | GO:0005652 | nuclear lamina(GO:0005652) |
| 0.0 | 1.0 | GO:0042622 | photoreceptor outer segment membrane(GO:0042622) |
| 0.0 | 1.7 | GO:0043194 | axon initial segment(GO:0043194) |
| 0.0 | 0.4 | GO:0005885 | Arp2/3 protein complex(GO:0005885) |
| 0.0 | 3.4 | GO:0031519 | PcG protein complex(GO:0031519) |
| 0.0 | 5.0 | GO:0005811 | lipid particle(GO:0005811) |
| 0.0 | 9.2 | GO:0030176 | integral component of endoplasmic reticulum membrane(GO:0030176) |
| 0.0 | 0.8 | GO:0097025 | MPP7-DLG1-LIN7 complex(GO:0097025) |
| 0.0 | 1.2 | GO:0005719 | nuclear euchromatin(GO:0005719) |
| 0.0 | 1.3 | GO:0031235 | intrinsic component of the cytoplasmic side of the plasma membrane(GO:0031235) |
| 0.0 | 0.5 | GO:0030126 | COPI vesicle coat(GO:0030126) |
| 0.0 | 4.6 | GO:0032580 | Golgi cisterna membrane(GO:0032580) |
| 0.0 | 1.0 | GO:0097431 | mitotic spindle pole(GO:0097431) |
| 0.0 | 3.1 | GO:0033116 | endoplasmic reticulum-Golgi intermediate compartment membrane(GO:0033116) |
| 0.0 | 4.3 | GO:0032432 | actin filament bundle(GO:0032432) |
| 0.0 | 0.6 | GO:0070937 | CRD-mediated mRNA stability complex(GO:0070937) |
| 0.0 | 1.6 | GO:0031527 | filopodium membrane(GO:0031527) |
| 0.0 | 3.9 | GO:0035578 | azurophil granule lumen(GO:0035578) |
| 0.0 | 7.0 | GO:0042579 | peroxisome(GO:0005777) microbody(GO:0042579) |
| 0.0 | 2.7 | GO:0031093 | platelet alpha granule lumen(GO:0031093) |
| 0.0 | 1.0 | GO:0046540 | U4/U6 x U5 tri-snRNP complex(GO:0046540) |
| 0.0 | 1.4 | GO:0097228 | sperm principal piece(GO:0097228) |
| 0.0 | 1.2 | GO:0035869 | ciliary transition zone(GO:0035869) |
| 0.0 | 0.4 | GO:0031209 | SCAR complex(GO:0031209) |
| 0.0 | 0.6 | GO:0043220 | Schmidt-Lanterman incisure(GO:0043220) |
| 0.0 | 2.0 | GO:0005834 | heterotrimeric G-protein complex(GO:0005834) |
| 0.0 | 3.0 | GO:0043657 | host(GO:0018995) host cell(GO:0043657) |
| 0.0 | 5.1 | GO:0032587 | ruffle membrane(GO:0032587) |
| 0.0 | 0.3 | GO:0032541 | cortical endoplasmic reticulum(GO:0032541) |
| 0.0 | 1.3 | GO:0031941 | filamentous actin(GO:0031941) |
| 0.0 | 0.8 | GO:0031083 | BLOC-1 complex(GO:0031083) |
| 0.0 | 1.9 | GO:0030670 | phagocytic vesicle membrane(GO:0030670) |
| 0.0 | 3.8 | GO:0019898 | extrinsic component of membrane(GO:0019898) |
| 0.0 | 2.5 | GO:0031463 | Cul3-RING ubiquitin ligase complex(GO:0031463) |
| 0.0 | 5.3 | GO:0009898 | cytoplasmic side of plasma membrane(GO:0009898) |
| 0.0 | 2.0 | GO:0005795 | Golgi stack(GO:0005795) |
| 0.0 | 14.9 | GO:0005925 | focal adhesion(GO:0005925) |
| 0.0 | 2.4 | GO:0005901 | caveola(GO:0005901) |
| 0.0 | 1.0 | GO:0009925 | basal plasma membrane(GO:0009925) |
| 0.0 | 0.5 | GO:0031089 | platelet dense granule lumen(GO:0031089) |
| 0.0 | 0.5 | GO:0005952 | cAMP-dependent protein kinase complex(GO:0005952) |
| 0.0 | 1.0 | GO:0035861 | site of double-strand break(GO:0035861) |
| 0.0 | 0.1 | GO:0002947 | tumor necrosis factor receptor superfamily complex(GO:0002947) |
| 0.0 | 5.0 | GO:0005770 | late endosome(GO:0005770) |
| 0.0 | 0.2 | GO:0042382 | paraspeckles(GO:0042382) |
| 0.0 | 0.2 | GO:0035068 | micro-ribonucleoprotein complex(GO:0035068) |
| 0.0 | 0.4 | GO:0000786 | nucleosome(GO:0000786) |
| 0.0 | 17.3 | GO:0005789 | endoplasmic reticulum membrane(GO:0005789) |
| 0.0 | 12.8 | GO:0000139 | Golgi membrane(GO:0000139) |
| 0.0 | 0.6 | GO:0030669 | clathrin-coated endocytic vesicle membrane(GO:0030669) |
| 0.0 | 5.0 | GO:0045177 | apical part of cell(GO:0045177) |
| 0.0 | 0.4 | GO:0035145 | exon-exon junction complex(GO:0035145) |
Gene overrepresentation in molecular function category:
| Log-likelihood per target | Total log-likelihood | Term | Description |
|---|---|---|---|
| 1.3 | 6.3 | GO:0004802 | transketolase activity(GO:0004802) |
| 1.1 | 4.5 | GO:0004345 | glucose-6-phosphate dehydrogenase activity(GO:0004345) |
| 1.0 | 5.0 | GO:0070052 | collagen V binding(GO:0070052) |
| 0.9 | 6.4 | GO:0016215 | stearoyl-CoA 9-desaturase activity(GO:0004768) acyl-CoA desaturase activity(GO:0016215) |
| 0.8 | 3.3 | GO:0002060 | purine nucleobase binding(GO:0002060) |
| 0.8 | 2.3 | GO:0005137 | interleukin-5 receptor binding(GO:0005137) |
| 0.7 | 2.1 | GO:0070890 | L-ascorbate:sodium symporter activity(GO:0008520) L-ascorbic acid transporter activity(GO:0015229) sodium-dependent L-ascorbate transmembrane transporter activity(GO:0070890) |
| 0.7 | 2.1 | GO:0070123 | transforming growth factor beta receptor activity, type III(GO:0070123) |
| 0.6 | 4.4 | GO:0102344 | 3-hydroxy-behenoyl-CoA dehydratase activity(GO:0102344) 3-hydroxy-lignoceroyl-CoA dehydratase activity(GO:0102345) |
| 0.6 | 2.4 | GO:0004420 | hydroxymethylglutaryl-CoA reductase (NADPH) activity(GO:0004420) hydroxymethylglutaryl-CoA reductase activity(GO:0042282) |
| 0.6 | 3.0 | GO:0005173 | stem cell factor receptor binding(GO:0005173) |
| 0.6 | 2.9 | GO:0004616 | phosphogluconate dehydrogenase (decarboxylating) activity(GO:0004616) |
| 0.5 | 3.2 | GO:0047696 | beta-adrenergic receptor kinase activity(GO:0047696) |
| 0.5 | 2.0 | GO:0031826 | type 2A serotonin receptor binding(GO:0031826) |
| 0.5 | 2.4 | GO:0004082 | bisphosphoglycerate mutase activity(GO:0004082) phosphoglycerate mutase activity(GO:0004619) 2,3-bisphosphoglycerate-dependent phosphoglycerate mutase activity(GO:0046538) |
| 0.4 | 2.1 | GO:0047757 | chondroitin-glucuronate 5-epimerase activity(GO:0047757) |
| 0.4 | 2.4 | GO:0034186 | apolipoprotein A-I binding(GO:0034186) |
| 0.4 | 1.2 | GO:0033142 | progesterone receptor binding(GO:0033142) |
| 0.3 | 2.9 | GO:0004571 | mannosyl-oligosaccharide 1,2-alpha-mannosidase activity(GO:0004571) |
| 0.3 | 2.6 | GO:0086075 | gap junction channel activity involved in cardiac conduction electrical coupling(GO:0086075) |
| 0.3 | 2.1 | GO:0042978 | ornithine decarboxylase activator activity(GO:0042978) |
| 0.3 | 2.3 | GO:0035500 | MH2 domain binding(GO:0035500) |
| 0.2 | 2.0 | GO:0051032 | nucleic acid transmembrane transporter activity(GO:0051032) RNA transmembrane transporter activity(GO:0051033) |
| 0.2 | 1.2 | GO:0046964 | 3'-phosphoadenosine 5'-phosphosulfate transmembrane transporter activity(GO:0046964) |
| 0.2 | 1.0 | GO:0098770 | FBXO family protein binding(GO:0098770) |
| 0.2 | 3.5 | GO:0031995 | insulin-like growth factor II binding(GO:0031995) |
| 0.2 | 2.6 | GO:0005280 | hydrogen:amino acid symporter activity(GO:0005280) |
| 0.2 | 2.1 | GO:0019834 | phospholipase A2 inhibitor activity(GO:0019834) |
| 0.2 | 0.7 | GO:0004651 | polynucleotide 5'-phosphatase activity(GO:0004651) |
| 0.2 | 2.2 | GO:0004687 | myosin light chain kinase activity(GO:0004687) |
| 0.2 | 0.9 | GO:0019107 | glycylpeptide N-tetradecanoyltransferase activity(GO:0004379) myristoyltransferase activity(GO:0019107) |
| 0.2 | 2.0 | GO:0008449 | N-acetylglucosamine-6-sulfatase activity(GO:0008449) |
| 0.2 | 1.2 | GO:0001010 | transcription factor activity, sequence-specific DNA binding transcription factor recruiting(GO:0001010) |
| 0.2 | 3.2 | GO:0005021 | vascular endothelial growth factor-activated receptor activity(GO:0005021) |
| 0.2 | 2.0 | GO:0030348 | syntaxin-3 binding(GO:0030348) |
| 0.2 | 0.9 | GO:0050510 | N-acetylgalactosaminyl-proteoglycan 3-beta-glucuronosyltransferase activity(GO:0050510) |
| 0.2 | 1.8 | GO:0031013 | troponin I binding(GO:0031013) |
| 0.2 | 1.3 | GO:0050119 | N-acetylglucosamine deacetylase activity(GO:0050119) |
| 0.2 | 0.5 | GO:0015218 | pyrimidine nucleotide transmembrane transporter activity(GO:0015218) |
| 0.2 | 0.5 | GO:0008441 | 3'(2'),5'-bisphosphate nucleotidase activity(GO:0008441) |
| 0.2 | 1.1 | GO:0050659 | N-acetylgalactosamine 4-sulfate 6-O-sulfotransferase activity(GO:0050659) |
| 0.2 | 2.2 | GO:0046976 | histone methyltransferase activity (H3-K27 specific)(GO:0046976) |
| 0.2 | 1.1 | GO:0030144 | alpha-1,6-mannosylglycoprotein 6-beta-N-acetylglucosaminyltransferase activity(GO:0030144) |
| 0.2 | 0.5 | GO:0047750 | cholestenol delta-isomerase activity(GO:0047750) |
| 0.2 | 0.8 | GO:1990460 | leptin receptor binding(GO:1990460) |
| 0.1 | 2.4 | GO:0030284 | estrogen receptor activity(GO:0030284) |
| 0.1 | 0.7 | GO:0004995 | tachykinin receptor activity(GO:0004995) |
| 0.1 | 0.6 | GO:0005462 | UDP-N-acetylglucosamine transmembrane transporter activity(GO:0005462) |
| 0.1 | 1.1 | GO:0032810 | sterol response element binding(GO:0032810) |
| 0.1 | 0.7 | GO:0004348 | glucosylceramidase activity(GO:0004348) |
| 0.1 | 0.4 | GO:0047315 | kynurenine-glyoxylate transaminase activity(GO:0047315) |
| 0.1 | 1.2 | GO:0015220 | choline transmembrane transporter activity(GO:0015220) |
| 0.1 | 2.0 | GO:0046790 | virion binding(GO:0046790) |
| 0.1 | 1.3 | GO:0005332 | gamma-aminobutyric acid:sodium symporter activity(GO:0005332) gamma-aminobutyric acid transmembrane transporter activity(GO:0015185) |
| 0.1 | 0.9 | GO:0008467 | [heparan sulfate]-glucosamine 3-sulfotransferase 1 activity(GO:0008467) |
| 0.1 | 0.7 | GO:0061513 | hexose phosphate transmembrane transporter activity(GO:0015119) organophosphate:inorganic phosphate antiporter activity(GO:0015315) hexose-phosphate:inorganic phosphate antiporter activity(GO:0015526) glucose 6-phosphate:inorganic phosphate antiporter activity(GO:0061513) |
| 0.1 | 1.6 | GO:0005375 | copper ion transmembrane transporter activity(GO:0005375) |
| 0.1 | 0.4 | GO:0090541 | MIT domain binding(GO:0090541) |
| 0.1 | 0.6 | GO:0097016 | L27 domain binding(GO:0097016) |
| 0.1 | 3.1 | GO:0042813 | Wnt-activated receptor activity(GO:0042813) |
| 0.1 | 1.1 | GO:0017040 | ceramidase activity(GO:0017040) |
| 0.1 | 2.7 | GO:0030215 | semaphorin receptor binding(GO:0030215) |
| 0.1 | 0.9 | GO:0004758 | serine C-palmitoyltransferase activity(GO:0004758) C-palmitoyltransferase activity(GO:0016454) |
| 0.1 | 2.4 | GO:0008179 | adenylate cyclase binding(GO:0008179) |
| 0.1 | 0.7 | GO:0015333 | peptide:proton symporter activity(GO:0015333) proton-dependent peptide secondary active transmembrane transporter activity(GO:0022897) |
| 0.1 | 1.7 | GO:0071933 | Arp2/3 complex binding(GO:0071933) |
| 0.1 | 5.7 | GO:0005484 | SNAP receptor activity(GO:0005484) |
| 0.1 | 4.6 | GO:0005385 | zinc ion transmembrane transporter activity(GO:0005385) |
| 0.1 | 0.3 | GO:0005046 | KDEL sequence binding(GO:0005046) |
| 0.1 | 1.1 | GO:0005172 | vascular endothelial growth factor receptor binding(GO:0005172) |
| 0.1 | 0.6 | GO:0047057 | oxidoreductase activity, acting on the CH-OH group of donors, disulfide as acceptor(GO:0016900) vitamin-K-epoxide reductase (warfarin-sensitive) activity(GO:0047057) |
| 0.1 | 0.5 | GO:0030375 | thyroid hormone receptor activator activity(GO:0010861) thyroid hormone receptor coactivator activity(GO:0030375) mediator complex binding(GO:0036033) |
| 0.1 | 1.4 | GO:0032050 | clathrin heavy chain binding(GO:0032050) |
| 0.1 | 0.7 | GO:0004359 | glutaminase activity(GO:0004359) |
| 0.1 | 1.2 | GO:0102337 | fatty acid elongase activity(GO:0009922) 3-oxo-arachidoyl-CoA synthase activity(GO:0102336) 3-oxo-cerotoyl-CoA synthase activity(GO:0102337) 3-oxo-lignoceronyl-CoA synthase activity(GO:0102338) |
| 0.1 | 2.7 | GO:0046961 | ATPase activity, coupled to transmembrane movement of ions, rotational mechanism(GO:0044769) proton-transporting ATPase activity, rotational mechanism(GO:0046961) |
| 0.1 | 1.0 | GO:0016015 | morphogen activity(GO:0016015) |
| 0.1 | 1.0 | GO:0005168 | neurotrophin TRKA receptor binding(GO:0005168) |
| 0.1 | 3.4 | GO:0080025 | phosphatidylinositol-3,5-bisphosphate binding(GO:0080025) |
| 0.1 | 2.4 | GO:0031005 | filamin binding(GO:0031005) |
| 0.1 | 4.9 | GO:0008536 | Ran GTPase binding(GO:0008536) |
| 0.1 | 1.0 | GO:0097322 | 7SK snRNA binding(GO:0097322) |
| 0.1 | 2.4 | GO:0070273 | phosphatidylinositol-4-phosphate binding(GO:0070273) |
| 0.1 | 2.1 | GO:0003756 | protein disulfide isomerase activity(GO:0003756) intramolecular oxidoreductase activity, transposing S-S bonds(GO:0016864) |
| 0.1 | 0.9 | GO:0000340 | RNA 7-methylguanosine cap binding(GO:0000340) |
| 0.1 | 1.6 | GO:0005522 | profilin binding(GO:0005522) |
| 0.1 | 3.9 | GO:0003785 | actin monomer binding(GO:0003785) |
| 0.1 | 0.3 | GO:0003976 | UDP-N-acetylglucosamine-lysosomal-enzyme N-acetylglucosaminephosphotransferase activity(GO:0003976) |
| 0.1 | 1.5 | GO:0004859 | phospholipase inhibitor activity(GO:0004859) |
| 0.1 | 1.7 | GO:0086080 | protein binding involved in heterotypic cell-cell adhesion(GO:0086080) |
| 0.1 | 0.8 | GO:0032027 | myosin light chain binding(GO:0032027) |
| 0.1 | 3.0 | GO:0004709 | MAP kinase kinase kinase activity(GO:0004709) |
| 0.1 | 0.9 | GO:0050291 | sphingosine N-acyltransferase activity(GO:0050291) |
| 0.1 | 2.3 | GO:0098641 | cadherin binding involved in cell-cell adhesion(GO:0098641) |
| 0.1 | 2.3 | GO:0017025 | TBP-class protein binding(GO:0017025) |
| 0.1 | 0.9 | GO:0043008 | ATP-dependent protein binding(GO:0043008) |
| 0.1 | 1.1 | GO:0047372 | acylglycerol lipase activity(GO:0047372) |
| 0.1 | 2.4 | GO:0005001 | transmembrane receptor protein tyrosine phosphatase activity(GO:0005001) transmembrane receptor protein phosphatase activity(GO:0019198) |
| 0.1 | 0.4 | GO:0005157 | macrophage colony-stimulating factor receptor binding(GO:0005157) |
| 0.1 | 2.6 | GO:0004198 | calcium-dependent cysteine-type endopeptidase activity(GO:0004198) |
| 0.1 | 1.0 | GO:0036312 | phosphatidylinositol 3-kinase regulatory subunit binding(GO:0036312) |
| 0.1 | 1.7 | GO:0005112 | Notch binding(GO:0005112) |
| 0.1 | 0.8 | GO:1990825 | sequence-specific mRNA binding(GO:1990825) |
| 0.1 | 0.8 | GO:0004726 | non-membrane spanning protein tyrosine phosphatase activity(GO:0004726) |
| 0.1 | 0.2 | GO:0004782 | sulfinoalanine decarboxylase activity(GO:0004782) |
| 0.0 | 2.1 | GO:0016538 | cyclin-dependent protein serine/threonine kinase regulator activity(GO:0016538) |
| 0.0 | 0.4 | GO:0050733 | RS domain binding(GO:0050733) |
| 0.0 | 0.7 | GO:0005346 | adenine nucleotide transmembrane transporter activity(GO:0000295) purine ribonucleotide transmembrane transporter activity(GO:0005346) ATP transmembrane transporter activity(GO:0005347) ADP transmembrane transporter activity(GO:0015217) |
| 0.0 | 1.5 | GO:0070006 | metalloaminopeptidase activity(GO:0070006) |
| 0.0 | 1.0 | GO:0009931 | calcium-dependent protein serine/threonine kinase activity(GO:0009931) |
| 0.0 | 0.4 | GO:0055102 | lipase binding(GO:0035473) lipase inhibitor activity(GO:0055102) |
| 0.0 | 1.1 | GO:0015467 | G-protein activated inward rectifier potassium channel activity(GO:0015467) |
| 0.0 | 0.3 | GO:0004597 | peptide-aspartate beta-dioxygenase activity(GO:0004597) |
| 0.0 | 0.6 | GO:0017154 | semaphorin receptor activity(GO:0017154) |
| 0.0 | 0.7 | GO:0032393 | MHC class I receptor activity(GO:0032393) |
| 0.0 | 1.0 | GO:0017049 | GTP-Rho binding(GO:0017049) |
| 0.0 | 0.8 | GO:0005225 | volume-sensitive anion channel activity(GO:0005225) |
| 0.0 | 0.5 | GO:0008318 | protein prenyltransferase activity(GO:0008318) |
| 0.0 | 3.3 | GO:0070063 | RNA polymerase binding(GO:0070063) |
| 0.0 | 4.5 | GO:0048365 | Rac GTPase binding(GO:0048365) |
| 0.0 | 0.7 | GO:0048406 | nerve growth factor binding(GO:0048406) |
| 0.0 | 3.2 | GO:0005544 | calcium-dependent phospholipid binding(GO:0005544) |
| 0.0 | 1.6 | GO:0015248 | sterol transporter activity(GO:0015248) |
| 0.0 | 2.7 | GO:0008146 | sulfotransferase activity(GO:0008146) |
| 0.0 | 0.5 | GO:0045504 | dynein heavy chain binding(GO:0045504) |
| 0.0 | 1.0 | GO:0042043 | neurexin family protein binding(GO:0042043) |
| 0.0 | 1.5 | GO:0003951 | NAD+ kinase activity(GO:0003951) |
| 0.0 | 0.7 | GO:0019870 | potassium channel inhibitor activity(GO:0019870) |
| 0.0 | 0.7 | GO:0001164 | RNA polymerase I regulatory region DNA binding(GO:0001013) RNA polymerase I regulatory region sequence-specific DNA binding(GO:0001163) RNA polymerase I CORE element sequence-specific DNA binding(GO:0001164) |
| 0.0 | 0.4 | GO:0008430 | selenium binding(GO:0008430) |
| 0.0 | 0.2 | GO:0030628 | pre-mRNA 3'-splice site binding(GO:0030628) |
| 0.0 | 0.8 | GO:0004653 | polypeptide N-acetylgalactosaminyltransferase activity(GO:0004653) |
| 0.0 | 5.5 | GO:0003697 | single-stranded DNA binding(GO:0003697) |
| 0.0 | 0.1 | GO:0035939 | microsatellite binding(GO:0035939) |
| 0.0 | 7.3 | GO:0001078 | transcriptional repressor activity, RNA polymerase II core promoter proximal region sequence-specific binding(GO:0001078) |
| 0.0 | 0.2 | GO:0031708 | endothelin B receptor binding(GO:0031708) |
| 0.0 | 1.2 | GO:0071889 | 14-3-3 protein binding(GO:0071889) |
| 0.0 | 0.7 | GO:0003993 | acid phosphatase activity(GO:0003993) |
| 0.0 | 0.5 | GO:0061578 | Lys63-specific deubiquitinase activity(GO:0061578) |
| 0.0 | 0.5 | GO:0031702 | type 1 angiotensin receptor binding(GO:0031702) |
| 0.0 | 2.8 | GO:0003727 | single-stranded RNA binding(GO:0003727) |
| 0.0 | 0.1 | GO:0051765 | inositol tetrakisphosphate kinase activity(GO:0051765) |
| 0.0 | 1.2 | GO:0005086 | ARF guanyl-nucleotide exchange factor activity(GO:0005086) |
| 0.0 | 13.1 | GO:0045296 | cadherin binding(GO:0045296) |
| 0.0 | 1.3 | GO:0004693 | cyclin-dependent protein serine/threonine kinase activity(GO:0004693) |
| 0.0 | 0.6 | GO:0004697 | protein kinase C activity(GO:0004697) |
| 0.0 | 2.8 | GO:0008565 | protein transporter activity(GO:0008565) |
| 0.0 | 0.5 | GO:0035925 | mRNA 3'-UTR AU-rich region binding(GO:0035925) |
| 0.0 | 0.9 | GO:0005159 | insulin-like growth factor receptor binding(GO:0005159) |
| 0.0 | 0.5 | GO:0008191 | metalloendopeptidase inhibitor activity(GO:0008191) |
| 0.0 | 0.2 | GO:0000774 | adenyl-nucleotide exchange factor activity(GO:0000774) |
| 0.0 | 0.3 | GO:0048407 | platelet-derived growth factor binding(GO:0048407) |
| 0.0 | 2.4 | GO:0051087 | chaperone binding(GO:0051087) |
| 0.0 | 0.5 | GO:0004691 | cAMP-dependent protein kinase activity(GO:0004691) |
| 0.0 | 0.2 | GO:0015279 | store-operated calcium channel activity(GO:0015279) |
| 0.0 | 0.6 | GO:0070034 | telomerase RNA binding(GO:0070034) |
| 0.0 | 0.2 | GO:0008190 | eukaryotic initiation factor 4E binding(GO:0008190) |
| 0.0 | 0.7 | GO:0008327 | methyl-CpG binding(GO:0008327) |
| 0.0 | 0.6 | GO:0051721 | protein phosphatase 2A binding(GO:0051721) |
| 0.0 | 0.3 | GO:0015643 | toxic substance binding(GO:0015643) |
| 0.0 | 0.2 | GO:0032036 | myosin heavy chain binding(GO:0032036) |
| 0.0 | 0.2 | GO:0097157 | pre-mRNA intronic binding(GO:0097157) |
| 0.0 | 3.2 | GO:0005200 | structural constituent of cytoskeleton(GO:0005200) |
| 0.0 | 2.7 | GO:0005089 | Rho guanyl-nucleotide exchange factor activity(GO:0005089) |
| 0.0 | 0.2 | GO:0042577 | lipid phosphatase activity(GO:0042577) |
| 0.0 | 0.6 | GO:0046966 | thyroid hormone receptor binding(GO:0046966) |
| 0.0 | 7.1 | GO:0000978 | RNA polymerase II core promoter proximal region sequence-specific DNA binding(GO:0000978) |
| 0.0 | 4.9 | GO:0003924 | GTPase activity(GO:0003924) |
| 0.0 | 1.4 | GO:0003777 | microtubule motor activity(GO:0003777) |
| 0.0 | 1.0 | GO:0019905 | syntaxin binding(GO:0019905) |
| 0.0 | 2.0 | GO:0005178 | integrin binding(GO:0005178) |
| 0.0 | 0.9 | GO:0019212 | phosphatase inhibitor activity(GO:0019212) |
| 0.0 | 2.3 | GO:0017124 | SH3 domain binding(GO:0017124) |
| 0.0 | 0.4 | GO:0031491 | nucleosome binding(GO:0031491) |
| 0.0 | 0.5 | GO:0000049 | tRNA binding(GO:0000049) |
Gene overrepresentation in curated gene sets: canonical pathways category:
| Log-likelihood per target | Total log-likelihood | Term | Description |
|---|---|---|---|
| 0.2 | 3.0 | PID VEGF VEGFR PATHWAY | VEGF and VEGFR signaling network |
| 0.1 | 4.0 | PID TCR JNK PATHWAY | JNK signaling in the CD4+ TCR pathway |
| 0.1 | 2.0 | ST PAC1 RECEPTOR PATHWAY | PAC1 Receptor Pathway |
| 0.1 | 4.7 | SA G1 AND S PHASES | Cdk2, 4, and 6 bind cyclin D in G1, while cdk2/cyclin E promotes the G1/S transition. |
| 0.1 | 8.3 | PID SYNDECAN 4 PATHWAY | Syndecan-4-mediated signaling events |
| 0.1 | 0.7 | SA TRKA RECEPTOR | The TrkA receptor binds nerve growth factor to activate MAP kinase pathways and promote cell growth. |
| 0.1 | 4.4 | PID VEGFR1 PATHWAY | VEGFR1 specific signals |
| 0.1 | 6.1 | PID INSULIN GLUCOSE PATHWAY | Insulin-mediated glucose transport |
| 0.1 | 3.4 | PID WNT SIGNALING PATHWAY | Wnt signaling network |
| 0.1 | 5.7 | ST P38 MAPK PATHWAY | p38 MAPK Pathway |
| 0.1 | 5.3 | ST WNT BETA CATENIN PATHWAY | Wnt/beta-catenin Pathway |
| 0.1 | 2.8 | PID IL2 STAT5 PATHWAY | IL2 signaling events mediated by STAT5 |
| 0.1 | 6.4 | PID KIT PATHWAY | Signaling events mediated by Stem cell factor receptor (c-Kit) |
| 0.1 | 3.0 | PID INTEGRIN A9B1 PATHWAY | Alpha9 beta1 integrin signaling events |
| 0.1 | 2.4 | PID IL6 7 PATHWAY | IL6-mediated signaling events |
| 0.1 | 1.8 | PID ERB GENOMIC PATHWAY | Validated nuclear estrogen receptor beta network |
| 0.1 | 7.3 | PID AP1 PATHWAY | AP-1 transcription factor network |
| 0.1 | 2.3 | PID TOLL ENDOGENOUS PATHWAY | Endogenous TLR signaling |
| 0.0 | 1.2 | PID PI3K PLC TRK PATHWAY | Trk receptor signaling mediated by PI3K and PLC-gamma |
| 0.0 | 2.0 | SIG CD40PATHWAYMAP | Genes related to CD40 signaling |
| 0.0 | 1.6 | PID ECADHERIN KERATINOCYTE PATHWAY | E-cadherin signaling in keratinocytes |
| 0.0 | 1.4 | PID NECTIN PATHWAY | Nectin adhesion pathway |
| 0.0 | 1.0 | PID SYNDECAN 3 PATHWAY | Syndecan-3-mediated signaling events |
| 0.0 | 0.7 | PID IGF1 PATHWAY | IGF1 pathway |
| 0.0 | 1.9 | PID FAK PATHWAY | Signaling events mediated by focal adhesion kinase |
| 0.0 | 2.4 | SIG CHEMOTAXIS | Genes related to chemotaxis |
| 0.0 | 2.4 | PID HES HEY PATHWAY | Notch-mediated HES/HEY network |
| 0.0 | 0.5 | SA PTEN PATHWAY | PTEN is a tumor suppressor that dephosphorylates the lipid messenger phosphatidylinositol triphosphate. |
| 0.0 | 3.8 | PID RHOA REG PATHWAY | Regulation of RhoA activity |
| 0.0 | 3.6 | PID BETA CATENIN NUC PATHWAY | Regulation of nuclear beta catenin signaling and target gene transcription |
| 0.0 | 3.0 | PID E2F PATHWAY | E2F transcription factor network |
| 0.0 | 1.9 | PID TCR PATHWAY | TCR signaling in naïve CD4+ T cells |
| 0.0 | 3.5 | PID MYC ACTIV PATHWAY | Validated targets of C-MYC transcriptional activation |
| 0.0 | 0.8 | PID THROMBIN PAR1 PATHWAY | PAR1-mediated thrombin signaling events |
| 0.0 | 0.5 | PID IL3 PATHWAY | IL3-mediated signaling events |
| 0.0 | 1.5 | PID SYNDECAN 1 PATHWAY | Syndecan-1-mediated signaling events |
| 0.0 | 0.6 | PID IL8 CXCR1 PATHWAY | IL8- and CXCR1-mediated signaling events |
| 0.0 | 0.6 | PID FRA PATHWAY | Validated transcriptional targets of AP1 family members Fra1 and Fra2 |
| 0.0 | 0.4 | PID WNT CANONICAL PATHWAY | Canonical Wnt signaling pathway |
| 0.0 | 1.5 | PID PLK1 PATHWAY | PLK1 signaling events |
| 0.0 | 0.4 | PID AVB3 INTEGRIN PATHWAY | Integrins in angiogenesis |
| 0.0 | 1.3 | PID ARF6 PATHWAY | Arf6 signaling events |
| 0.0 | 1.2 | PID ERBB1 DOWNSTREAM PATHWAY | ErbB1 downstream signaling |
| 0.0 | 1.4 | PID TGFBR PATHWAY | TGF-beta receptor signaling |
| 0.0 | 0.5 | ST WNT CA2 CYCLIC GMP PATHWAY | Wnt/Ca2+/cyclic GMP signaling. |
| 0.0 | 1.5 | PID SMAD2 3NUCLEAR PATHWAY | Regulation of nuclear SMAD2/3 signaling |
| 0.0 | 1.1 | PID P73PATHWAY | p73 transcription factor network |
| 0.0 | 2.3 | PID P53 DOWNSTREAM PATHWAY | Direct p53 effectors |
| 0.0 | 3.5 | NABA ECM AFFILIATED | Genes encoding proteins affiliated structurally or functionally to extracellular matrix proteins |
| 0.0 | 0.6 | PID CERAMIDE PATHWAY | Ceramide signaling pathway |
| 0.0 | 0.6 | PID ERA GENOMIC PATHWAY | Validated nuclear estrogen receptor alpha network |
| 0.0 | 0.3 | PID NCADHERIN PATHWAY | N-cadherin signaling events |
| 0.0 | 0.2 | PID RET PATHWAY | Signaling events regulated by Ret tyrosine kinase |
Gene overrepresentation in curated gene sets: REACTOME pathways category:
| Log-likelihood per target | Total log-likelihood | Term | Description |
|---|---|---|---|
| 0.2 | 3.3 | REACTOME PURINE CATABOLISM | Genes involved in Purine catabolism |
| 0.2 | 5.8 | REACTOME BOTULINUM NEUROTOXICITY | Genes involved in Botulinum neurotoxicity |
| 0.2 | 2.4 | REACTOME TRAFFICKING AND PROCESSING OF ENDOSOMAL TLR | Genes involved in Trafficking and processing of endosomal TLR |
| 0.1 | 3.0 | REACTOME VEGF LIGAND RECEPTOR INTERACTIONS | Genes involved in VEGF ligand-receptor interactions |
| 0.1 | 0.8 | REACTOME BINDING AND ENTRY OF HIV VIRION | Genes involved in Binding and entry of HIV virion |
| 0.1 | 2.0 | REACTOME REGULATION OF INSULIN SECRETION BY ACETYLCHOLINE | Genes involved in Regulation of Insulin Secretion by Acetylcholine |
| 0.1 | 6.2 | REACTOME METAL ION SLC TRANSPORTERS | Genes involved in Metal ion SLC transporters |
| 0.1 | 3.9 | REACTOME SYNTHESIS OF PIPS AT THE GOLGI MEMBRANE | Genes involved in Synthesis of PIPs at the Golgi membrane |
| 0.1 | 3.5 | REACTOME REGULATION OF INSULIN LIKE GROWTH FACTOR IGF ACTIVITY BY INSULIN LIKE GROWTH FACTOR BINDING PROTEINS IGFBPS | Genes involved in Regulation of Insulin-like Growth Factor (IGF) Activity by Insulin-like Growth Factor Binding Proteins (IGFBPs) |
| 0.1 | 1.7 | REACTOME ADVANCED GLYCOSYLATION ENDPRODUCT RECEPTOR SIGNALING | Genes involved in Advanced glycosylation endproduct receptor signaling |
| 0.1 | 1.8 | REACTOME NEF MEDIATED DOWNREGULATION OF MHC CLASS I COMPLEX CELL SURFACE EXPRESSION | Genes involved in Nef mediated downregulation of MHC class I complex cell surface expression |
| 0.1 | 3.6 | REACTOME INSULIN RECEPTOR RECYCLING | Genes involved in Insulin receptor recycling |
| 0.1 | 0.7 | REACTOME MRNA CAPPING | Genes involved in mRNA Capping |
| 0.1 | 1.3 | REACTOME P75NTR RECRUITS SIGNALLING COMPLEXES | Genes involved in p75NTR recruits signalling complexes |
| 0.1 | 2.0 | REACTOME SPRY REGULATION OF FGF SIGNALING | Genes involved in Spry regulation of FGF signaling |
| 0.1 | 2.6 | REACTOME GAP JUNCTION ASSEMBLY | Genes involved in Gap junction assembly |
| 0.1 | 0.9 | REACTOME MEMBRANE BINDING AND TARGETTING OF GAG PROTEINS | Genes involved in Membrane binding and targetting of GAG proteins |
| 0.1 | 2.0 | REACTOME TETRAHYDROBIOPTERIN BH4 SYNTHESIS RECYCLING SALVAGE AND REGULATION | Genes involved in Tetrahydrobiopterin (BH4) synthesis, recycling, salvage and regulation |
| 0.1 | 4.6 | REACTOME RAP1 SIGNALLING | Genes involved in Rap1 signalling |
| 0.1 | 3.3 | REACTOME TRAF6 MEDIATED NFKB ACTIVATION | Genes involved in TRAF6 mediated NF-kB activation |
| 0.1 | 2.1 | REACTOME HS GAG BIOSYNTHESIS | Genes involved in HS-GAG biosynthesis |
| 0.1 | 6.9 | REACTOME TRANSPORT OF MATURE TRANSCRIPT TO CYTOPLASM | Genes involved in Transport of Mature Transcript to Cytoplasm |
| 0.1 | 2.1 | REACTOME NOTCH HLH TRANSCRIPTION PATHWAY | Genes involved in Notch-HLH transcription pathway |
| 0.1 | 3.0 | REACTOME CELL EXTRACELLULAR MATRIX INTERACTIONS | Genes involved in Cell-extracellular matrix interactions |
| 0.1 | 4.2 | REACTOME G1 PHASE | Genes involved in G1 Phase |
| 0.1 | 6.5 | REACTOME CHONDROITIN SULFATE DERMATAN SULFATE METABOLISM | Genes involved in Chondroitin sulfate/dermatan sulfate metabolism |
| 0.1 | 0.8 | REACTOME ROLE OF SECOND MESSENGERS IN NETRIN1 SIGNALING | Genes involved in Role of second messengers in netrin-1 signaling |
| 0.1 | 15.5 | REACTOME METABOLISM OF CARBOHYDRATES | Genes involved in Metabolism of carbohydrates |
| 0.1 | 3.8 | REACTOME MITOCHONDRIAL PROTEIN IMPORT | Genes involved in Mitochondrial Protein Import |
| 0.1 | 4.0 | REACTOME TRANSPORT TO THE GOLGI AND SUBSEQUENT MODIFICATION | Genes involved in Transport to the Golgi and subsequent modification |
| 0.1 | 2.4 | REACTOME CHOLESTEROL BIOSYNTHESIS | Genes involved in Cholesterol biosynthesis |
| 0.1 | 1.2 | REACTOME SYNTHESIS SECRETION AND DEACYLATION OF GHRELIN | Genes involved in Synthesis, Secretion, and Deacylation of Ghrelin |
| 0.1 | 3.2 | REACTOME SMAD2 SMAD3 SMAD4 HETEROTRIMER REGULATES TRANSCRIPTION | Genes involved in SMAD2/SMAD3:SMAD4 heterotrimer regulates transcription |
| 0.1 | 2.8 | REACTOME SMOOTH MUSCLE CONTRACTION | Genes involved in Smooth Muscle Contraction |
| 0.1 | 7.8 | REACTOME RESPONSE TO ELEVATED PLATELET CYTOSOLIC CA2 | Genes involved in Response to elevated platelet cytosolic Ca2+ |
| 0.0 | 1.2 | REACTOME TGF BETA RECEPTOR SIGNALING IN EMT EPITHELIAL TO MESENCHYMAL TRANSITION | Genes involved in TGF-beta receptor signaling in EMT (epithelial to mesenchymal transition) |
| 0.0 | 0.7 | REACTOME ER PHAGOSOME PATHWAY | Genes involved in ER-Phagosome pathway |
| 0.0 | 0.5 | REACTOME COPI MEDIATED TRANSPORT | Genes involved in COPI Mediated Transport |
| 0.0 | 3.7 | REACTOME GOLGI ASSOCIATED VESICLE BIOGENESIS | Genes involved in Golgi Associated Vesicle Biogenesis |
| 0.0 | 1.5 | REACTOME RNA POL I TRANSCRIPTION INITIATION | Genes involved in RNA Polymerase I Transcription Initiation |
| 0.0 | 1.7 | REACTOME YAP1 AND WWTR1 TAZ STIMULATED GENE EXPRESSION | Genes involved in YAP1- and WWTR1 (TAZ)-stimulated gene expression |
| 0.0 | 1.4 | REACTOME KINESINS | Genes involved in Kinesins |
| 0.0 | 1.4 | REACTOME RNA POL II TRANSCRIPTION PRE INITIATION AND PROMOTER OPENING | Genes involved in RNA Polymerase II Transcription Pre-Initiation And Promoter Opening |
| 0.0 | 1.2 | REACTOME SYNTHESIS OF PC | Genes involved in Synthesis of PC |
| 0.0 | 1.7 | REACTOME INTERACTION BETWEEN L1 AND ANKYRINS | Genes involved in Interaction between L1 and Ankyrins |
| 0.0 | 3.4 | REACTOME MRNA SPLICING | Genes involved in mRNA Splicing |
| 0.0 | 1.2 | REACTOME SYNTHESIS OF VERY LONG CHAIN FATTY ACYL COAS | Genes involved in Synthesis of very long-chain fatty acyl-CoAs |
| 0.0 | 2.1 | REACTOME REGULATION OF ORNITHINE DECARBOXYLASE ODC | Genes involved in Regulation of ornithine decarboxylase (ODC) |
| 0.0 | 0.9 | REACTOME GABA SYNTHESIS RELEASE REUPTAKE AND DEGRADATION | Genes involved in GABA synthesis, release, reuptake and degradation |
| 0.0 | 0.7 | REACTOME AMINO ACID SYNTHESIS AND INTERCONVERSION TRANSAMINATION | Genes involved in Amino acid synthesis and interconversion (transamination) |
| 0.0 | 0.1 | REACTOME DOPAMINE NEUROTRANSMITTER RELEASE CYCLE | Genes involved in Dopamine Neurotransmitter Release Cycle |
| 0.0 | 0.7 | REACTOME SIGNALING BY EGFR IN CANCER | Genes involved in Signaling by EGFR in Cancer |
| 0.0 | 1.9 | REACTOME METABOLISM OF VITAMINS AND COFACTORS | Genes involved in Metabolism of vitamins and cofactors |
| 0.0 | 0.5 | REACTOME CYTOSOLIC SULFONATION OF SMALL MOLECULES | Genes involved in Cytosolic sulfonation of small molecules |
| 0.0 | 0.8 | REACTOME CASPASE MEDIATED CLEAVAGE OF CYTOSKELETAL PROTEINS | Genes involved in Caspase-mediated cleavage of cytoskeletal proteins |
| 0.0 | 2.2 | REACTOME NRAGE SIGNALS DEATH THROUGH JNK | Genes involved in NRAGE signals death through JNK |
| 0.0 | 1.1 | REACTOME TRAFFICKING OF AMPA RECEPTORS | Genes involved in Trafficking of AMPA receptors |
| 0.0 | 1.4 | REACTOME ACTIVATION OF CHAPERONE GENES BY XBP1S | Genes involved in Activation of Chaperone Genes by XBP1(S) |
| 0.0 | 0.3 | REACTOME METABOLISM OF NON CODING RNA | Genes involved in Metabolism of non-coding RNA |
| 0.0 | 0.3 | REACTOME PROLONGED ERK ACTIVATION EVENTS | Genes involved in Prolonged ERK activation events |
| 0.0 | 0.4 | REACTOME CTNNB1 PHOSPHORYLATION CASCADE | Genes involved in Beta-catenin phosphorylation cascade |
| 0.0 | 0.6 | REACTOME EFFECTS OF PIP2 HYDROLYSIS | Genes involved in Effects of PIP2 hydrolysis |
| 0.0 | 0.7 | REACTOME GLYCOSPHINGOLIPID METABOLISM | Genes involved in Glycosphingolipid metabolism |
| 0.0 | 1.2 | REACTOME L1CAM INTERACTIONS | Genes involved in L1CAM interactions |