Project
Illumina Body Map 2 (GSE30611)
Navigation
Downloads
Results for GGACGGA
Z-value: 0.09
Motif logo

miRNA associated with seed GGACGGA
| Name | miRBASE accession |
|---|---|
|
hsa-miR-184
|
MIMAT0000454 |
Activity profile of GGACGGA motif
Sorted Z-values of GGACGGA motif
| Promoter | Log-likelihood | Transcript | Gene | Gene Info |
|---|---|---|---|---|
| chr11_+_117178728 | 0.12 |
ENST00000532960.5
ENST00000324225.9 |
SIDT2
|
SID1 transmembrane family member 2 |
| chr11_-_64778502 | 0.12 |
ENST00000681407.1
ENST00000377390.8 |
SF1
|
splicing factor 1 |
| chr5_-_173328407 | 0.06 |
ENST00000265087.9
|
STC2
|
stanniocalcin 2 |
| chr4_-_173530219 | 0.06 |
ENST00000359562.4
|
HAND2
|
heart and neural crest derivatives expressed 2 |
| chr1_-_56579555 | 0.06 |
ENST00000371250.4
|
PLPP3
|
phospholipid phosphatase 3 |
| chr6_+_117675448 | 0.06 |
ENST00000368494.4
|
NUS1
|
NUS1 dehydrodolichyl diphosphate synthase subunit |
| chr12_+_53180679 | 0.05 |
ENST00000416904.5
|
ZNF740
|
zinc finger protein 740 |
| chr8_-_140635617 | 0.05 |
ENST00000220592.10
|
AGO2
|
argonaute RISC catalytic component 2 |
| chr22_-_38872206 | 0.04 |
ENST00000407418.8
ENST00000216083.6 |
CBX6
|
chromobox 6 |
| chr19_+_55605639 | 0.04 |
ENST00000568956.2
|
ZNF865
|
zinc finger protein 865 |
| chr1_-_18902520 | 0.04 |
ENST00000538839.5
ENST00000290597.9 ENST00000375341.8 |
ALDH4A1
|
aldehyde dehydrogenase 4 family member A1 |
| chr19_+_10871516 | 0.03 |
ENST00000327064.9
ENST00000588947.5 |
CARM1
|
coactivator associated arginine methyltransferase 1 |
| chr12_+_120687118 | 0.02 |
ENST00000228506.8
ENST00000412616.2 |
MLEC
|
malectin |
| chr20_-_32483438 | 0.02 |
ENST00000359676.9
|
NOL4L
|
nucleolar protein 4 like |
| chr22_+_40177917 | 0.01 |
ENST00000454349.7
ENST00000335727.13 |
TNRC6B
|
trinucleotide repeat containing adaptor 6B |
| chr12_-_124495252 | 0.01 |
ENST00000405201.5
|
NCOR2
|
nuclear receptor corepressor 2 |
| chr3_-_147406520 | 0.00 |
ENST00000463250.1
ENST00000383075.8 |
ZIC4
|
Zic family member 4 |
Network of associatons between targets according to the STRING database.
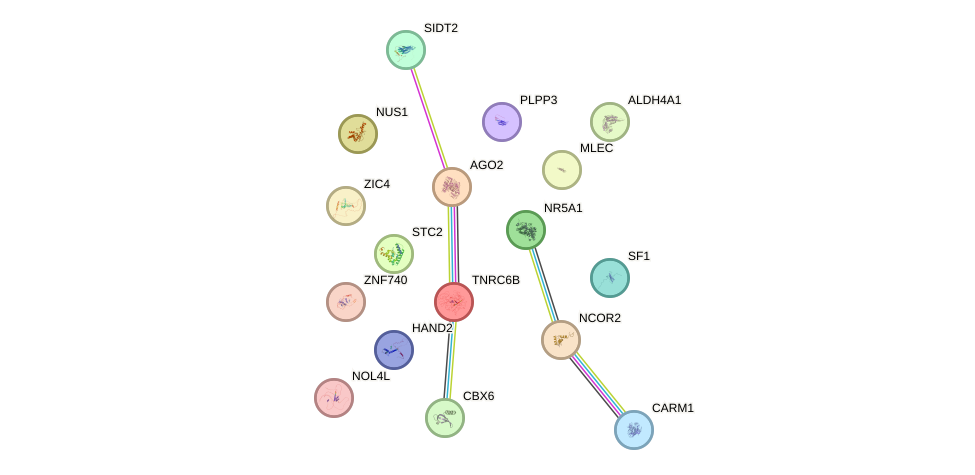
First level regulatory network of GGACGGA
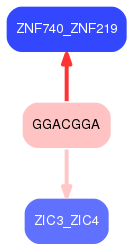
Gene Ontology Analysis
Gene overrepresentation in biological process category:
| Log-likelihood per target | Total log-likelihood | Term | Description |
|---|---|---|---|
| 0.0 | 0.1 | GO:0016094 | polyprenol biosynthetic process(GO:0016094) |
| 0.0 | 0.1 | GO:0003219 | cardiac right ventricle formation(GO:0003219) visceral serous pericardium development(GO:0061032) |
| 0.0 | 0.1 | GO:0000389 | mRNA 3'-splice site recognition(GO:0000389) |
Gene overrepresentation in molecular function category:
| Log-likelihood per target | Total log-likelihood | Term | Description |
|---|---|---|---|
| 0.0 | 0.1 | GO:0045131 | pre-mRNA branch point binding(GO:0045131) |
| 0.0 | 0.1 | GO:0051032 | nucleic acid transmembrane transporter activity(GO:0051032) RNA transmembrane transporter activity(GO:0051033) |