Project
Illumina Body Map 2 (GSE30611)
Navigation
Downloads
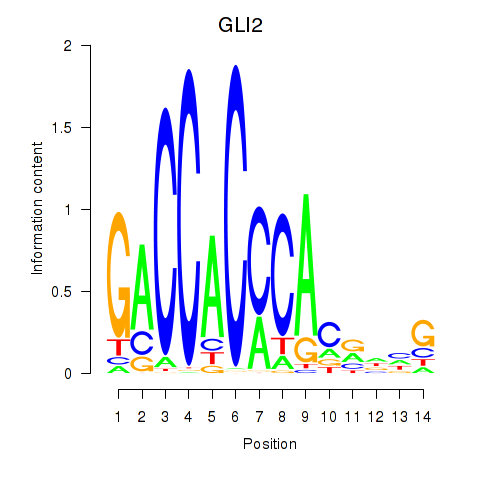
Results for GLI2
Z-value: 1.01
Motif logo
Transcription factors associated with GLI2
| Gene Symbol | Gene ID | Gene Info |
|---|---|---|
|
GLI2
|
ENSG00000074047.22 | GLI family zinc finger 2 |
Activity-expression correlation:
| Gene | Promoter | Pearson corr. coef. | P-value | Plot |
|---|---|---|---|---|
| GLI2 | hg38_v1_chr2_+_120735848_120735899 | -0.30 | 9.1e-02 | Click! |
Activity profile of GLI2 motif
Sorted Z-values of GLI2 motif
| Promoter | Log-likelihood | Transcript | Gene | Gene Info |
|---|---|---|---|---|
| chr11_+_124739927 | 2.59 |
ENST00000284292.11
ENST00000412681.2 |
NRGN
|
neurogranin |
| chr17_-_7114813 | 2.57 |
ENST00000254850.11
|
ASGR2
|
asialoglycoprotein receptor 2 |
| chr17_-_7114648 | 2.57 |
ENST00000355035.9
|
ASGR2
|
asialoglycoprotein receptor 2 |
| chrY_+_2841594 | 2.49 |
ENST00000250784.13
|
RPS4Y1
|
ribosomal protein S4 Y-linked 1 |
| chr17_-_7114240 | 2.40 |
ENST00000446679.6
|
ASGR2
|
asialoglycoprotein receptor 2 |
| chr3_+_32951636 | 2.27 |
ENST00000330953.6
|
CCR4
|
C-C motif chemokine receptor 4 |
| chr14_-_94390667 | 2.27 |
ENST00000557492.5
ENST00000355814.8 ENST00000437397.5 ENST00000448921.5 ENST00000393088.8 |
SERPINA1
|
serpin family A member 1 |
| chr14_-_94390650 | 2.22 |
ENST00000449399.7
ENST00000404814.8 |
SERPINA1
|
serpin family A member 1 |
| chr14_-_94390614 | 2.21 |
ENST00000553327.5
ENST00000556955.5 ENST00000557118.5 ENST00000440909.5 |
SERPINA1
|
serpin family A member 1 |
| chr7_-_954666 | 2.21 |
ENST00000265846.10
ENST00000649206.1 |
ADAP1
|
ArfGAP with dual PH domains 1 |
| chr21_-_44910630 | 2.19 |
ENST00000320216.10
ENST00000397852.5 |
ITGB2
|
integrin subunit beta 2 |
| chr6_-_127900958 | 2.00 |
ENST00000434358.3
ENST00000630369.2 ENST00000368248.4 |
THEMIS
|
thymocyte selection associated |
| chr19_-_54280498 | 1.95 |
ENST00000391746.5
|
LILRB2
|
leukocyte immunoglobulin like receptor B2 |
| chr19_+_18097763 | 1.94 |
ENST00000262811.10
|
MAST3
|
microtubule associated serine/threonine kinase 3 |
| chr19_+_17747698 | 1.83 |
ENST00000594202.5
ENST00000252771.11 |
FCHO1
|
FCH and mu domain containing endocytic adaptor 1 |
| chr2_+_181457342 | 1.78 |
ENST00000397033.7
ENST00000233573.6 |
ITGA4
|
integrin subunit alpha 4 |
| chr7_+_142715314 | 1.73 |
ENST00000390399.3
|
TRBV27
|
T cell receptor beta variable 27 |
| chr1_-_39691450 | 1.68 |
ENST00000612703.3
ENST00000617690.2 |
HPCAL4
|
hippocalcin like 4 |
| chr1_+_6045914 | 1.67 |
ENST00000378083.7
|
KCNAB2
|
potassium voltage-gated channel subfamily A regulatory beta subunit 2 |
| chrY_+_2841864 | 1.67 |
ENST00000430575.1
|
RPS4Y1
|
ribosomal protein S4 Y-linked 1 |
| chr19_-_10517921 | 1.59 |
ENST00000439028.3
|
S1PR5
|
sphingosine-1-phosphate receptor 5 |
| chr14_-_94388589 | 1.58 |
ENST00000402629.1
ENST00000556091.1 ENST00000393087.9 ENST00000554720.1 |
SERPINA1
|
serpin family A member 1 |
| chr19_-_10517439 | 1.54 |
ENST00000333430.6
|
S1PR5
|
sphingosine-1-phosphate receptor 5 |
| chr6_-_24910695 | 1.51 |
ENST00000643623.1
ENST00000538035.6 ENST00000647136.1 |
RIPOR2
|
RHO family interacting cell polarization regulator 2 |
| chr1_-_39691393 | 1.47 |
ENST00000372844.8
|
HPCAL4
|
hippocalcin like 4 |
| chr19_+_44942230 | 1.45 |
ENST00000592954.2
ENST00000589057.5 |
APOC4
APOC4-APOC2
|
apolipoprotein C4 APOC4-APOC2 readthrough (NMD candidate) |
| chr19_+_17747737 | 1.44 |
ENST00000600676.5
ENST00000600209.5 ENST00000596309.5 ENST00000598539.5 ENST00000597474.5 ENST00000593385.5 ENST00000598067.5 ENST00000593833.5 |
FCHO1
|
FCH and mu domain containing endocytic adaptor 1 |
| chr19_+_7355589 | 1.44 |
ENST00000671891.2
|
ARHGEF18
|
Rho/Rac guanine nucleotide exchange factor 18 |
| chr1_-_206923183 | 1.43 |
ENST00000525793.5
|
FCMR
|
Fc fragment of IgM receptor |
| chr10_+_48684859 | 1.42 |
ENST00000360890.6
ENST00000325239.11 |
WDFY4
|
WDFY family member 4 |
| chr1_-_206923242 | 1.36 |
ENST00000529560.1
|
FCMR
|
Fc fragment of IgM receptor |
| chr8_-_66613208 | 1.29 |
ENST00000522677.8
|
MYBL1
|
MYB proto-oncogene like 1 |
| chr11_-_116791871 | 1.25 |
ENST00000673688.1
ENST00000227665.9 |
APOA5
|
apolipoprotein A5 |
| chr3_-_165196689 | 1.25 |
ENST00000241274.3
|
SLITRK3
|
SLIT and NTRK like family member 3 |
| chr11_+_116830529 | 1.23 |
ENST00000630701.1
|
APOC3
|
apolipoprotein C3 |
| chr12_+_120496075 | 1.23 |
ENST00000548214.1
ENST00000392508.2 |
DYNLL1
|
dynein light chain LC8-type 1 |
| chr7_-_92836555 | 1.21 |
ENST00000424848.3
|
CDK6
|
cyclin dependent kinase 6 |
| chr9_-_134917872 | 1.21 |
ENST00000616356.4
ENST00000371806.4 |
FCN1
|
ficolin 1 |
| chr19_-_10568968 | 1.21 |
ENST00000393599.3
|
CDKN2D
|
cyclin dependent kinase inhibitor 2D |
| chr5_+_161848314 | 1.18 |
ENST00000437025.6
|
GABRA1
|
gamma-aminobutyric acid type A receptor subunit alpha1 |
| chr8_+_1973668 | 1.18 |
ENST00000320248.4
|
KBTBD11
|
kelch repeat and BTB domain containing 11 |
| chr16_+_28984795 | 1.17 |
ENST00000395461.7
|
LAT
|
linker for activation of T cells |
| chr19_-_10569022 | 1.16 |
ENST00000335766.2
|
CDKN2D
|
cyclin dependent kinase inhibitor 2D |
| chr8_-_66613229 | 1.16 |
ENST00000517885.5
|
MYBL1
|
MYB proto-oncogene like 1 |
| chr14_+_95876385 | 1.11 |
ENST00000504119.1
|
TUNAR
|
TCL1 upstream neural differentiation-associated RNA |
| chr19_+_4153616 | 1.09 |
ENST00000078445.7
ENST00000595923.5 ENST00000602257.5 ENST00000602147.1 |
CREB3L3
|
cAMP responsive element binding protein 3 like 3 |
| chr17_-_28370283 | 1.07 |
ENST00000226218.9
|
VTN
|
vitronectin |
| chr5_+_161848536 | 1.06 |
ENST00000519621.2
ENST00000636573.1 |
GABRA1
|
gamma-aminobutyric acid type A receptor subunit alpha1 |
| chr4_+_153684241 | 1.06 |
ENST00000646219.1
ENST00000642580.1 ENST00000643501.1 ENST00000642700.2 |
TLR2
|
toll like receptor 2 |
| chr12_-_57488726 | 1.06 |
ENST00000550288.6
ENST00000393797.7 |
ARHGAP9
|
Rho GTPase activating protein 9 |
| chr11_+_1870871 | 1.05 |
ENST00000417766.5
|
LSP1
|
lymphocyte specific protein 1 |
| chr6_-_32816910 | 1.04 |
ENST00000447394.1
ENST00000438763.7 |
HLA-DOB
|
major histocompatibility complex, class II, DO beta |
| chr22_-_37212471 | 1.03 |
ENST00000610913.2
|
SSTR3
|
somatostatin receptor 3 |
| chr19_+_44914588 | 1.03 |
ENST00000592535.6
|
APOC1
|
apolipoprotein C1 |
| chr12_+_120496101 | 1.03 |
ENST00000550178.1
ENST00000550845.5 ENST00000549989.1 ENST00000552870.1 ENST00000242577.11 |
DYNLL1
|
dynein light chain LC8-type 1 |
| chr2_+_127423265 | 1.03 |
ENST00000402125.2
|
PROC
|
protein C, inactivator of coagulation factors Va and VIIIa |
| chr19_+_17527250 | 1.02 |
ENST00000599164.6
ENST00000449408.6 ENST00000600871.5 ENST00000599124.1 |
NIBAN3
|
niban apoptosis regulator 3 |
| chr19_-_7874361 | 1.02 |
ENST00000618550.5
|
PRR36
|
proline rich 36 |
| chr9_+_92947516 | 1.01 |
ENST00000375482.8
|
FGD3
|
FYVE, RhoGEF and PH domain containing 3 |
| chr15_+_81299416 | 1.00 |
ENST00000558332.3
|
IL16
|
interleukin 16 |
| chr5_-_157575767 | 1.00 |
ENST00000257527.9
|
ADAM19
|
ADAM metallopeptidase domain 19 |
| chr9_-_119369416 | 1.00 |
ENST00000373964.2
ENST00000265922.8 |
BRINP1
|
BMP/retinoic acid inducible neural specific 1 |
| chr2_+_85694399 | 1.00 |
ENST00000409696.7
|
GNLY
|
granulysin |
| chr2_+_37344594 | 0.99 |
ENST00000404976.5
ENST00000338415.8 |
QPCT
|
glutaminyl-peptide cyclotransferase |
| chr2_+_85694350 | 0.97 |
ENST00000524600.5
ENST00000263863.9 |
GNLY
|
granulysin |
| chr1_+_2019379 | 0.97 |
ENST00000638771.1
ENST00000640949.1 ENST00000640030.1 |
GABRD
|
gamma-aminobutyric acid type A receptor subunit delta |
| chr17_-_3916455 | 0.97 |
ENST00000225538.4
|
P2RX1
|
purinergic receptor P2X 1 |
| chrX_+_153517672 | 0.96 |
ENST00000349466.6
ENST00000370186.5 ENST00000359149.8 |
ATP2B3
|
ATPase plasma membrane Ca2+ transporting 3 |
| chr6_+_42915989 | 0.95 |
ENST00000441198.4
ENST00000446507.5 ENST00000616441.2 |
PTCRA
|
pre T cell antigen receptor alpha |
| chr15_-_101334157 | 0.95 |
ENST00000632686.1
|
PCSK6
|
proprotein convertase subtilisin/kexin type 6 |
| chr14_-_50830479 | 0.94 |
ENST00000382043.8
|
NIN
|
ninein |
| chr5_+_126777112 | 0.94 |
ENST00000261366.10
ENST00000492190.5 ENST00000395354.1 |
LMNB1
|
lamin B1 |
| chr1_-_26370745 | 0.93 |
ENST00000451801.5
ENST00000454975.1 |
ZNF683
|
zinc finger protein 683 |
| chr17_+_30921935 | 0.93 |
ENST00000581285.5
ENST00000330889.8 |
ADAP2
|
ArfGAP with dual PH domains 2 |
| chr6_+_34466059 | 0.92 |
ENST00000620693.4
ENST00000244458.7 ENST00000374043.6 |
PACSIN1
|
protein kinase C and casein kinase substrate in neurons 1 |
| chr5_-_39364484 | 0.92 |
ENST00000263408.5
|
C9
|
complement C9 |
| chr16_-_30010972 | 0.92 |
ENST00000565273.5
ENST00000567332.6 ENST00000350119.9 |
DOC2A
|
double C2 domain alpha |
| chr1_+_77283071 | 0.92 |
ENST00000478407.1
|
AK5
|
adenylate kinase 5 |
| chr14_-_50830641 | 0.91 |
ENST00000453196.6
ENST00000496749.1 |
NIN
|
ninein |
| chr17_-_10026265 | 0.91 |
ENST00000437099.6
ENST00000396115.6 |
GAS7
|
growth arrest specific 7 |
| chr2_-_73071673 | 0.90 |
ENST00000411783.5
ENST00000272433.7 ENST00000410065.5 ENST00000442582.1 |
SFXN5
|
sideroflexin 5 |
| chr19_-_51372640 | 0.90 |
ENST00000600427.5
ENST00000221978.10 |
NKG7
|
natural killer cell granule protein 7 |
| chr1_-_46941464 | 0.89 |
ENST00000462347.5
ENST00000371905.1 ENST00000310638.9 |
CYP4A11
|
cytochrome P450 family 4 subfamily A member 11 |
| chr19_+_44914833 | 0.88 |
ENST00000589078.1
ENST00000586638.5 |
APOC1
|
apolipoprotein C1 |
| chr2_-_240820205 | 0.88 |
ENST00000647731.1
ENST00000648680.1 ENST00000649306.1 ENST00000648129.1 ENST00000498729.9 ENST00000320389.12 ENST00000648364.1 ENST00000647885.1 ENST00000404283.9 ENST00000649096.1 |
KIF1A
|
kinesin family member 1A |
| chr8_-_133102477 | 0.87 |
ENST00000522119.5
ENST00000523610.5 ENST00000338087.10 ENST00000521302.5 ENST00000519558.5 ENST00000519747.5 ENST00000517648.5 |
SLA
|
Src like adaptor |
| chr20_+_10218948 | 0.86 |
ENST00000430336.1
|
SNAP25
|
synaptosome associated protein 25 |
| chr13_+_113105782 | 0.85 |
ENST00000541084.5
ENST00000346342.8 ENST00000375581.3 |
F7
|
coagulation factor VII |
| chr15_+_28919367 | 0.85 |
ENST00000558804.5
|
APBA2
|
amyloid beta precursor protein binding family A member 2 |
| chr19_-_54281082 | 0.85 |
ENST00000314446.10
|
LILRB2
|
leukocyte immunoglobulin like receptor B2 |
| chr3_-_10292901 | 0.85 |
ENST00000430179.5
ENST00000287656.11 ENST00000437422.6 ENST00000439975.6 ENST00000446937.2 ENST00000449238.6 ENST00000457360.5 |
GHRL
|
ghrelin and obestatin prepropeptide |
| chr1_+_207496147 | 0.85 |
ENST00000400960.7
ENST00000367049.9 |
CR1
|
complement C3b/C4b receptor 1 (Knops blood group) |
| chr17_+_6996042 | 0.84 |
ENST00000251535.11
|
ALOX12
|
arachidonate 12-lipoxygenase, 12S type |
| chr5_-_157575741 | 0.84 |
ENST00000517905.1
|
ADAM19
|
ADAM metallopeptidase domain 19 |
| chr8_+_30095649 | 0.83 |
ENST00000518192.5
|
LEPROTL1
|
leptin receptor overlapping transcript like 1 |
| chr5_+_162067764 | 0.83 |
ENST00000639213.2
ENST00000414552.6 |
GABRG2
|
gamma-aminobutyric acid type A receptor subunit gamma2 |
| chr16_-_3235143 | 0.82 |
ENST00000414144.7
ENST00000431561.7 ENST00000396870.8 |
ZNF200
|
zinc finger protein 200 |
| chr1_+_207496229 | 0.82 |
ENST00000367051.6
ENST00000367053.6 ENST00000367052.6 |
CR1
|
complement C3b/C4b receptor 1 (Knops blood group) |
| chr19_+_17527232 | 0.82 |
ENST00000601861.5
|
NIBAN3
|
niban apoptosis regulator 3 |
| chr20_+_36574535 | 0.82 |
ENST00000558530.1
ENST00000558028.5 ENST00000611732.4 ENST00000560025.1 |
TGIF2-RAB5IF
TGIF2
|
TGIF2-RAB5IF readthrough TGFB induced factor homeobox 2 |
| chr15_+_81296913 | 0.81 |
ENST00000394652.6
|
IL16
|
interleukin 16 |
| chr1_-_92486916 | 0.81 |
ENST00000294702.6
|
GFI1
|
growth factor independent 1 transcriptional repressor |
| chr19_-_39320839 | 0.81 |
ENST00000248668.5
|
LRFN1
|
leucine rich repeat and fibronectin type III domain containing 1 |
| chr19_-_54189550 | 0.80 |
ENST00000338624.10
ENST00000245615.6 |
MBOAT7
|
membrane bound O-acyltransferase domain containing 7 |
| chr8_-_133102623 | 0.80 |
ENST00000524345.5
|
SLA
|
Src like adaptor |
| chr19_-_50968775 | 0.80 |
ENST00000391808.5
|
KLK6
|
kallikrein related peptidase 6 |
| chr19_-_6481749 | 0.79 |
ENST00000588421.1
|
DENND1C
|
DENN domain containing 1C |
| chr19_-_51372686 | 0.79 |
ENST00000595217.1
|
NKG7
|
natural killer cell granule protein 7 |
| chr1_-_46941425 | 0.78 |
ENST00000371904.8
|
CYP4A11
|
cytochrome P450 family 4 subfamily A member 11 |
| chr11_-_77411883 | 0.78 |
ENST00000528203.5
ENST00000528592.5 ENST00000528633.1 ENST00000529248.5 |
PAK1
|
p21 (RAC1) activated kinase 1 |
| chr13_-_46182136 | 0.78 |
ENST00000323076.7
|
LCP1
|
lymphocyte cytosolic protein 1 |
| chrX_+_71144818 | 0.77 |
ENST00000536169.5
ENST00000358741.4 ENST00000395855.6 ENST00000374051.7 |
NLGN3
|
neuroligin 3 |
| chr16_-_88941198 | 0.76 |
ENST00000327483.9
ENST00000564416.1 |
CBFA2T3
|
CBFA2/RUNX1 partner transcriptional co-repressor 3 |
| chr1_+_26543106 | 0.76 |
ENST00000530003.5
|
RPS6KA1
|
ribosomal protein S6 kinase A1 |
| chr5_+_157142933 | 0.76 |
ENST00000521769.5
|
ITK
|
IL2 inducible T cell kinase |
| chr2_+_240625237 | 0.75 |
ENST00000407714.1
|
GPR35
|
G protein-coupled receptor 35 |
| chr3_+_54123452 | 0.75 |
ENST00000620722.4
ENST00000490478.5 |
CACNA2D3
|
calcium voltage-gated channel auxiliary subunit alpha2delta 3 |
| chr4_+_1793776 | 0.75 |
ENST00000352904.6
|
FGFR3
|
fibroblast growth factor receptor 3 |
| chr20_-_23421409 | 0.75 |
ENST00000377026.4
ENST00000398425.7 ENST00000432543.6 ENST00000617876.4 |
NAPB
|
NSF attachment protein beta |
| chr1_-_84574407 | 0.75 |
ENST00000370630.6
|
CTBS
|
chitobiase |
| chr13_-_50843669 | 0.75 |
ENST00000504404.2
|
DLEU7
|
deleted in lymphocytic leukemia 7 |
| chr7_+_142615710 | 0.74 |
ENST00000611520.1
|
TRBV18
|
T cell receptor beta variable 18 |
| chr14_+_61812673 | 0.74 |
ENST00000683842.1
ENST00000636133.1 |
SYT16
|
synaptotagmin 16 |
| chr1_+_2019324 | 0.74 |
ENST00000638411.1
ENST00000378585.7 ENST00000640067.1 |
GABRD
|
gamma-aminobutyric acid type A receptor subunit delta |
| chr11_-_66718817 | 0.74 |
ENST00000617502.5
|
SPTBN2
|
spectrin beta, non-erythrocytic 2 |
| chr12_-_10390023 | 0.74 |
ENST00000240618.11
|
KLRK1
|
killer cell lectin like receptor K1 |
| chr3_-_194398354 | 0.73 |
ENST00000401815.1
|
GP5
|
glycoprotein V platelet |
| chr2_+_219514477 | 0.73 |
ENST00000347842.8
ENST00000358078.5 |
ASIC4
|
acid sensing ion channel subunit family member 4 |
| chr10_+_47322450 | 0.73 |
ENST00000581492.3
|
GDF2
|
growth differentiation factor 2 |
| chr2_-_43838832 | 0.73 |
ENST00000405322.8
|
ABCG5
|
ATP binding cassette subfamily G member 5 |
| chr18_+_13218769 | 0.72 |
ENST00000677055.1
ENST00000399848.7 |
LDLRAD4
|
low density lipoprotein receptor class A domain containing 4 |
| chr19_-_54281145 | 0.72 |
ENST00000434421.5
ENST00000391749.4 |
LILRB2
|
leukocyte immunoglobulin like receptor B2 |
| chr11_-_85133123 | 0.72 |
ENST00000527088.1
|
DLG2
|
discs large MAGUK scaffold protein 2 |
| chr9_-_112890868 | 0.71 |
ENST00000374228.5
|
SLC46A2
|
solute carrier family 46 member 2 |
| chr19_+_44914247 | 0.71 |
ENST00000588750.5
ENST00000588802.5 |
APOC1
|
apolipoprotein C1 |
| chr12_-_81758641 | 0.71 |
ENST00000552948.5
ENST00000548586.5 |
PPFIA2
|
PTPRF interacting protein alpha 2 |
| chr1_+_207496268 | 0.71 |
ENST00000529814.1
|
CR1
|
complement C3b/C4b receptor 1 (Knops blood group) |
| chr2_+_127418420 | 0.70 |
ENST00000234071.8
ENST00000429925.5 ENST00000442644.5 |
PROC
|
protein C, inactivator of coagulation factors Va and VIIIa |
| chr11_+_66278160 | 0.69 |
ENST00000311445.7
ENST00000528852.5 |
CNIH2
|
cornichon family AMPA receptor auxiliary protein 2 |
| chr16_-_800705 | 0.69 |
ENST00000248150.5
|
GNG13
|
G protein subunit gamma 13 |
| chr19_-_43781249 | 0.69 |
ENST00000615047.4
|
KCNN4
|
potassium calcium-activated channel subfamily N member 4 |
| chr12_-_9733292 | 0.69 |
ENST00000621400.4
ENST00000327839.3 |
CLECL1
|
C-type lectin like 1 |
| chr10_-_43267059 | 0.69 |
ENST00000395810.6
|
RASGEF1A
|
RasGEF domain family member 1A |
| chr20_+_833734 | 0.69 |
ENST00000304189.6
|
FAM110A
|
family with sequence similarity 110 member A |
| chr20_-_64079479 | 0.68 |
ENST00000395042.2
|
RGS19
|
regulator of G protein signaling 19 |
| chr8_-_133102874 | 0.68 |
ENST00000395352.7
|
SLA
|
Src like adaptor |
| chr5_+_162067858 | 0.68 |
ENST00000361925.9
|
GABRG2
|
gamma-aminobutyric acid type A receptor subunit gamma2 |
| chr12_-_81758665 | 0.68 |
ENST00000549325.5
ENST00000550584.6 |
PPFIA2
|
PTPRF interacting protein alpha 2 |
| chr3_-_183428580 | 0.68 |
ENST00000328913.8
ENST00000482017.1 |
MCF2L2
|
MCF.2 cell line derived transforming sequence-like 2 |
| chr5_+_174045673 | 0.68 |
ENST00000303177.8
ENST00000519867.5 |
NSG2
|
neuronal vesicle trafficking associated 2 |
| chrX_+_153517626 | 0.67 |
ENST00000263519.5
|
ATP2B3
|
ATPase plasma membrane Ca2+ transporting 3 |
| chr4_-_89837076 | 0.67 |
ENST00000506691.1
|
SNCA
|
synuclein alpha |
| chr20_+_833705 | 0.67 |
ENST00000381941.8
|
FAM110A
|
family with sequence similarity 110 member A |
| chr5_+_162068031 | 0.66 |
ENST00000356592.8
|
GABRG2
|
gamma-aminobutyric acid type A receptor subunit gamma2 |
| chr19_+_1452189 | 0.66 |
ENST00000587149.6
|
APC2
|
APC regulator of WNT signaling pathway 2 |
| chr22_-_50526337 | 0.66 |
ENST00000651490.1
ENST00000543927.6 |
TYMP
SCO2
|
thymidine phosphorylase synthesis of cytochrome C oxidase 2 |
| chr17_-_3557798 | 0.66 |
ENST00000301365.8
ENST00000572519.1 ENST00000576742.6 |
TRPV3
|
transient receptor potential cation channel subfamily V member 3 |
| chr14_+_22501542 | 0.66 |
ENST00000390498.1
|
TRAJ39
|
T cell receptor alpha joining 39 |
| chr5_+_162067990 | 0.66 |
ENST00000641017.1
|
GABRG2
|
gamma-aminobutyric acid type A receptor subunit gamma2 |
| chr6_+_42916046 | 0.66 |
ENST00000304672.6
|
PTCRA
|
pre T cell antigen receptor alpha |
| chr11_+_65833944 | 0.65 |
ENST00000308342.7
|
SNX32
|
sorting nexin 32 |
| chr1_+_154405573 | 0.65 |
ENST00000512471.1
|
IL6R
|
interleukin 6 receptor |
| chr20_+_833781 | 0.65 |
ENST00000381939.1
|
FAM110A
|
family with sequence similarity 110 member A |
| chr19_+_54630960 | 0.65 |
ENST00000396317.5
ENST00000396315.5 |
LILRB1
|
leukocyte immunoglobulin like receptor B1 |
| chr22_+_41976933 | 0.65 |
ENST00000396425.7
|
SEPTIN3
|
septin 3 |
| chr1_-_160579439 | 0.65 |
ENST00000368054.8
ENST00000368048.7 ENST00000311224.8 ENST00000368051.3 ENST00000534968.5 |
CD84
|
CD84 molecule |
| chr5_-_102296260 | 0.65 |
ENST00000310954.7
|
SLCO4C1
|
solute carrier organic anion transporter family member 4C1 |
| chr1_-_150974823 | 0.65 |
ENST00000361419.9
ENST00000368954.10 |
CERS2
|
ceramide synthase 2 |
| chr7_+_142797446 | 0.65 |
ENST00000390419.1
|
TRBJ2-7
|
T cell receptor beta joining 2-7 |
| chr3_-_47578832 | 0.64 |
ENST00000264723.9
ENST00000610462.1 |
CSPG5
|
chondroitin sulfate proteoglycan 5 |
| chr17_-_35089212 | 0.64 |
ENST00000584655.5
ENST00000447669.6 ENST00000315249.11 |
RFFL
|
ring finger and FYVE like domain containing E3 ubiquitin protein ligase |
| chr5_-_132490750 | 0.64 |
ENST00000437654.6
ENST00000245414.9 ENST00000680139.1 ENST00000680352.1 ENST00000679440.1 ENST00000680903.1 |
IRF1
|
interferon regulatory factor 1 |
| chr12_-_89352487 | 0.64 |
ENST00000548755.1
ENST00000279488.8 |
DUSP6
|
dual specificity phosphatase 6 |
| chr7_+_100373458 | 0.63 |
ENST00000453419.5
ENST00000198536.7 ENST00000394000.6 ENST00000350573.2 |
PILRA
|
paired immunoglobin like type 2 receptor alpha |
| chr11_-_6619353 | 0.63 |
ENST00000642892.1
ENST00000645620.1 ENST00000533371.6 ENST00000647152.1 ENST00000644810.1 ENST00000299427.12 ENST00000682424.1 ENST00000644218.1 ENST00000528657.2 ENST00000531754.2 |
TPP1
|
tripeptidyl peptidase 1 |
| chr6_+_71886900 | 0.63 |
ENST00000517960.5
ENST00000518273.5 ENST00000522291.5 ENST00000521978.5 ENST00000520567.5 ENST00000264839.11 |
RIMS1
|
regulating synaptic membrane exocytosis 1 |
| chr2_+_241869722 | 0.63 |
ENST00000343216.3
|
RTP5
|
receptor transporter protein 5 (putative) |
| chr1_+_84078043 | 0.63 |
ENST00000370689.6
ENST00000370688.7 |
PRKACB
|
protein kinase cAMP-activated catalytic subunit beta |
| chr12_-_89630552 | 0.63 |
ENST00000393164.6
|
ATP2B1
|
ATPase plasma membrane Ca2+ transporting 1 |
| chr1_-_150974867 | 0.63 |
ENST00000271688.10
|
CERS2
|
ceramide synthase 2 |
| chr4_-_167234266 | 0.63 |
ENST00000511269.5
ENST00000506697.5 ENST00000512042.1 |
SPOCK3
|
SPARC (osteonectin), cwcv and kazal like domains proteoglycan 3 |
| chr16_+_50279515 | 0.63 |
ENST00000569265.1
|
ADCY7
|
adenylate cyclase 7 |
| chr17_-_81959769 | 0.62 |
ENST00000477214.5
|
NOTUM
|
notum, palmitoleoyl-protein carboxylesterase |
| chr9_+_87497852 | 0.62 |
ENST00000408954.8
|
DAPK1
|
death associated protein kinase 1 |
| chr1_-_241357225 | 0.61 |
ENST00000366565.5
|
RGS7
|
regulator of G protein signaling 7 |
| chr1_+_52633147 | 0.61 |
ENST00000517870.2
|
SHISAL2A
|
shisa like 2A |
| chr11_+_123430259 | 0.61 |
ENST00000533341.3
ENST00000635736.2 |
GRAMD1B
|
GRAM domain containing 1B |
| chr21_-_31344241 | 0.61 |
ENST00000455508.1
|
TIAM1
|
TIAM Rac1 associated GEF 1 |
| chr19_+_44914702 | 0.61 |
ENST00000592885.5
ENST00000589781.1 |
APOC1
|
apolipoprotein C1 |
| chr19_-_58362744 | 0.61 |
ENST00000599109.5
ENST00000311044.8 ENST00000595763.1 ENST00000425453.3 |
ENSG00000268230.5
ZNF497
|
novel transcript zinc finger protein 497 |
| chr11_+_60971777 | 0.61 |
ENST00000542157.5
ENST00000433107.6 ENST00000352009.9 ENST00000452451.6 |
CD6
|
CD6 molecule |
| chr7_-_150801325 | 0.60 |
ENST00000447204.6
|
TMEM176B
|
transmembrane protein 176B |
| chr3_-_180037019 | 0.60 |
ENST00000485199.5
|
PEX5L
|
peroxisomal biogenesis factor 5 like |
| chr9_+_32551670 | 0.60 |
ENST00000450093.3
|
SMIM27
|
small integral membrane protein 27 |
| chr11_-_111449981 | 0.60 |
ENST00000531398.1
|
POU2AF1
|
POU class 2 homeobox associating factor 1 |
| chr14_+_28766755 | 0.60 |
ENST00000313071.7
|
FOXG1
|
forkhead box G1 |
| chr7_+_142349135 | 0.59 |
ENST00000634383.1
|
TRBV6-2
|
T cell receptor beta variable 6-2 |
| chr14_-_23578756 | 0.59 |
ENST00000397118.7
ENST00000356300.9 |
JPH4
|
junctophilin 4 |
| chr3_-_180036770 | 0.59 |
ENST00000263962.12
|
PEX5L
|
peroxisomal biogenesis factor 5 like |
| chr19_+_4304588 | 0.58 |
ENST00000221856.11
|
FSD1
|
fibronectin type III and SPRY domain containing 1 |
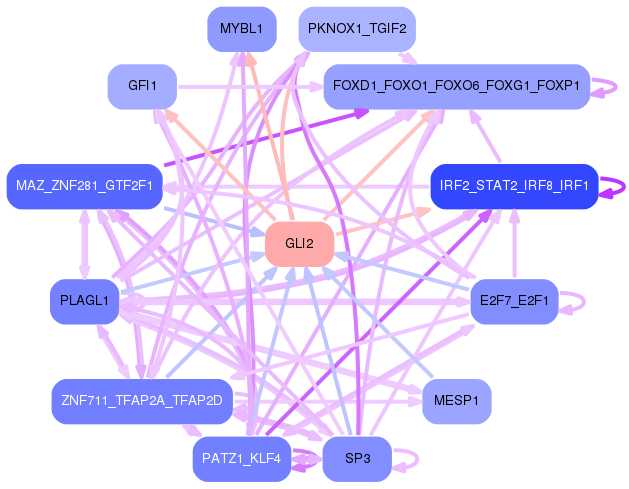
Network of associatons between targets according to the STRING database.

First level regulatory network of GLI2
Gene Ontology Analysis
Gene overrepresentation in biological process category:
| Log-likelihood per target | Total log-likelihood | Term | Description |
|---|---|---|---|
| 0.8 | 3.2 | GO:0010900 | negative regulation of phosphatidylcholine catabolic process(GO:0010900) |
| 0.8 | 2.4 | GO:0045957 | regulation of complement activation, alternative pathway(GO:0030451) negative regulation of complement activation, alternative pathway(GO:0045957) |
| 0.7 | 2.0 | GO:0002818 | intracellular defense response(GO:0002818) |
| 0.6 | 1.8 | GO:0090222 | centrosome-templated microtubule nucleation(GO:0090222) |
| 0.5 | 4.2 | GO:0002774 | Fc receptor mediated inhibitory signaling pathway(GO:0002774) |
| 0.5 | 2.0 | GO:0044537 | regulation of circulating fibrinogen levels(GO:0044537) |
| 0.5 | 1.4 | GO:0015920 | lipopolysaccharide transport(GO:0015920) |
| 0.4 | 1.3 | GO:0042322 | negative regulation of circadian sleep/wake cycle, REM sleep(GO:0042322) negative regulation of energy homeostasis(GO:2000506) |
| 0.4 | 1.7 | GO:0003095 | pressure natriuresis(GO:0003095) |
| 0.4 | 1.2 | GO:0010915 | regulation of very-low-density lipoprotein particle clearance(GO:0010915) negative regulation of very-low-density lipoprotein particle clearance(GO:0010916) |
| 0.4 | 1.2 | GO:0002752 | cell surface pattern recognition receptor signaling pathway(GO:0002752) |
| 0.4 | 1.1 | GO:1903461 | Okazaki fragment processing involved in mitotic DNA replication(GO:1903461) |
| 0.4 | 1.8 | GO:0003366 | cell-matrix adhesion involved in ameboidal cell migration(GO:0003366) |
| 0.4 | 1.1 | GO:0032289 | central nervous system myelin formation(GO:0032289) |
| 0.3 | 1.0 | GO:2000283 | regulation of cellular amine catabolic process(GO:0033241) negative regulation of cellular amine catabolic process(GO:0033242) negative regulation of the force of heart contraction(GO:0098736) regulation of arginine catabolic process(GO:1900081) negative regulation of arginine catabolic process(GO:1900082) regulation of citrulline biosynthetic process(GO:1903248) negative regulation of citrulline biosynthetic process(GO:1903249) negative regulation of cellular amino acid biosynthetic process(GO:2000283) |
| 0.3 | 1.0 | GO:0017186 | peptidyl-pyroglutamic acid biosynthetic process, using glutaminyl-peptide cyclotransferase(GO:0017186) |
| 0.3 | 1.3 | GO:1900148 | Schwann cell proliferation involved in axon regeneration(GO:0014011) negative regulation of Schwann cell migration(GO:1900148) regulation of Schwann cell proliferation involved in axon regeneration(GO:1905044) negative regulation of Schwann cell proliferation involved in axon regeneration(GO:1905045) |
| 0.3 | 1.2 | GO:0010902 | positive regulation of very-low-density lipoprotein particle remodeling(GO:0010902) |
| 0.3 | 0.9 | GO:0019836 | hemolysis by symbiont of host erythrocytes(GO:0019836) hemolysis in other organism(GO:0044179) hemolysis in other organism involved in symbiotic interaction(GO:0052331) |
| 0.3 | 0.9 | GO:0006173 | dADP biosynthetic process(GO:0006173) |
| 0.3 | 0.9 | GO:0019858 | cytosine metabolic process(GO:0019858) |
| 0.3 | 0.9 | GO:0099557 | trans-synaptic signaling by trans-synaptic complex, modulating synaptic transmission(GO:0099557) |
| 0.3 | 0.8 | GO:0070105 | positive regulation of interleukin-6-mediated signaling pathway(GO:0070105) |
| 0.3 | 1.5 | GO:2001107 | negative regulation of establishment of T cell polarity(GO:1903904) negative regulation of Rho guanyl-nucleotide exchange factor activity(GO:2001107) |
| 0.2 | 0.7 | GO:2000502 | negative regulation of natural killer cell chemotaxis(GO:2000502) |
| 0.2 | 2.0 | GO:0010890 | positive regulation of sequestering of triglyceride(GO:0010890) |
| 0.2 | 0.6 | GO:0032701 | negative regulation of interleukin-18 production(GO:0032701) |
| 0.2 | 0.9 | GO:1990926 | short-term synaptic potentiation(GO:1990926) |
| 0.2 | 2.3 | GO:0048102 | autophagic cell death(GO:0048102) |
| 0.2 | 0.8 | GO:0006169 | adenosine salvage(GO:0006169) dATP biosynthetic process(GO:0006175) |
| 0.2 | 1.0 | GO:0002586 | negative regulation of antigen processing and presentation of peptide antigen(GO:0002584) regulation of antigen processing and presentation of peptide antigen via MHC class II(GO:0002586) |
| 0.2 | 0.6 | GO:1990697 | protein depalmitoleylation(GO:1990697) |
| 0.2 | 1.0 | GO:0038169 | hormone-mediated apoptotic signaling pathway(GO:0008628) somatostatin receptor signaling pathway(GO:0038169) somatostatin signaling pathway(GO:0038170) |
| 0.2 | 2.3 | GO:1901660 | calcium ion export(GO:1901660) calcium ion export from cell(GO:1990034) |
| 0.2 | 2.3 | GO:2000582 | regulation of ATP-dependent microtubule motor activity, plus-end-directed(GO:2000580) positive regulation of ATP-dependent microtubule motor activity, plus-end-directed(GO:2000582) |
| 0.2 | 0.6 | GO:1900147 | Schwann cell migration(GO:0036135) regulation of Schwann cell migration(GO:1900147) positive regulation of Schwann cell migration(GO:1900149) regulation of Schwann cell chemotaxis(GO:1904266) positive regulation of Schwann cell chemotaxis(GO:1904268) Schwann cell chemotaxis(GO:1990751) |
| 0.2 | 1.2 | GO:1903282 | negative regulation of dopamine uptake involved in synaptic transmission(GO:0051585) norepinephrine uptake(GO:0051620) regulation of norepinephrine uptake(GO:0051621) negative regulation of norepinephrine uptake(GO:0051622) negative regulation of catecholamine uptake involved in synaptic transmission(GO:0051945) regulation of glutathione peroxidase activity(GO:1903282) positive regulation of glutathione peroxidase activity(GO:1903284) positive regulation of hydrogen peroxide catabolic process(GO:1903285) positive regulation of peroxidase activity(GO:2000470) |
| 0.2 | 0.4 | GO:0043323 | regulation of natural killer cell degranulation(GO:0043321) positive regulation of natural killer cell degranulation(GO:0043323) |
| 0.2 | 1.0 | GO:0002554 | serotonin production involved in inflammatory response(GO:0002351) serotonin secretion involved in inflammatory response(GO:0002442) serotonin secretion by platelet(GO:0002554) |
| 0.2 | 1.0 | GO:0035544 | negative regulation of SNARE complex assembly(GO:0035544) |
| 0.2 | 0.8 | GO:0060024 | rhythmic synaptic transmission(GO:0060024) |
| 0.2 | 0.6 | GO:0035526 | retrograde transport, plasma membrane to Golgi(GO:0035526) |
| 0.2 | 1.1 | GO:0008218 | bioluminescence(GO:0008218) |
| 0.2 | 0.7 | GO:0032831 | regulation of CD4-positive, CD25-positive, alpha-beta regulatory T cell differentiation(GO:0032829) positive regulation of CD4-positive, CD25-positive, alpha-beta regulatory T cell differentiation(GO:0032831) |
| 0.2 | 0.9 | GO:0038155 | interleukin-23-mediated signaling pathway(GO:0038155) |
| 0.2 | 0.7 | GO:1904479 | negative regulation of intestinal absorption(GO:1904479) |
| 0.2 | 1.1 | GO:0032902 | nerve growth factor production(GO:0032902) |
| 0.2 | 1.8 | GO:0016560 | protein import into peroxisome matrix, docking(GO:0016560) |
| 0.2 | 5.1 | GO:0071420 | cellular response to histamine(GO:0071420) |
| 0.2 | 0.5 | GO:0014063 | negative regulation of serotonin secretion(GO:0014063) |
| 0.2 | 0.7 | GO:1902683 | regulation of receptor localization to synapse(GO:1902683) |
| 0.2 | 0.9 | GO:1905225 | response to thyrotropin-releasing hormone(GO:1905225) |
| 0.2 | 0.5 | GO:0006059 | hexitol metabolic process(GO:0006059) |
| 0.2 | 1.7 | GO:0070995 | NADPH oxidation(GO:0070995) |
| 0.2 | 0.7 | GO:0014028 | notochord formation(GO:0014028) |
| 0.2 | 1.1 | GO:0051970 | negative regulation of transmission of nerve impulse(GO:0051970) |
| 0.2 | 0.7 | GO:0002384 | hepatic immune response(GO:0002384) |
| 0.2 | 0.5 | GO:0071529 | cementum mineralization(GO:0071529) |
| 0.2 | 0.9 | GO:0002325 | natural killer cell differentiation involved in immune response(GO:0002325) regulation of natural killer cell differentiation involved in immune response(GO:0032826) regulation of extrathymic T cell differentiation(GO:0033082) |
| 0.2 | 0.5 | GO:2000348 | regulation of CD40 signaling pathway(GO:2000348) |
| 0.2 | 0.9 | GO:0006842 | tricarboxylic acid transport(GO:0006842) citrate transport(GO:0015746) |
| 0.1 | 1.3 | GO:0032511 | late endosome to vacuole transport via multivesicular body sorting pathway(GO:0032511) |
| 0.1 | 1.5 | GO:2001199 | negative regulation of dendritic cell differentiation(GO:2001199) |
| 0.1 | 1.0 | GO:0045079 | negative regulation of chemokine biosynthetic process(GO:0045079) |
| 0.1 | 0.4 | GO:0100009 | circadian temperature homeostasis(GO:0060086) regulation of fever generation by regulation of prostaglandin secretion(GO:0071810) positive regulation of fever generation by positive regulation of prostaglandin secretion(GO:0071812) positive regulation of ERK1 and ERK2 cascade via TNFSF11-mediated signaling(GO:0071848) regulation of fever generation by prostaglandin secretion(GO:0100009) |
| 0.1 | 0.4 | GO:0051083 | 'de novo' cotranslational protein folding(GO:0051083) |
| 0.1 | 0.5 | GO:1990569 | UDP-N-acetylglucosamine transport(GO:0015788) UDP-N-acetylglucosamine transmembrane transport(GO:1990569) |
| 0.1 | 0.4 | GO:0060032 | notochord regression(GO:0060032) |
| 0.1 | 3.5 | GO:0003376 | sphingosine-1-phosphate signaling pathway(GO:0003376) |
| 0.1 | 1.3 | GO:0060244 | negative regulation of cell proliferation involved in contact inhibition(GO:0060244) |
| 0.1 | 0.6 | GO:0042663 | regulation of endodermal cell fate specification(GO:0042663) |
| 0.1 | 0.4 | GO:0015847 | putrescine transport(GO:0015847) |
| 0.1 | 0.4 | GO:2001287 | negative regulation of caveolin-mediated endocytosis(GO:2001287) |
| 0.1 | 0.5 | GO:0060903 | positive regulation of meiosis I(GO:0060903) |
| 0.1 | 0.5 | GO:0045658 | regulation of neutrophil differentiation(GO:0045658) negative regulation of neutrophil differentiation(GO:0045659) |
| 0.1 | 0.5 | GO:0035054 | embryonic heart tube anterior/posterior pattern specification(GO:0035054) |
| 0.1 | 8.3 | GO:0006953 | acute-phase response(GO:0006953) |
| 0.1 | 0.9 | GO:0051490 | negative regulation of filopodium assembly(GO:0051490) |
| 0.1 | 0.6 | GO:2001271 | negative regulation of cysteine-type endopeptidase activity involved in execution phase of apoptosis(GO:2001271) |
| 0.1 | 0.3 | GO:0030221 | basophil differentiation(GO:0030221) |
| 0.1 | 0.5 | GO:0046391 | 5-phosphoribose 1-diphosphate biosynthetic process(GO:0006015) 5-phosphoribose 1-diphosphate metabolic process(GO:0046391) |
| 0.1 | 1.2 | GO:0060136 | embryonic process involved in female pregnancy(GO:0060136) |
| 0.1 | 0.4 | GO:0045085 | negative regulation of interleukin-2 biosynthetic process(GO:0045085) |
| 0.1 | 0.7 | GO:0035234 | ectopic germ cell programmed cell death(GO:0035234) |
| 0.1 | 4.2 | GO:0048268 | clathrin coat assembly(GO:0048268) |
| 0.1 | 0.5 | GO:0046900 | tetrahydrofolylpolyglutamate metabolic process(GO:0046900) |
| 0.1 | 0.3 | GO:0016237 | lysosomal microautophagy(GO:0016237) piecemeal microautophagy of nucleus(GO:0034727) suppression by virus of host autophagy(GO:0039521) |
| 0.1 | 0.6 | GO:0033567 | DNA replication, Okazaki fragment processing(GO:0033567) |
| 0.1 | 0.4 | GO:2001301 | lipoxin biosynthetic process(GO:2001301) lipoxin A4 metabolic process(GO:2001302) lipoxin A4 biosynthetic process(GO:2001303) |
| 0.1 | 0.3 | GO:1905053 | regulation of base-excision repair(GO:1905051) positive regulation of base-excision repair(GO:1905053) |
| 0.1 | 0.7 | GO:1903903 | regulation of establishment of T cell polarity(GO:1903903) |
| 0.1 | 0.3 | GO:0090274 | regulation of somatostatin secretion(GO:0090273) positive regulation of somatostatin secretion(GO:0090274) |
| 0.1 | 0.7 | GO:0042636 | negative regulation of hair cycle(GO:0042636) |
| 0.1 | 0.2 | GO:0060661 | submandibular salivary gland formation(GO:0060661) hair follicle cell proliferation(GO:0071335) regulation of hair follicle cell proliferation(GO:0071336) positive regulation of hair follicle cell proliferation(GO:0071338) |
| 0.1 | 1.2 | GO:0045656 | negative regulation of monocyte differentiation(GO:0045656) |
| 0.1 | 0.3 | GO:0070682 | proteasome regulatory particle assembly(GO:0070682) |
| 0.1 | 0.5 | GO:1900166 | glial cell-derived neurotrophic factor secretion(GO:0044467) positive regulation of dopamine uptake involved in synaptic transmission(GO:0051586) positive regulation of catecholamine uptake involved in synaptic transmission(GO:0051944) regulation of glial cell-derived neurotrophic factor secretion(GO:1900166) positive regulation of glial cell-derived neurotrophic factor secretion(GO:1900168) |
| 0.1 | 0.6 | GO:0045590 | CD8-positive, alpha-beta T cell proliferation(GO:0035740) negative regulation of regulatory T cell differentiation(GO:0045590) regulation of CD8-positive, alpha-beta T cell proliferation(GO:2000564) |
| 0.1 | 2.2 | GO:0002523 | leukocyte migration involved in inflammatory response(GO:0002523) |
| 0.1 | 0.8 | GO:0043314 | negative regulation of neutrophil degranulation(GO:0043314) |
| 0.1 | 0.5 | GO:1900220 | negative regulation of alkaline phosphatase activity(GO:0010693) semaphorin-plexin signaling pathway involved in bone trabecula morphogenesis(GO:1900220) |
| 0.1 | 0.8 | GO:0035494 | SNARE complex disassembly(GO:0035494) |
| 0.1 | 0.2 | GO:0006407 | rRNA export from nucleus(GO:0006407) |
| 0.1 | 0.2 | GO:0070318 | positive regulation of G0 to G1 transition(GO:0070318) |
| 0.1 | 1.0 | GO:0060746 | maternal behavior(GO:0042711) parental behavior(GO:0060746) |
| 0.1 | 0.4 | GO:2000686 | regulation of rubidium ion transmembrane transporter activity(GO:2000686) |
| 0.1 | 1.7 | GO:0019800 | peptide cross-linking via chondroitin 4-sulfate glycosaminoglycan(GO:0019800) |
| 0.1 | 7.4 | GO:0018279 | protein N-linked glycosylation via asparagine(GO:0018279) |
| 0.1 | 0.8 | GO:2000491 | positive regulation of hepatic stellate cell activation(GO:2000491) |
| 0.1 | 0.8 | GO:0001865 | NK T cell differentiation(GO:0001865) |
| 0.1 | 2.4 | GO:0002507 | tolerance induction(GO:0002507) |
| 0.1 | 0.5 | GO:0043606 | histidine catabolic process to glutamate and formamide(GO:0019556) histidine catabolic process to glutamate and formate(GO:0019557) formamide metabolic process(GO:0043606) |
| 0.1 | 1.8 | GO:0036149 | phosphatidylinositol acyl-chain remodeling(GO:0036149) |
| 0.1 | 0.7 | GO:0046087 | cytidine catabolic process(GO:0006216) cytidine deamination(GO:0009972) cytidine metabolic process(GO:0046087) |
| 0.1 | 2.0 | GO:0043383 | negative T cell selection(GO:0043383) |
| 0.1 | 0.4 | GO:0001927 | exocyst assembly(GO:0001927) |
| 0.1 | 0.3 | GO:0006447 | regulation of translational initiation by iron(GO:0006447) |
| 0.1 | 1.0 | GO:0061740 | protein targeting to lysosome involved in chaperone-mediated autophagy(GO:0061740) lysosomal protein catabolic process(GO:1905146) |
| 0.1 | 0.3 | GO:0006478 | peptidyl-tyrosine sulfation(GO:0006478) |
| 0.1 | 0.5 | GO:0071802 | negative regulation of podosome assembly(GO:0071802) |
| 0.1 | 0.3 | GO:0036496 | regulation of translational initiation by eIF2 alpha dephosphorylation(GO:0036496) |
| 0.1 | 0.5 | GO:0046952 | ketone body catabolic process(GO:0046952) |
| 0.1 | 1.3 | GO:0002675 | positive regulation of acute inflammatory response(GO:0002675) |
| 0.1 | 0.2 | GO:2000563 | positive regulation of CD4-positive, alpha-beta T cell proliferation(GO:2000563) |
| 0.1 | 0.6 | GO:0097338 | response to clozapine(GO:0097338) |
| 0.1 | 0.3 | GO:2000182 | regulation of progesterone biosynthetic process(GO:2000182) |
| 0.1 | 0.2 | GO:0000103 | sulfate assimilation(GO:0000103) |
| 0.1 | 0.6 | GO:0021633 | optic nerve structural organization(GO:0021633) |
| 0.1 | 1.2 | GO:1900017 | positive regulation of cytokine production involved in inflammatory response(GO:1900017) |
| 0.1 | 0.6 | GO:0006868 | glutamine transport(GO:0006868) L-cystine transport(GO:0015811) |
| 0.1 | 0.4 | GO:0033489 | cholesterol biosynthetic process via desmosterol(GO:0033489) cholesterol biosynthetic process via lathosterol(GO:0033490) |
| 0.1 | 0.9 | GO:2000271 | positive regulation of fibroblast apoptotic process(GO:2000271) |
| 0.1 | 0.8 | GO:0071285 | cellular response to lithium ion(GO:0071285) |
| 0.1 | 0.8 | GO:1903715 | regulation of aerobic respiration(GO:1903715) |
| 0.1 | 0.2 | GO:0018160 | peptidyl-pyrromethane cofactor linkage(GO:0018160) |
| 0.1 | 0.2 | GO:2001033 | negative regulation of double-strand break repair via nonhomologous end joining(GO:2001033) |
| 0.1 | 0.5 | GO:0006990 | positive regulation of transcription from RNA polymerase II promoter involved in unfolded protein response(GO:0006990) |
| 0.1 | 0.2 | GO:0042732 | D-xylose metabolic process(GO:0042732) |
| 0.1 | 1.0 | GO:0032625 | interleukin-21 production(GO:0032625) interleukin-21 secretion(GO:0072619) |
| 0.1 | 2.0 | GO:1900273 | positive regulation of long-term synaptic potentiation(GO:1900273) |
| 0.1 | 1.1 | GO:0030949 | positive regulation of vascular endothelial growth factor receptor signaling pathway(GO:0030949) |
| 0.1 | 0.9 | GO:0051969 | regulation of transmission of nerve impulse(GO:0051969) |
| 0.1 | 0.5 | GO:0031860 | telomeric 3' overhang formation(GO:0031860) |
| 0.1 | 0.2 | GO:1903567 | negative regulation of protein localization to cilium(GO:1903565) regulation of protein localization to ciliary membrane(GO:1903567) negative regulation of protein localization to ciliary membrane(GO:1903568) |
| 0.1 | 0.3 | GO:0010157 | response to chlorate(GO:0010157) |
| 0.1 | 0.3 | GO:0071072 | negative regulation of phospholipid biosynthetic process(GO:0071072) |
| 0.1 | 0.3 | GO:0097319 | fructose import(GO:0032445) carbohydrate import into cell(GO:0097319) carbohydrate import across plasma membrane(GO:0098704) fructose import across plasma membrane(GO:1990539) |
| 0.1 | 0.5 | GO:0007197 | adenylate cyclase-inhibiting G-protein coupled acetylcholine receptor signaling pathway(GO:0007197) |
| 0.1 | 0.5 | GO:0008063 | Toll signaling pathway(GO:0008063) |
| 0.0 | 0.5 | GO:1902897 | regulation of postsynaptic density protein 95 clustering(GO:1902897) |
| 0.0 | 0.2 | GO:0000711 | meiotic DNA repair synthesis(GO:0000711) |
| 0.0 | 0.6 | GO:0032020 | ISG15-protein conjugation(GO:0032020) |
| 0.0 | 0.6 | GO:0023041 | neuronal signal transduction(GO:0023041) |
| 0.0 | 0.2 | GO:2000255 | negative regulation of male germ cell proliferation(GO:2000255) |
| 0.0 | 0.4 | GO:0034382 | chylomicron remnant clearance(GO:0034382) triglyceride-rich lipoprotein particle clearance(GO:0071830) |
| 0.0 | 0.1 | GO:0036353 | histone H2A-K119 monoubiquitination(GO:0036353) |
| 0.0 | 0.5 | GO:0039663 | fusion of virus membrane with host plasma membrane(GO:0019064) membrane fusion involved in viral entry into host cell(GO:0039663) multi-organism membrane fusion(GO:0044800) |
| 0.0 | 0.2 | GO:1901143 | insulin catabolic process(GO:1901143) |
| 0.0 | 0.9 | GO:0050862 | positive regulation of T cell receptor signaling pathway(GO:0050862) |
| 0.0 | 0.6 | GO:0072383 | plus-end-directed vesicle transport along microtubule(GO:0072383) |
| 0.0 | 0.4 | GO:0051549 | positive regulation of keratinocyte migration(GO:0051549) |
| 0.0 | 0.7 | GO:0006032 | chitin metabolic process(GO:0006030) chitin catabolic process(GO:0006032) |
| 0.0 | 0.4 | GO:0007217 | tachykinin receptor signaling pathway(GO:0007217) |
| 0.0 | 0.7 | GO:0007144 | female meiosis I(GO:0007144) |
| 0.0 | 0.1 | GO:0001545 | primary ovarian follicle growth(GO:0001545) |
| 0.0 | 0.3 | GO:1903382 | neuron intrinsic apoptotic signaling pathway in response to endoplasmic reticulum stress(GO:0036483) regulation of endoplasmic reticulum stress-induced neuron intrinsic apoptotic signaling pathway(GO:1903381) negative regulation of endoplasmic reticulum stress-induced neuron intrinsic apoptotic signaling pathway(GO:1903382) |
| 0.0 | 0.4 | GO:0006398 | mRNA 3'-end processing by stem-loop binding and cleavage(GO:0006398) |
| 0.0 | 0.8 | GO:0016540 | protein autoprocessing(GO:0016540) |
| 0.0 | 0.8 | GO:0034435 | steroid esterification(GO:0034433) sterol esterification(GO:0034434) cholesterol esterification(GO:0034435) |
| 0.0 | 0.4 | GO:0002943 | tRNA dihydrouridine synthesis(GO:0002943) |
| 0.0 | 0.1 | GO:0061182 | negative regulation of chondrocyte development(GO:0061182) |
| 0.0 | 0.5 | GO:0042276 | error-prone translesion synthesis(GO:0042276) |
| 0.0 | 0.9 | GO:2001256 | regulation of store-operated calcium entry(GO:2001256) |
| 0.0 | 0.8 | GO:0050812 | regulation of acyl-CoA biosynthetic process(GO:0050812) |
| 0.0 | 0.2 | GO:0032237 | activation of store-operated calcium channel activity(GO:0032237) positive regulation of store-operated calcium channel activity(GO:1901341) |
| 0.0 | 0.2 | GO:0001555 | oocyte growth(GO:0001555) |
| 0.0 | 0.2 | GO:0061386 | closure of optic fissure(GO:0061386) |
| 0.0 | 0.9 | GO:0030497 | fatty acid elongation(GO:0030497) |
| 0.0 | 0.2 | GO:0098838 | reduced folate transmembrane transport(GO:0098838) |
| 0.0 | 1.2 | GO:0071447 | cellular response to hydroperoxide(GO:0071447) |
| 0.0 | 1.1 | GO:2001135 | regulation of endocytic recycling(GO:2001135) |
| 0.0 | 0.4 | GO:0099566 | regulation of postsynaptic cytosolic calcium ion concentration(GO:0099566) |
| 0.0 | 1.0 | GO:0097151 | positive regulation of inhibitory postsynaptic potential(GO:0097151) modulation of inhibitory postsynaptic potential(GO:0098828) |
| 0.0 | 0.5 | GO:0045647 | negative regulation of erythrocyte differentiation(GO:0045647) |
| 0.0 | 0.1 | GO:0009305 | protein biotinylation(GO:0009305) histone biotinylation(GO:0071110) |
| 0.0 | 1.2 | GO:0070987 | error-free translesion synthesis(GO:0070987) |
| 0.0 | 0.1 | GO:0042144 | vacuole fusion, non-autophagic(GO:0042144) |
| 0.0 | 0.6 | GO:0030208 | dermatan sulfate biosynthetic process(GO:0030208) |
| 0.0 | 0.5 | GO:1900028 | negative regulation of ruffle assembly(GO:1900028) |
| 0.0 | 0.9 | GO:0048172 | regulation of short-term neuronal synaptic plasticity(GO:0048172) |
| 0.0 | 0.6 | GO:0034587 | piRNA metabolic process(GO:0034587) |
| 0.0 | 0.2 | GO:0070889 | mRNA localization resulting in posttranscriptional regulation of gene expression(GO:0010609) platelet alpha granule organization(GO:0070889) regulation of DNA damage response, signal transduction by p53 class mediator resulting in transcription of p21 class mediator(GO:1902162) positive regulation of DNA damage response, signal transduction by p53 class mediator resulting in transcription of p21 class mediator(GO:1902164) |
| 0.0 | 0.1 | GO:0036255 | response to methylamine(GO:0036255) response to lipoic acid(GO:1903442) |
| 0.0 | 0.5 | GO:0043248 | proteasome assembly(GO:0043248) |
| 0.0 | 0.1 | GO:0044828 | negative regulation by host of viral genome replication(GO:0044828) |
| 0.0 | 0.3 | GO:0030472 | mitotic spindle organization in nucleus(GO:0030472) |
| 0.0 | 0.2 | GO:0034472 | snRNA 3'-end processing(GO:0034472) |
| 0.0 | 4.8 | GO:0006614 | SRP-dependent cotranslational protein targeting to membrane(GO:0006614) |
| 0.0 | 0.1 | GO:0035281 | pre-miRNA export from nucleus(GO:0035281) |
| 0.0 | 0.2 | GO:0034128 | negative regulation of MyD88-independent toll-like receptor signaling pathway(GO:0034128) |
| 0.0 | 0.7 | GO:0010991 | regulation of SMAD protein complex assembly(GO:0010990) negative regulation of SMAD protein complex assembly(GO:0010991) |
| 0.0 | 0.4 | GO:0010529 | regulation of transposition(GO:0010528) negative regulation of transposition(GO:0010529) |
| 0.0 | 0.2 | GO:0038172 | interleukin-33-mediated signaling pathway(GO:0038172) |
| 0.0 | 0.6 | GO:0071361 | cellular response to ethanol(GO:0071361) |
| 0.0 | 0.4 | GO:0017187 | peptidyl-glutamic acid carboxylation(GO:0017187) protein carboxylation(GO:0018214) |
| 0.0 | 1.1 | GO:0007214 | gamma-aminobutyric acid signaling pathway(GO:0007214) |
| 0.0 | 0.7 | GO:0021692 | cerebellar Purkinje cell layer morphogenesis(GO:0021692) |
| 0.0 | 0.5 | GO:0060732 | positive regulation of inositol phosphate biosynthetic process(GO:0060732) |
| 0.0 | 0.8 | GO:0035988 | chondrocyte proliferation(GO:0035988) |
| 0.0 | 0.1 | GO:0032804 | negative regulation of low-density lipoprotein particle receptor catabolic process(GO:0032804) |
| 0.0 | 0.1 | GO:0072365 | regulation of cellular ketone metabolic process by negative regulation of transcription from RNA polymerase II promoter(GO:0072365) |
| 0.0 | 0.7 | GO:0007597 | blood coagulation, intrinsic pathway(GO:0007597) |
| 0.0 | 0.1 | GO:0097252 | oligodendrocyte apoptotic process(GO:0097252) |
| 0.0 | 1.0 | GO:0007628 | adult walking behavior(GO:0007628) |
| 0.0 | 0.1 | GO:0060708 | spongiotrophoblast differentiation(GO:0060708) |
| 0.0 | 0.4 | GO:2000311 | regulation of alpha-amino-3-hydroxy-5-methyl-4-isoxazole propionate selective glutamate receptor activity(GO:2000311) |
| 0.0 | 0.7 | GO:0006853 | carnitine shuttle(GO:0006853) |
| 0.0 | 0.2 | GO:0051792 | medium-chain fatty acid biosynthetic process(GO:0051792) |
| 0.0 | 0.3 | GO:0090494 | dopamine uptake involved in synaptic transmission(GO:0051583) catecholamine uptake involved in synaptic transmission(GO:0051934) catecholamine uptake(GO:0090493) dopamine uptake(GO:0090494) |
| 0.0 | 2.6 | GO:0006968 | cellular defense response(GO:0006968) |
| 0.0 | 0.2 | GO:0071442 | positive regulation of histone H3-K14 acetylation(GO:0071442) |
| 0.0 | 0.3 | GO:0042759 | long-chain fatty acid biosynthetic process(GO:0042759) |
| 0.0 | 0.3 | GO:0007196 | adenylate cyclase-inhibiting G-protein coupled glutamate receptor signaling pathway(GO:0007196) |
| 0.0 | 0.5 | GO:0030150 | protein import into mitochondrial matrix(GO:0030150) |
| 0.0 | 0.9 | GO:0097320 | membrane tubulation(GO:0097320) |
| 0.0 | 1.4 | GO:0008089 | anterograde axonal transport(GO:0008089) |
| 0.0 | 0.9 | GO:0009235 | cobalamin metabolic process(GO:0009235) |
| 0.0 | 0.4 | GO:0038203 | TORC2 signaling(GO:0038203) |
| 0.0 | 0.7 | GO:0035414 | negative regulation of catenin import into nucleus(GO:0035414) |
| 0.0 | 0.1 | GO:0090070 | positive regulation of ribosome biogenesis(GO:0090070) positive regulation of rRNA processing(GO:2000234) |
| 0.0 | 0.3 | GO:1900113 | negative regulation of histone H3-K9 trimethylation(GO:1900113) |
| 0.0 | 0.3 | GO:0031987 | locomotion involved in locomotory behavior(GO:0031987) |
| 0.0 | 0.1 | GO:0036451 | cap mRNA methylation(GO:0036451) |
| 0.0 | 0.4 | GO:0036010 | protein localization to endosome(GO:0036010) |
| 0.0 | 0.5 | GO:0090073 | positive regulation of protein homodimerization activity(GO:0090073) |
| 0.0 | 0.9 | GO:0032986 | nucleosome disassembly(GO:0006337) protein-DNA complex disassembly(GO:0032986) |
| 0.0 | 0.3 | GO:0000414 | regulation of histone H3-K36 methylation(GO:0000414) |
| 0.0 | 0.1 | GO:0002143 | tRNA wobble position uridine thiolation(GO:0002143) |
| 0.0 | 0.3 | GO:0051177 | meiotic sister chromatid cohesion(GO:0051177) |
| 0.0 | 0.5 | GO:0071294 | cellular response to zinc ion(GO:0071294) |
| 0.0 | 0.1 | GO:0071418 | cellular response to amine stimulus(GO:0071418) |
| 0.0 | 2.2 | GO:0071349 | interleukin-12-mediated signaling pathway(GO:0035722) cellular response to interleukin-12(GO:0071349) |
| 0.0 | 0.5 | GO:0090023 | positive regulation of neutrophil chemotaxis(GO:0090023) |
| 0.0 | 0.2 | GO:0001867 | complement activation, lectin pathway(GO:0001867) |
| 0.0 | 0.7 | GO:0090129 | positive regulation of synapse maturation(GO:0090129) |
| 0.0 | 0.6 | GO:0070933 | histone H4 deacetylation(GO:0070933) |
| 0.0 | 0.4 | GO:0071481 | cellular response to X-ray(GO:0071481) |
| 0.0 | 0.5 | GO:0035518 | histone H2A monoubiquitination(GO:0035518) |
| 0.0 | 0.1 | GO:0006121 | mitochondrial electron transport, succinate to ubiquinone(GO:0006121) |
| 0.0 | 0.4 | GO:0090344 | negative regulation of cell aging(GO:0090344) |
| 0.0 | 0.2 | GO:0017183 | peptidyl-diphthamide metabolic process(GO:0017182) peptidyl-diphthamide biosynthetic process from peptidyl-histidine(GO:0017183) |
| 0.0 | 0.6 | GO:0031115 | negative regulation of microtubule polymerization(GO:0031115) |
| 0.0 | 0.3 | GO:0018095 | protein polyglutamylation(GO:0018095) |
| 0.0 | 0.2 | GO:0072321 | chaperone-mediated protein transport(GO:0072321) |
| 0.0 | 0.3 | GO:0016191 | synaptic vesicle uncoating(GO:0016191) cellular response to brain-derived neurotrophic factor stimulus(GO:1990416) |
| 0.0 | 1.0 | GO:0043928 | exonucleolytic nuclear-transcribed mRNA catabolic process involved in deadenylation-dependent decay(GO:0043928) |
| 0.0 | 0.2 | GO:0043569 | negative regulation of insulin-like growth factor receptor signaling pathway(GO:0043569) |
| 0.0 | 0.2 | GO:0021520 | spinal cord motor neuron cell fate specification(GO:0021520) |
| 0.0 | 0.1 | GO:0010587 | miRNA catabolic process(GO:0010587) |
| 0.0 | 0.1 | GO:0006050 | mannosamine metabolic process(GO:0006050) N-acetylmannosamine metabolic process(GO:0006051) |
| 0.0 | 0.2 | GO:0043951 | negative regulation of cAMP-mediated signaling(GO:0043951) |
| 0.0 | 1.3 | GO:0014047 | glutamate secretion(GO:0014047) |
| 0.0 | 0.2 | GO:2001241 | positive regulation of extrinsic apoptotic signaling pathway in absence of ligand(GO:2001241) |
| 0.0 | 0.5 | GO:0032717 | negative regulation of interleukin-8 production(GO:0032717) |
| 0.0 | 0.3 | GO:0008635 | activation of cysteine-type endopeptidase activity involved in apoptotic process by cytochrome c(GO:0008635) |
| 0.0 | 0.1 | GO:0000480 | endonucleolytic cleavage in 5'-ETS of tricistronic rRNA transcript (SSU-rRNA, 5.8S rRNA, LSU-rRNA)(GO:0000480) |
| 0.0 | 0.2 | GO:0006477 | protein sulfation(GO:0006477) |
| 0.0 | 1.4 | GO:0072384 | organelle transport along microtubule(GO:0072384) |
| 0.0 | 0.1 | GO:0018101 | protein citrullination(GO:0018101) histone citrullination(GO:0036414) |
| 0.0 | 0.3 | GO:0051315 | attachment of mitotic spindle microtubules to kinetochore(GO:0051315) |
| 0.0 | 0.3 | GO:0046548 | retinal rod cell development(GO:0046548) |
| 0.0 | 0.7 | GO:0001580 | detection of chemical stimulus involved in sensory perception of bitter taste(GO:0001580) |
| 0.0 | 0.1 | GO:1902473 | regulation of protein localization to synapse(GO:1902473) |
| 0.0 | 0.3 | GO:0070307 | lens fiber cell development(GO:0070307) |
| 0.0 | 0.5 | GO:0006517 | protein deglycosylation(GO:0006517) |
| 0.0 | 0.6 | GO:0016572 | histone phosphorylation(GO:0016572) |
| 0.0 | 0.1 | GO:0035511 | oxidative DNA demethylation(GO:0035511) |
| 0.0 | 0.1 | GO:0006127 | glycerophosphate shuttle(GO:0006127) |
| 0.0 | 0.1 | GO:0050915 | sensory perception of sour taste(GO:0050915) |
| 0.0 | 0.1 | GO:0060040 | retinal bipolar neuron differentiation(GO:0060040) |
| 0.0 | 0.7 | GO:0045841 | negative regulation of mitotic metaphase/anaphase transition(GO:0045841) |
| 0.0 | 0.1 | GO:0033615 | mitochondrial proton-transporting ATP synthase complex assembly(GO:0033615) |
| 0.0 | 2.1 | GO:0035308 | negative regulation of protein dephosphorylation(GO:0035308) |
| 0.0 | 0.6 | GO:0035235 | ionotropic glutamate receptor signaling pathway(GO:0035235) |
| 0.0 | 0.2 | GO:0035269 | protein O-linked mannosylation(GO:0035269) |
| 0.0 | 0.2 | GO:0008340 | determination of adult lifespan(GO:0008340) |
| 0.0 | 0.7 | GO:0018345 | protein palmitoylation(GO:0018345) |
| 0.0 | 0.9 | GO:0048791 | calcium ion-regulated exocytosis of neurotransmitter(GO:0048791) |
| 0.0 | 0.1 | GO:0044752 | response to human chorionic gonadotropin(GO:0044752) |
| 0.0 | 0.2 | GO:0033327 | Leydig cell differentiation(GO:0033327) |
| 0.0 | 0.1 | GO:0042797 | 5S class rRNA transcription from RNA polymerase III type 1 promoter(GO:0042791) tRNA transcription from RNA polymerase III promoter(GO:0042797) |
| 0.0 | 0.3 | GO:0006068 | ethanol catabolic process(GO:0006068) |
| 0.0 | 0.9 | GO:0034260 | negative regulation of GTPase activity(GO:0034260) |
| 0.0 | 0.2 | GO:0009249 | protein lipoylation(GO:0009249) |
| 0.0 | 0.1 | GO:1903412 | response to bile acid(GO:1903412) |
| 0.0 | 0.2 | GO:0070544 | histone H3-K36 demethylation(GO:0070544) |
| 0.0 | 0.1 | GO:0000432 | regulation of transcription from RNA polymerase II promoter by glucose(GO:0000430) positive regulation of transcription from RNA polymerase II promoter by glucose(GO:0000432) positive regulation of transcription by glucose(GO:0046016) |
| 0.0 | 0.3 | GO:0007220 | Notch receptor processing(GO:0007220) |
| 0.0 | 0.3 | GO:0006703 | estrogen biosynthetic process(GO:0006703) |
| 0.0 | 0.2 | GO:0098582 | innate vocalization behavior(GO:0098582) |
| 0.0 | 0.4 | GO:0045332 | phospholipid translocation(GO:0045332) |
| 0.0 | 0.3 | GO:0097150 | neuronal stem cell population maintenance(GO:0097150) |
| 0.0 | 1.4 | GO:0038083 | peptidyl-tyrosine autophosphorylation(GO:0038083) |
| 0.0 | 0.1 | GO:0071460 | cellular response to cell-matrix adhesion(GO:0071460) |
| 0.0 | 0.8 | GO:0002260 | lymphocyte homeostasis(GO:0002260) |
| 0.0 | 0.3 | GO:1902894 | negative regulation of pri-miRNA transcription from RNA polymerase II promoter(GO:1902894) |
| 0.0 | 0.3 | GO:0045063 | T-helper 1 cell differentiation(GO:0045063) |
| 0.0 | 0.8 | GO:0010470 | regulation of gastrulation(GO:0010470) |
| 0.0 | 0.1 | GO:0097428 | protein maturation by iron-sulfur cluster transfer(GO:0097428) |
| 0.0 | 0.1 | GO:0032482 | Rab protein signal transduction(GO:0032482) |
| 0.0 | 0.0 | GO:0048073 | regulation of eye pigmentation(GO:0048073) |
| 0.0 | 0.1 | GO:0043045 | DNA methylation involved in embryo development(GO:0043045) changes to DNA methylation involved in embryo development(GO:1901538) |
| 0.0 | 0.2 | GO:0046784 | viral mRNA export from host cell nucleus(GO:0046784) |
| 0.0 | 0.1 | GO:0015781 | pyrimidine nucleotide-sugar transport(GO:0015781) |
| 0.0 | 0.2 | GO:0045636 | positive regulation of melanocyte differentiation(GO:0045636) positive regulation of developmental pigmentation(GO:0048087) positive regulation of pigment cell differentiation(GO:0050942) |
| 0.0 | 0.1 | GO:0007256 | activation of JNKK activity(GO:0007256) |
| 0.0 | 0.2 | GO:0006450 | regulation of translational fidelity(GO:0006450) |
| 0.0 | 0.0 | GO:0019262 | N-acetylneuraminate catabolic process(GO:0019262) |
| 0.0 | 0.8 | GO:0007040 | lysosome organization(GO:0007040) lytic vacuole organization(GO:0080171) |
| 0.0 | 0.2 | GO:0018026 | peptidyl-lysine monomethylation(GO:0018026) |
| 0.0 | 0.5 | GO:0050690 | regulation of defense response to virus by virus(GO:0050690) |
| 0.0 | 0.2 | GO:0090161 | Golgi ribbon formation(GO:0090161) |
| 0.0 | 1.2 | GO:0046847 | filopodium assembly(GO:0046847) |
| 0.0 | 0.3 | GO:0048536 | spleen development(GO:0048536) |
| 0.0 | 0.2 | GO:0008228 | opsonization(GO:0008228) |
Gene overrepresentation in cellular component category:
| Log-likelihood per target | Total log-likelihood | Term | Description |
|---|---|---|---|
| 0.4 | 1.1 | GO:0071062 | alphav-beta3 integrin-vitronectin complex(GO:0071062) |
| 0.4 | 1.8 | GO:0034669 | integrin alpha4-beta7 complex(GO:0034669) |
| 0.3 | 2.7 | GO:0097129 | cyclin D2-CDK4 complex(GO:0097129) |
| 0.3 | 2.0 | GO:0097013 | phagocytic vesicle lumen(GO:0097013) |
| 0.3 | 0.9 | GO:0042022 | interleukin-12 receptor complex(GO:0042022) |
| 0.3 | 2.2 | GO:0034688 | integrin alphaM-beta2 complex(GO:0034688) |
| 0.3 | 1.1 | GO:0035354 | Toll-like receptor 1-Toll-like receptor 2 protein complex(GO:0035354) |
| 0.3 | 1.0 | GO:0042613 | MHC class II protein complex(GO:0042613) |
| 0.3 | 1.0 | GO:0097636 | intrinsic component of autophagosome membrane(GO:0097636) integral component of autophagosome membrane(GO:0097637) |
| 0.2 | 7.2 | GO:0042627 | chylomicron(GO:0042627) |
| 0.2 | 1.7 | GO:1990031 | pinceau fiber(GO:1990031) |
| 0.2 | 0.6 | GO:0002947 | tumor necrosis factor receptor superfamily complex(GO:0002947) |
| 0.2 | 1.2 | GO:0031232 | extrinsic component of external side of plasma membrane(GO:0031232) |
| 0.2 | 0.9 | GO:0044279 | other organism cell membrane(GO:0044218) other organism membrane(GO:0044279) |
| 0.2 | 7.8 | GO:1902711 | GABA-A receptor complex(GO:1902711) |
| 0.2 | 0.6 | GO:0008537 | proteasome activator complex(GO:0008537) |
| 0.2 | 2.6 | GO:0044327 | dendritic spine head(GO:0044327) |
| 0.1 | 0.5 | GO:0002189 | ribose phosphate diphosphokinase complex(GO:0002189) |
| 0.1 | 1.5 | GO:0060171 | stereocilium membrane(GO:0060171) |
| 0.1 | 0.9 | GO:0070032 | synaptobrevin 2-SNAP-25-syntaxin-1a-complexin I complex(GO:0070032) |
| 0.1 | 0.6 | GO:0038039 | G-protein coupled receptor heterodimeric complex(GO:0038039) |
| 0.1 | 2.8 | GO:0097539 | ciliary transition fiber(GO:0097539) |
| 0.1 | 0.7 | GO:0005896 | interleukin-6 receptor complex(GO:0005896) |
| 0.1 | 0.3 | GO:0034657 | GID complex(GO:0034657) |
| 0.1 | 0.4 | GO:0030895 | apolipoprotein B mRNA editing enzyme complex(GO:0030895) |
| 0.1 | 0.9 | GO:0005638 | lamin filament(GO:0005638) |
| 0.1 | 0.9 | GO:0097255 | R2TP complex(GO:0097255) |
| 0.1 | 9.4 | GO:0030134 | ER to Golgi transport vesicle(GO:0030134) |
| 0.1 | 9.0 | GO:0101003 | ficolin-1-rich granule membrane(GO:0101003) |
| 0.1 | 0.9 | GO:0030314 | junctional membrane complex(GO:0030314) |
| 0.1 | 1.2 | GO:0044233 | ER-mitochondrion membrane contact site(GO:0044233) |
| 0.1 | 0.7 | GO:0043190 | ATP-binding cassette (ABC) transporter complex(GO:0043190) |
| 0.1 | 0.6 | GO:0000798 | nuclear cohesin complex(GO:0000798) |
| 0.1 | 0.3 | GO:0035841 | growing cell tip(GO:0035838) new growing cell tip(GO:0035841) |
| 0.1 | 0.4 | GO:0071546 | pi-body(GO:0071546) |
| 0.1 | 0.9 | GO:0008290 | F-actin capping protein complex(GO:0008290) |
| 0.1 | 0.2 | GO:1990923 | PET complex(GO:1990923) |
| 0.1 | 1.2 | GO:0008091 | spectrin(GO:0008091) |
| 0.1 | 0.3 | GO:0005958 | DNA-dependent protein kinase-DNA ligase 4 complex(GO:0005958) DNA ligase IV complex(GO:0032807) |
| 0.1 | 4.1 | GO:0022627 | cytosolic small ribosomal subunit(GO:0022627) |
| 0.0 | 0.2 | GO:0033596 | TSC1-TSC2 complex(GO:0033596) |
| 0.0 | 0.9 | GO:0043240 | Fanconi anaemia nuclear complex(GO:0043240) |
| 0.0 | 0.8 | GO:0030015 | CCR4-NOT core complex(GO:0030015) |
| 0.0 | 0.5 | GO:0098559 | cytoplasmic side of early endosome membrane(GO:0098559) |
| 0.0 | 0.8 | GO:0016342 | catenin complex(GO:0016342) |
| 0.0 | 0.3 | GO:0008622 | epsilon DNA polymerase complex(GO:0008622) |
| 0.0 | 0.1 | GO:0030689 | Noc complex(GO:0030689) |
| 0.0 | 0.5 | GO:0034385 | very-low-density lipoprotein particle(GO:0034361) triglyceride-rich lipoprotein particle(GO:0034385) |
| 0.0 | 0.2 | GO:0001405 | presequence translocase-associated import motor(GO:0001405) |
| 0.0 | 0.2 | GO:0000818 | nuclear MIS12/MIND complex(GO:0000818) |
| 0.0 | 0.8 | GO:0016600 | flotillin complex(GO:0016600) |
| 0.0 | 0.2 | GO:0070761 | pre-snoRNP complex(GO:0070761) |
| 0.0 | 0.2 | GO:0034753 | nuclear aryl hydrocarbon receptor complex(GO:0034753) |
| 0.0 | 2.5 | GO:0048786 | presynaptic active zone(GO:0048786) |
| 0.0 | 0.2 | GO:0002945 | cyclin K-CDK13 complex(GO:0002945) |
| 0.0 | 1.2 | GO:0042101 | T cell receptor complex(GO:0042101) |
| 0.0 | 1.9 | GO:0008180 | COP9 signalosome(GO:0008180) |
| 0.0 | 1.5 | GO:0044295 | axonal growth cone(GO:0044295) |
| 0.0 | 0.6 | GO:0033010 | paranodal junction(GO:0033010) |
| 0.0 | 0.3 | GO:0070765 | gamma-secretase complex(GO:0070765) |
| 0.0 | 0.6 | GO:0005952 | cAMP-dependent protein kinase complex(GO:0005952) |
| 0.0 | 0.3 | GO:0005663 | DNA replication factor C complex(GO:0005663) |
| 0.0 | 0.1 | GO:0042565 | RNA nuclear export complex(GO:0042565) |
| 0.0 | 0.3 | GO:0030688 | preribosome, small subunit precursor(GO:0030688) |
| 0.0 | 1.0 | GO:0005639 | integral component of nuclear inner membrane(GO:0005639) intrinsic component of nuclear inner membrane(GO:0031229) |
| 0.0 | 0.7 | GO:0031588 | nucleotide-activated protein kinase complex(GO:0031588) |
| 0.0 | 0.6 | GO:0032591 | dendritic spine membrane(GO:0032591) |
| 0.0 | 0.3 | GO:0005742 | mitochondrial outer membrane translocase complex(GO:0005742) |
| 0.0 | 0.1 | GO:1990667 | PCSK9-AnxA2 complex(GO:1990667) |
| 0.0 | 2.5 | GO:0035580 | specific granule lumen(GO:0035580) |
| 0.0 | 1.3 | GO:0071437 | invadopodium(GO:0071437) |
| 0.0 | 1.5 | GO:0005640 | nuclear outer membrane(GO:0005640) |
| 0.0 | 0.5 | GO:0008074 | guanylate cyclase complex, soluble(GO:0008074) |
| 0.0 | 3.9 | GO:0005796 | Golgi lumen(GO:0005796) |
| 0.0 | 0.6 | GO:0005662 | DNA replication factor A complex(GO:0005662) |
| 0.0 | 0.9 | GO:0031143 | pseudopodium(GO:0031143) |
| 0.0 | 1.2 | GO:0080008 | Cul4-RING E3 ubiquitin ligase complex(GO:0080008) |
| 0.0 | 0.1 | GO:0016035 | zeta DNA polymerase complex(GO:0016035) |
| 0.0 | 0.6 | GO:0033270 | paranode region of axon(GO:0033270) |
| 0.0 | 0.4 | GO:0034663 | endoplasmic reticulum chaperone complex(GO:0034663) |
| 0.0 | 0.2 | GO:0042719 | mitochondrial intermembrane space protein transporter complex(GO:0042719) |
| 0.0 | 0.5 | GO:0005847 | mRNA cleavage and polyadenylation specificity factor complex(GO:0005847) |
| 0.0 | 0.3 | GO:0016602 | CCAAT-binding factor complex(GO:0016602) |
| 0.0 | 0.7 | GO:0030056 | hemidesmosome(GO:0030056) |
| 0.0 | 1.0 | GO:0097228 | sperm principal piece(GO:0097228) |
| 0.0 | 1.7 | GO:0005834 | heterotrimeric G-protein complex(GO:0005834) |
| 0.0 | 0.5 | GO:0032585 | multivesicular body membrane(GO:0032585) |
| 0.0 | 0.4 | GO:0005885 | Arp2/3 protein complex(GO:0005885) |
| 0.0 | 0.2 | GO:0031597 | cytosolic proteasome complex(GO:0031597) |
| 0.0 | 0.7 | GO:0001891 | phagocytic cup(GO:0001891) |
| 0.0 | 0.1 | GO:0005960 | glycine cleavage complex(GO:0005960) |
| 0.0 | 0.5 | GO:0098576 | lumenal side of membrane(GO:0098576) |
| 0.0 | 0.3 | GO:0044666 | MLL3/4 complex(GO:0044666) |
| 0.0 | 0.1 | GO:0070847 | core mediator complex(GO:0070847) |
| 0.0 | 0.2 | GO:0070449 | elongin complex(GO:0070449) |
| 0.0 | 0.9 | GO:0016514 | SWI/SNF complex(GO:0016514) |
| 0.0 | 0.4 | GO:0030131 | clathrin adaptor complex(GO:0030131) |
| 0.0 | 0.2 | GO:0005890 | sodium:potassium-exchanging ATPase complex(GO:0005890) |
| 0.0 | 2.1 | GO:0008328 | ionotropic glutamate receptor complex(GO:0008328) neurotransmitter receptor complex(GO:0098878) |
| 0.0 | 0.1 | GO:0032444 | activin responsive factor complex(GO:0032444) |
| 0.0 | 0.4 | GO:0031932 | TORC2 complex(GO:0031932) |
| 0.0 | 0.1 | GO:0005749 | mitochondrial respiratory chain complex II, succinate dehydrogenase complex (ubiquinone)(GO:0005749) succinate dehydrogenase complex (ubiquinone)(GO:0045257) respiratory chain complex II(GO:0045273) succinate dehydrogenase complex(GO:0045281) fumarate reductase complex(GO:0045283) |
| 0.0 | 0.1 | GO:0042589 | zymogen granule membrane(GO:0042589) |
| 0.0 | 0.2 | GO:0090543 | Flemming body(GO:0090543) |
| 0.0 | 1.3 | GO:1904115 | axon cytoplasm(GO:1904115) |
| 0.0 | 0.3 | GO:0008540 | proteasome regulatory particle, base subcomplex(GO:0008540) |
| 0.0 | 1.2 | GO:0035577 | azurophil granule membrane(GO:0035577) |
| 0.0 | 0.2 | GO:0000445 | THO complex(GO:0000347) THO complex part of transcription export complex(GO:0000445) |
| 0.0 | 0.6 | GO:0043596 | nuclear replication fork(GO:0043596) |
| 0.0 | 0.3 | GO:0072357 | PTW/PP1 phosphatase complex(GO:0072357) |
| 0.0 | 0.1 | GO:0001739 | sex chromatin(GO:0001739) |
| 0.0 | 0.9 | GO:0045171 | intercellular bridge(GO:0045171) |
| 0.0 | 0.5 | GO:1990124 | messenger ribonucleoprotein complex(GO:1990124) |
| 0.0 | 0.2 | GO:0000322 | storage vacuole(GO:0000322) |
| 0.0 | 0.1 | GO:0000127 | transcription factor TFIIIC complex(GO:0000127) |
| 0.0 | 0.2 | GO:0097225 | sperm midpiece(GO:0097225) |
| 0.0 | 0.1 | GO:0009331 | glycerol-3-phosphate dehydrogenase complex(GO:0009331) |
| 0.0 | 0.1 | GO:0071817 | MMXD complex(GO:0071817) |
| 0.0 | 0.2 | GO:0035748 | myelin sheath abaxonal region(GO:0035748) |
| 0.0 | 0.4 | GO:0005682 | U5 snRNP(GO:0005682) |
| 0.0 | 0.2 | GO:0042788 | polysomal ribosome(GO:0042788) |
| 0.0 | 0.1 | GO:0071942 | XPC complex(GO:0071942) |
| 0.0 | 0.2 | GO:0005686 | U2 snRNP(GO:0005686) |
| 0.0 | 1.9 | GO:0005905 | clathrin-coated pit(GO:0005905) |
| 0.0 | 0.1 | GO:0070695 | FHF complex(GO:0070695) |
| 0.0 | 0.8 | GO:0031201 | SNARE complex(GO:0031201) |
| 0.0 | 0.8 | GO:0070821 | tertiary granule membrane(GO:0070821) |
| 0.0 | 0.4 | GO:0000145 | exocyst(GO:0000145) |
| 0.0 | 1.5 | GO:0005901 | caveola(GO:0005901) |
| 0.0 | 1.3 | GO:0005778 | peroxisomal membrane(GO:0005778) microbody membrane(GO:0031903) |
| 0.0 | 0.1 | GO:0016272 | prefoldin complex(GO:0016272) |
| 0.0 | 0.1 | GO:0030891 | VCB complex(GO:0030891) |
| 0.0 | 0.2 | GO:0042555 | MCM complex(GO:0042555) |
| 0.0 | 0.1 | GO:0045254 | pyruvate dehydrogenase complex(GO:0045254) |
| 0.0 | 1.1 | GO:0030672 | synaptic vesicle membrane(GO:0030672) exocytic vesicle membrane(GO:0099501) |
| 0.0 | 0.1 | GO:0090571 | RNA polymerase II transcription repressor complex(GO:0090571) |
| 0.0 | 0.0 | GO:0000939 | condensed chromosome inner kinetochore(GO:0000939) |
| 0.0 | 2.1 | GO:0030176 | integral component of endoplasmic reticulum membrane(GO:0030176) |
| 0.0 | 1.7 | GO:0031901 | early endosome membrane(GO:0031901) |
| 0.0 | 0.1 | GO:0030897 | HOPS complex(GO:0030897) |
Gene overrepresentation in molecular function category:
| Log-likelihood per target | Total log-likelihood | Term | Description |
|---|---|---|---|
| 0.9 | 7.5 | GO:0004873 | asialoglycoprotein receptor activity(GO:0004873) |
| 0.8 | 2.4 | GO:0004877 | complement component C4b receptor activity(GO:0001861) complement component C3b receptor activity(GO:0004877) |
| 0.6 | 1.2 | GO:0070653 | high-density lipoprotein particle receptor binding(GO:0070653) |
| 0.5 | 4.2 | GO:0032396 | inhibitory MHC class I receptor activity(GO:0032396) |
| 0.4 | 1.3 | GO:0016608 | growth hormone-releasing hormone activity(GO:0016608) |
| 0.4 | 4.5 | GO:0060228 | phosphatidylcholine-sterol O-acyltransferase activator activity(GO:0060228) |
| 0.4 | 1.1 | GO:0070506 | high-density lipoprotein particle receptor activity(GO:0070506) |
| 0.3 | 1.0 | GO:0036487 | nitric-oxide synthase inhibitor activity(GO:0036487) |
| 0.3 | 1.0 | GO:0016603 | glutaminyl-peptide cyclotransferase activity(GO:0016603) |
| 0.3 | 0.9 | GO:0016517 | interleukin-12 receptor activity(GO:0016517) |
| 0.3 | 1.2 | GO:0098770 | FBXO family protein binding(GO:0098770) |
| 0.3 | 3.5 | GO:0043533 | inositol 1,3,4,5 tetrakisphosphate binding(GO:0043533) |
| 0.3 | 2.6 | GO:1904315 | neurotransmitter receptor activity involved in regulation of postsynaptic membrane potential(GO:0099529) transmitter-gated ion channel activity involved in regulation of postsynaptic membrane potential(GO:1904315) |
| 0.3 | 1.2 | GO:0047676 | arachidonate-CoA ligase activity(GO:0047676) |
| 0.3 | 1.7 | GO:0050051 | alkane 1-monooxygenase activity(GO:0018685) leukotriene-B4 20-monooxygenase activity(GO:0050051) |
| 0.2 | 0.7 | GO:0009032 | thymidine phosphorylase activity(GO:0009032) pyrimidine-nucleoside phosphorylase activity(GO:0016154) |
| 0.2 | 2.2 | GO:0001851 | complement component C3b binding(GO:0001851) |
| 0.2 | 0.8 | GO:0016165 | linoleate 13S-lipoxygenase activity(GO:0016165) |
| 0.2 | 0.8 | GO:0004001 | adenosine kinase activity(GO:0004001) |
| 0.2 | 0.6 | GO:1990699 | palmitoleyl hydrolase activity(GO:1990699) |
| 0.2 | 0.8 | GO:0004772 | sterol O-acyltransferase activity(GO:0004772) cholesterol O-acyltransferase activity(GO:0034736) |
| 0.2 | 1.0 | GO:0004994 | somatostatin receptor activity(GO:0004994) |
| 0.2 | 1.2 | GO:0060961 | phospholipase D inhibitor activity(GO:0060961) |
| 0.2 | 1.8 | GO:1990405 | protein antigen binding(GO:1990405) |
| 0.2 | 3.7 | GO:0008503 | benzodiazepine receptor activity(GO:0008503) |
| 0.2 | 1.8 | GO:0005052 | peroxisome matrix targeting signal-1 binding(GO:0005052) |
| 0.2 | 3.3 | GO:0035612 | AP-2 adaptor complex binding(GO:0035612) |
| 0.2 | 0.8 | GO:0005483 | soluble NSF attachment protein activity(GO:0005483) |
| 0.2 | 3.5 | GO:0038036 | sphingosine-1-phosphate receptor activity(GO:0038036) |
| 0.2 | 0.5 | GO:0000224 | peptide-N4-(N-acetyl-beta-glucosaminyl)asparagine amidase activity(GO:0000224) |
| 0.2 | 1.1 | GO:0001875 | lipopolysaccharide receptor activity(GO:0001875) |
| 0.2 | 2.4 | GO:0001135 | transcription factor activity, RNA polymerase II transcription factor recruiting(GO:0001135) |
| 0.2 | 0.7 | GO:0070119 | ciliary neurotrophic factor binding(GO:0070119) |
| 0.2 | 1.4 | GO:0070891 | lipoteichoic acid binding(GO:0070891) |
| 0.2 | 0.9 | GO:0015142 | citrate transmembrane transporter activity(GO:0015137) tricarboxylic acid transmembrane transporter activity(GO:0015142) |
| 0.1 | 0.7 | GO:0004803 | transposase activity(GO:0004803) |
| 0.1 | 0.6 | GO:0004335 | galactokinase activity(GO:0004335) |
| 0.1 | 0.7 | GO:0047179 | platelet-activating factor acetyltransferase activity(GO:0047179) |
| 0.1 | 0.7 | GO:0047844 | deoxycytidine deaminase activity(GO:0047844) |
| 0.1 | 0.5 | GO:0005462 | UDP-N-acetylglucosamine transmembrane transporter activity(GO:0005462) |
| 0.1 | 0.5 | GO:0035241 | protein-arginine omega-N monomethyltransferase activity(GO:0035241) |
| 0.1 | 0.5 | GO:0003858 | 3-hydroxybutyrate dehydrogenase activity(GO:0003858) |
| 0.1 | 0.4 | GO:0015489 | polyamine transmembrane transporter activity(GO:0015203) putrescine transmembrane transporter activity(GO:0015489) |
| 0.1 | 2.6 | GO:0004861 | cyclin-dependent protein serine/threonine kinase inhibitor activity(GO:0004861) |
| 0.1 | 1.9 | GO:0047144 | 2-acylglycerol-3-phosphate O-acyltransferase activity(GO:0047144) |
| 0.1 | 2.3 | GO:0031681 | G-protein beta-subunit binding(GO:0031681) |
| 0.1 | 0.7 | GO:0004741 | [pyruvate dehydrogenase (lipoamide)] phosphatase activity(GO:0004741) |
| 0.1 | 0.5 | GO:0019957 | C-C chemokine binding(GO:0019957) |
| 0.1 | 1.1 | GO:0003910 | DNA ligase (ATP) activity(GO:0003910) |
| 0.1 | 0.7 | GO:0019828 | aspartic-type endopeptidase inhibitor activity(GO:0019828) |
| 0.1 | 0.6 | GO:0008240 | tripeptidyl-peptidase activity(GO:0008240) |
| 0.1 | 2.3 | GO:0016493 | C-C chemokine receptor activity(GO:0016493) |
| 0.1 | 0.4 | GO:0042289 | MHC class II protein binding(GO:0042289) |
| 0.1 | 0.6 | GO:0004965 | G-protein coupled GABA receptor activity(GO:0004965) |
| 0.1 | 0.5 | GO:0004999 | vasoactive intestinal polypeptide receptor activity(GO:0004999) |
| 0.1 | 0.3 | GO:0019779 | Atg12 activating enzyme activity(GO:0019778) Atg8 activating enzyme activity(GO:0019779) |
| 0.1 | 0.3 | GO:0047025 | 3-oxoacyl-[acyl-carrier-protein] reductase (NADH) activity(GO:0047025) |
| 0.1 | 1.0 | GO:0016286 | small conductance calcium-activated potassium channel activity(GO:0016286) |
| 0.1 | 0.5 | GO:0004749 | ribose phosphate diphosphokinase activity(GO:0004749) |
| 0.1 | 1.2 | GO:0033691 | sialic acid binding(GO:0033691) |
| 0.1 | 1.3 | GO:0050291 | sphingosine N-acyltransferase activity(GO:0050291) |
| 0.1 | 1.0 | GO:0004931 | extracellular ATP-gated cation channel activity(GO:0004931) ATP-gated ion channel activity(GO:0035381) |
| 0.1 | 0.4 | GO:0003839 | gamma-glutamylcyclotransferase activity(GO:0003839) |
| 0.1 | 0.6 | GO:0102345 | 3-hydroxy-behenoyl-CoA dehydratase activity(GO:0102344) 3-hydroxy-lignoceroyl-CoA dehydratase activity(GO:0102345) |
| 0.1 | 0.6 | GO:0031849 | olfactory receptor binding(GO:0031849) |
| 0.1 | 1.1 | GO:0016494 | C-X-C chemokine receptor activity(GO:0016494) |
| 0.1 | 0.9 | GO:0008046 | axon guidance receptor activity(GO:0008046) |
| 0.1 | 2.5 | GO:0070300 | phosphatidic acid binding(GO:0070300) |
| 0.1 | 0.6 | GO:0061133 | endopeptidase activator activity(GO:0061133) |
| 0.1 | 0.3 | GO:0000035 | acyl binding(GO:0000035) |
| 0.1 | 0.3 | GO:0005334 | norepinephrine:sodium symporter activity(GO:0005334) |
| 0.1 | 0.5 | GO:0004035 | alkaline phosphatase activity(GO:0004035) |
| 0.1 | 1.8 | GO:0042609 | CD4 receptor binding(GO:0042609) |
| 0.1 | 0.5 | GO:0016314 | phosphatidylinositol-3,4,5-trisphosphate 3-phosphatase activity(GO:0016314) |
| 0.1 | 0.3 | GO:0008476 | protein-tyrosine sulfotransferase activity(GO:0008476) |
| 0.1 | 0.8 | GO:0008607 | phosphorylase kinase regulator activity(GO:0008607) |
| 0.1 | 0.3 | GO:0004306 | ethanolamine-phosphate cytidylyltransferase activity(GO:0004306) |
| 0.1 | 2.2 | GO:0008574 | ATP-dependent microtubule motor activity, plus-end-directed(GO:0008574) |
| 0.1 | 1.0 | GO:0032395 | MHC class II receptor activity(GO:0032395) |
| 0.1 | 0.6 | GO:0015186 | L-cystine transmembrane transporter activity(GO:0015184) L-glutamine transmembrane transporter activity(GO:0015186) |
| 0.1 | 1.8 | GO:0004890 | GABA-A receptor activity(GO:0004890) |
| 0.1 | 0.2 | GO:0031626 | beta-endorphin binding(GO:0031626) |
| 0.1 | 1.1 | GO:0048406 | nerve growth factor binding(GO:0048406) |
| 0.1 | 0.9 | GO:0032051 | clathrin light chain binding(GO:0032051) |
| 0.1 | 0.2 | GO:0004418 | hydroxymethylbilane synthase activity(GO:0004418) |
| 0.1 | 0.8 | GO:0051525 | NFAT protein binding(GO:0051525) |
| 0.1 | 0.4 | GO:0017108 | double-stranded DNA exodeoxyribonuclease activity(GO:0008309) 5'-flap endonuclease activity(GO:0017108) |
| 0.1 | 0.8 | GO:0005007 | fibroblast growth factor-activated receptor activity(GO:0005007) |
| 0.1 | 0.3 | GO:0033906 | hyaluronoglucuronidase activity(GO:0033906) |
| 0.1 | 0.3 | GO:0005353 | fructose transmembrane transporter activity(GO:0005353) |
| 0.1 | 0.3 | GO:0016316 | phosphatidylinositol-3,4-bisphosphate 4-phosphatase activity(GO:0016316) inositol-1,3,4-trisphosphate 4-phosphatase activity(GO:0017161) phosphatidylinositol-4,5-bisphosphate 4-phosphatase activity(GO:0034597) inositol-3,4-bisphosphate 4-phosphatase activity(GO:0052828) |
| 0.1 | 8.4 | GO:0004867 | serine-type endopeptidase inhibitor activity(GO:0004867) |
| 0.1 | 0.5 | GO:0016907 | G-protein coupled acetylcholine receptor activity(GO:0016907) |
| 0.0 | 0.1 | GO:0005093 | Rab GDP-dissociation inhibitor activity(GO:0005093) |
| 0.0 | 0.2 | GO:0032427 | GBD domain binding(GO:0032427) |
| 0.0 | 1.6 | GO:0035497 | cAMP response element binding(GO:0035497) |
| 0.0 | 0.3 | GO:0102008 | cytosolic dipeptidase activity(GO:0102008) |
| 0.0 | 1.5 | GO:0005388 | calcium-transporting ATPase activity(GO:0005388) |
| 0.0 | 0.5 | GO:0004969 | histamine receptor activity(GO:0004969) |
| 0.0 | 1.1 | GO:0008353 | RNA polymerase II carboxy-terminal domain kinase activity(GO:0008353) |
| 0.0 | 0.7 | GO:0004568 | chitinase activity(GO:0004568) |
| 0.0 | 3.9 | GO:0019843 | rRNA binding(GO:0019843) |
| 0.0 | 0.5 | GO:0047134 | protein-disulfide reductase activity(GO:0047134) |
| 0.0 | 0.3 | GO:0050815 | phosphoserine binding(GO:0050815) |
| 0.0 | 1.3 | GO:0042288 | MHC class I protein binding(GO:0042288) |
| 0.0 | 0.4 | GO:0015277 | kainate selective glutamate receptor activity(GO:0015277) |
| 0.0 | 0.4 | GO:0017150 | tRNA dihydrouridine synthase activity(GO:0017150) |
| 0.0 | 3.2 | GO:0005246 | calcium channel regulator activity(GO:0005246) |
| 0.0 | 2.0 | GO:0017075 | syntaxin-1 binding(GO:0017075) |
| 0.0 | 0.2 | GO:0008518 | reduced folate carrier activity(GO:0008518) |
| 0.0 | 1.3 | GO:0043274 | phospholipase binding(GO:0043274) |
| 0.0 | 0.2 | GO:0000248 | C-5 sterol desaturase activity(GO:0000248) sterol desaturase activity(GO:0070704) |
| 0.0 | 1.1 | GO:0030247 | pattern binding(GO:0001871) polysaccharide binding(GO:0030247) |
| 0.0 | 0.1 | GO:0004077 | biotin-[acetyl-CoA-carboxylase] ligase activity(GO:0004077) biotin-[methylcrotonoyl-CoA-carboxylase] ligase activity(GO:0004078) biotin-[methylmalonyl-CoA-carboxytransferase] ligase activity(GO:0004079) biotin-[propionyl-CoA-carboxylase (ATP-hydrolyzing)] ligase activity(GO:0004080) biotin-protein ligase activity(GO:0018271) |
| 0.0 | 0.7 | GO:0097109 | neuroligin family protein binding(GO:0097109) |
| 0.0 | 0.2 | GO:0004667 | prostaglandin-D synthase activity(GO:0004667) |
| 0.0 | 0.7 | GO:0017127 | cholesterol transporter activity(GO:0017127) |
| 0.0 | 0.3 | GO:0004694 | eukaryotic translation initiation factor 2alpha kinase activity(GO:0004694) |
| 0.0 | 0.3 | GO:0004972 | NMDA glutamate receptor activity(GO:0004972) |
| 0.0 | 0.6 | GO:0031996 | thioesterase binding(GO:0031996) |
| 0.0 | 0.6 | GO:0017017 | MAP kinase tyrosine/serine/threonine phosphatase activity(GO:0017017) |
| 0.0 | 0.3 | GO:0016812 | hydrolase activity, acting on carbon-nitrogen (but not peptide) bonds, in cyclic amides(GO:0016812) |
| 0.0 | 0.1 | GO:0035514 | DNA demethylase activity(GO:0035514) |
| 0.0 | 0.1 | GO:0004375 | glycine dehydrogenase (decarboxylating) activity(GO:0004375) oxidoreductase activity, acting on the CH-NH2 group of donors, disulfide as acceptor(GO:0016642) vitamin B6 binding(GO:0070279) pyridoxal binding(GO:0070280) |
| 0.0 | 0.5 | GO:0001591 | dopamine neurotransmitter receptor activity, coupled via Gi/Go(GO:0001591) |
| 0.0 | 0.3 | GO:0035312 | 5'-3' exodeoxyribonuclease activity(GO:0035312) |
| 0.0 | 1.9 | GO:0071889 | 14-3-3 protein binding(GO:0071889) |
| 0.0 | 0.4 | GO:0019869 | chloride channel inhibitor activity(GO:0019869) |
| 0.0 | 0.8 | GO:0004535 | poly(A)-specific ribonuclease activity(GO:0004535) |
| 0.0 | 0.2 | GO:0004523 | RNA-DNA hybrid ribonuclease activity(GO:0004523) |
| 0.0 | 0.1 | GO:0090631 | pre-miRNA transporter activity(GO:0090631) |
| 0.0 | 0.2 | GO:0004169 | dolichyl-phosphate-mannose-protein mannosyltransferase activity(GO:0004169) |
| 0.0 | 0.2 | GO:0002114 | interleukin-33 receptor activity(GO:0002114) |
| 0.0 | 0.1 | GO:0033842 | N-acetyl-beta-glucosaminyl-glycoprotein 4-beta-N-acetylgalactosaminyltransferase activity(GO:0033842) |
| 0.0 | 0.5 | GO:0045236 | CXCR chemokine receptor binding(GO:0045236) |
| 0.0 | 0.4 | GO:0031386 | protein tag(GO:0031386) |
| 0.0 | 0.1 | GO:0003963 | RNA-3'-phosphate cyclase activity(GO:0003963) |
| 0.0 | 0.8 | GO:0015271 | outward rectifier potassium channel activity(GO:0015271) |
| 0.0 | 0.3 | GO:0033170 | DNA clamp loader activity(GO:0003689) protein-DNA loading ATPase activity(GO:0033170) |
| 0.0 | 3.5 | GO:0048365 | Rac GTPase binding(GO:0048365) |
| 0.0 | 0.3 | GO:0070740 | tubulin-glutamic acid ligase activity(GO:0070740) |
| 0.0 | 0.3 | GO:0042799 | histone methyltransferase activity (H4-K20 specific)(GO:0042799) |
| 0.0 | 0.5 | GO:0051864 | histone demethylase activity (H3-K36 specific)(GO:0051864) |
| 0.0 | 0.6 | GO:0004691 | cAMP-dependent protein kinase activity(GO:0004691) |
| 0.0 | 0.8 | GO:0042043 | neurexin family protein binding(GO:0042043) |
| 0.0 | 0.1 | GO:0004616 | phosphogluconate dehydrogenase (decarboxylating) activity(GO:0004616) |
| 0.0 | 0.3 | GO:0005113 | patched binding(GO:0005113) |
| 0.0 | 0.1 | GO:0051499 | D-aminoacyl-tRNA deacylase activity(GO:0051499) D-tyrosyl-tRNA(Tyr) deacylase activity(GO:0051500) |
| 0.0 | 0.4 | GO:0008409 | 5'-3' exonuclease activity(GO:0008409) |
| 0.0 | 0.3 | GO:0102337 | fatty acid elongase activity(GO:0009922) 3-oxo-arachidoyl-CoA synthase activity(GO:0102336) 3-oxo-cerotoyl-CoA synthase activity(GO:0102337) 3-oxo-lignoceronyl-CoA synthase activity(GO:0102338) |
| 0.0 | 0.3 | GO:0008160 | protein tyrosine phosphatase activator activity(GO:0008160) |
| 0.0 | 2.7 | GO:0004715 | non-membrane spanning protein tyrosine kinase activity(GO:0004715) |
| 0.0 | 0.1 | GO:0004483 | mRNA (nucleoside-2'-O-)-methyltransferase activity(GO:0004483) |
| 0.0 | 0.5 | GO:0098505 | G-rich strand telomeric DNA binding(GO:0098505) |
| 0.0 | 0.5 | GO:0004383 | guanylate cyclase activity(GO:0004383) |
| 0.0 | 0.5 | GO:0030215 | semaphorin receptor binding(GO:0030215) |
| 0.0 | 0.1 | GO:0004852 | uroporphyrinogen-III synthase activity(GO:0004852) |
| 0.0 | 0.1 | GO:0008384 | IkappaB kinase activity(GO:0008384) |
| 0.0 | 0.1 | GO:0004963 | follicle-stimulating hormone receptor activity(GO:0004963) |
| 0.0 | 0.7 | GO:0015035 | protein disulfide oxidoreductase activity(GO:0015035) |
| 0.0 | 0.6 | GO:0097602 | cullin family protein binding(GO:0097602) |
| 0.0 | 0.2 | GO:0061665 | SUMO ligase activity(GO:0061665) |
| 0.0 | 0.3 | GO:0035374 | chondroitin sulfate binding(GO:0035374) |
| 0.0 | 0.1 | GO:0008177 | succinate dehydrogenase (ubiquinone) activity(GO:0008177) |
| 0.0 | 1.0 | GO:0030506 | ankyrin binding(GO:0030506) |
| 0.0 | 0.1 | GO:0050119 | N-acetylglucosamine deacetylase activity(GO:0050119) |
| 0.0 | 0.7 | GO:0097200 | cysteine-type endopeptidase activity involved in execution phase of apoptosis(GO:0097200) |
| 0.0 | 0.1 | GO:0052591 | sn-glycerol-3-phosphate:ubiquinone oxidoreductase activity(GO:0052590) sn-glycerol-3-phosphate:ubiquinone-8 oxidoreductase activity(GO:0052591) |
| 0.0 | 0.2 | GO:0072542 | protein phosphatase activator activity(GO:0072542) |
| 0.0 | 0.1 | GO:0044736 | acid-sensing ion channel activity(GO:0044736) |
| 0.0 | 0.7 | GO:0003887 | DNA-directed DNA polymerase activity(GO:0003887) |
| 0.0 | 0.2 | GO:0008379 | thioredoxin peroxidase activity(GO:0008379) |
| 0.0 | 0.1 | GO:0004791 | thioredoxin-disulfide reductase activity(GO:0004791) |
| 0.0 | 0.5 | GO:0045295 | gamma-catenin binding(GO:0045295) |
| 0.0 | 0.6 | GO:0008157 | protein phosphatase 1 binding(GO:0008157) |
| 0.0 | 0.1 | GO:0004668 | protein-arginine deiminase activity(GO:0004668) |
| 0.0 | 1.9 | GO:0030276 | clathrin binding(GO:0030276) |
| 0.0 | 0.3 | GO:0015266 | protein channel activity(GO:0015266) |
| 0.0 | 0.6 | GO:0015269 | calcium-activated potassium channel activity(GO:0015269) |
| 0.0 | 0.5 | GO:0001530 | lipopolysaccharide binding(GO:0001530) |
| 0.0 | 0.0 | GO:0071987 | WD40-repeat domain binding(GO:0071987) |
| 0.0 | 0.1 | GO:0034604 | pyruvate dehydrogenase activity(GO:0004738) pyruvate dehydrogenase [NAD(P)+] activity(GO:0034603) pyruvate dehydrogenase (NAD+) activity(GO:0034604) |
| 0.0 | 0.1 | GO:0070224 | sulfide:quinone oxidoreductase activity(GO:0070224) |
| 0.0 | 0.5 | GO:0019206 | nucleoside kinase activity(GO:0019206) |
| 0.0 | 0.1 | GO:1990825 | sequence-specific mRNA binding(GO:1990825) |
| 0.0 | 0.9 | GO:0005547 | phosphatidylinositol-3,4,5-trisphosphate binding(GO:0005547) |
| 0.0 | 0.9 | GO:0031492 | nucleosomal DNA binding(GO:0031492) |
| 0.0 | 0.5 | GO:0070628 | proteasome binding(GO:0070628) |
| 0.0 | 0.2 | GO:0070053 | thrombospondin receptor activity(GO:0070053) |
| 0.0 | 0.1 | GO:0017089 | glycolipid transporter activity(GO:0017089) |
| 0.0 | 0.4 | GO:0017160 | Ral GTPase binding(GO:0017160) |
| 0.0 | 0.1 | GO:0036042 | long-chain fatty acyl-CoA binding(GO:0036042) |
| 0.0 | 0.1 | GO:0015165 | pyrimidine nucleotide-sugar transmembrane transporter activity(GO:0015165) |
| 0.0 | 0.4 | GO:0008349 | MAP kinase kinase kinase kinase activity(GO:0008349) |
| 0.0 | 0.4 | GO:0004000 | adenosine deaminase activity(GO:0004000) |
| 0.0 | 0.7 | GO:0004385 | guanylate kinase activity(GO:0004385) |
| 0.0 | 0.1 | GO:0042296 | ISG15 transferase activity(GO:0042296) |
| 0.0 | 0.2 | GO:0097371 | MDM2/MDM4 family protein binding(GO:0097371) |
| 0.0 | 2.3 | GO:0005319 | lipid transporter activity(GO:0005319) |
| 0.0 | 0.2 | GO:0032794 | GTPase activating protein binding(GO:0032794) |
| 0.0 | 0.1 | GO:0019834 | phospholipase A2 inhibitor activity(GO:0019834) |
| 0.0 | 0.6 | GO:0019707 | protein-cysteine S-palmitoyltransferase activity(GO:0019706) protein-cysteine S-acyltransferase activity(GO:0019707) |
| 0.0 | 0.5 | GO:0043027 | cysteine-type endopeptidase inhibitor activity involved in apoptotic process(GO:0043027) |
| 0.0 | 0.4 | GO:0005212 | structural constituent of eye lens(GO:0005212) |
| 0.0 | 0.2 | GO:0005132 | type I interferon receptor binding(GO:0005132) |
| 0.0 | 0.1 | GO:0008853 | exodeoxyribonuclease III activity(GO:0008853) |
| 0.0 | 0.3 | GO:0038191 | neuropilin binding(GO:0038191) |
| 0.0 | 0.3 | GO:0000175 | 3'-5'-exoribonuclease activity(GO:0000175) exoribonuclease activity, producing 5'-phosphomonoesters(GO:0016896) |
| 0.0 | 0.2 | GO:0008408 | 3'-5' exonuclease activity(GO:0008408) |
| 0.0 | 0.1 | GO:0003958 | NADPH-hemoprotein reductase activity(GO:0003958) |
| 0.0 | 0.3 | GO:0008066 | glutamate receptor activity(GO:0008066) |
| 0.0 | 0.1 | GO:0008432 | JUN kinase binding(GO:0008432) |
| 0.0 | 0.4 | GO:0030515 | snoRNA binding(GO:0030515) |
| 0.0 | 0.5 | GO:0000900 | translation repressor activity, nucleic acid binding(GO:0000900) |
| 0.0 | 0.7 | GO:0004683 | calmodulin-dependent protein kinase activity(GO:0004683) |
| 0.0 | 0.1 | GO:0002161 | aminoacyl-tRNA editing activity(GO:0002161) |
| 0.0 | 0.5 | GO:0071837 | HMG box domain binding(GO:0071837) |
| 0.0 | 0.1 | GO:0034046 | poly(G) binding(GO:0034046) |
| 0.0 | 0.1 | GO:0005124 | scavenger receptor binding(GO:0005124) |
Gene overrepresentation in curated gene sets: canonical pathways category:
| Log-likelihood per target | Total log-likelihood | Term | Description |
|---|---|---|---|
| 0.1 | 4.6 | PID S1P S1P4 PATHWAY | S1P4 pathway |
| 0.1 | 0.7 | ST STAT3 PATHWAY | STAT3 Pathway |
| 0.1 | 8.6 | PID HNF3A PATHWAY | FOXA1 transcription factor network |
| 0.1 | 0.8 | SA B CELL RECEPTOR COMPLEXES | Antigen binding to B cell receptors activates protein tyrosine kinases, such as the Src family, which ultimate activate MAP kinases. |
| 0.1 | 1.8 | PID INTEGRIN5 PATHWAY | Beta5 beta6 beta7 and beta8 integrin cell surface interactions |
| 0.1 | 4.2 | PID INTEGRIN2 PATHWAY | Beta2 integrin cell surface interactions |
| 0.1 | 2.0 | PID EPHRINB REV PATHWAY | Ephrin B reverse signaling |
| 0.1 | 1.3 | PID S1P S1P2 PATHWAY | S1P2 pathway |
| 0.0 | 0.1 | ST PAC1 RECEPTOR PATHWAY | PAC1 Receptor Pathway |
| 0.0 | 0.7 | SA G2 AND M PHASES | Cdc25 activates the cdc2/cyclin B complex to induce the G2/M transition. |
| 0.0 | 4.5 | PID PI3KCI PATHWAY | Class I PI3K signaling events |
| 0.0 | 0.6 | ST JAK STAT PATHWAY | Jak-STAT Pathway |
| 0.0 | 1.7 | PID ALPHA SYNUCLEIN PATHWAY | Alpha-synuclein signaling |
| 0.0 | 1.3 | PID IL27 PATHWAY | IL27-mediated signaling events |
| 0.0 | 0.9 | PID IL3 PATHWAY | IL3-mediated signaling events |
| 0.0 | 1.4 | PID P38 MK2 PATHWAY | p38 signaling mediated by MAPKAP kinases |
| 0.0 | 1.7 | NABA PROTEOGLYCANS | Genes encoding proteoglycans |
| 0.0 | 1.8 | PID FANCONI PATHWAY | Fanconi anemia pathway |
| 0.0 | 1.1 | PID TOLL ENDOGENOUS PATHWAY | Endogenous TLR signaling |
| 0.0 | 3.8 | PID RHOA REG PATHWAY | Regulation of RhoA activity |
| 0.0 | 1.6 | PID IL2 STAT5 PATHWAY | IL2 signaling events mediated by STAT5 |
| 0.0 | 1.4 | PID IFNG PATHWAY | IFN-gamma pathway |
| 0.0 | 0.3 | PID HES HEY PATHWAY | Notch-mediated HES/HEY network |
| 0.0 | 0.7 | PID DNA PK PATHWAY | DNA-PK pathway in nonhomologous end joining |
| 0.0 | 0.2 | PID SYNDECAN 4 PATHWAY | Syndecan-4-mediated signaling events |
| 0.0 | 0.5 | PID P38 GAMMA DELTA PATHWAY | Signaling mediated by p38-gamma and p38-delta |
| 0.0 | 2.2 | PID NOTCH PATHWAY | Notch signaling pathway |
| 0.0 | 1.4 | PID ERBB4 PATHWAY | ErbB4 signaling events |
| 0.0 | 0.7 | PID LIS1 PATHWAY | Lissencephaly gene (LIS1) in neuronal migration and development |
| 0.0 | 0.5 | PID IL23 PATHWAY | IL23-mediated signaling events |
| 0.0 | 0.3 | PID ATF2 PATHWAY | ATF-2 transcription factor network |
| 0.0 | 0.2 | ST PHOSPHOINOSITIDE 3 KINASE PATHWAY | PI3K Pathway |
| 0.0 | 1.0 | PID HNF3B PATHWAY | FOXA2 and FOXA3 transcription factor networks |
| 0.0 | 0.7 | PID TNF PATHWAY | TNF receptor signaling pathway |
| 0.0 | 1.7 | PID CASPASE PATHWAY | Caspase cascade in apoptosis |
| 0.0 | 0.9 | PID IL4 2PATHWAY | IL4-mediated signaling events |
| 0.0 | 0.8 | SIG REGULATION OF THE ACTIN CYTOSKELETON BY RHO GTPASES | Genes related to regulation of the actin cytoskeleton |
| 0.0 | 0.4 | PID UPA UPAR PATHWAY | Urokinase-type plasminogen activator (uPA) and uPAR-mediated signaling |
| 0.0 | 0.3 | ST ERK1 ERK2 MAPK PATHWAY | ERK1/ERK2 MAPK Pathway |
| 0.0 | 0.5 | PID NCADHERIN PATHWAY | N-cadherin signaling events |
Gene overrepresentation in curated gene sets: REACTOME pathways category:
| Log-likelihood per target | Total log-likelihood | Term | Description |
|---|---|---|---|
| 0.4 | 0.4 | REACTOME APOBEC3G MEDIATED RESISTANCE TO HIV1 INFECTION | Genes involved in APOBEC3G mediated resistance to HIV-1 infection |
| 0.2 | 3.4 | REACTOME GAMMA CARBOXYLATION TRANSPORT AND AMINO TERMINAL CLEAVAGE OF PROTEINS | Genes involved in Gamma-carboxylation, transport, and amino-terminal cleavage of proteins |
| 0.1 | 6.0 | REACTOME GABA A RECEPTOR ACTIVATION | Genes involved in GABA A receptor activation |
| 0.1 | 2.5 | REACTOME CHYLOMICRON MEDIATED LIPID TRANSPORT | Genes involved in Chylomicron-mediated lipid transport |
| 0.1 | 2.4 | REACTOME REGULATION OF COMPLEMENT CASCADE | Genes involved in Regulation of Complement cascade |
| 0.1 | 2.5 | REACTOME ACTIVATION OF BH3 ONLY PROTEINS | Genes involved in Activation of BH3-only proteins |
| 0.1 | 2.3 | REACTOME EARLY PHASE OF HIV LIFE CYCLE | Genes involved in Early Phase of HIV Life Cycle |
| 0.1 | 4.2 | REACTOME GENERATION OF SECOND MESSENGER MOLECULES | Genes involved in Generation of second messenger molecules |
| 0.1 | 1.7 | REACTOME ERKS ARE INACTIVATED | Genes involved in ERKs are inactivated |
| 0.1 | 1.8 | REACTOME ACYL CHAIN REMODELLING OF PI | Genes involved in Acyl chain remodelling of PI |
| 0.1 | 1.0 | REACTOME ELEVATION OF CYTOSOLIC CA2 LEVELS | Genes involved in Elevation of cytosolic Ca2+ levels |
| 0.1 | 1.8 | REACTOME NOREPINEPHRINE NEUROTRANSMITTER RELEASE CYCLE | Genes involved in Norepinephrine Neurotransmitter Release Cycle |
| 0.1 | 1.1 | REACTOME ROLE OF DCC IN REGULATING APOPTOSIS | Genes involved in Role of DCC in regulating apoptosis |
| 0.1 | 1.3 | REACTOME SYNTHESIS SECRETION AND DEACYLATION OF GHRELIN | Genes involved in Synthesis, Secretion, and Deacylation of Ghrelin |
| 0.1 | 2.9 | REACTOME G1 PHASE | Genes involved in G1 Phase |
| 0.1 | 1.6 | REACTOME TGF BETA RECEPTOR SIGNALING IN EMT EPITHELIAL TO MESENCHYMAL TRANSITION | Genes involved in TGF-beta receptor signaling in EMT (epithelial to mesenchymal transition) |
| 0.0 | 1.1 | REACTOME REPAIR SYNTHESIS FOR GAP FILLING BY DNA POL IN TC NER | Genes involved in Repair synthesis for gap-filling by DNA polymerase in TC-NER |
| 0.0 | 3.8 | REACTOME FORMATION OF THE TERNARY COMPLEX AND SUBSEQUENTLY THE 43S COMPLEX | Genes involved in Formation of the ternary complex, and subsequently, the 43S complex |
| 0.0 | 5.4 | REACTOME IMMUNOREGULATORY INTERACTIONS BETWEEN A LYMPHOID AND A NON LYMPHOID CELL | Genes involved in Immunoregulatory interactions between a Lymphoid and a non-Lymphoid cell |
| 0.0 | 0.9 | REACTOME HDL MEDIATED LIPID TRANSPORT | Genes involved in HDL-mediated lipid transport |
| 0.0 | 1.0 | REACTOME REGULATION OF RHEB GTPASE ACTIVITY BY AMPK | Genes involved in Regulation of Rheb GTPase activity by AMPK |
| 0.0 | 0.8 | REACTOME REGULATION OF PYRUVATE DEHYDROGENASE PDH COMPLEX | Genes involved in Regulation of pyruvate dehydrogenase (PDH) complex |
| 0.0 | 0.7 | REACTOME PLATELET ADHESION TO EXPOSED COLLAGEN | Genes involved in Platelet Adhesion to exposed collagen |
| 0.0 | 0.8 | REACTOME IL 6 SIGNALING | Genes involved in Interleukin-6 signaling |
| 0.0 | 0.9 | REACTOME PLATELET CALCIUM HOMEOSTASIS | Genes involved in Platelet calcium homeostasis |
| 0.0 | 0.8 | REACTOME GLUCAGON TYPE LIGAND RECEPTORS | Genes involved in Glucagon-type ligand receptors |
| 0.0 | 0.6 | REACTOME IRAK1 RECRUITS IKK COMPLEX | Genes involved in IRAK1 recruits IKK complex |
| 0.0 | 6.6 | REACTOME RESPONSE TO ELEVATED PLATELET CYTOSOLIC CA2 | Genes involved in Response to elevated platelet cytosolic Ca2+ |
| 0.0 | 0.9 | REACTOME CLASS C 3 METABOTROPIC GLUTAMATE PHEROMONE RECEPTORS | Genes involved in Class C/3 (Metabotropic glutamate/pheromone receptors) |
| 0.0 | 1.5 | REACTOME SYNTHESIS OF VERY LONG CHAIN FATTY ACYL COAS | Genes involved in Synthesis of very long-chain fatty acyl-CoAs |
| 0.0 | 0.7 | REACTOME PYRIMIDINE CATABOLISM | Genes involved in Pyrimidine catabolism |
| 0.0 | 1.6 | REACTOME LIPID DIGESTION MOBILIZATION AND TRANSPORT | Genes involved in Lipid digestion, mobilization, and transport |
| 0.0 | 0.3 | REACTOME ACYL CHAIN REMODELLING OF PG | Genes involved in Acyl chain remodelling of PG |
| 0.0 | 1.2 | REACTOME AMYLOIDS | Genes involved in Amyloids |
| 0.0 | 9.4 | REACTOME G ALPHA I SIGNALLING EVENTS | Genes involved in G alpha (i) signalling events |
| 0.0 | 0.8 | REACTOME PURINE SALVAGE | Genes involved in Purine salvage |
| 0.0 | 0.5 | REACTOME ACTIVATION OF CHAPERONE GENES BY ATF6 ALPHA | Genes involved in Activation of Chaperone Genes by ATF6-alpha |
| 0.0 | 0.8 | REACTOME FANCONI ANEMIA PATHWAY | Genes involved in Fanconi Anemia pathway |
| 0.0 | 1.1 | REACTOME BETA DEFENSINS | Genes involved in Beta defensins |
| 0.0 | 0.9 | REACTOME ERK MAPK TARGETS | Genes involved in ERK/MAPK targets |
| 0.0 | 0.7 | REACTOME CYCLIN A B1 ASSOCIATED EVENTS DURING G2 M TRANSITION | Genes involved in Cyclin A/B1 associated events during G2/M transition |
| 0.0 | 0.4 | REACTOME NEF MEDIATED DOWNREGULATION OF MHC CLASS I COMPLEX CELL SURFACE EXPRESSION | Genes involved in Nef mediated downregulation of MHC class I complex cell surface expression |
| 0.0 | 1.0 | REACTOME DOWNREGULATION OF SMAD2 3 SMAD4 TRANSCRIPTIONAL ACTIVITY | Genes involved in Downregulation of SMAD2/3:SMAD4 transcriptional activity |
| 0.0 | 2.7 | REACTOME CELL DEATH SIGNALLING VIA NRAGE NRIF AND NADE | Genes involved in Cell death signalling via NRAGE, NRIF and NADE |
| 0.0 | 0.8 | REACTOME TRAF6 MEDIATED IRF7 ACTIVATION | Genes involved in TRAF6 mediated IRF7 activation |
| 0.0 | 1.5 | REACTOME MEIOTIC SYNAPSIS | Genes involved in Meiotic Synapsis |
| 0.0 | 2.9 | REACTOME MHC CLASS II ANTIGEN PRESENTATION | Genes involved in MHC class II antigen presentation |
| 0.0 | 0.9 | REACTOME SPHINGOLIPID DE NOVO BIOSYNTHESIS | Genes involved in Sphingolipid de novo biosynthesis |
| 0.0 | 0.7 | REACTOME CASPASE MEDIATED CLEAVAGE OF CYTOSKELETAL PROTEINS | Genes involved in Caspase-mediated cleavage of cytoskeletal proteins |
| 0.0 | 1.3 | REACTOME CYTOCHROME P450 ARRANGED BY SUBSTRATE TYPE | Genes involved in Cytochrome P450 - arranged by substrate type |
| 0.0 | 0.4 | REACTOME SIGNALING BY FGFR3 MUTANTS | Genes involved in Signaling by FGFR3 mutants |
| 0.0 | 0.7 | REACTOME SIGNALING BY NODAL | Genes involved in Signaling by NODAL |
| 0.0 | 0.3 | REACTOME REGULATION OF IFNG SIGNALING | Genes involved in Regulation of IFNG signaling |
| 0.0 | 0.3 | REACTOME REGULATION OF BETA CELL DEVELOPMENT | Genes involved in Regulation of beta-cell development |
| 0.0 | 0.4 | REACTOME TRAFFICKING OF GLUR2 CONTAINING AMPA RECEPTORS | Genes involved in Trafficking of GluR2-containing AMPA receptors |
| 0.0 | 0.7 | REACTOME DEADENYLATION OF MRNA | Genes involved in Deadenylation of mRNA |
| 0.0 | 0.7 | REACTOME YAP1 AND WWTR1 TAZ STIMULATED GENE EXPRESSION | Genes involved in YAP1- and WWTR1 (TAZ)-stimulated gene expression |
| 0.0 | 0.5 | REACTOME SEMA4D INDUCED CELL MIGRATION AND GROWTH CONE COLLAPSE | Genes involved in Sema4D induced cell migration and growth-cone collapse |
| 0.0 | 0.1 | REACTOME FGFR4 LIGAND BINDING AND ACTIVATION | Genes involved in FGFR4 ligand binding and activation |
| 0.0 | 0.5 | REACTOME POST CHAPERONIN TUBULIN FOLDING PATHWAY | Genes involved in Post-chaperonin tubulin folding pathway |
| 0.0 | 1.1 | REACTOME REGULATION OF ORNITHINE DECARBOXYLASE ODC | Genes involved in Regulation of ornithine decarboxylase (ODC) |
| 0.0 | 0.4 | REACTOME IONOTROPIC ACTIVITY OF KAINATE RECEPTORS | Genes involved in Ionotropic activity of Kainate Receptors |
| 0.0 | 0.4 | REACTOME INSULIN SYNTHESIS AND PROCESSING | Genes involved in Insulin Synthesis and Processing |
| 0.0 | 0.3 | REACTOME SYNTHESIS OF PIPS AT THE EARLY ENDOSOME MEMBRANE | Genes involved in Synthesis of PIPs at the early endosome membrane |
| 0.0 | 0.3 | REACTOME SYNTHESIS SECRETION AND INACTIVATION OF GIP | Genes involved in Synthesis, Secretion, and Inactivation of Glucose-dependent Insulinotropic Polypeptide (GIP) |
| 0.0 | 0.2 | REACTOME SIGNAL REGULATORY PROTEIN SIRP FAMILY INTERACTIONS | Genes involved in Signal regulatory protein (SIRP) family interactions |
| 0.0 | 0.5 | REACTOME NEGATIVE REGULATORS OF RIG I MDA5 SIGNALING | Genes involved in Negative regulators of RIG-I/MDA5 signaling |
| 0.0 | 0.2 | REACTOME CD28 DEPENDENT VAV1 PATHWAY | Genes involved in CD28 dependent Vav1 pathway |
| 0.0 | 0.3 | REACTOME OTHER SEMAPHORIN INTERACTIONS | Genes involved in Other semaphorin interactions |
| 0.0 | 0.4 | REACTOME SHC1 EVENTS IN ERBB4 SIGNALING | Genes involved in SHC1 events in ERBB4 signaling |
| 0.0 | 1.0 | REACTOME MYD88 MAL CASCADE INITIATED ON PLASMA MEMBRANE | Genes involved in MyD88:Mal cascade initiated on plasma membrane |
| 0.0 | 0.3 | REACTOME HIGHLY CALCIUM PERMEABLE POSTSYNAPTIC NICOTINIC ACETYLCHOLINE RECEPTORS | Genes involved in Highly calcium permeable postsynaptic nicotinic acetylcholine receptors |
| 0.0 | 0.3 | REACTOME SYNTHESIS OF PE | Genes involved in Synthesis of PE |
| 0.0 | 0.6 | REACTOME ION TRANSPORT BY P TYPE ATPASES | Genes involved in Ion transport by P-type ATPases |
| 0.0 | 0.3 | REACTOME PROCESSING OF INTRONLESS PRE MRNAS | Genes involved in Processing of Intronless Pre-mRNAs |
| 0.0 | 1.7 | REACTOME POTASSIUM CHANNELS | Genes involved in Potassium Channels |