Project
Illumina Body Map 2 (GSE30611)
Navigation
Downloads
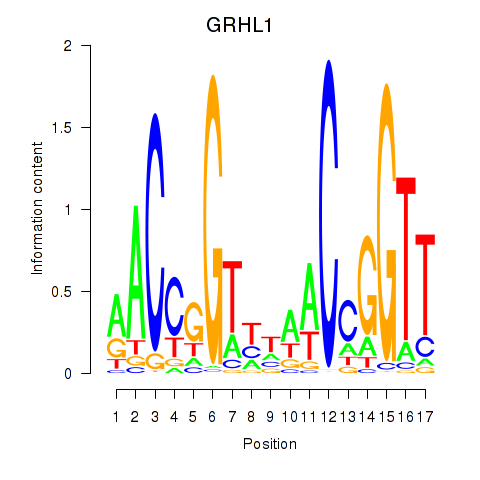
Results for GRHL1
Z-value: 1.69
Motif logo
Transcription factors associated with GRHL1
| Gene Symbol | Gene ID | Gene Info |
|---|---|---|
|
GRHL1
|
ENSG00000134317.18 | grainyhead like transcription factor 1 |
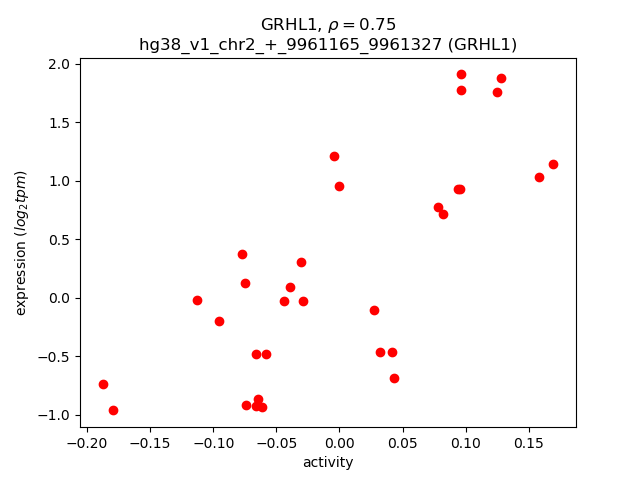
Activity-expression correlation:
| Gene | Promoter | Pearson corr. coef. | P-value | Plot |
|---|---|---|---|---|
| GRHL1 | hg38_v1_chr2_+_9961165_9961327 | 0.75 | 8.0e-07 | Click! |
Activity profile of GRHL1 motif
Sorted Z-values of GRHL1 motif
| Promoter | Log-likelihood | Transcript | Gene | Gene Info |
|---|---|---|---|---|
| chr11_+_76782250 | 8.75 |
ENST00000533752.1
ENST00000612930.1 |
TSKU
|
tsukushi, small leucine rich proteoglycan |
| chr19_-_4338786 | 8.40 |
ENST00000601482.1
ENST00000600324.5 ENST00000594605.6 |
STAP2
|
signal transducing adaptor family member 2 |
| chr1_-_201399302 | 8.00 |
ENST00000633953.1
ENST00000391967.7 |
LAD1
|
ladinin 1 |
| chr2_+_95274439 | 7.18 |
ENST00000317620.14
ENST00000403131.6 ENST00000317668.8 |
PROM2
|
prominin 2 |
| chr1_+_156061142 | 6.26 |
ENST00000361084.10
|
RAB25
|
RAB25, member RAS oncogene family |
| chr11_+_706595 | 5.97 |
ENST00000531348.5
ENST00000530636.5 |
EPS8L2
|
EPS8 like 2 |
| chr19_+_44809053 | 5.85 |
ENST00000611077.5
|
BCAM
|
basal cell adhesion molecule (Lutheran blood group) |
| chr19_+_1491140 | 5.52 |
ENST00000233596.8
ENST00000395479.10 |
REEP6
|
receptor accessory protein 6 |
| chr19_+_44809089 | 5.11 |
ENST00000270233.12
ENST00000591520.6 |
BCAM
|
basal cell adhesion molecule (Lutheran blood group) |
| chr1_-_32901330 | 4.96 |
ENST00000329151.5
ENST00000373463.8 |
TMEM54
|
transmembrane protein 54 |
| chr17_-_4560564 | 4.93 |
ENST00000574584.1
ENST00000381550.8 ENST00000301395.7 |
GGT6
|
gamma-glutamyltransferase 6 |
| chr18_-_57803307 | 4.59 |
ENST00000648908.2
|
ATP8B1
|
ATPase phospholipid transporting 8B1 |
| chr20_-_18057841 | 4.40 |
ENST00000278780.7
|
OVOL2
|
ovo like zinc finger 2 |
| chr11_+_706117 | 4.04 |
ENST00000533256.5
ENST00000614442.4 |
EPS8L2
|
EPS8 like 2 |
| chr3_+_186666003 | 3.77 |
ENST00000232003.5
|
HRG
|
histidine rich glycoprotein |
| chr20_-_62427528 | 3.77 |
ENST00000252998.2
|
RBBP8NL
|
RBBP8 N-terminal like |
| chr11_-_120138104 | 3.66 |
ENST00000341846.10
|
TRIM29
|
tripartite motif containing 29 |
| chr10_-_50885656 | 3.56 |
ENST00000374001.6
ENST00000395489.6 ENST00000282641.6 ENST00000395495.5 ENST00000373995.7 ENST00000414883.1 |
A1CF
|
APOBEC1 complementation factor |
| chr11_-_64166102 | 3.51 |
ENST00000255681.7
ENST00000675777.1 |
MACROD1
|
mono-ADP ribosylhydrolase 1 |
| chr1_-_153608136 | 3.28 |
ENST00000368703.6
|
S100A16
|
S100 calcium binding protein A16 |
| chr7_-_80922354 | 3.21 |
ENST00000419255.6
|
SEMA3C
|
semaphorin 3C |
| chr1_-_201399906 | 3.02 |
ENST00000631576.1
|
LAD1
|
ladinin 1 |
| chr5_+_126423176 | 2.94 |
ENST00000542322.5
ENST00000544396.5 |
GRAMD2B
|
GRAM domain containing 2B |
| chr2_-_208254232 | 2.87 |
ENST00000415913.5
ENST00000415282.5 ENST00000446179.5 |
IDH1
|
isocitrate dehydrogenase (NADP(+)) 1 |
| chr6_-_46921926 | 2.62 |
ENST00000283296.12
|
ADGRF5
|
adhesion G protein-coupled receptor F5 |
| chr1_+_210232776 | 2.45 |
ENST00000367012.4
|
SERTAD4
|
SERTA domain containing 4 |
| chr5_+_126423363 | 2.27 |
ENST00000285689.8
|
GRAMD2B
|
GRAM domain containing 2B |
| chr1_-_24143112 | 2.21 |
ENST00000270800.2
|
IL22RA1
|
interleukin 22 receptor subunit alpha 1 |
| chr5_+_126423122 | 2.18 |
ENST00000515200.5
|
GRAMD2B
|
GRAM domain containing 2B |
| chr19_-_17245889 | 2.10 |
ENST00000291442.4
|
NR2F6
|
nuclear receptor subfamily 2 group F member 6 |
| chr19_-_15479469 | 1.94 |
ENST00000292609.8
ENST00000340880.5 |
PGLYRP2
|
peptidoglycan recognition protein 2 |
| chr11_+_65787056 | 1.91 |
ENST00000335987.8
|
OVOL1
|
ovo like transcriptional repressor 1 |
| chr3_-_58657756 | 1.90 |
ENST00000483787.5
|
FAM3D
|
FAM3 metabolism regulating signaling molecule D |
| chr19_-_291132 | 1.86 |
ENST00000327790.7
|
PLPP2
|
phospholipid phosphatase 2 |
| chr12_+_18261511 | 1.84 |
ENST00000538779.6
ENST00000433979.6 |
PIK3C2G
|
phosphatidylinositol-4-phosphate 3-kinase catalytic subunit type 2 gamma |
| chr5_+_181040260 | 1.84 |
ENST00000515271.1
ENST00000327705.14 |
BTNL9
|
butyrophilin like 9 |
| chr4_-_128288791 | 1.79 |
ENST00000613358.4
ENST00000520121.6 |
PGRMC2
|
progesterone receptor membrane component 2 |
| chr19_-_11738882 | 1.74 |
ENST00000586121.1
ENST00000431998.1 ENST00000341191.11 ENST00000440527.1 |
ZNF823
|
zinc finger protein 823 |
| chr19_-_12035668 | 1.73 |
ENST00000455504.7
ENST00000547560.6 ENST00000552904.6 ENST00000550507.6 ENST00000419886.7 |
ZNF433
|
zinc finger protein 433 |
| chr11_-_67674725 | 1.58 |
ENST00000525827.6
ENST00000673966.1 ENST00000673873.1 |
ALDH3B2
|
aldehyde dehydrogenase 3 family member B2 |
| chr11_-_67674606 | 1.53 |
ENST00000674110.1
ENST00000349015.7 |
ALDH3B2
|
aldehyde dehydrogenase 3 family member B2 |
| chr15_+_41559189 | 1.36 |
ENST00000263798.8
|
TYRO3
|
TYRO3 protein tyrosine kinase |
| chr3_-_58657731 | 1.35 |
ENST00000498347.1
|
FAM3D
|
FAM3 metabolism regulating signaling molecule D |
| chr20_+_56630200 | 1.27 |
ENST00000416606.1
|
TFAP2C
|
transcription factor AP-2 gamma |
| chr14_-_80211472 | 1.26 |
ENST00000557125.1
ENST00000438257.9 ENST00000422005.7 |
DIO2
|
iodothyronine deiodinase 2 |
| chr1_-_112704921 | 1.24 |
ENST00000414971.1
ENST00000534717.5 |
RHOC
|
ras homolog family member C |
| chr10_+_80079036 | 1.24 |
ENST00000372273.7
|
TMEM254
|
transmembrane protein 254 |
| chr20_-_25339731 | 1.24 |
ENST00000450393.5
ENST00000491682.5 |
ABHD12
|
abhydrolase domain containing 12, lysophospholipase |
| chr21_+_32298849 | 1.20 |
ENST00000303645.10
|
MRAP
|
melanocortin 2 receptor accessory protein |
| chr10_-_50885619 | 1.20 |
ENST00000373997.8
|
A1CF
|
APOBEC1 complementation factor |
| chr2_-_189582012 | 1.14 |
ENST00000427419.5
ENST00000455320.5 |
SLC40A1
|
solute carrier family 40 member 1 |
| chr19_-_12035704 | 1.14 |
ENST00000344980.11
ENST00000550745.3 ENST00000411841.1 |
ZNF433
|
zinc finger protein 433 |
| chr14_-_21021114 | 1.11 |
ENST00000553593.5
|
NDRG2
|
NDRG family member 2 |
| chr19_-_12294819 | 1.08 |
ENST00000355684.6
ENST00000356109.10 |
ZNF44
|
zinc finger protein 44 |
| chr4_+_109815503 | 1.04 |
ENST00000394631.7
|
GAR1
|
GAR1 ribonucleoprotein |
| chr5_+_134967901 | 0.99 |
ENST00000282611.8
|
CATSPER3
|
cation channel sperm associated 3 |
| chrX_+_147911910 | 0.98 |
ENST00000370475.9
|
FMR1
|
FMRP translational regulator 1 |
| chr4_+_109815734 | 0.96 |
ENST00000226796.7
|
GAR1
|
GAR1 ribonucleoprotein |
| chr1_+_94418435 | 0.96 |
ENST00000647998.2
|
ABCD3
|
ATP binding cassette subfamily D member 3 |
| chr10_+_80078646 | 0.93 |
ENST00000372277.7
ENST00000613758.4 ENST00000372281.8 ENST00000372275.5 ENST00000372274.5 |
TMEM254
|
transmembrane protein 254 |
| chr6_+_32153441 | 0.89 |
ENST00000414204.5
ENST00000361568.6 ENST00000395523.5 |
PPT2
|
palmitoyl-protein thioesterase 2 |
| chr15_+_41838839 | 0.81 |
ENST00000458483.4
|
PLA2G4B
|
phospholipase A2 group IVB |
| chr18_+_46917492 | 0.81 |
ENST00000592005.5
|
KATNAL2
|
katanin catalytic subunit A1 like 2 |
| chrX_+_147912039 | 0.74 |
ENST00000334557.10
ENST00000439526.6 |
FMR1
|
FMRP translational regulator 1 |
| chr1_+_40258202 | 0.73 |
ENST00000372759.4
|
ZMPSTE24
|
zinc metallopeptidase STE24 |
| chr9_+_69123009 | 0.71 |
ENST00000647986.1
|
TJP2
|
tight junction protein 2 |
| chr8_-_81695045 | 0.57 |
ENST00000518568.3
|
SLC10A5
|
solute carrier family 10 member 5 |
| chr16_-_23557331 | 0.54 |
ENST00000563232.1
ENST00000449606.7 |
EARS2
|
glutamyl-tRNA synthetase 2, mitochondrial |
| chr11_-_111766042 | 0.51 |
ENST00000531373.1
|
PPP2R1B
|
protein phosphatase 2 scaffold subunit Abeta |
| chr1_+_43974902 | 0.47 |
ENST00000532642.5
ENST00000236067.8 ENST00000471859.6 ENST00000472174.7 |
ATP6V0B
|
ATPase H+ transporting V0 subunit b |
| chr11_-_120138031 | 0.46 |
ENST00000627238.1
|
TRIM29
|
tripartite motif containing 29 |
| chr1_-_16212598 | 0.42 |
ENST00000270747.8
|
ARHGEF19
|
Rho guanine nucleotide exchange factor 19 |
| chr3_+_52211442 | 0.38 |
ENST00000459884.1
|
ALAS1
|
5'-aminolevulinate synthase 1 |
| chr1_+_34782259 | 0.33 |
ENST00000373362.3
|
GJB3
|
gap junction protein beta 3 |
| chr14_+_23469681 | 0.29 |
ENST00000408901.8
ENST00000397154.7 ENST00000555128.5 |
NGDN
|
neuroguidin |
| chr19_+_11925062 | 0.27 |
ENST00000622593.4
ENST00000590798.1 |
ZNF700
ENSG00000267179.1
|
zinc finger protein 700 novel protein |
| chr19_-_43504711 | 0.26 |
ENST00000601646.1
|
PHLDB3
|
pleckstrin homology like domain family B member 3 |
| chr1_-_52055156 | 0.24 |
ENST00000371626.9
ENST00000610127.2 |
TXNDC12
|
thioredoxin domain containing 12 |
| chr11_+_119168705 | 0.24 |
ENST00000409109.6
ENST00000409991.5 ENST00000292199.6 |
NLRX1
|
NLR family member X1 |
| chr9_+_69121259 | 0.24 |
ENST00000643713.1
ENST00000606364.5 |
TJP2
|
tight junction protein 2 |
| chr6_-_43059367 | 0.23 |
ENST00000230413.9
ENST00000487429.1 ENST00000388752.8 ENST00000489623.1 ENST00000468957.1 |
MRPL2
|
mitochondrial ribosomal protein L2 |
| chr18_+_9475494 | 0.21 |
ENST00000383432.8
|
RALBP1
|
ralA binding protein 1 |
| chr11_+_119168188 | 0.18 |
ENST00000454811.5
ENST00000409265.8 ENST00000449394.5 |
NLRX1
|
NLR family member X1 |
| chr19_-_40090860 | 0.16 |
ENST00000599972.1
ENST00000450241.6 ENST00000595687.6 ENST00000340963.9 |
ZNF780A
|
zinc finger protein 780A |
| chr9_-_75088198 | 0.16 |
ENST00000376808.8
|
NMRK1
|
nicotinamide riboside kinase 1 |
| chr19_+_11925098 | 0.11 |
ENST00000254321.10
ENST00000591944.1 |
ZNF700
ENSG00000267179.1
|
zinc finger protein 700 novel protein |
| chr18_+_9474994 | 0.10 |
ENST00000019317.8
|
RALBP1
|
ralA binding protein 1 |
| chr4_+_155666718 | 0.09 |
ENST00000621234.4
ENST00000511108.5 |
GUCY1A1
|
guanylate cyclase 1 soluble subunit alpha 1 |
| chr11_+_15073562 | 0.07 |
ENST00000533448.1
ENST00000324229.11 |
CALCB
|
calcitonin related polypeptide beta |
| chr9_+_127803208 | 0.05 |
ENST00000373225.7
ENST00000431857.5 |
FPGS
|
folylpolyglutamate synthase |
| chr18_+_9475450 | 0.02 |
ENST00000585015.6
|
RALBP1
|
ralA binding protein 1 |
| chr12_-_10807286 | 0.02 |
ENST00000240615.3
|
TAS2R8
|
taste 2 receptor member 8 |
| chr3_-_172523423 | 0.00 |
ENST00000241261.7
|
TNFSF10
|
TNF superfamily member 10 |
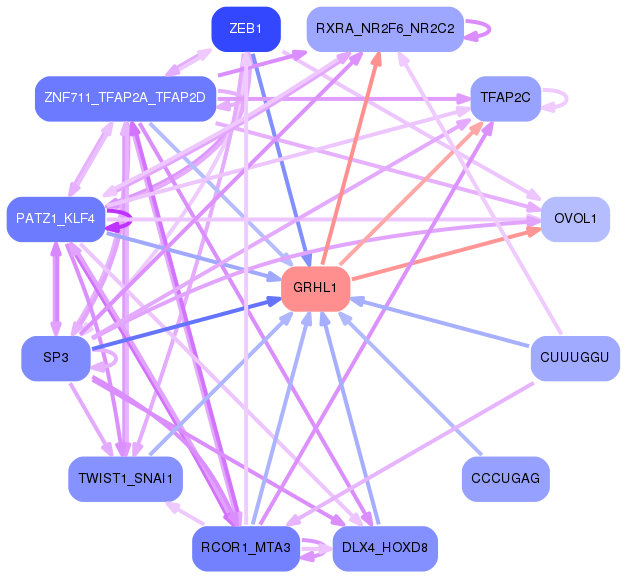
Network of associatons between targets according to the STRING database.

First level regulatory network of GRHL1
Gene Ontology Analysis
Gene overrepresentation in biological process category:
| Log-likelihood per target | Total log-likelihood | Term | Description |
|---|---|---|---|
| 2.4 | 7.2 | GO:2001287 | negative regulation of caveolin-mediated endocytosis(GO:2001287) |
| 1.7 | 8.7 | GO:0061073 | ciliary body morphogenesis(GO:0061073) |
| 1.0 | 2.9 | GO:0006097 | glyoxylate cycle(GO:0006097) |
| 0.9 | 3.8 | GO:2001027 | negative regulation of endothelial cell chemotaxis(GO:2001027) |
| 0.7 | 4.4 | GO:0060214 | endocardium formation(GO:0060214) |
| 0.6 | 1.9 | GO:0032827 | negative regulation of natural killer cell differentiation(GO:0032824) negative regulation of natural killer cell differentiation involved in immune response(GO:0032827) |
| 0.6 | 4.6 | GO:0021650 | vestibulocochlear nerve formation(GO:0021650) |
| 0.5 | 10.0 | GO:1900029 | positive regulation of ruffle assembly(GO:1900029) |
| 0.5 | 2.0 | GO:0000454 | snoRNA guided rRNA pseudouridine synthesis(GO:0000454) |
| 0.4 | 3.2 | GO:0003350 | pulmonary myocardium development(GO:0003350) |
| 0.4 | 4.8 | GO:0016554 | cytidine to uridine editing(GO:0016554) |
| 0.4 | 3.5 | GO:0051725 | protein de-ADP-ribosylation(GO:0051725) |
| 0.4 | 1.9 | GO:1901994 | negative regulation of meiotic cell cycle phase transition(GO:1901994) |
| 0.4 | 1.1 | GO:1903988 | spleen trabecula formation(GO:0060345) iron cation export(GO:1903414) ferrous iron export(GO:1903988) |
| 0.3 | 1.7 | GO:1901254 | modulation by host of viral RNA genome replication(GO:0044830) positive regulation of intracellular transport of viral material(GO:1901254) |
| 0.3 | 1.2 | GO:0046462 | monoacylglycerol metabolic process(GO:0046462) monoacylglycerol catabolic process(GO:0052651) |
| 0.3 | 4.9 | GO:1901750 | leukotriene D4 metabolic process(GO:1901748) leukotriene D4 biosynthetic process(GO:1901750) |
| 0.2 | 1.2 | GO:1902766 | skeletal muscle satellite cell migration(GO:1902766) |
| 0.2 | 0.7 | GO:0071586 | prenylated protein catabolic process(GO:0030327) CAAX-box protein processing(GO:0071586) CAAX-box protein maturation(GO:0080120) |
| 0.2 | 1.0 | GO:0015910 | peroxisomal long-chain fatty acid import(GO:0015910) |
| 0.2 | 2.6 | GO:0071073 | positive regulation of phospholipid biosynthetic process(GO:0071073) |
| 0.2 | 6.3 | GO:0031268 | pseudopodium organization(GO:0031268) |
| 0.2 | 5.5 | GO:0050962 | detection of light stimulus involved in visual perception(GO:0050908) detection of light stimulus involved in sensory perception(GO:0050962) |
| 0.1 | 3.1 | GO:0006068 | ethanol catabolic process(GO:0006068) |
| 0.1 | 8.4 | GO:0042531 | positive regulation of tyrosine phosphorylation of STAT protein(GO:0042531) |
| 0.1 | 1.4 | GO:0060068 | vagina development(GO:0060068) |
| 0.1 | 0.9 | GO:0071847 | TNFSF11-mediated signaling pathway(GO:0071847) |
| 0.1 | 2.1 | GO:0050965 | detection of temperature stimulus involved in sensory perception(GO:0050961) detection of temperature stimulus involved in sensory perception of pain(GO:0050965) |
| 0.1 | 0.9 | GO:0098734 | macromolecule depalmitoylation(GO:0098734) |
| 0.1 | 0.5 | GO:0070127 | tRNA aminoacylation for mitochondrial protein translation(GO:0070127) |
| 0.1 | 1.2 | GO:0001514 | selenocysteine incorporation(GO:0001514) translational readthrough(GO:0006451) |
| 0.1 | 1.1 | GO:0090361 | platelet-derived growth factor production(GO:0090360) regulation of platelet-derived growth factor production(GO:0090361) |
| 0.0 | 3.3 | GO:0046676 | negative regulation of insulin secretion(GO:0046676) |
| 0.0 | 1.8 | GO:0039694 | viral RNA genome replication(GO:0039694) RNA replication(GO:0039703) |
| 0.0 | 0.8 | GO:0036148 | phosphatidylglycerol acyl-chain remodeling(GO:0036148) |
| 0.0 | 1.9 | GO:0046839 | phospholipid dephosphorylation(GO:0046839) |
| 0.0 | 1.0 | GO:0048240 | sperm capacitation(GO:0048240) |
| 0.0 | 0.5 | GO:2001241 | positive regulation of extrinsic apoptotic signaling pathway in absence of ligand(GO:2001241) |
| 0.0 | 2.2 | GO:0050829 | defense response to Gram-negative bacterium(GO:0050829) |
| 0.0 | 3.3 | GO:1900181 | negative regulation of protein localization to nucleus(GO:1900181) |
| 0.0 | 11.0 | GO:0007160 | cell-matrix adhesion(GO:0007160) |
| 0.0 | 1.2 | GO:0050873 | brown fat cell differentiation(GO:0050873) |
| 0.0 | 0.4 | GO:0006782 | protoporphyrinogen IX biosynthetic process(GO:0006782) |
| 0.0 | 3.3 | GO:0051592 | response to calcium ion(GO:0051592) |
| 0.0 | 0.2 | GO:0039536 | negative regulation of RIG-I signaling pathway(GO:0039536) |
Gene overrepresentation in cellular component category:
| Log-likelihood per target | Total log-likelihood | Term | Description |
|---|---|---|---|
| 1.2 | 7.2 | GO:0044393 | microspike(GO:0044393) |
| 1.2 | 4.8 | GO:0030895 | apolipoprotein B mRNA editing enzyme complex(GO:0030895) |
| 0.3 | 1.7 | GO:1902737 | dendritic filopodium(GO:1902737) |
| 0.3 | 2.0 | GO:0072589 | box H/ACA scaRNP complex(GO:0072589) box H/ACA telomerase RNP complex(GO:0090661) |
| 0.2 | 6.3 | GO:0031143 | pseudopodium(GO:0031143) |
| 0.1 | 3.8 | GO:0036019 | endolysosome(GO:0036019) |
| 0.1 | 1.0 | GO:0036128 | CatSper complex(GO:0036128) |
| 0.1 | 5.8 | GO:0032420 | stereocilium(GO:0032420) |
| 0.1 | 5.5 | GO:0001917 | photoreceptor inner segment(GO:0001917) |
| 0.1 | 7.4 | GO:0005881 | cytoplasmic microtubule(GO:0005881) |
| 0.1 | 11.0 | GO:0005604 | basement membrane(GO:0005604) |
| 0.1 | 3.8 | GO:0005782 | peroxisomal matrix(GO:0005782) microbody lumen(GO:0031907) |
| 0.0 | 1.8 | GO:0005942 | phosphatidylinositol 3-kinase complex(GO:0005942) |
| 0.0 | 10.0 | GO:0032587 | ruffle membrane(GO:0032587) |
| 0.0 | 0.3 | GO:0000220 | vacuolar proton-transporting V-type ATPase, V0 domain(GO:0000220) |
| 0.0 | 3.1 | GO:0005811 | lipid particle(GO:0005811) |
| 0.0 | 4.1 | GO:0005913 | cell-cell adherens junction(GO:0005913) |
| 0.0 | 9.4 | GO:0009897 | external side of plasma membrane(GO:0009897) |
| 0.0 | 1.2 | GO:0032281 | AMPA glutamate receptor complex(GO:0032281) |
| 0.0 | 0.3 | GO:0005922 | connexon complex(GO:0005922) |
Gene overrepresentation in molecular function category:
| Log-likelihood per target | Total log-likelihood | Term | Description |
|---|---|---|---|
| 3.7 | 11.0 | GO:0005055 | laminin receptor activity(GO:0005055) |
| 1.0 | 2.9 | GO:0051990 | isocitrate dehydrogenase (NADP+) activity(GO:0004450) (R)-2-hydroxyglutarate dehydrogenase activity(GO:0051990) |
| 0.5 | 1.9 | GO:0008745 | N-acetylmuramoyl-L-alanine amidase activity(GO:0008745) |
| 0.4 | 2.2 | GO:0042015 | interleukin-20 binding(GO:0042015) |
| 0.4 | 1.2 | GO:0031783 | corticotropin hormone receptor binding(GO:0031780) type 5 melanocortin receptor binding(GO:0031783) |
| 0.4 | 1.1 | GO:0097689 | iron channel activity(GO:0097689) |
| 0.3 | 1.9 | GO:0042392 | sphingosine-1-phosphate phosphatase activity(GO:0042392) |
| 0.3 | 4.6 | GO:1901612 | cardiolipin binding(GO:1901612) |
| 0.3 | 4.9 | GO:0036374 | glutathione hydrolase activity(GO:0036374) |
| 0.2 | 2.0 | GO:0034513 | box H/ACA snoRNA binding(GO:0034513) |
| 0.2 | 6.3 | GO:0031489 | myosin V binding(GO:0031489) |
| 0.2 | 3.1 | GO:0004028 | 3-chloroallyl aldehyde dehydrogenase activity(GO:0004028) |
| 0.2 | 10.0 | GO:0030676 | Rac guanyl-nucleotide exchange factor activity(GO:0030676) |
| 0.2 | 1.2 | GO:0004800 | thyroxine 5'-deiodinase activity(GO:0004800) |
| 0.2 | 1.7 | GO:0034046 | poly(G) binding(GO:0034046) |
| 0.1 | 1.0 | GO:0005324 | long-chain fatty acid transporter activity(GO:0005324) |
| 0.1 | 1.8 | GO:0035005 | 1-phosphatidylinositol-4-phosphate 3-kinase activity(GO:0035005) |
| 0.1 | 3.8 | GO:0043395 | heparan sulfate proteoglycan binding(GO:0043395) |
| 0.1 | 3.2 | GO:0030215 | semaphorin receptor binding(GO:0030215) |
| 0.1 | 4.1 | GO:0098641 | cadherin binding involved in cell-cell adhesion(GO:0098641) |
| 0.1 | 2.1 | GO:0004887 | thyroid hormone receptor activity(GO:0004887) |
| 0.1 | 0.6 | GO:0008508 | bile acid:sodium symporter activity(GO:0008508) |
| 0.1 | 7.2 | GO:0015485 | cholesterol binding(GO:0015485) |
| 0.1 | 0.4 | GO:0003870 | 5-aminolevulinate synthase activity(GO:0003870) N-succinyltransferase activity(GO:0016749) |
| 0.1 | 0.9 | GO:0098599 | palmitoyl-(protein) hydrolase activity(GO:0008474) palmitoyl hydrolase activity(GO:0098599) |
| 0.1 | 1.4 | GO:0004716 | receptor signaling protein tyrosine kinase activity(GO:0004716) |
| 0.1 | 0.8 | GO:0047498 | calcium-dependent phospholipase A2 activity(GO:0047498) |
| 0.1 | 1.2 | GO:0047372 | acylglycerol lipase activity(GO:0047372) |
| 0.1 | 0.8 | GO:0008568 | microtubule-severing ATPase activity(GO:0008568) |
| 0.0 | 0.2 | GO:0061769 | ribosylnicotinamide kinase activity(GO:0050262) ribosylnicotinate kinase activity(GO:0061769) |
| 0.0 | 4.8 | GO:0003727 | single-stranded RNA binding(GO:0003727) |
| 0.0 | 3.5 | GO:0019213 | deacetylase activity(GO:0019213) |
| 0.0 | 1.8 | GO:0005496 | steroid binding(GO:0005496) |
| 0.0 | 0.5 | GO:0016876 | aminoacyl-tRNA ligase activity(GO:0004812) ligase activity, forming carbon-oxygen bonds(GO:0016875) ligase activity, forming aminoacyl-tRNA and related compounds(GO:0016876) |
| 0.0 | 10.7 | GO:0045296 | cadherin binding(GO:0045296) |
| 0.0 | 0.3 | GO:0005243 | gap junction channel activity(GO:0005243) |
| 0.0 | 0.2 | GO:0015037 | peptide disulfide oxidoreductase activity(GO:0015037) |
| 0.0 | 3.2 | GO:0001078 | transcriptional repressor activity, RNA polymerase II core promoter proximal region sequence-specific binding(GO:0001078) |
| 0.0 | 1.0 | GO:0005245 | voltage-gated calcium channel activity(GO:0005245) |
| 0.0 | 0.3 | GO:0017160 | Ral GTPase binding(GO:0017160) |
Gene overrepresentation in curated gene sets: canonical pathways category:
| Log-likelihood per target | Total log-likelihood | Term | Description |
|---|---|---|---|
| 0.0 | 8.4 | NABA ECM GLYCOPROTEINS | Genes encoding structural ECM glycoproteins |
| 0.0 | 1.2 | PID PRL SIGNALING EVENTS PATHWAY | Signaling events mediated by PRL |
| 0.0 | 1.8 | ST DIFFERENTIATION PATHWAY IN PC12 CELLS | Differentiation Pathway in PC12 Cells; this is a specific case of PAC1 Receptor Pathway. |
| 0.0 | 2.1 | PID MYC REPRESS PATHWAY | Validated targets of C-MYC transcriptional repression |
| 0.0 | 1.3 | PID TAP63 PATHWAY | Validated transcriptional targets of TAp63 isoforms |
| 0.0 | 3.2 | NABA ECM AFFILIATED | Genes encoding proteins affiliated structurally or functionally to extracellular matrix proteins |
Gene overrepresentation in curated gene sets: REACTOME pathways category:
| Log-likelihood per target | Total log-likelihood | Term | Description |
|---|---|---|---|
| 0.1 | 2.9 | REACTOME PEROXISOMAL LIPID METABOLISM | Genes involved in Peroxisomal lipid metabolism |
| 0.1 | 4.6 | REACTOME ION TRANSPORT BY P TYPE ATPASES | Genes involved in Ion transport by P-type ATPases |
| 0.1 | 1.8 | REACTOME SYNTHESIS OF PIPS AT THE GOLGI MEMBRANE | Genes involved in Synthesis of PIPs at the Golgi membrane |
| 0.0 | 1.2 | REACTOME AMINE DERIVED HORMONES | Genes involved in Amine-derived hormones |
| 0.0 | 1.0 | REACTOME ABCA TRANSPORTERS IN LIPID HOMEOSTASIS | Genes involved in ABCA transporters in lipid homeostasis |
| 0.0 | 0.9 | REACTOME APOPTOTIC CLEAVAGE OF CELL ADHESION PROTEINS | Genes involved in Apoptotic cleavage of cell adhesion proteins |
| 0.0 | 0.5 | REACTOME INHIBITION OF REPLICATION INITIATION OF DAMAGED DNA BY RB1 E2F1 | Genes involved in Inhibition of replication initiation of damaged DNA by RB1/E2F1 |
| 0.0 | 1.2 | REACTOME SEMA4D INDUCED CELL MIGRATION AND GROWTH CONE COLLAPSE | Genes involved in Sema4D induced cell migration and growth-cone collapse |
| 0.0 | 1.1 | REACTOME METAL ION SLC TRANSPORTERS | Genes involved in Metal ion SLC transporters |
| 0.0 | 0.5 | REACTOME MITOCHONDRIAL TRNA AMINOACYLATION | Genes involved in Mitochondrial tRNA aminoacylation |
| 0.0 | 4.5 | REACTOME MRNA PROCESSING | Genes involved in mRNA Processing |
| 0.0 | 2.1 | REACTOME NUCLEAR RECEPTOR TRANSCRIPTION PATHWAY | Genes involved in Nuclear Receptor transcription pathway |
| 0.0 | 0.4 | REACTOME METABOLISM OF PORPHYRINS | Genes involved in Metabolism of porphyrins |
| 0.0 | 0.3 | REACTOME GAP JUNCTION ASSEMBLY | Genes involved in Gap junction assembly |
| 0.0 | 2.2 | REACTOME RESPONSE TO ELEVATED PLATELET CYTOSOLIC CA2 | Genes involved in Response to elevated platelet cytosolic Ca2+ |