Project
Illumina Body Map 2 (GSE30611)
Navigation
Downloads
Results for GUAAACA
Z-value: 1.39
Motif logo

miRNA associated with seed GUAAACA
| Name | miRBASE accession |
|---|---|
|
hsa-miR-30a-5p
|
MIMAT0000087 |
|
hsa-miR-30b-5p
|
MIMAT0000420 |
|
hsa-miR-30c-5p
|
MIMAT0000244 |
|
hsa-miR-30d-5p
|
MIMAT0000245 |
|
hsa-miR-30e-5p
|
MIMAT0000692 |
Activity profile of GUAAACA motif
Sorted Z-values of GUAAACA motif
| Promoter | Log-likelihood | Transcript | Gene | Gene Info |
|---|---|---|---|---|
| chr5_+_111224374 | 3.29 |
ENST00000282356.9
|
CAMK4
|
calcium/calmodulin dependent protein kinase IV |
| chr14_-_99272184 | 2.71 |
ENST00000357195.8
|
BCL11B
|
BAF chromatin remodeling complex subunit BCL11B |
| chr2_+_181457342 | 2.51 |
ENST00000397033.7
ENST00000233573.6 |
ITGA4
|
integrin subunit alpha 4 |
| chr5_-_157575767 | 2.44 |
ENST00000257527.9
|
ADAM19
|
ADAM metallopeptidase domain 19 |
| chr10_-_22714531 | 2.36 |
ENST00000376573.9
|
PIP4K2A
|
phosphatidylinositol-5-phosphate 4-kinase type 2 alpha |
| chr18_+_54828406 | 2.32 |
ENST00000262094.10
|
RAB27B
|
RAB27B, member RAS oncogene family |
| chr2_-_174634566 | 2.24 |
ENST00000392547.6
|
WIPF1
|
WAS/WASL interacting protein family member 1 |
| chr16_-_84618067 | 2.05 |
ENST00000262428.5
|
COTL1
|
coactosin like F-actin binding protein 1 |
| chr6_-_30687200 | 2.05 |
ENST00000399199.7
|
PPP1R18
|
protein phosphatase 1 regulatory subunit 18 |
| chr12_+_94148553 | 2.00 |
ENST00000258526.9
|
PLXNC1
|
plexin C1 |
| chr19_-_11339573 | 1.92 |
ENST00000222120.8
|
RAB3D
|
RAB3D, member RAS oncogene family |
| chr2_-_181680490 | 1.90 |
ENST00000684145.1
ENST00000295108.4 ENST00000684079.1 ENST00000683430.1 |
CERKL
NEUROD1
|
ceramide kinase like neuronal differentiation 1 |
| chr19_+_18097763 | 1.87 |
ENST00000262811.10
|
MAST3
|
microtubule associated serine/threonine kinase 3 |
| chr15_-_34336749 | 1.82 |
ENST00000397707.6
ENST00000560611.5 |
SLC12A6
|
solute carrier family 12 member 6 |
| chr2_-_16665816 | 1.75 |
ENST00000406434.5
ENST00000381323.7 |
CYRIA
|
CYFIP related Rac1 interactor A |
| chr6_+_391743 | 1.71 |
ENST00000380956.9
|
IRF4
|
interferon regulatory factor 4 |
| chr19_+_926001 | 1.66 |
ENST00000263620.8
|
ARID3A
|
AT-rich interaction domain 3A |
| chr20_-_32207708 | 1.66 |
ENST00000246229.5
|
PLAGL2
|
PLAG1 like zinc finger 2 |
| chr15_+_51751587 | 1.64 |
ENST00000539962.6
ENST00000249700.9 |
TMOD2
|
tropomodulin 2 |
| chr7_+_66628864 | 1.62 |
ENST00000639828.2
ENST00000275532.8 ENST00000640385.1 |
KCTD7
|
potassium channel tetramerization domain containing 7 |
| chr7_-_55572483 | 1.59 |
ENST00000285279.10
|
VOPP1
|
VOPP1 WW domain binding protein |
| chr4_-_25862979 | 1.58 |
ENST00000399878.8
|
SEL1L3
|
SEL1L family member 3 |
| chr5_-_100903252 | 1.58 |
ENST00000231461.10
|
ST8SIA4
|
ST8 alpha-N-acetyl-neuraminide alpha-2,8-sialyltransferase 4 |
| chr7_+_87876472 | 1.57 |
ENST00000265728.6
|
DBF4
|
DBF4 zinc finger |
| chr13_-_74133892 | 1.57 |
ENST00000377669.7
|
KLF12
|
Kruppel like factor 12 |
| chr17_-_30824665 | 1.56 |
ENST00000324238.7
|
CRLF3
|
cytokine receptor like factor 3 |
| chr14_-_23578756 | 1.56 |
ENST00000397118.7
ENST00000356300.9 |
JPH4
|
junctophilin 4 |
| chr3_+_141487008 | 1.55 |
ENST00000286364.9
ENST00000452898.2 |
RASA2
|
RAS p21 protein activator 2 |
| chr12_-_89656051 | 1.49 |
ENST00000261173.6
|
ATP2B1
|
ATPase plasma membrane Ca2+ transporting 1 |
| chr5_+_56815534 | 1.49 |
ENST00000399503.4
|
MAP3K1
|
mitogen-activated protein kinase kinase kinase 1 |
| chr1_-_115089414 | 1.48 |
ENST00000433172.3
ENST00000369515.6 ENST00000369516.7 |
TSPAN2
|
tetraspanin 2 |
| chr1_+_50108856 | 1.45 |
ENST00000650764.1
ENST00000494555.2 ENST00000371824.7 ENST00000371823.8 ENST00000652693.1 |
ELAVL4
|
ELAV like RNA binding protein 4 |
| chr16_+_28292485 | 1.43 |
ENST00000341901.5
|
SBK1
|
SH3 domain binding kinase 1 |
| chr4_-_101347471 | 1.40 |
ENST00000323055.10
ENST00000512215.5 |
PPP3CA
|
protein phosphatase 3 catalytic subunit alpha |
| chr12_-_53232182 | 1.38 |
ENST00000425354.7
ENST00000546717.1 ENST00000394426.5 |
RARG
|
retinoic acid receptor gamma |
| chr6_+_106098933 | 1.36 |
ENST00000369089.3
|
PRDM1
|
PR/SET domain 1 |
| chr13_-_21459226 | 1.36 |
ENST00000320220.13
|
ZDHHC20
|
zinc finger DHHC-type palmitoyltransferase 20 |
| chr2_-_100104530 | 1.36 |
ENST00000432037.5
ENST00000673232.1 ENST00000423966.6 ENST00000409236.6 |
AFF3
|
AF4/FMR2 family member 3 |
| chr2_-_165794190 | 1.35 |
ENST00000392701.8
ENST00000422973.1 |
GALNT3
|
polypeptide N-acetylgalactosaminyltransferase 3 |
| chr22_+_20917398 | 1.34 |
ENST00000354336.8
|
CRKL
|
CRK like proto-oncogene, adaptor protein |
| chr17_+_44557476 | 1.33 |
ENST00000315323.5
|
FZD2
|
frizzled class receptor 2 |
| chr6_-_89352706 | 1.33 |
ENST00000435041.3
|
UBE2J1
|
ubiquitin conjugating enzyme E2 J1 |
| chr7_-_143362687 | 1.32 |
ENST00000409578.5
ENST00000443739.7 ENST00000409346.5 |
FAM131B
|
family with sequence similarity 131 member B |
| chr1_-_107965009 | 1.31 |
ENST00000527011.5
ENST00000370056.9 |
VAV3
|
vav guanine nucleotide exchange factor 3 |
| chr11_+_63813384 | 1.28 |
ENST00000294244.9
|
SPINDOC
|
spindlin interactor and repressor of chromatin binding |
| chr21_+_29298890 | 1.28 |
ENST00000286800.8
|
BACH1
|
BTB domain and CNC homolog 1 |
| chr1_-_201023694 | 1.27 |
ENST00000332129.6
ENST00000422435.2 ENST00000461742.7 |
KIF21B
|
kinesin family member 21B |
| chr6_-_42451910 | 1.25 |
ENST00000372922.8
ENST00000541110.5 |
TRERF1
|
transcriptional regulating factor 1 |
| chr15_-_52529050 | 1.25 |
ENST00000399231.7
|
MYO5A
|
myosin VA |
| chr6_+_152750789 | 1.25 |
ENST00000367244.8
ENST00000367243.7 |
VIP
|
vasoactive intestinal peptide |
| chr1_+_244051275 | 1.25 |
ENST00000358704.4
|
ZBTB18
|
zinc finger and BTB domain containing 18 |
| chr18_-_69956924 | 1.24 |
ENST00000581982.5
ENST00000280200.8 |
CD226
|
CD226 molecule |
| chr19_-_4066892 | 1.23 |
ENST00000322357.9
|
ZBTB7A
|
zinc finger and BTB domain containing 7A |
| chr1_+_44405247 | 1.22 |
ENST00000361799.7
ENST00000372247.6 |
RNF220
|
ring finger protein 220 |
| chr4_+_56216101 | 1.22 |
ENST00000504228.6
|
CRACD
|
capping protein inhibiting regulator of actin dynamics |
| chr16_-_30010972 | 1.19 |
ENST00000565273.5
ENST00000567332.6 ENST00000350119.9 |
DOC2A
|
double C2 domain alpha |
| chr19_-_6110463 | 1.19 |
ENST00000587181.1
ENST00000587321.1 ENST00000586806.1 ENST00000303657.10 ENST00000589742.5 ENST00000592546.5 |
RFX2
|
regulatory factor X2 |
| chr16_+_56191476 | 1.19 |
ENST00000262493.12
|
GNAO1
|
G protein subunit alpha o1 |
| chr8_-_81112055 | 1.19 |
ENST00000220597.4
|
PAG1
|
phosphoprotein membrane anchor with glycosphingolipid microdomains 1 |
| chr6_+_146543824 | 1.16 |
ENST00000367495.4
|
RAB32
|
RAB32, member RAS oncogene family |
| chr1_-_89126066 | 1.16 |
ENST00000370466.4
|
GBP2
|
guanylate binding protein 2 |
| chr6_+_45328203 | 1.14 |
ENST00000371432.7
ENST00000647337.2 ENST00000371438.5 |
RUNX2
|
RUNX family transcription factor 2 |
| chr8_+_24914942 | 1.13 |
ENST00000433454.3
|
NEFM
|
neurofilament medium |
| chr7_-_149497750 | 1.11 |
ENST00000458143.6
ENST00000340622.8 ENST00000644635.1 |
ZNF746
|
zinc finger protein 746 |
| chr12_+_67269328 | 1.10 |
ENST00000545606.6
|
CAND1
|
cullin associated and neddylation dissociated 1 |
| chr11_+_94543894 | 1.10 |
ENST00000358752.4
|
FUT4
|
fucosyltransferase 4 |
| chr6_-_118651522 | 1.08 |
ENST00000368491.8
|
CEP85L
|
centrosomal protein 85 like |
| chr16_+_68085552 | 1.08 |
ENST00000329524.8
|
NFATC3
|
nuclear factor of activated T cells 3 |
| chr7_+_18495723 | 1.08 |
ENST00000681950.1
ENST00000622668.4 ENST00000405010.7 ENST00000406451.8 ENST00000441542.7 ENST00000428307.6 ENST00000681273.1 |
HDAC9
|
histone deacetylase 9 |
| chr7_+_21428023 | 1.08 |
ENST00000432066.2
ENST00000222584.8 |
SP4
|
Sp4 transcription factor |
| chr1_+_174799895 | 1.08 |
ENST00000489615.5
|
RABGAP1L
|
RAB GTPase activating protein 1 like |
| chr10_+_17229267 | 1.07 |
ENST00000224237.9
|
VIM
|
vimentin |
| chr11_+_46332905 | 1.06 |
ENST00000343674.10
|
DGKZ
|
diacylglycerol kinase zeta |
| chr10_+_93758063 | 1.06 |
ENST00000627699.1
ENST00000371413.4 |
LGI1
|
leucine rich glioma inactivated 1 |
| chr3_-_101677119 | 1.06 |
ENST00000312938.5
|
ZBTB11
|
zinc finger and BTB domain containing 11 |
| chr12_-_76559504 | 1.05 |
ENST00000547544.5
ENST00000393249.6 |
OSBPL8
|
oxysterol binding protein like 8 |
| chr8_+_55879818 | 1.04 |
ENST00000520220.6
ENST00000519728.6 |
LYN
|
LYN proto-oncogene, Src family tyrosine kinase |
| chr5_+_134115563 | 1.03 |
ENST00000517851.5
ENST00000521639.5 ENST00000522375.5 ENST00000378560.8 ENST00000520958.5 ENST00000518915.5 ENST00000395023.5 |
TCF7
|
transcription factor 7 |
| chr3_+_153162196 | 1.03 |
ENST00000323534.5
|
RAP2B
|
RAP2B, member of RAS oncogene family |
| chr2_-_168247569 | 1.03 |
ENST00000355999.5
|
STK39
|
serine/threonine kinase 39 |
| chr19_-_18522051 | 1.02 |
ENST00000262809.9
|
ELL
|
elongation factor for RNA polymerase II |
| chr22_-_17121311 | 1.00 |
ENST00000331437.4
ENST00000399875.1 |
TMEM121B
|
transmembrane protein 121B |
| chr4_-_36244438 | 1.00 |
ENST00000303965.9
|
ARAP2
|
ArfGAP with RhoGAP domain, ankyrin repeat and PH domain 2 |
| chr17_-_44123628 | 0.98 |
ENST00000587135.1
ENST00000225983.10 ENST00000682912.1 ENST00000588703.5 |
HDAC5
|
histone deacetylase 5 |
| chr15_-_83284645 | 0.97 |
ENST00000345382.7
|
BNC1
|
basonuclin 1 |
| chr1_-_6180265 | 0.96 |
ENST00000262450.8
|
CHD5
|
chromodomain helicase DNA binding protein 5 |
| chr8_+_28494190 | 0.96 |
ENST00000537916.2
ENST00000240093.8 ENST00000523546.1 |
FZD3
|
frizzled class receptor 3 |
| chr3_-_150763093 | 0.96 |
ENST00000312960.4
|
SIAH2
|
siah E3 ubiquitin protein ligase 2 |
| chr12_+_110468803 | 0.96 |
ENST00000377673.10
|
FAM216A
|
family with sequence similarity 216 member A |
| chr2_-_196171565 | 0.95 |
ENST00000263955.9
|
STK17B
|
serine/threonine kinase 17b |
| chr2_-_234497035 | 0.95 |
ENST00000390645.2
ENST00000339728.6 |
ARL4C
|
ADP ribosylation factor like GTPase 4C |
| chr2_-_25982471 | 0.94 |
ENST00000264712.8
|
KIF3C
|
kinesin family member 3C |
| chr16_+_29812230 | 0.94 |
ENST00000300797.7
ENST00000637403.1 ENST00000572820.2 ENST00000637064.1 ENST00000636246.1 |
PRRT2
|
proline rich transmembrane protein 2 |
| chr12_-_49110840 | 0.94 |
ENST00000550137.5
ENST00000267102.13 ENST00000547382.5 |
LMBR1L
|
limb development membrane protein 1 like |
| chr10_+_111077021 | 0.93 |
ENST00000280155.4
|
ADRA2A
|
adrenoceptor alpha 2A |
| chr17_-_65056659 | 0.92 |
ENST00000439174.7
|
GNA13
|
G protein subunit alpha 13 |
| chr4_+_173168800 | 0.92 |
ENST00000512285.5
ENST00000265000.9 |
GALNT7
|
polypeptide N-acetylgalactosaminyltransferase 7 |
| chr1_+_89821003 | 0.91 |
ENST00000525774.5
ENST00000337338.9 |
LRRC8D
|
leucine rich repeat containing 8 VRAC subunit D |
| chr11_+_118436464 | 0.91 |
ENST00000389506.10
ENST00000534358.8 ENST00000531904.6 ENST00000649699.1 |
KMT2A
|
lysine methyltransferase 2A |
| chr22_+_40177917 | 0.91 |
ENST00000454349.7
ENST00000335727.13 |
TNRC6B
|
trinucleotide repeat containing adaptor 6B |
| chr14_+_76761453 | 0.91 |
ENST00000167106.9
|
VASH1
|
vasohibin 1 |
| chr1_+_112674416 | 0.90 |
ENST00000413052.6
ENST00000369645.5 |
MOV10
|
Mov10 RISC complex RNA helicase |
| chr7_-_84194781 | 0.90 |
ENST00000265362.9
|
SEMA3A
|
semaphorin 3A |
| chr1_+_197912462 | 0.89 |
ENST00000475727.1
ENST00000367391.5 ENST00000367390.7 |
LHX9
|
LIM homeobox 9 |
| chr1_+_205043204 | 0.89 |
ENST00000331830.7
|
CNTN2
|
contactin 2 |
| chr12_+_68610858 | 0.89 |
ENST00000393436.9
ENST00000425247.6 ENST00000250559.14 ENST00000489473.6 ENST00000422358.6 ENST00000541167.5 ENST00000538283.5 ENST00000341355.9 ENST00000537460.5 ENST00000450214.6 ENST00000545270.5 |
RAP1B
|
RAP1B, member of RAS oncogene family |
| chr9_-_23821275 | 0.89 |
ENST00000380110.8
|
ELAVL2
|
ELAV like RNA binding protein 2 |
| chr15_-_65286837 | 0.89 |
ENST00000444347.2
ENST00000261888.10 ENST00000649807.2 |
PARP16
|
poly(ADP-ribose) polymerase family member 16 |
| chr1_+_112619824 | 0.89 |
ENST00000263168.4
|
CAPZA1
|
capping actin protein of muscle Z-line subunit alpha 1 |
| chr3_+_143119749 | 0.88 |
ENST00000309575.5
|
CHST2
|
carbohydrate sulfotransferase 2 |
| chr18_+_26226417 | 0.88 |
ENST00000269142.10
|
TAF4B
|
TATA-box binding protein associated factor 4b |
| chr4_+_26860778 | 0.88 |
ENST00000467011.6
|
STIM2
|
stromal interaction molecule 2 |
| chr4_-_152679984 | 0.88 |
ENST00000304385.8
ENST00000504064.1 |
TMEM154
|
transmembrane protein 154 |
| chr18_+_56651335 | 0.87 |
ENST00000589935.1
ENST00000254442.8 ENST00000357574.7 |
WDR7
|
WD repeat domain 7 |
| chr17_-_78874140 | 0.87 |
ENST00000585421.5
|
TIMP2
|
TIMP metallopeptidase inhibitor 2 |
| chr9_-_16870662 | 0.87 |
ENST00000380672.9
|
BNC2
|
basonuclin 2 |
| chr19_+_41310148 | 0.87 |
ENST00000269967.4
|
CCDC97
|
coiled-coil domain containing 97 |
| chr11_+_65787056 | 0.86 |
ENST00000335987.8
|
OVOL1
|
ovo like transcriptional repressor 1 |
| chr14_-_45253161 | 0.86 |
ENST00000451174.1
ENST00000310806.9 |
MIS18BP1
|
MIS18 binding protein 1 |
| chr6_+_133889105 | 0.86 |
ENST00000367882.5
|
TCF21
|
transcription factor 21 |
| chr3_-_52278620 | 0.85 |
ENST00000296490.8
|
WDR82
|
WD repeat domain 82 |
| chr14_+_96363452 | 0.85 |
ENST00000438650.5
ENST00000553699.5 ENST00000554182.5 ENST00000555181.6 ENST00000556095.5 |
GSKIP
|
GSK3B interacting protein |
| chr12_-_122266425 | 0.85 |
ENST00000643696.1
ENST00000267199.9 |
VPS33A
|
VPS33A core subunit of CORVET and HOPS complexes |
| chr11_-_74398378 | 0.85 |
ENST00000298198.5
|
PGM2L1
|
phosphoglucomutase 2 like 1 |
| chr3_+_50236192 | 0.83 |
ENST00000313601.11
|
GNAI2
|
G protein subunit alpha i2 |
| chr3_-_56801939 | 0.83 |
ENST00000296315.8
ENST00000495373.5 |
ARHGEF3
|
Rho guanine nucleotide exchange factor 3 |
| chr1_+_12063285 | 0.83 |
ENST00000263932.7
|
TNFRSF8
|
TNF receptor superfamily member 8 |
| chr3_-_18425295 | 0.83 |
ENST00000338745.11
ENST00000450898.1 |
SATB1
|
SATB homeobox 1 |
| chr15_+_64841873 | 0.83 |
ENST00000616065.4
ENST00000323544.5 |
PLEKHO2
|
pleckstrin homology domain containing O2 |
| chr1_+_9651723 | 0.83 |
ENST00000377346.9
ENST00000536656.5 ENST00000628140.2 |
PIK3CD
|
phosphatidylinositol-4,5-bisphosphate 3-kinase catalytic subunit delta |
| chr2_-_86337654 | 0.83 |
ENST00000165698.9
|
REEP1
|
receptor accessory protein 1 |
| chr11_-_22625804 | 0.82 |
ENST00000327470.6
|
FANCF
|
FA complementation group F |
| chrX_-_80809854 | 0.82 |
ENST00000373275.5
|
BRWD3
|
bromodomain and WD repeat domain containing 3 |
| chr5_+_179732811 | 0.82 |
ENST00000292599.4
|
MAML1
|
mastermind like transcriptional coactivator 1 |
| chr5_-_111757704 | 0.82 |
ENST00000379671.7
|
NREP
|
neuronal regeneration related protein |
| chr18_-_12702712 | 0.81 |
ENST00000423709.6
ENST00000262127.7 |
CEP76
|
centrosomal protein 76 |
| chr11_-_117098415 | 0.80 |
ENST00000445177.6
ENST00000375300.6 ENST00000446921.6 |
SIK3
|
SIK family kinase 3 |
| chr20_+_43667105 | 0.80 |
ENST00000217026.5
|
MYBL2
|
MYB proto-oncogene like 2 |
| chrX_-_136767322 | 0.79 |
ENST00000370620.5
|
ARHGEF6
|
Rac/Cdc42 guanine nucleotide exchange factor 6 |
| chr3_+_152299392 | 0.79 |
ENST00000498502.5
ENST00000545754.5 ENST00000357472.7 ENST00000324196.9 |
MBNL1
|
muscleblind like splicing regulator 1 |
| chr11_-_134411854 | 0.78 |
ENST00000392580.5
|
B3GAT1
|
beta-1,3-glucuronyltransferase 1 |
| chr8_-_33567118 | 0.78 |
ENST00000256257.2
|
RNF122
|
ring finger protein 122 |
| chr15_-_82046119 | 0.78 |
ENST00000558133.1
|
MEX3B
|
mex-3 RNA binding family member B |
| chr2_+_32063533 | 0.78 |
ENST00000315285.9
|
SPAST
|
spastin |
| chr6_+_11537738 | 0.78 |
ENST00000379426.2
|
TMEM170B
|
transmembrane protein 170B |
| chr7_+_7968787 | 0.78 |
ENST00000223145.10
|
GLCCI1
|
glucocorticoid induced 1 |
| chr17_-_35089212 | 0.77 |
ENST00000584655.5
ENST00000447669.6 ENST00000315249.11 |
RFFL
|
ring finger and FYVE like domain containing E3 ubiquitin protein ligase |
| chr12_-_49069970 | 0.76 |
ENST00000301068.11
|
RHEBL1
|
RHEB like 1 |
| chr18_-_63319987 | 0.76 |
ENST00000398117.1
|
BCL2
|
BCL2 apoptosis regulator |
| chr5_-_176537361 | 0.76 |
ENST00000274811.9
|
RNF44
|
ring finger protein 44 |
| chr5_-_160312524 | 0.76 |
ENST00000520748.1
ENST00000257536.13 ENST00000393977.7 |
CCNJL
|
cyclin J like |
| chr16_-_5033916 | 0.76 |
ENST00000381955.7
ENST00000312251.8 |
NAGPA
|
N-acetylglucosamine-1-phosphodiester alpha-N-acetylglucosaminidase |
| chr3_-_195442977 | 0.75 |
ENST00000326793.11
|
ACAP2
|
ArfGAP with coiled-coil, ankyrin repeat and PH domains 2 |
| chr1_-_18956669 | 0.75 |
ENST00000455833.7
|
IFFO2
|
intermediate filament family orphan 2 |
| chr2_-_23927107 | 0.75 |
ENST00000238789.10
|
ATAD2B
|
ATPase family AAA domain containing 2B |
| chr14_-_77616630 | 0.75 |
ENST00000216484.7
|
SPTLC2
|
serine palmitoyltransferase long chain base subunit 2 |
| chr6_-_16761447 | 0.74 |
ENST00000244769.8
ENST00000436367.6 |
ATXN1
|
ataxin 1 |
| chr1_+_179954740 | 0.74 |
ENST00000491495.2
ENST00000367607.8 |
CEP350
|
centrosomal protein 350 |
| chr20_+_2101807 | 0.74 |
ENST00000381482.8
|
STK35
|
serine/threonine kinase 35 |
| chr6_+_15246054 | 0.74 |
ENST00000341776.7
|
JARID2
|
jumonji and AT-rich interaction domain containing 2 |
| chr9_-_76906090 | 0.74 |
ENST00000376718.8
|
PRUNE2
|
prune homolog 2 with BCH domain |
| chr1_+_117606040 | 0.73 |
ENST00000369448.4
|
TENT5C
|
terminal nucleotidyltransferase 5C |
| chr18_+_62523002 | 0.73 |
ENST00000269499.10
|
ZCCHC2
|
zinc finger CCHC-type containing 2 |
| chr10_+_71319249 | 0.73 |
ENST00000373189.6
ENST00000479577.2 |
SLC29A3
|
solute carrier family 29 member 3 |
| chr1_-_202808406 | 0.73 |
ENST00000650569.1
ENST00000367265.9 ENST00000649770.1 |
KDM5B
|
lysine demethylase 5B |
| chr9_-_3525968 | 0.73 |
ENST00000382004.7
ENST00000617270.5 ENST00000449190.5 |
RFX3
|
regulatory factor X3 |
| chr2_+_95025700 | 0.72 |
ENST00000309988.9
ENST00000353004.7 ENST00000354078.7 ENST00000349807.3 |
MAL
|
mal, T cell differentiation protein |
| chr3_-_52679713 | 0.72 |
ENST00000296302.11
ENST00000356770.8 ENST00000337303.8 ENST00000409057.5 ENST00000410007.5 ENST00000409114.7 ENST00000409767.5 ENST00000423351.5 |
PBRM1
|
polybromo 1 |
| chr11_+_112961402 | 0.71 |
ENST00000613217.4
ENST00000316851.12 ENST00000620046.4 ENST00000531044.5 ENST00000529356.5 |
NCAM1
|
neural cell adhesion molecule 1 |
| chr7_-_27185223 | 0.71 |
ENST00000517402.1
ENST00000006015.4 |
HOXA11
|
homeobox A11 |
| chr17_-_63842663 | 0.71 |
ENST00000613943.4
ENST00000448276.7 |
SMARCD2
|
SWI/SNF related, matrix associated, actin dependent regulator of chromatin, subfamily d, member 2 |
| chr10_-_32347109 | 0.70 |
ENST00000469059.2
ENST00000319778.11 |
EPC1
|
enhancer of polycomb homolog 1 |
| chr12_+_69239560 | 0.70 |
ENST00000435070.7
|
CPSF6
|
cleavage and polyadenylation specific factor 6 |
| chr1_-_84690406 | 0.70 |
ENST00000605755.5
ENST00000342203.8 ENST00000437941.6 |
SSX2IP
|
SSX family member 2 interacting protein |
| chr5_-_132737518 | 0.69 |
ENST00000403231.6
ENST00000378735.5 ENST00000618515.4 ENST00000378746.8 |
KIF3A
|
kinesin family member 3A |
| chr2_-_144517506 | 0.69 |
ENST00000431672.4
ENST00000558170.6 |
ZEB2
|
zinc finger E-box binding homeobox 2 |
| chr22_-_50474942 | 0.69 |
ENST00000348911.10
ENST00000380817.8 |
SBF1
|
SET binding factor 1 |
| chr1_+_89633086 | 0.68 |
ENST00000370454.9
|
LRRC8C
|
leucine rich repeat containing 8 VRAC subunit C |
| chr14_-_68979436 | 0.68 |
ENST00000193403.10
|
ACTN1
|
actinin alpha 1 |
| chr6_-_136792466 | 0.68 |
ENST00000359015.5
|
MAP3K5
|
mitogen-activated protein kinase kinase kinase 5 |
| chr22_-_38844020 | 0.68 |
ENST00000333039.4
|
NPTXR
|
neuronal pentraxin receptor |
| chr3_+_36380477 | 0.68 |
ENST00000457375.6
ENST00000273183.8 ENST00000434649.1 |
STAC
|
SH3 and cysteine rich domain |
| chr5_-_147782518 | 0.68 |
ENST00000507386.5
|
JAKMIP2
|
janus kinase and microtubule interacting protein 2 |
| chr20_+_59933761 | 0.68 |
ENST00000358293.7
|
FAM217B
|
family with sequence similarity 217 member B |
| chr1_+_32817645 | 0.67 |
ENST00000526230.1
ENST00000373475.10 ENST00000531256.1 ENST00000482212.1 |
S100PBP
|
S100P binding protein |
| chr11_+_117178728 | 0.67 |
ENST00000532960.5
ENST00000324225.9 |
SIDT2
|
SID1 transmembrane family member 2 |
| chr17_-_76453142 | 0.67 |
ENST00000319380.12
|
UBE2O
|
ubiquitin conjugating enzyme E2 O |
| chr5_-_56952107 | 0.67 |
ENST00000381226.7
ENST00000381199.8 ENST00000381213.7 |
MIER3
|
MIER family member 3 |
| chr9_+_100473140 | 0.66 |
ENST00000374879.5
|
TMEFF1
|
transmembrane protein with EGF like and two follistatin like domains 1 |
| chr1_-_91021455 | 0.66 |
ENST00000347275.9
ENST00000370440.5 |
ZNF644
|
zinc finger protein 644 |
| chr8_-_100952918 | 0.66 |
ENST00000395957.6
ENST00000395948.6 ENST00000457309.2 |
YWHAZ
|
tyrosine 3-monooxygenase/tryptophan 5-monooxygenase activation protein zeta |
| chr12_-_42484298 | 0.65 |
ENST00000640055.1
ENST00000639566.1 ENST00000455697.6 ENST00000639589.1 |
PRICKLE1
|
prickle planar cell polarity protein 1 |
| chr6_+_158536398 | 0.65 |
ENST00000367090.4
|
TMEM181
|
transmembrane protein 181 |
| chrX_-_19887585 | 0.65 |
ENST00000397821.8
|
SH3KBP1
|
SH3 domain containing kinase binding protein 1 |
| chr6_-_45377860 | 0.65 |
ENST00000371460.5
ENST00000371459.6 |
SUPT3H
|
SPT3 homolog, SAGA and STAGA complex component |
| chr7_-_112939773 | 0.65 |
ENST00000297145.9
|
BMT2
|
base methyltransferase of 25S rRNA 2 homolog |
| chr14_+_105526568 | 0.64 |
ENST00000392519.7
|
TMEM121
|
transmembrane protein 121 |
| chr10_+_115093331 | 0.64 |
ENST00000609571.5
ENST00000355044.8 ENST00000526946.5 |
ATRNL1
|
attractin like 1 |
| chr3_+_107522936 | 0.64 |
ENST00000415149.6
ENST00000402543.5 ENST00000325805.13 ENST00000427402.5 |
BBX
|
BBX high mobility group box domain containing |
| chr2_+_135531460 | 0.64 |
ENST00000683871.1
ENST00000409478.5 ENST00000264160.8 ENST00000438014.5 |
R3HDM1
|
R3H domain containing 1 |
Network of associatons between targets according to the STRING database.

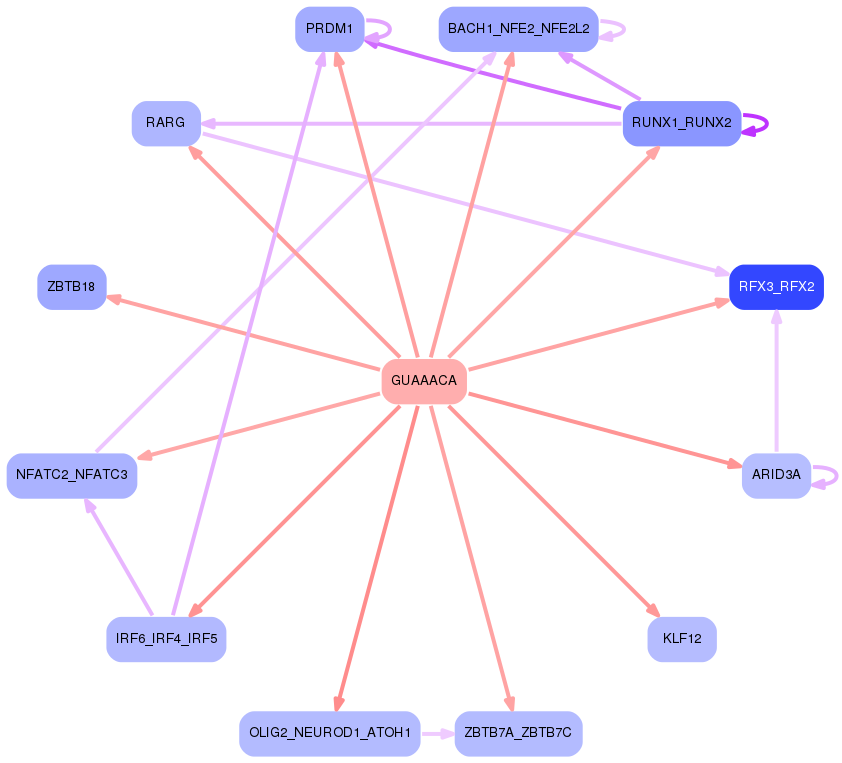
First level regulatory network of GUAAACA
Gene Ontology Analysis
Gene overrepresentation in biological process category:
| Log-likelihood per target | Total log-likelihood | Term | Description |
|---|---|---|---|
| 1.1 | 3.3 | GO:0002372 | myeloid dendritic cell cytokine production(GO:0002372) |
| 0.7 | 2.7 | GO:0097534 | lymphoid lineage cell migration(GO:0097534) lymphoid lineage cell migration into thymus(GO:0097535) |
| 0.6 | 1.7 | GO:0045082 | interleukin-13 biosynthetic process(GO:0042231) positive regulation of interleukin-10 biosynthetic process(GO:0045082) |
| 0.5 | 2.5 | GO:0003366 | cell-matrix adhesion involved in ameboidal cell migration(GO:0003366) |
| 0.5 | 1.9 | GO:0018125 | peptidyl-cysteine methylation(GO:0018125) |
| 0.5 | 1.4 | GO:1990654 | sebum secreting cell proliferation(GO:1990654) |
| 0.5 | 2.3 | GO:0018242 | protein O-linked glycosylation via serine(GO:0018242) |
| 0.3 | 1.0 | GO:0070662 | mast cell proliferation(GO:0070662) |
| 0.3 | 1.4 | GO:0003430 | growth plate cartilage chondrocyte growth(GO:0003430) |
| 0.3 | 1.0 | GO:0060730 | regulation of intestinal epithelial structure maintenance(GO:0060730) |
| 0.3 | 0.3 | GO:0097051 | establishment of protein localization to endoplasmic reticulum membrane(GO:0097051) |
| 0.3 | 0.9 | GO:2001025 | positive regulation of response to drug(GO:2001025) |
| 0.3 | 0.9 | GO:1901491 | negative regulation of lymphangiogenesis(GO:1901491) |
| 0.3 | 0.9 | GO:0035262 | gonad morphogenesis(GO:0035262) |
| 0.3 | 0.9 | GO:0071206 | establishment of protein localization to juxtaparanode region of axon(GO:0071206) |
| 0.3 | 1.7 | GO:1903232 | melanosome assembly(GO:1903232) |
| 0.3 | 1.1 | GO:0033693 | neurofilament bundle assembly(GO:0033693) |
| 0.3 | 1.4 | GO:1905205 | positive regulation of connective tissue replacement(GO:1905205) |
| 0.3 | 0.8 | GO:0045556 | TRAIL biosynthetic process(GO:0045553) regulation of TRAIL biosynthetic process(GO:0045554) positive regulation of TRAIL biosynthetic process(GO:0045556) |
| 0.3 | 1.8 | GO:0042539 | hypotonic salinity response(GO:0042539) cellular hypotonic salinity response(GO:0071477) |
| 0.3 | 0.8 | GO:0014707 | branchiomeric skeletal muscle development(GO:0014707) |
| 0.3 | 1.0 | GO:2000681 | negative regulation of rubidium ion transport(GO:2000681) negative regulation of rubidium ion transmembrane transporter activity(GO:2000687) |
| 0.3 | 1.3 | GO:0051643 | endoplasmic reticulum localization(GO:0051643) |
| 0.2 | 0.7 | GO:0006667 | sphinganine metabolic process(GO:0006667) |
| 0.2 | 1.5 | GO:0014005 | microglia differentiation(GO:0014004) microglia development(GO:0014005) |
| 0.2 | 0.9 | GO:0032811 | negative regulation of epinephrine secretion(GO:0032811) epidermal growth factor-activated receptor transactivation by G-protein coupled receptor signaling pathway(GO:0035625) |
| 0.2 | 1.4 | GO:2001271 | negative regulation of cysteine-type endopeptidase activity involved in execution phase of apoptosis(GO:2001271) |
| 0.2 | 0.9 | GO:1903045 | neural crest cell migration involved in sympathetic nervous system development(GO:1903045) |
| 0.2 | 1.5 | GO:0036515 | serotonergic neuron axon guidance(GO:0036515) |
| 0.2 | 1.3 | GO:0000117 | regulation of transcription involved in G2/M transition of mitotic cell cycle(GO:0000117) |
| 0.2 | 1.2 | GO:0060369 | positive regulation of natural killer cell cytokine production(GO:0002729) positive regulation of Fc receptor mediated stimulatory signaling pathway(GO:0060369) |
| 0.2 | 0.8 | GO:0060928 | cardiac septum cell differentiation(GO:0003292) atrioventricular node cell differentiation(GO:0060922) atrioventricular node cell development(GO:0060928) |
| 0.2 | 0.8 | GO:0051228 | mitotic spindle disassembly(GO:0051228) spindle disassembly(GO:0051230) |
| 0.2 | 1.7 | GO:0071386 | cellular response to corticosterone stimulus(GO:0071386) |
| 0.2 | 0.7 | GO:0009405 | pathogenesis(GO:0009405) |
| 0.2 | 0.9 | GO:0070213 | protein auto-ADP-ribosylation(GO:0070213) |
| 0.2 | 0.7 | GO:0072560 | type B pancreatic cell maturation(GO:0072560) |
| 0.2 | 2.0 | GO:0035279 | mRNA cleavage involved in gene silencing by miRNA(GO:0035279) mRNA cleavage involved in gene silencing(GO:0098795) |
| 0.2 | 0.9 | GO:1901994 | negative regulation of meiotic cell cycle phase transition(GO:1901994) |
| 0.2 | 1.0 | GO:0030538 | embryonic genitalia morphogenesis(GO:0030538) |
| 0.2 | 2.2 | GO:2000786 | positive regulation of autophagosome assembly(GO:2000786) |
| 0.2 | 0.8 | GO:0033031 | positive regulation of neutrophil apoptotic process(GO:0033031) |
| 0.2 | 1.6 | GO:0051694 | pointed-end actin filament capping(GO:0051694) |
| 0.2 | 0.5 | GO:0044725 | chromatin reprogramming in the zygote(GO:0044725) |
| 0.2 | 0.5 | GO:0060876 | semicircular canal formation(GO:0060876) |
| 0.2 | 0.6 | GO:0021784 | postganglionic parasympathetic fiber development(GO:0021784) |
| 0.2 | 0.8 | GO:0032848 | negative regulation of cellular pH reduction(GO:0032848) CD8-positive, alpha-beta T cell lineage commitment(GO:0043375) negative regulation of retinal cell programmed cell death(GO:0046671) |
| 0.1 | 1.0 | GO:0042796 | snRNA transcription from RNA polymerase III promoter(GO:0042796) |
| 0.1 | 0.4 | GO:0061536 | glycine secretion(GO:0061536) glycine secretion, neurotransmission(GO:0061537) |
| 0.1 | 0.8 | GO:0098532 | histone H3-K27 trimethylation(GO:0098532) |
| 0.1 | 0.4 | GO:0006043 | glucosamine catabolic process(GO:0006043) |
| 0.1 | 0.7 | GO:2000690 | regulation of cardiac muscle cell myoblast differentiation(GO:2000690) negative regulation of cardiac muscle cell myoblast differentiation(GO:2000691) |
| 0.1 | 0.4 | GO:0033364 | mast cell secretory granule organization(GO:0033364) |
| 0.1 | 0.9 | GO:0032487 | regulation of Rap protein signal transduction(GO:0032487) |
| 0.1 | 0.4 | GO:0002101 | tRNA wobble cytosine modification(GO:0002101) |
| 0.1 | 1.1 | GO:0010265 | SCF complex assembly(GO:0010265) |
| 0.1 | 0.7 | GO:0034721 | histone H3-K4 demethylation, trimethyl-H3-K4-specific(GO:0034721) |
| 0.1 | 1.3 | GO:0003150 | muscular septum morphogenesis(GO:0003150) |
| 0.1 | 0.6 | GO:2000327 | regulation of ligand-dependent nuclear receptor transcription coactivator activity(GO:2000325) positive regulation of ligand-dependent nuclear receptor transcription coactivator activity(GO:2000327) |
| 0.1 | 1.7 | GO:0034378 | chylomicron assembly(GO:0034378) |
| 0.1 | 0.3 | GO:0098928 | presynaptic signal transduction(GO:0098928) presynapse to nucleus signaling pathway(GO:0099526) |
| 0.1 | 0.1 | GO:0061092 | regulation of phospholipid translocation(GO:0061091) positive regulation of phospholipid translocation(GO:0061092) |
| 0.1 | 1.6 | GO:1904153 | negative regulation of protein exit from endoplasmic reticulum(GO:0070862) negative regulation of retrograde protein transport, ER to cytosol(GO:1904153) |
| 0.1 | 0.4 | GO:0035910 | ascending aorta development(GO:0035905) ascending aorta morphogenesis(GO:0035910) |
| 0.1 | 0.6 | GO:0001994 | norepinephrine-epinephrine vasoconstriction involved in regulation of systemic arterial blood pressure(GO:0001994) |
| 0.1 | 0.4 | GO:0015788 | UDP-N-acetylglucosamine transport(GO:0015788) UDP-N-acetylglucosamine transmembrane transport(GO:1990569) |
| 0.1 | 0.3 | GO:0090310 | negative regulation of methylation-dependent chromatin silencing(GO:0090310) |
| 0.1 | 1.3 | GO:0060017 | parathyroid gland development(GO:0060017) |
| 0.1 | 0.5 | GO:0034421 | post-translational protein acetylation(GO:0034421) |
| 0.1 | 0.4 | GO:0031548 | regulation of brain-derived neurotrophic factor receptor signaling pathway(GO:0031548) |
| 0.1 | 0.4 | GO:0060708 | spongiotrophoblast differentiation(GO:0060708) |
| 0.1 | 0.4 | GO:0097368 | establishment of Sertoli cell barrier(GO:0097368) |
| 0.1 | 0.4 | GO:1900450 | negative regulation of glutamate receptor signaling pathway(GO:1900450) negative regulation of NMDA glutamate receptor activity(GO:1904782) |
| 0.1 | 0.3 | GO:1990619 | negative regulation of prostaglandin biosynthetic process(GO:0031393) histone H3-K9 deacetylation(GO:1990619) |
| 0.1 | 0.2 | GO:0036292 | DNA rewinding(GO:0036292) |
| 0.1 | 1.3 | GO:0006707 | cholesterol catabolic process(GO:0006707) sterol catabolic process(GO:0016127) |
| 0.1 | 1.2 | GO:0045974 | miRNA mediated inhibition of translation(GO:0035278) negative regulation of translation, ncRNA-mediated(GO:0040033) regulation of translation, ncRNA-mediated(GO:0045974) |
| 0.1 | 0.9 | GO:0032237 | activation of store-operated calcium channel activity(GO:0032237) positive regulation of store-operated calcium channel activity(GO:1901341) |
| 0.1 | 0.1 | GO:0010609 | mRNA localization resulting in posttranscriptional regulation of gene expression(GO:0010609) |
| 0.1 | 0.3 | GO:0003274 | endocardial cushion fusion(GO:0003274) endocardial cell fate commitment(GO:0060957) endocardial cushion cell fate commitment(GO:0061445) |
| 0.1 | 1.1 | GO:0090204 | protein localization to nuclear pore(GO:0090204) |
| 0.1 | 2.3 | GO:0071985 | multivesicular body sorting pathway(GO:0071985) |
| 0.1 | 2.2 | GO:0001675 | acrosome assembly(GO:0001675) |
| 0.1 | 1.2 | GO:0070459 | prolactin secretion(GO:0070459) |
| 0.1 | 0.3 | GO:1904761 | negative regulation of myofibroblast differentiation(GO:1904761) |
| 0.1 | 0.2 | GO:1900365 | positive regulation of mRNA polyadenylation(GO:1900365) |
| 0.1 | 1.3 | GO:0070307 | lens fiber cell development(GO:0070307) |
| 0.1 | 0.4 | GO:0001555 | oocyte growth(GO:0001555) |
| 0.1 | 1.6 | GO:0001574 | ganglioside biosynthetic process(GO:0001574) |
| 0.1 | 0.9 | GO:0002051 | osteoblast fate commitment(GO:0002051) |
| 0.1 | 1.2 | GO:2000271 | positive regulation of fibroblast apoptotic process(GO:2000271) |
| 0.1 | 1.6 | GO:2001256 | regulation of store-operated calcium entry(GO:2001256) |
| 0.1 | 0.6 | GO:1902231 | positive regulation of intrinsic apoptotic signaling pathway in response to DNA damage(GO:1902231) |
| 0.1 | 1.9 | GO:0032486 | Rap protein signal transduction(GO:0032486) |
| 0.1 | 0.3 | GO:1902544 | regulation of DNA N-glycosylase activity(GO:1902544) |
| 0.1 | 0.5 | GO:0035616 | histone H2B conserved C-terminal lysine deubiquitination(GO:0035616) |
| 0.1 | 0.2 | GO:0051066 | dihydrobiopterin metabolic process(GO:0051066) |
| 0.1 | 0.4 | GO:0045629 | negative regulation of T-helper 2 cell differentiation(GO:0045629) |
| 0.1 | 0.2 | GO:1990051 | activation of protein kinase C activity(GO:1990051) |
| 0.1 | 0.6 | GO:0090116 | C-5 methylation of cytosine(GO:0090116) |
| 0.1 | 0.5 | GO:0010587 | miRNA catabolic process(GO:0010587) |
| 0.1 | 0.9 | GO:0080182 | histone H3-K4 trimethylation(GO:0080182) |
| 0.1 | 0.3 | GO:0000415 | negative regulation of histone H3-K36 methylation(GO:0000415) |
| 0.1 | 0.6 | GO:0008063 | Toll signaling pathway(GO:0008063) |
| 0.1 | 1.1 | GO:0042355 | fucose catabolic process(GO:0019317) L-fucose metabolic process(GO:0042354) L-fucose catabolic process(GO:0042355) |
| 0.1 | 0.7 | GO:0031936 | negative regulation of chromatin silencing(GO:0031936) |
| 0.1 | 1.7 | GO:0070933 | histone H4 deacetylation(GO:0070933) |
| 0.1 | 0.9 | GO:0043249 | erythrocyte maturation(GO:0043249) |
| 0.1 | 0.5 | GO:0061589 | calcium activated phosphatidylserine scrambling(GO:0061589) |
| 0.1 | 0.5 | GO:0051418 | interphase microtubule nucleation by interphase microtubule organizing center(GO:0051415) microtubule nucleation by microtubule organizing center(GO:0051418) |
| 0.1 | 0.3 | GO:0008616 | queuosine biosynthetic process(GO:0008616) queuosine metabolic process(GO:0046116) |
| 0.1 | 0.2 | GO:0097477 | lateral motor column neuron migration(GO:0097477) |
| 0.1 | 0.6 | GO:0055118 | negative regulation of cardiac muscle contraction(GO:0055118) |
| 0.1 | 0.2 | GO:0016334 | morphogenesis of follicular epithelium(GO:0016333) establishment or maintenance of polarity of follicular epithelium(GO:0016334) establishment of planar polarity of follicular epithelium(GO:0042247) |
| 0.1 | 0.9 | GO:0033227 | dsRNA transport(GO:0033227) |
| 0.1 | 1.0 | GO:2000615 | regulation of histone H3-K9 acetylation(GO:2000615) |
| 0.1 | 0.8 | GO:0033299 | secretion of lysosomal enzymes(GO:0033299) |
| 0.1 | 0.3 | GO:0071460 | cellular response to cell-matrix adhesion(GO:0071460) |
| 0.1 | 0.7 | GO:1902748 | melanocyte migration(GO:0097324) positive regulation of lens fiber cell differentiation(GO:1902748) |
| 0.1 | 0.5 | GO:0061737 | leukotriene signaling pathway(GO:0061737) |
| 0.1 | 0.7 | GO:0018095 | protein polyglutamylation(GO:0018095) |
| 0.1 | 0.2 | GO:0071930 | positive regulation of DNA endoreduplication(GO:0032877) negative regulation of transcription involved in G1/S transition of mitotic cell cycle(GO:0071930) |
| 0.1 | 0.2 | GO:0035977 | protein deglycosylation involved in glycoprotein catabolic process(GO:0035977) glycoprotein ERAD pathway(GO:0097466) mannose trimming involved in glycoprotein ERAD pathway(GO:1904382) |
| 0.1 | 0.4 | GO:1900126 | negative regulation of hyaluronan biosynthetic process(GO:1900126) |
| 0.1 | 0.5 | GO:0034086 | maintenance of sister chromatid cohesion(GO:0034086) maintenance of mitotic sister chromatid cohesion(GO:0034088) |
| 0.1 | 0.3 | GO:2000672 | negative regulation of motor neuron apoptotic process(GO:2000672) |
| 0.0 | 0.5 | GO:0097012 | cellular response to granulocyte macrophage colony-stimulating factor stimulus(GO:0097011) response to granulocyte macrophage colony-stimulating factor(GO:0097012) |
| 0.0 | 0.2 | GO:0035022 | positive regulation of Rac protein signal transduction(GO:0035022) |
| 0.0 | 0.7 | GO:0051574 | positive regulation of histone H3-K9 methylation(GO:0051574) |
| 0.0 | 0.8 | GO:0031584 | activation of phospholipase D activity(GO:0031584) |
| 0.0 | 0.2 | GO:1902499 | positive regulation of protein autoubiquitination(GO:1902499) |
| 0.0 | 0.6 | GO:0021957 | corticospinal tract morphogenesis(GO:0021957) |
| 0.0 | 0.3 | GO:0046086 | AMP catabolic process(GO:0006196) adenosine biosynthetic process(GO:0046086) |
| 0.0 | 0.1 | GO:0045715 | negative regulation of low-density lipoprotein particle receptor biosynthetic process(GO:0045715) |
| 0.0 | 0.5 | GO:0060136 | embryonic process involved in female pregnancy(GO:0060136) |
| 0.0 | 1.6 | GO:0046339 | diacylglycerol metabolic process(GO:0046339) |
| 0.0 | 0.6 | GO:0035871 | protein K11-linked deubiquitination(GO:0035871) |
| 0.0 | 0.8 | GO:0043374 | CD8-positive, alpha-beta T cell differentiation(GO:0043374) |
| 0.0 | 0.4 | GO:0016584 | nucleosome positioning(GO:0016584) |
| 0.0 | 1.4 | GO:0007213 | G-protein coupled acetylcholine receptor signaling pathway(GO:0007213) |
| 0.0 | 0.7 | GO:0031580 | membrane raft polarization(GO:0001766) membrane raft distribution(GO:0031580) |
| 0.0 | 0.7 | GO:0061088 | regulation of sequestering of zinc ion(GO:0061088) |
| 0.0 | 0.9 | GO:0050884 | neuromuscular process controlling posture(GO:0050884) |
| 0.0 | 0.4 | GO:0042760 | very long-chain fatty acid catabolic process(GO:0042760) |
| 0.0 | 0.2 | GO:1902269 | positive regulation of polyamine transmembrane transport(GO:1902269) |
| 0.0 | 0.7 | GO:0035751 | regulation of lysosomal lumen pH(GO:0035751) |
| 0.0 | 0.6 | GO:0034454 | microtubule anchoring at centrosome(GO:0034454) |
| 0.0 | 0.2 | GO:0034670 | chemotaxis to arachidonic acid(GO:0034670) response to arachidonic acid(GO:1904550) |
| 0.0 | 2.1 | GO:0050832 | defense response to fungus(GO:0050832) |
| 0.0 | 0.2 | GO:0016078 | tRNA catabolic process(GO:0016078) |
| 0.0 | 0.3 | GO:0015888 | thiamine transport(GO:0015888) |
| 0.0 | 0.5 | GO:0071492 | cellular response to UV-A(GO:0071492) |
| 0.0 | 0.8 | GO:0046599 | regulation of centriole replication(GO:0046599) |
| 0.0 | 0.4 | GO:0017196 | N-terminal peptidyl-methionine acetylation(GO:0017196) |
| 0.0 | 1.7 | GO:0018345 | protein palmitoylation(GO:0018345) |
| 0.0 | 0.8 | GO:0071786 | endoplasmic reticulum tubular network organization(GO:0071786) |
| 0.0 | 0.6 | GO:0007064 | mitotic sister chromatid cohesion(GO:0007064) |
| 0.0 | 0.2 | GO:0035544 | negative regulation of SNARE complex assembly(GO:0035544) |
| 0.0 | 0.5 | GO:0090168 | Golgi reassembly(GO:0090168) |
| 0.0 | 0.2 | GO:1900041 | negative regulation of interleukin-2 secretion(GO:1900041) |
| 0.0 | 0.7 | GO:0001759 | organ induction(GO:0001759) |
| 0.0 | 0.7 | GO:1901642 | nucleoside transmembrane transport(GO:1901642) |
| 0.0 | 0.5 | GO:0033235 | positive regulation of protein sumoylation(GO:0033235) |
| 0.0 | 0.7 | GO:0034453 | microtubule anchoring(GO:0034453) |
| 0.0 | 0.1 | GO:1900747 | negative regulation of vascular endothelial growth factor signaling pathway(GO:1900747) |
| 0.0 | 0.7 | GO:0007020 | microtubule nucleation(GO:0007020) |
| 0.0 | 0.3 | GO:0038110 | interleukin-2-mediated signaling pathway(GO:0038110) |
| 0.0 | 0.5 | GO:0090161 | Golgi ribbon formation(GO:0090161) |
| 0.0 | 0.1 | GO:0061086 | negative regulation of histone H3-K27 methylation(GO:0061086) |
| 0.0 | 0.2 | GO:0031087 | deadenylation-independent decapping of nuclear-transcribed mRNA(GO:0031087) |
| 0.0 | 0.3 | GO:0018211 | protein C-linked glycosylation(GO:0018103) peptidyl-tryptophan modification(GO:0018211) protein C-linked glycosylation via tryptophan(GO:0018317) protein C-linked glycosylation via 2'-alpha-mannosyl-L-tryptophan(GO:0018406) |
| 0.0 | 0.3 | GO:0030854 | positive regulation of granulocyte differentiation(GO:0030854) |
| 0.0 | 0.2 | GO:0006452 | translational frameshifting(GO:0006452) positive regulation of translational termination(GO:0045905) |
| 0.0 | 0.1 | GO:0003365 | establishment of cell polarity involved in ameboidal cell migration(GO:0003365) |
| 0.0 | 0.0 | GO:0061763 | multivesicular body-lysosome fusion(GO:0061763) |
| 0.0 | 0.2 | GO:2000270 | negative regulation of fibroblast apoptotic process(GO:2000270) |
| 0.0 | 0.2 | GO:0045200 | establishment or maintenance of neuroblast polarity(GO:0045196) establishment of neuroblast polarity(GO:0045200) |
| 0.0 | 0.7 | GO:1900745 | positive regulation of p38MAPK cascade(GO:1900745) |
| 0.0 | 1.6 | GO:0035735 | intraciliary transport involved in cilium morphogenesis(GO:0035735) |
| 0.0 | 1.6 | GO:0007223 | Wnt signaling pathway, calcium modulating pathway(GO:0007223) |
| 0.0 | 0.4 | GO:0010225 | response to UV-C(GO:0010225) |
| 0.0 | 0.1 | GO:0002188 | translation reinitiation(GO:0002188) |
| 0.0 | 0.6 | GO:0043568 | positive regulation of insulin-like growth factor receptor signaling pathway(GO:0043568) |
| 0.0 | 0.4 | GO:0000338 | protein deneddylation(GO:0000338) |
| 0.0 | 0.2 | GO:0060613 | fat pad development(GO:0060613) |
| 0.0 | 0.3 | GO:0060215 | primitive hemopoiesis(GO:0060215) |
| 0.0 | 0.3 | GO:0019375 | galactosylceramide biosynthetic process(GO:0006682) galactolipid biosynthetic process(GO:0019375) |
| 0.0 | 0.4 | GO:0008627 | intrinsic apoptotic signaling pathway in response to osmotic stress(GO:0008627) |
| 0.0 | 0.1 | GO:2000619 | negative regulation of histone H4-K16 acetylation(GO:2000619) |
| 0.0 | 0.1 | GO:0016036 | cellular response to phosphate starvation(GO:0016036) positive regulation of sulfur amino acid metabolic process(GO:0031337) positive regulation of homocysteine metabolic process(GO:0050668) |
| 0.0 | 0.3 | GO:1904338 | regulation of dopaminergic neuron differentiation(GO:1904338) |
| 0.0 | 0.2 | GO:0000414 | regulation of histone H3-K36 methylation(GO:0000414) |
| 0.0 | 0.4 | GO:0000290 | deadenylation-dependent decapping of nuclear-transcribed mRNA(GO:0000290) |
| 0.0 | 0.4 | GO:0000055 | ribosomal large subunit export from nucleus(GO:0000055) |
| 0.0 | 0.5 | GO:0045116 | protein neddylation(GO:0045116) |
| 0.0 | 0.1 | GO:0035498 | carnosine metabolic process(GO:0035498) |
| 0.0 | 0.3 | GO:0048280 | vesicle fusion with Golgi apparatus(GO:0048280) |
| 0.0 | 0.7 | GO:0043968 | histone H2A acetylation(GO:0043968) |
| 0.0 | 1.2 | GO:0006336 | DNA replication-independent nucleosome assembly(GO:0006336) |
| 0.0 | 0.3 | GO:0048262 | determination of dorsal/ventral asymmetry(GO:0048262) |
| 0.0 | 0.1 | GO:1990108 | protein linear deubiquitination(GO:1990108) |
| 0.0 | 0.3 | GO:1903608 | protein localization to cytoplasmic stress granule(GO:1903608) |
| 0.0 | 1.5 | GO:0002755 | MyD88-dependent toll-like receptor signaling pathway(GO:0002755) |
| 0.0 | 0.2 | GO:0006477 | protein sulfation(GO:0006477) |
| 0.0 | 0.6 | GO:0031167 | rRNA methylation(GO:0031167) |
| 0.0 | 1.2 | GO:0032456 | endocytic recycling(GO:0032456) |
| 0.0 | 0.3 | GO:0014877 | response to muscle inactivity involved in regulation of muscle adaptation(GO:0014877) response to denervation involved in regulation of muscle adaptation(GO:0014894) |
| 0.0 | 0.4 | GO:0070935 | 3'-UTR-mediated mRNA stabilization(GO:0070935) |
| 0.0 | 0.1 | GO:0051835 | positive regulation of synapse structural plasticity(GO:0051835) |
| 0.0 | 0.3 | GO:0032876 | negative regulation of DNA endoreduplication(GO:0032876) |
| 0.0 | 0.3 | GO:0046827 | positive regulation of protein export from nucleus(GO:0046827) |
| 0.0 | 0.5 | GO:0071447 | cellular response to hydroperoxide(GO:0071447) |
| 0.0 | 0.3 | GO:1900452 | regulation of long term synaptic depression(GO:1900452) |
| 0.0 | 0.6 | GO:0045332 | phospholipid translocation(GO:0045332) |
| 0.0 | 0.2 | GO:1903265 | positive regulation of tumor necrosis factor-mediated signaling pathway(GO:1903265) |
| 0.0 | 0.7 | GO:0006337 | nucleosome disassembly(GO:0006337) |
| 0.0 | 0.0 | GO:0070682 | proteasome regulatory particle assembly(GO:0070682) |
| 0.0 | 0.8 | GO:0045737 | positive regulation of cyclin-dependent protein serine/threonine kinase activity(GO:0045737) |
| 0.0 | 1.7 | GO:0051058 | negative regulation of Ras protein signal transduction(GO:0046580) negative regulation of small GTPase mediated signal transduction(GO:0051058) |
| 0.0 | 1.8 | GO:0006977 | DNA damage response, signal transduction by p53 class mediator resulting in cell cycle arrest(GO:0006977) |
| 0.0 | 0.5 | GO:0097094 | craniofacial suture morphogenesis(GO:0097094) |
| 0.0 | 0.1 | GO:1904863 | regulation of beta-catenin-TCF complex assembly(GO:1904863) negative regulation of beta-catenin-TCF complex assembly(GO:1904864) |
| 0.0 | 0.5 | GO:0007076 | mitotic chromosome condensation(GO:0007076) |
| 0.0 | 0.7 | GO:0071158 | positive regulation of cell cycle arrest(GO:0071158) |
| 0.0 | 0.7 | GO:0030220 | platelet formation(GO:0030220) |
| 0.0 | 0.2 | GO:0048539 | bone marrow development(GO:0048539) |
| 0.0 | 3.9 | GO:0038096 | immune response-regulating cell surface receptor signaling pathway involved in phagocytosis(GO:0002433) Fc-gamma receptor signaling pathway involved in phagocytosis(GO:0038096) |
| 0.0 | 0.2 | GO:0045048 | protein insertion into ER membrane(GO:0045048) |
| 0.0 | 0.3 | GO:0003310 | pancreatic A cell differentiation(GO:0003310) |
| 0.0 | 0.1 | GO:1904924 | negative regulation of mitophagy in response to mitochondrial depolarization(GO:1904924) |
| 0.0 | 0.1 | GO:0045541 | negative regulation of cholesterol biosynthetic process(GO:0045541) negative regulation of cholesterol metabolic process(GO:0090206) |
| 0.0 | 1.7 | GO:1901216 | positive regulation of neuron death(GO:1901216) |
| 0.0 | 0.4 | GO:0006044 | N-acetylglucosamine metabolic process(GO:0006044) |
| 0.0 | 0.6 | GO:0035455 | response to interferon-alpha(GO:0035455) |
| 0.0 | 0.1 | GO:0014051 | gamma-aminobutyric acid secretion(GO:0014051) |
| 0.0 | 0.4 | GO:2000780 | negative regulation of double-strand break repair(GO:2000780) |
| 0.0 | 0.8 | GO:0051123 | RNA polymerase II transcriptional preinitiation complex assembly(GO:0051123) |
| 0.0 | 0.5 | GO:0048490 | anterograde synaptic vesicle transport(GO:0048490) synaptic vesicle cytoskeletal transport(GO:0099514) synaptic vesicle transport along microtubule(GO:0099517) |
| 0.0 | 0.6 | GO:1903432 | regulation of TORC1 signaling(GO:1903432) |
| 0.0 | 0.1 | GO:0043686 | co-translational protein modification(GO:0043686) |
| 0.0 | 0.1 | GO:1902869 | regulation of amacrine cell differentiation(GO:1902869) |
| 0.0 | 0.2 | GO:2000288 | positive regulation of myoblast proliferation(GO:2000288) |
| 0.0 | 0.1 | GO:0006657 | CDP-choline pathway(GO:0006657) |
| 0.0 | 1.2 | GO:0048791 | calcium ion-regulated exocytosis of neurotransmitter(GO:0048791) |
| 0.0 | 0.6 | GO:0043403 | skeletal muscle tissue regeneration(GO:0043403) |
| 0.0 | 0.1 | GO:0010820 | positive regulation of T cell chemotaxis(GO:0010820) |
| 0.0 | 0.8 | GO:0061621 | NADH regeneration(GO:0006735) canonical glycolysis(GO:0061621) glucose catabolic process to pyruvate(GO:0061718) |
| 0.0 | 0.2 | GO:0035524 | proline transmembrane transport(GO:0035524) |
| 0.0 | 0.2 | GO:0070816 | phosphorylation of RNA polymerase II C-terminal domain(GO:0070816) |
| 0.0 | 0.1 | GO:0010637 | negative regulation of mitochondrial fusion(GO:0010637) |
| 0.0 | 0.6 | GO:0050690 | regulation of defense response to virus by virus(GO:0050690) |
| 0.0 | 0.4 | GO:0016578 | histone deubiquitination(GO:0016578) |
| 0.0 | 0.8 | GO:0050650 | chondroitin sulfate proteoglycan biosynthetic process(GO:0050650) |
| 0.0 | 0.3 | GO:0022038 | corpus callosum development(GO:0022038) |
| 0.0 | 0.3 | GO:0098703 | calcium ion import across plasma membrane(GO:0098703) calcium ion import into cell(GO:1990035) |
| 0.0 | 0.0 | GO:0070898 | RNA polymerase III transcriptional preinitiation complex assembly(GO:0070898) |
| 0.0 | 0.0 | GO:0021593 | rhombomere morphogenesis(GO:0021593) rhombomere 3 morphogenesis(GO:0021658) |
| 0.0 | 0.8 | GO:0001541 | ovarian follicle development(GO:0001541) |
| 0.0 | 0.4 | GO:0046475 | glycerophospholipid catabolic process(GO:0046475) |
| 0.0 | 0.1 | GO:0090481 | pyrimidine nucleotide-sugar transmembrane transport(GO:0090481) |
| 0.0 | 0.9 | GO:0043631 | mRNA polyadenylation(GO:0006378) RNA polyadenylation(GO:0043631) |
| 0.0 | 0.4 | GO:0000729 | DNA double-strand break processing(GO:0000729) |
| 0.0 | 0.2 | GO:0021516 | dorsal spinal cord development(GO:0021516) |
| 0.0 | 0.1 | GO:0006688 | glycosphingolipid biosynthetic process(GO:0006688) |
| 0.0 | 0.4 | GO:0072673 | lamellipodium morphogenesis(GO:0072673) |
| 0.0 | 0.1 | GO:0021902 | commitment of neuronal cell to specific neuron type in forebrain(GO:0021902) |
| 0.0 | 1.1 | GO:0071357 | type I interferon signaling pathway(GO:0060337) cellular response to type I interferon(GO:0071357) |
| 0.0 | 0.1 | GO:0032485 | Ral protein signal transduction(GO:0032484) regulation of Ral protein signal transduction(GO:0032485) |
| 0.0 | 0.4 | GO:0031663 | lipopolysaccharide-mediated signaling pathway(GO:0031663) |
| 0.0 | 0.2 | GO:0032957 | inositol trisphosphate metabolic process(GO:0032957) |
| 0.0 | 0.8 | GO:0051865 | protein autoubiquitination(GO:0051865) |
Gene overrepresentation in cellular component category:
| Log-likelihood per target | Total log-likelihood | Term | Description |
|---|---|---|---|
| 0.5 | 2.5 | GO:0034669 | integrin alpha4-beta7 complex(GO:0034669) |
| 0.3 | 1.5 | GO:0031905 | early endosome lumen(GO:0031905) |
| 0.3 | 0.8 | GO:0002947 | tumor necrosis factor receptor superfamily complex(GO:0002947) |
| 0.2 | 1.7 | GO:0000788 | nuclear nucleosome(GO:0000788) |
| 0.2 | 0.7 | GO:0016939 | kinesin II complex(GO:0016939) |
| 0.2 | 1.0 | GO:0035363 | histone locus body(GO:0035363) |
| 0.2 | 0.4 | GO:0000939 | condensed chromosome inner kinetochore(GO:0000939) |
| 0.2 | 2.0 | GO:0005955 | calcineurin complex(GO:0005955) |
| 0.1 | 3.8 | GO:0042588 | zymogen granule(GO:0042588) |
| 0.1 | 1.1 | GO:0032777 | Piccolo NuA4 histone acetyltransferase complex(GO:0032777) |
| 0.1 | 1.5 | GO:0032593 | insulin-responsive compartment(GO:0032593) |
| 0.1 | 0.3 | GO:0032116 | SMC loading complex(GO:0032116) |
| 0.1 | 0.3 | GO:0048788 | cytoskeleton of presynaptic active zone(GO:0048788) presynaptic active zone cytoplasmic component(GO:0098831) presynaptic cytoskeleton(GO:0099569) |
| 0.1 | 0.8 | GO:0031523 | Myb complex(GO:0031523) |
| 0.1 | 0.7 | GO:1990604 | IRE1-TRAF2-ASK1 complex(GO:1990604) |
| 0.1 | 1.6 | GO:0030314 | junctional membrane complex(GO:0030314) |
| 0.1 | 0.3 | GO:0097135 | cyclin E2-CDK2 complex(GO:0097135) |
| 0.1 | 0.7 | GO:0042272 | nuclear RNA export factor complex(GO:0042272) |
| 0.1 | 1.0 | GO:0030061 | mitochondrial crista(GO:0030061) |
| 0.1 | 0.5 | GO:0008275 | gamma-tubulin small complex(GO:0008275) |
| 0.1 | 0.6 | GO:0000308 | cytoplasmic cyclin-dependent protein kinase holoenzyme complex(GO:0000308) |
| 0.1 | 0.2 | GO:0031085 | BLOC-3 complex(GO:0031085) |
| 0.1 | 0.5 | GO:0097165 | nuclear stress granule(GO:0097165) |
| 0.1 | 0.4 | GO:0030906 | retromer, cargo-selective complex(GO:0030906) |
| 0.1 | 1.0 | GO:0035068 | micro-ribonucleoprotein complex(GO:0035068) |
| 0.1 | 0.7 | GO:0042382 | paraspeckles(GO:0042382) |
| 0.1 | 1.1 | GO:0097418 | neurofibrillary tangle(GO:0097418) |
| 0.1 | 0.8 | GO:0002193 | MAML1-RBP-Jkappa- ICN1 complex(GO:0002193) |
| 0.1 | 1.2 | GO:0032433 | filopodium tip(GO:0032433) |
| 0.1 | 0.9 | GO:0000778 | condensed nuclear chromosome kinetochore(GO:0000778) |
| 0.1 | 0.7 | GO:0017059 | serine C-palmitoyltransferase complex(GO:0017059) endoplasmic reticulum palmitoyltransferase complex(GO:0031211) |
| 0.1 | 0.6 | GO:0042788 | polysomal ribosome(GO:0042788) |
| 0.1 | 1.4 | GO:0048188 | Set1C/COMPASS complex(GO:0048188) |
| 0.1 | 0.6 | GO:0042025 | host cell nucleus(GO:0042025) |
| 0.1 | 0.9 | GO:0008290 | F-actin capping protein complex(GO:0008290) |
| 0.1 | 0.5 | GO:0035032 | phosphatidylinositol 3-kinase complex, class III(GO:0035032) |
| 0.1 | 0.5 | GO:0035976 | AP1 complex(GO:0035976) |
| 0.1 | 0.9 | GO:0030123 | AP-3 adaptor complex(GO:0030123) |
| 0.0 | 1.7 | GO:0031235 | intrinsic component of the cytoplasmic side of the plasma membrane(GO:0031235) |
| 0.0 | 0.4 | GO:0030905 | retromer, tubulation complex(GO:0030905) |
| 0.0 | 0.6 | GO:1990316 | ATG1/ULK1 kinase complex(GO:1990316) |
| 0.0 | 0.1 | GO:0071062 | alphav-beta3 integrin-vitronectin complex(GO:0071062) |
| 0.0 | 3.9 | GO:0005834 | heterotrimeric G-protein complex(GO:0005834) |
| 0.0 | 1.3 | GO:0005942 | phosphatidylinositol 3-kinase complex(GO:0005942) |
| 0.0 | 0.8 | GO:0043240 | Fanconi anaemia nuclear complex(GO:0043240) |
| 0.0 | 0.3 | GO:0048179 | activin receptor complex(GO:0048179) |
| 0.0 | 0.4 | GO:0005672 | transcription factor TFIIA complex(GO:0005672) |
| 0.0 | 1.1 | GO:0032591 | dendritic spine membrane(GO:0032591) |
| 0.0 | 0.8 | GO:0000815 | ESCRT III complex(GO:0000815) |
| 0.0 | 0.3 | GO:0033553 | rDNA heterochromatin(GO:0033553) |
| 0.0 | 1.7 | GO:0071782 | endoplasmic reticulum tubular network(GO:0071782) |
| 0.0 | 0.5 | GO:0001940 | male pronucleus(GO:0001940) |
| 0.0 | 0.3 | GO:0044666 | MLL3/4 complex(GO:0044666) |
| 0.0 | 0.3 | GO:0008622 | epsilon DNA polymerase complex(GO:0008622) |
| 0.0 | 0.2 | GO:0000172 | ribonuclease MRP complex(GO:0000172) |
| 0.0 | 0.6 | GO:0002199 | zona pellucida receptor complex(GO:0002199) |
| 0.0 | 0.9 | GO:0005686 | U2 snRNP(GO:0005686) |
| 0.0 | 0.2 | GO:0002945 | cyclin K-CDK13 complex(GO:0002945) |
| 0.0 | 0.3 | GO:0008024 | cyclin/CDK positive transcription elongation factor complex(GO:0008024) |
| 0.0 | 0.4 | GO:0031371 | ubiquitin conjugating enzyme complex(GO:0031371) |
| 0.0 | 0.4 | GO:0031010 | ISWI-type complex(GO:0031010) |
| 0.0 | 1.6 | GO:0005865 | striated muscle thin filament(GO:0005865) |
| 0.0 | 4.9 | GO:0000118 | histone deacetylase complex(GO:0000118) |
| 0.0 | 0.4 | GO:0031332 | RISC complex(GO:0016442) RNAi effector complex(GO:0031332) |
| 0.0 | 0.6 | GO:0001741 | XY body(GO:0001741) |
| 0.0 | 0.2 | GO:1990589 | ATF4-CREB1 transcription factor complex(GO:1990589) |
| 0.0 | 0.6 | GO:0033276 | transcription factor TFTC complex(GO:0033276) |
| 0.0 | 0.9 | GO:0071339 | MLL1/2 complex(GO:0044665) MLL1 complex(GO:0071339) |
| 0.0 | 0.8 | GO:0035098 | ESC/E(Z) complex(GO:0035098) |
| 0.0 | 0.3 | GO:0016602 | CCAAT-binding factor complex(GO:0016602) |
| 0.0 | 1.9 | GO:0001917 | photoreceptor inner segment(GO:0001917) |
| 0.0 | 3.8 | GO:0032580 | Golgi cisterna membrane(GO:0032580) |
| 0.0 | 0.4 | GO:0046581 | intercellular canaliculus(GO:0046581) |
| 0.0 | 0.1 | GO:0060053 | neurofilament cytoskeleton(GO:0060053) |
| 0.0 | 0.2 | GO:0098843 | postsynaptic endocytic zone(GO:0098843) |
| 0.0 | 0.8 | GO:0030014 | CCR4-NOT complex(GO:0030014) |
| 0.0 | 0.8 | GO:0046930 | pore complex(GO:0046930) |
| 0.0 | 0.9 | GO:0005669 | transcription factor TFIID complex(GO:0005669) |
| 0.0 | 1.4 | GO:0030669 | clathrin-coated endocytic vesicle membrane(GO:0030669) |
| 0.0 | 1.4 | GO:0090544 | BAF-type complex(GO:0090544) |
| 0.0 | 0.8 | GO:0005720 | nuclear heterochromatin(GO:0005720) |
| 0.0 | 0.4 | GO:0031414 | N-terminal protein acetyltransferase complex(GO:0031414) |
| 0.0 | 2.2 | GO:0005871 | kinesin complex(GO:0005871) |
| 0.0 | 1.3 | GO:0030119 | AP-type membrane coat adaptor complex(GO:0030119) |
| 0.0 | 1.1 | GO:0033268 | node of Ranvier(GO:0033268) |
| 0.0 | 0.4 | GO:0035102 | PRC1 complex(GO:0035102) |
| 0.0 | 0.7 | GO:0031143 | pseudopodium(GO:0031143) |
| 0.0 | 1.4 | GO:0045171 | intercellular bridge(GO:0045171) |
| 0.0 | 0.2 | GO:0097136 | Bcl-2 family protein complex(GO:0097136) |
| 0.0 | 0.6 | GO:0030140 | trans-Golgi network transport vesicle(GO:0030140) |
| 0.0 | 0.4 | GO:0033202 | Ino80 complex(GO:0031011) DNA helicase complex(GO:0033202) |
| 0.0 | 0.6 | GO:0005892 | acetylcholine-gated channel complex(GO:0005892) |
| 0.0 | 2.3 | GO:0005776 | autophagosome(GO:0005776) |
| 0.0 | 0.1 | GO:0070545 | PeBoW complex(GO:0070545) |
| 0.0 | 0.1 | GO:0097059 | CRLF-CLCF1 complex(GO:0097058) CNTFR-CLCF1 complex(GO:0097059) |
| 0.0 | 0.3 | GO:0000164 | protein phosphatase type 1 complex(GO:0000164) |
| 0.0 | 0.9 | GO:0046658 | anchored component of plasma membrane(GO:0046658) |
| 0.0 | 0.3 | GO:0005642 | annulate lamellae(GO:0005642) |
| 0.0 | 0.2 | GO:0035631 | CD40 receptor complex(GO:0035631) |
| 0.0 | 1.1 | GO:0055038 | recycling endosome membrane(GO:0055038) |
| 0.0 | 0.6 | GO:0034451 | centriolar satellite(GO:0034451) |
| 0.0 | 0.0 | GO:1990590 | ATF1-ATF4 transcription factor complex(GO:1990590) |
| 0.0 | 0.9 | GO:0008180 | COP9 signalosome(GO:0008180) |
| 0.0 | 0.1 | GO:0031313 | extrinsic component of endosome membrane(GO:0031313) |
| 0.0 | 0.2 | GO:0042584 | chromaffin granule membrane(GO:0042584) |
| 0.0 | 0.1 | GO:0097038 | perinuclear endoplasmic reticulum(GO:0097038) |
| 0.0 | 0.1 | GO:0071797 | LUBAC complex(GO:0071797) |
| 0.0 | 0.8 | GO:0031228 | intrinsic component of Golgi membrane(GO:0031228) |
| 0.0 | 0.4 | GO:0005697 | telomerase holoenzyme complex(GO:0005697) |
| 0.0 | 0.5 | GO:0035861 | site of double-strand break(GO:0035861) |
| 0.0 | 2.4 | GO:0101002 | ficolin-1-rich granule(GO:0101002) ficolin-1-rich granule lumen(GO:1904813) |
| 0.0 | 0.6 | GO:1990391 | DNA repair complex(GO:1990391) |
Gene overrepresentation in molecular function category:
| Log-likelihood per target | Total log-likelihood | Term | Description |
|---|---|---|---|
| 0.8 | 2.4 | GO:0016309 | 1-phosphatidylinositol-5-phosphate 4-kinase activity(GO:0016309) |
| 0.5 | 1.5 | GO:0035651 | AP-1 adaptor complex binding(GO:0035650) AP-3 adaptor complex binding(GO:0035651) |
| 0.3 | 0.9 | GO:0031696 | alpha2-adrenergic receptor activity(GO:0004938) alpha-2C adrenergic receptor binding(GO:0031696) |
| 0.3 | 2.5 | GO:1990405 | protein antigen binding(GO:1990405) |
| 0.2 | 1.0 | GO:0061628 | H3K27me3 modified histone binding(GO:0061628) |
| 0.2 | 0.9 | GO:0045322 | unmethylated CpG binding(GO:0045322) |
| 0.2 | 0.6 | GO:0030158 | protein xylosyltransferase activity(GO:0030158) |
| 0.2 | 0.7 | GO:0051765 | inositol tetrakisphosphate kinase activity(GO:0051765) |
| 0.2 | 1.6 | GO:0003828 | alpha-N-acetylneuraminate alpha-2,8-sialyltransferase activity(GO:0003828) |
| 0.2 | 1.3 | GO:1990254 | keratin filament binding(GO:1990254) |
| 0.2 | 0.8 | GO:0001069 | regulatory region RNA binding(GO:0001069) |
| 0.2 | 3.3 | GO:0009931 | calcium-dependent protein serine/threonine kinase activity(GO:0009931) |
| 0.2 | 0.8 | GO:0070579 | methylcytosine dioxygenase activity(GO:0070579) |
| 0.1 | 4.6 | GO:0031489 | myosin V binding(GO:0031489) |
| 0.1 | 2.9 | GO:0046625 | sphingolipid binding(GO:0046625) |
| 0.1 | 0.6 | GO:0004937 | alpha1-adrenergic receptor activity(GO:0004937) |
| 0.1 | 0.9 | GO:0031752 | D5 dopamine receptor binding(GO:0031752) |
| 0.1 | 0.4 | GO:0004342 | glucosamine-6-phosphate deaminase activity(GO:0004342) |
| 0.1 | 0.8 | GO:0015018 | galactosylgalactosylxylosylprotein 3-beta-glucuronosyltransferase activity(GO:0015018) |
| 0.1 | 0.5 | GO:0031826 | type 2A serotonin receptor binding(GO:0031826) |
| 0.1 | 0.4 | GO:0047389 | glycerophosphocholine phosphodiesterase activity(GO:0047389) |
| 0.1 | 0.7 | GO:0034647 | histone demethylase activity (H3-trimethyl-K4 specific)(GO:0034647) |
| 0.1 | 2.4 | GO:0016018 | cyclosporin A binding(GO:0016018) |
| 0.1 | 1.8 | GO:0015379 | potassium:chloride symporter activity(GO:0015379) potassium ion symporter activity(GO:0022820) |
| 0.1 | 0.5 | GO:0004905 | type I interferon receptor activity(GO:0004905) |
| 0.1 | 0.4 | GO:0015375 | glycine:sodium symporter activity(GO:0015375) |
| 0.1 | 0.8 | GO:0031849 | olfactory receptor binding(GO:0031849) |
| 0.1 | 0.4 | GO:0005462 | UDP-N-acetylglucosamine transmembrane transporter activity(GO:0005462) |
| 0.1 | 1.0 | GO:0001025 | RNA polymerase III transcription factor binding(GO:0001025) |
| 0.1 | 0.3 | GO:0043739 | G/U mismatch-specific uracil-DNA glycosylase activity(GO:0043739) |
| 0.1 | 2.1 | GO:0001206 | transcriptional repressor activity, RNA polymerase II distal enhancer sequence-specific binding(GO:0001206) |
| 0.1 | 2.2 | GO:0005522 | profilin binding(GO:0005522) |
| 0.1 | 0.7 | GO:0004758 | serine C-palmitoyltransferase activity(GO:0004758) C-palmitoyltransferase activity(GO:0016454) |
| 0.1 | 0.4 | GO:0016428 | tRNA (cytosine-5-)-methyltransferase activity(GO:0016428) |
| 0.1 | 0.4 | GO:1990460 | leptin receptor binding(GO:1990460) |
| 0.1 | 0.3 | GO:0015275 | stretch-activated, cation-selective, calcium channel activity(GO:0015275) |
| 0.1 | 0.5 | GO:0061649 | ubiquitinated histone binding(GO:0061649) |
| 0.1 | 1.2 | GO:0031821 | G-protein coupled serotonin receptor binding(GO:0031821) |
| 0.1 | 2.6 | GO:0004653 | polypeptide N-acetylgalactosaminyltransferase activity(GO:0004653) |
| 0.1 | 1.1 | GO:0046920 | alpha-(1->3)-fucosyltransferase activity(GO:0046920) |
| 0.1 | 1.5 | GO:0005225 | volume-sensitive anion channel activity(GO:0005225) |
| 0.1 | 0.4 | GO:0048403 | brain-derived neurotrophic factor binding(GO:0048403) |
| 0.1 | 0.7 | GO:0034046 | poly(G) binding(GO:0034046) |
| 0.1 | 0.6 | GO:0051032 | nucleic acid transmembrane transporter activity(GO:0051032) RNA transmembrane transporter activity(GO:0051033) |
| 0.1 | 0.6 | GO:0019788 | NEDD8 transferase activity(GO:0019788) |
| 0.1 | 0.6 | GO:0003886 | DNA (cytosine-5-)-methyltransferase activity(GO:0003886) |
| 0.1 | 0.9 | GO:0015279 | store-operated calcium channel activity(GO:0015279) |
| 0.1 | 0.4 | GO:0004534 | 5'-3' exoribonuclease activity(GO:0004534) |
| 0.1 | 0.6 | GO:0001517 | N-acetylglucosamine 6-O-sulfotransferase activity(GO:0001517) |
| 0.1 | 3.2 | GO:0017091 | AU-rich element binding(GO:0017091) |
| 0.1 | 0.5 | GO:0004974 | leukotriene receptor activity(GO:0004974) |
| 0.1 | 1.6 | GO:0004143 | diacylglycerol kinase activity(GO:0004143) |
| 0.1 | 0.8 | GO:0035005 | 1-phosphatidylinositol-4-phosphate 3-kinase activity(GO:0035005) |
| 0.1 | 0.6 | GO:0016433 | rRNA (adenine) methyltransferase activity(GO:0016433) |
| 0.1 | 0.8 | GO:0001075 | transcription factor activity, RNA polymerase II core promoter sequence-specific binding involved in preinitiation complex assembly(GO:0001075) |
| 0.1 | 0.2 | GO:1904455 | ubiquitin-specific protease activity involved in negative regulation of ERAD pathway(GO:1904455) |
| 0.1 | 0.7 | GO:1990247 | N6-methyladenosine-containing RNA binding(GO:1990247) |
| 0.1 | 0.5 | GO:0061665 | SUMO ligase activity(GO:0061665) |
| 0.1 | 0.3 | GO:0004157 | dihydropyrimidinase activity(GO:0004157) |
| 0.1 | 0.8 | GO:0008568 | microtubule-severing ATPase activity(GO:0008568) |
| 0.1 | 2.6 | GO:0004709 | MAP kinase kinase kinase activity(GO:0004709) |
| 0.1 | 0.8 | GO:0051434 | BH3 domain binding(GO:0051434) |
| 0.1 | 0.4 | GO:0005324 | long-chain fatty acid transporter activity(GO:0005324) |
| 0.1 | 0.3 | GO:0005010 | insulin-like growth factor-activated receptor activity(GO:0005010) |
| 0.1 | 0.8 | GO:0001135 | transcription factor activity, RNA polymerase II transcription factor recruiting(GO:0001135) |
| 0.1 | 1.6 | GO:0005523 | tropomyosin binding(GO:0005523) |
| 0.1 | 1.4 | GO:0035198 | miRNA binding(GO:0035198) |
| 0.1 | 3.1 | GO:0061631 | ubiquitin conjugating enzyme activity(GO:0061631) |
| 0.1 | 0.3 | GO:0051734 | ATP-dependent polydeoxyribonucleotide 5'-hydroxyl-kinase activity(GO:0046404) polydeoxyribonucleotide kinase activity(GO:0051733) ATP-dependent polynucleotide kinase activity(GO:0051734) |
| 0.1 | 0.5 | GO:0070739 | protein-glutamic acid ligase activity(GO:0070739) tubulin-glutamic acid ligase activity(GO:0070740) |
| 0.1 | 1.3 | GO:0042800 | histone methyltransferase activity (H3-K4 specific)(GO:0042800) |
| 0.0 | 0.6 | GO:0005168 | neurotrophin TRKA receptor binding(GO:0005168) |
| 0.0 | 0.8 | GO:0048406 | nerve growth factor binding(GO:0048406) |
| 0.0 | 0.6 | GO:0005005 | transmembrane-ephrin receptor activity(GO:0005005) |
| 0.0 | 0.3 | GO:0008479 | queuine tRNA-ribosyltransferase activity(GO:0008479) |
| 0.0 | 0.9 | GO:0008253 | 5'-nucleotidase activity(GO:0008253) |
| 0.0 | 4.3 | GO:0004407 | histone deacetylase activity(GO:0004407) |
| 0.0 | 0.3 | GO:0005223 | intracellular cGMP activated cation channel activity(GO:0005223) |
| 0.0 | 1.5 | GO:0005388 | calcium-transporting ATPase activity(GO:0005388) |
| 0.0 | 0.3 | GO:0031730 | CCR5 chemokine receptor binding(GO:0031730) |
| 0.0 | 1.7 | GO:0019707 | protein-cysteine S-palmitoyltransferase activity(GO:0019706) protein-cysteine S-acyltransferase activity(GO:0019707) |
| 0.0 | 1.0 | GO:0042813 | Wnt-activated receptor activity(GO:0042813) |
| 0.0 | 0.7 | GO:0019911 | structural constituent of myelin sheath(GO:0019911) |
| 0.0 | 0.5 | GO:0003951 | NAD+ kinase activity(GO:0003951) |
| 0.0 | 0.9 | GO:0030215 | semaphorin receptor binding(GO:0030215) |
| 0.0 | 0.2 | GO:0004515 | nicotinate-nucleotide adenylyltransferase activity(GO:0004515) |
| 0.0 | 0.1 | GO:0070012 | oligopeptidase activity(GO:0070012) |
| 0.0 | 0.5 | GO:0004726 | non-membrane spanning protein tyrosine phosphatase activity(GO:0004726) |
| 0.0 | 0.5 | GO:0046935 | 1-phosphatidylinositol-3-kinase regulator activity(GO:0046935) |
| 0.0 | 0.8 | GO:0015929 | hexosaminidase activity(GO:0015929) |
| 0.0 | 1.2 | GO:0005184 | neuropeptide hormone activity(GO:0005184) |
| 0.0 | 0.3 | GO:0004322 | ferroxidase activity(GO:0004322) oxidoreductase activity, oxidizing metal ions, oxygen as acceptor(GO:0016724) |
| 0.0 | 0.2 | GO:1990763 | arrestin family protein binding(GO:1990763) |
| 0.0 | 0.6 | GO:0042577 | lipid phosphatase activity(GO:0042577) |
| 0.0 | 0.3 | GO:0016361 | activin receptor activity, type I(GO:0016361) |
| 0.0 | 1.1 | GO:0017025 | TBP-class protein binding(GO:0017025) |
| 0.0 | 0.1 | GO:0033265 | choline binding(GO:0033265) |
| 0.0 | 0.7 | GO:0015643 | toxic substance binding(GO:0015643) |
| 0.0 | 1.2 | GO:0070577 | lysine-acetylated histone binding(GO:0070577) |
| 0.0 | 0.3 | GO:0016286 | small conductance calcium-activated potassium channel activity(GO:0016286) |
| 0.0 | 12.1 | GO:0001227 | transcriptional repressor activity, RNA polymerase II transcription regulatory region sequence-specific binding(GO:0001227) |
| 0.0 | 3.8 | GO:0005070 | SH3/SH2 adaptor activity(GO:0005070) |
| 0.0 | 1.2 | GO:0016538 | cyclin-dependent protein serine/threonine kinase regulator activity(GO:0016538) |
| 0.0 | 1.2 | GO:0043539 | protein serine/threonine kinase activator activity(GO:0043539) |
| 0.0 | 2.6 | GO:0005548 | phospholipid transporter activity(GO:0005548) |
| 0.0 | 0.2 | GO:0004652 | polynucleotide adenylyltransferase activity(GO:0004652) |
| 0.0 | 0.8 | GO:0031683 | G-protein beta/gamma-subunit complex binding(GO:0031683) |
| 0.0 | 1.3 | GO:0000146 | microfilament motor activity(GO:0000146) |
| 0.0 | 0.8 | GO:0080025 | phosphatidylinositol-3,5-bisphosphate binding(GO:0080025) |
| 0.0 | 0.1 | GO:0004910 | interleukin-1, Type II, blocking receptor activity(GO:0004910) |
| 0.0 | 0.2 | GO:0046975 | histone methyltransferase activity (H3-K36 specific)(GO:0046975) |
| 0.0 | 0.6 | GO:0004535 | poly(A)-specific ribonuclease activity(GO:0004535) |
| 0.0 | 0.7 | GO:0031492 | nucleosomal DNA binding(GO:0031492) |
| 0.0 | 0.2 | GO:0019238 | cyclohydrolase activity(GO:0019238) |
| 0.0 | 0.3 | GO:0097027 | ubiquitin-protein transferase activator activity(GO:0097027) |
| 0.0 | 0.7 | GO:0005337 | nucleoside transmembrane transporter activity(GO:0005337) |
| 0.0 | 0.2 | GO:0042978 | ornithine decarboxylase activator activity(GO:0042978) |
| 0.0 | 2.2 | GO:0034212 | peptide N-acetyltransferase activity(GO:0034212) |
| 0.0 | 1.7 | GO:0019003 | GDP binding(GO:0019003) |
| 0.0 | 1.6 | GO:0016279 | protein-lysine N-methyltransferase activity(GO:0016279) |
| 0.0 | 1.3 | GO:0005547 | phosphatidylinositol-3,4,5-trisphosphate binding(GO:0005547) |
| 0.0 | 2.9 | GO:0003777 | microtubule motor activity(GO:0003777) |
| 0.0 | 0.4 | GO:0003688 | DNA replication origin binding(GO:0003688) |
| 0.0 | 0.3 | GO:0035374 | chondroitin sulfate binding(GO:0035374) |
| 0.0 | 0.2 | GO:0004526 | ribonuclease P activity(GO:0004526) |
| 0.0 | 0.8 | GO:0042605 | peptide antigen binding(GO:0042605) |
| 0.0 | 0.4 | GO:0034450 | ubiquitin-ubiquitin ligase activity(GO:0034450) |
| 0.0 | 0.2 | GO:0036310 | annealing helicase activity(GO:0036310) |
| 0.0 | 0.6 | GO:0051059 | NF-kappaB binding(GO:0051059) |
| 0.0 | 0.2 | GO:0003831 | beta-N-acetylglucosaminylglycopeptide beta-1,4-galactosyltransferase activity(GO:0003831) |
| 0.0 | 0.2 | GO:0005280 | hydrogen:amino acid symporter activity(GO:0005280) |
| 0.0 | 0.4 | GO:0098748 | clathrin adaptor activity(GO:0035615) endocytic adaptor activity(GO:0098748) |
| 0.0 | 0.1 | GO:0016206 | catechol O-methyltransferase activity(GO:0016206) |
| 0.0 | 0.1 | GO:0019776 | Atg8 ligase activity(GO:0019776) |
| 0.0 | 0.3 | GO:0051011 | microtubule minus-end binding(GO:0051011) |
| 0.0 | 0.1 | GO:0019960 | C-X3-C chemokine binding(GO:0019960) |
| 0.0 | 0.1 | GO:0015165 | pyrimidine nucleotide-sugar transmembrane transporter activity(GO:0015165) |
| 0.0 | 0.1 | GO:0043140 | ATP-dependent 3'-5' DNA helicase activity(GO:0043140) |
| 0.0 | 0.4 | GO:0031491 | nucleosome binding(GO:0031491) |
| 0.0 | 0.9 | GO:0008536 | Ran GTPase binding(GO:0008536) |
| 0.0 | 1.1 | GO:0017112 | Rab guanyl-nucleotide exchange factor activity(GO:0017112) |
| 0.0 | 0.4 | GO:0070006 | metalloaminopeptidase activity(GO:0070006) |
| 0.0 | 0.2 | GO:0031996 | thioesterase binding(GO:0031996) |
| 0.0 | 0.3 | GO:0019870 | potassium channel inhibitor activity(GO:0019870) |
| 0.0 | 0.1 | GO:0042954 | lipoprotein transporter activity(GO:0042954) |
| 0.0 | 0.1 | GO:0005384 | manganese ion transmembrane transporter activity(GO:0005384) |
| 0.0 | 0.4 | GO:0005283 | sodium:amino acid symporter activity(GO:0005283) cation:amino acid symporter activity(GO:0005416) |
| 0.0 | 0.3 | GO:0005402 | sugar:proton symporter activity(GO:0005351) cation:sugar symporter activity(GO:0005402) |
| 0.0 | 0.4 | GO:0008301 | DNA binding, bending(GO:0008301) |
| 0.0 | 0.7 | GO:0005484 | SNAP receptor activity(GO:0005484) |
| 0.0 | 0.2 | GO:0015232 | heme transporter activity(GO:0015232) |
| 0.0 | 1.4 | GO:0030276 | clathrin binding(GO:0030276) |
| 0.0 | 0.2 | GO:0004971 | AMPA glutamate receptor activity(GO:0004971) |
| 0.0 | 0.2 | GO:0008353 | RNA polymerase II carboxy-terminal domain kinase activity(GO:0008353) |
| 0.0 | 1.0 | GO:0004702 | receptor signaling protein serine/threonine kinase activity(GO:0004702) |
Gene overrepresentation in curated gene sets: canonical pathways category:
| Log-likelihood per target | Total log-likelihood | Term | Description |
|---|---|---|---|
| 0.1 | 3.3 | PID S1P S1P4 PATHWAY | S1P4 pathway |
| 0.1 | 2.6 | PID TCR JNK PATHWAY | JNK signaling in the CD4+ TCR pathway |
| 0.1 | 0.5 | PID RANBP2 PATHWAY | Sumoylation by RanBP2 regulates transcriptional repression |
| 0.1 | 2.5 | PID INTEGRIN5 PATHWAY | Beta5 beta6 beta7 and beta8 integrin cell surface interactions |
| 0.1 | 3.5 | PID TCR CALCIUM PATHWAY | Calcium signaling in the CD4+ TCR pathway |
| 0.1 | 2.6 | SA B CELL RECEPTOR COMPLEXES | Antigen binding to B cell receptors activates protein tyrosine kinases, such as the Src family, which ultimate activate MAP kinases. |
| 0.1 | 6.0 | PID HDAC CLASSII PATHWAY | Signaling events mediated by HDAC Class II |
| 0.0 | 0.5 | ST PAC1 RECEPTOR PATHWAY | PAC1 Receptor Pathway |
| 0.0 | 1.0 | SA PROGRAMMED CELL DEATH | Programmed cell death, or apoptosis, eliminates damaged or unneeded cells. |
| 0.0 | 0.8 | SA TRKA RECEPTOR | The TrkA receptor binds nerve growth factor to activate MAP kinase pathways and promote cell growth. |
| 0.0 | 2.0 | PID NFAT TFPATHWAY | Calcineurin-regulated NFAT-dependent transcription in lymphocytes |
| 0.0 | 0.2 | PID TCR RAS PATHWAY | Ras signaling in the CD4+ TCR pathway |
| 0.0 | 2.2 | PID TCR PATHWAY | TCR signaling in naïve CD4+ T cells |
| 0.0 | 0.7 | PID FGF PATHWAY | FGF signaling pathway |
| 0.0 | 0.7 | PID WNT NONCANONICAL PATHWAY | Noncanonical Wnt signaling pathway |
| 0.0 | 2.3 | PID FCER1 PATHWAY | Fc-epsilon receptor I signaling in mast cells |
| 0.0 | 1.9 | PID ARF6 PATHWAY | Arf6 signaling events |
| 0.0 | 0.2 | PID CD40 PATHWAY | CD40/CD40L signaling |
| 0.0 | 0.3 | ST IL 13 PATHWAY | Interleukin 13 (IL-13) Pathway |
| 0.0 | 0.9 | PID RAS PATHWAY | Regulation of Ras family activation |
| 0.0 | 1.4 | PID AMB2 NEUTROPHILS PATHWAY | amb2 Integrin signaling |
| 0.0 | 0.3 | SA REG CASCADE OF CYCLIN EXPR | Expression of cyclins regulates progression through the cell cycle by activating cyclin-dependent kinases. |
| 0.0 | 0.8 | SA MMP CYTOKINE CONNECTION | Cytokines can induce activation of matrix metalloproteinases, which degrade extracellular matrix. |
| 0.0 | 0.9 | PID P38 MKK3 6PATHWAY | p38 MAPK signaling pathway |
| 0.0 | 0.5 | PID CXCR3 PATHWAY | CXCR3-mediated signaling events |
| 0.0 | 1.0 | PID MYC PATHWAY | C-MYC pathway |
| 0.0 | 1.4 | PID HES HEY PATHWAY | Notch-mediated HES/HEY network |
| 0.0 | 0.6 | ST GRANULE CELL SURVIVAL PATHWAY | Granule Cell Survival Pathway is a specific case of more general PAC1 Receptor Pathway. |
| 0.0 | 0.7 | PID GMCSF PATHWAY | GMCSF-mediated signaling events |
| 0.0 | 1.2 | PID AURORA B PATHWAY | Aurora B signaling |
| 0.0 | 1.2 | PID HEDGEHOG GLI PATHWAY | Hedgehog signaling events mediated by Gli proteins |
| 0.0 | 0.2 | PID IL2 PI3K PATHWAY | IL2 signaling events mediated by PI3K |
| 0.0 | 0.4 | PID ARF 3PATHWAY | Arf1 pathway |
| 0.0 | 0.2 | ST DIFFERENTIATION PATHWAY IN PC12 CELLS | Differentiation Pathway in PC12 Cells; this is a specific case of PAC1 Receptor Pathway. |
| 0.0 | 0.5 | PID CD8 TCR DOWNSTREAM PATHWAY | Downstream signaling in naïve CD8+ T cells |
| 0.0 | 1.2 | PID E2F PATHWAY | E2F transcription factor network |
| 0.0 | 0.4 | PID IL23 PATHWAY | IL23-mediated signaling events |
| 0.0 | 0.8 | PID FANCONI PATHWAY | Fanconi anemia pathway |
| 0.0 | 0.7 | PID ERBB1 INTERNALIZATION PATHWAY | Internalization of ErbB1 |
| 0.0 | 0.9 | PID AJDISS 2PATHWAY | Posttranslational regulation of adherens junction stability and dissassembly |
| 0.0 | 0.3 | PID P38 ALPHA BETA PATHWAY | Regulation of p38-alpha and p38-beta |
| 0.0 | 1.1 | PID ERA GENOMIC PATHWAY | Validated nuclear estrogen receptor alpha network |
| 0.0 | 0.6 | PID TNF PATHWAY | TNF receptor signaling pathway |
| 0.0 | 0.6 | PID SYNDECAN 4 PATHWAY | Syndecan-4-mediated signaling events |
| 0.0 | 0.3 | PID RETINOIC ACID PATHWAY | Retinoic acid receptors-mediated signaling |
Gene overrepresentation in curated gene sets: REACTOME pathways category:
| Log-likelihood per target | Total log-likelihood | Term | Description |
|---|---|---|---|
| 0.2 | 1.4 | REACTOME THROMBOXANE SIGNALLING THROUGH TP RECEPTOR | Genes involved in Thromboxane signalling through TP receptor |
| 0.1 | 3.7 | REACTOME REGULATION OF SIGNALING BY CBL | Genes involved in Regulation of signaling by CBL |
| 0.1 | 0.4 | REACTOME IRAK1 RECRUITS IKK COMPLEX | Genes involved in IRAK1 recruits IKK complex |
| 0.1 | 1.8 | REACTOME ACTIVATION OF BH3 ONLY PROTEINS | Genes involved in Activation of BH3-only proteins |
| 0.1 | 3.3 | REACTOME INHIBITION OF INSULIN SECRETION BY ADRENALINE NORADRENALINE | Genes involved in Inhibition of Insulin Secretion by Adrenaline/Noradrenaline |
| 0.1 | 0.9 | REACTOME ADVANCED GLYCOSYLATION ENDPRODUCT RECEPTOR SIGNALING | Genes involved in Advanced glycosylation endproduct receptor signaling |
| 0.1 | 3.8 | REACTOME DAG AND IP3 SIGNALING | Genes involved in DAG and IP3 signaling |
| 0.1 | 2.2 | REACTOME PRE NOTCH TRANSCRIPTION AND TRANSLATION | Genes involved in Pre-NOTCH Transcription and Translation |
| 0.0 | 2.4 | REACTOME SYNTHESIS OF PIPS AT THE PLASMA MEMBRANE | Genes involved in Synthesis of PIPs at the plasma membrane |
| 0.0 | 0.5 | REACTOME REGULATION OF IFNG SIGNALING | Genes involved in Regulation of IFNG signaling |
| 0.0 | 1.9 | REACTOME ACTIVATION OF THE PRE REPLICATIVE COMPLEX | Genes involved in Activation of the pre-replicative complex |
| 0.0 | 3.8 | REACTOME NCAM1 INTERACTIONS | Genes involved in NCAM1 interactions |
| 0.0 | 1.2 | REACTOME PHOSPHORYLATION OF CD3 AND TCR ZETA CHAINS | Genes involved in Phosphorylation of CD3 and TCR zeta chains |
| 0.0 | 1.3 | REACTOME DEPOSITION OF NEW CENPA CONTAINING NUCLEOSOMES AT THE CENTROMERE | Genes involved in Deposition of New CENPA-containing Nucleosomes at the Centromere |
| 0.0 | 1.5 | REACTOME TRAF6 MEDIATED NFKB ACTIVATION | Genes involved in TRAF6 mediated NF-kB activation |
| 0.0 | 1.2 | REACTOME INSULIN SYNTHESIS AND PROCESSING | Genes involved in Insulin Synthesis and Processing |
| 0.0 | 0.7 | REACTOME IL 6 SIGNALING | Genes involved in Interleukin-6 signaling |
| 0.0 | 0.2 | REACTOME RAF MAP KINASE CASCADE | Genes involved in RAF/MAP kinase cascade |
| 0.0 | 1.5 | REACTOME CELL EXTRACELLULAR MATRIX INTERACTIONS | Genes involved in Cell-extracellular matrix interactions |
| 0.0 | 0.6 | REACTOME NEF MEDIATED DOWNREGULATION OF MHC CLASS I COMPLEX CELL SURFACE EXPRESSION | Genes involved in Nef mediated downregulation of MHC class I complex cell surface expression |
| 0.0 | 1.1 | REACTOME G0 AND EARLY G1 | Genes involved in G0 and Early G1 |
| 0.0 | 1.8 | REACTOME REGULATION OF GENE EXPRESSION IN BETA CELLS | Genes involved in Regulation of gene expression in beta cells |
| 0.0 | 1.2 | REACTOME GLUCAGON TYPE LIGAND RECEPTORS | Genes involved in Glucagon-type ligand receptors |
| 0.0 | 1.1 | REACTOME DESTABILIZATION OF MRNA BY KSRP | Genes involved in Destabilization of mRNA by KSRP |
| 0.0 | 1.3 | REACTOME DEGRADATION OF THE EXTRACELLULAR MATRIX | Genes involved in Degradation of the extracellular matrix |
| 0.0 | 1.0 | REACTOME GRB2 SOS PROVIDES LINKAGE TO MAPK SIGNALING FOR INTERGRINS | Genes involved in GRB2:SOS provides linkage to MAPK signaling for Intergrins |
| 0.0 | 2.3 | REACTOME CLASS B 2 SECRETIN FAMILY RECEPTORS | Genes involved in Class B/2 (Secretin family receptors) |
| 0.0 | 1.2 | REACTOME DARPP 32 EVENTS | Genes involved in DARPP-32 events |
| 0.0 | 0.2 | REACTOME TRAF3 DEPENDENT IRF ACTIVATION PATHWAY | Genes involved in TRAF3-dependent IRF activation pathway |
| 0.0 | 1.3 | REACTOME YAP1 AND WWTR1 TAZ STIMULATED GENE EXPRESSION | Genes involved in YAP1- and WWTR1 (TAZ)-stimulated gene expression |
| 0.0 | 0.7 | REACTOME KERATAN SULFATE BIOSYNTHESIS | Genes involved in Keratan sulfate biosynthesis |
| 0.0 | 2.5 | REACTOME O LINKED GLYCOSYLATION OF MUCINS | Genes involved in O-linked glycosylation of mucins |
| 0.0 | 0.8 | REACTOME FANCONI ANEMIA PATHWAY | Genes involved in Fanconi Anemia pathway |
| 0.0 | 0.7 | REACTOME SIGNALING BY FGFR1 FUSION MUTANTS | Genes involved in Signaling by FGFR1 fusion mutants |
| 0.0 | 2.8 | REACTOME INTERFERON ALPHA BETA SIGNALING | Genes involved in Interferon alpha/beta signaling |
| 0.0 | 2.1 | REACTOME NOTCH1 INTRACELLULAR DOMAIN REGULATES TRANSCRIPTION | Genes involved in NOTCH1 Intracellular Domain Regulates Transcription |
| 0.0 | 1.0 | REACTOME ELONGATION ARREST AND RECOVERY | Genes involved in Elongation arrest and recovery |
| 0.0 | 0.2 | REACTOME PROLONGED ERK ACTIVATION EVENTS | Genes involved in Prolonged ERK activation events |
| 0.0 | 0.7 | REACTOME ANTIGEN ACTIVATES B CELL RECEPTOR LEADING TO GENERATION OF SECOND MESSENGERS | Genes involved in Antigen Activates B Cell Receptor Leading to Generation of Second Messengers |
| 0.0 | 0.7 | REACTOME GPVI MEDIATED ACTIVATION CASCADE | Genes involved in GPVI-mediated activation cascade |
| 0.0 | 0.5 | REACTOME EICOSANOID LIGAND BINDING RECEPTORS | Genes involved in Eicosanoid ligand-binding receptors |
| 0.0 | 0.9 | REACTOME KINESINS | Genes involved in Kinesins |
| 0.0 | 0.8 | REACTOME RNA POL II TRANSCRIPTION PRE INITIATION AND PROMOTER OPENING | Genes involved in RNA Polymerase II Transcription Pre-Initiation And Promoter Opening |
| 0.0 | 1.1 | REACTOME TRANSPORT OF VITAMINS NUCLEOSIDES AND RELATED MOLECULES | Genes involved in Transport of vitamins, nucleosides, and related molecules |
| 0.0 | 0.4 | REACTOME NEF MEDIATES DOWN MODULATION OF CELL SURFACE RECEPTORS BY RECRUITING THEM TO CLATHRIN ADAPTERS | Genes involved in Nef-mediates down modulation of cell surface receptors by recruiting them to clathrin adapters |
| 0.0 | 0.3 | REACTOME PYRIMIDINE CATABOLISM | Genes involved in Pyrimidine catabolism |
| 0.0 | 0.4 | REACTOME PROTEOLYTIC CLEAVAGE OF SNARE COMPLEX PROTEINS | Genes involved in Proteolytic cleavage of SNARE complex proteins |
| 0.0 | 0.2 | REACTOME CALNEXIN CALRETICULIN CYCLE | Genes involved in Calnexin/calreticulin cycle |
| 0.0 | 1.4 | REACTOME GOLGI ASSOCIATED VESICLE BIOGENESIS | Genes involved in Golgi Associated Vesicle Biogenesis |
| 0.0 | 0.2 | REACTOME REGULATION OF ORNITHINE DECARBOXYLASE ODC | Genes involved in Regulation of ornithine decarboxylase (ODC) |
| 0.0 | 0.2 | REACTOME TETRAHYDROBIOPTERIN BH4 SYNTHESIS RECYCLING SALVAGE AND REGULATION | Genes involved in Tetrahydrobiopterin (BH4) synthesis, recycling, salvage and regulation |
| 0.0 | 0.3 | REACTOME P38MAPK EVENTS | Genes involved in p38MAPK events |
| 0.0 | 0.3 | REACTOME CYCLIN A B1 ASSOCIATED EVENTS DURING G2 M TRANSITION | Genes involved in Cyclin A/B1 associated events during G2/M transition |
| 0.0 | 0.3 | REACTOME BASE FREE SUGAR PHOSPHATE REMOVAL VIA THE SINGLE NUCLEOTIDE REPLACEMENT PATHWAY | Genes involved in Base-free sugar-phosphate removal via the single-nucleotide replacement pathway |
| 0.0 | 0.4 | REACTOME ABCA TRANSPORTERS IN LIPID HOMEOSTASIS | Genes involved in ABCA transporters in lipid homeostasis |
| 0.0 | 0.3 | REACTOME SIGNALING BY FGFR3 MUTANTS | Genes involved in Signaling by FGFR3 mutants |
| 0.0 | 0.3 | REACTOME RECRUITMENT OF NUMA TO MITOTIC CENTROSOMES | Genes involved in Recruitment of NuMA to mitotic centrosomes |
| 0.0 | 1.2 | REACTOME IMMUNOREGULATORY INTERACTIONS BETWEEN A LYMPHOID AND A NON LYMPHOID CELL | Genes involved in Immunoregulatory interactions between a Lymphoid and a non-Lymphoid cell |
| 0.0 | 0.3 | REACTOME ACTIVATION OF GENES BY ATF4 | Genes involved in Activation of Genes by ATF4 |
| 0.0 | 0.6 | REACTOME DEADENYLATION OF MRNA | Genes involved in Deadenylation of mRNA |
| 0.0 | 0.4 | REACTOME OTHER SEMAPHORIN INTERACTIONS | Genes involved in Other semaphorin interactions |
| 0.0 | 3.9 | REACTOME ANTIGEN PROCESSING UBIQUITINATION PROTEASOME DEGRADATION | Genes involved in Antigen processing: Ubiquitination & Proteasome degradation |
| 0.0 | 1.1 | REACTOME APOPTOTIC CLEAVAGE OF CELLULAR PROTEINS | Genes involved in Apoptotic cleavage of cellular proteins |
| 0.0 | 0.2 | REACTOME MRNA DECAY BY 5 TO 3 EXORIBONUCLEASE | Genes involved in mRNA Decay by 5' to 3' Exoribonuclease |
| 0.0 | 0.5 | REACTOME P75 NTR RECEPTOR MEDIATED SIGNALLING | Genes involved in p75 NTR receptor-mediated signalling |
| 0.0 | 0.3 | REACTOME MRNA SPLICING MINOR PATHWAY | Genes involved in mRNA Splicing - Minor Pathway |
| 0.0 | 0.5 | REACTOME EFFECTS OF PIP2 HYDROLYSIS | Genes involved in Effects of PIP2 hydrolysis |