Project
Illumina Body Map 2 (GSE30611)
Navigation
Downloads
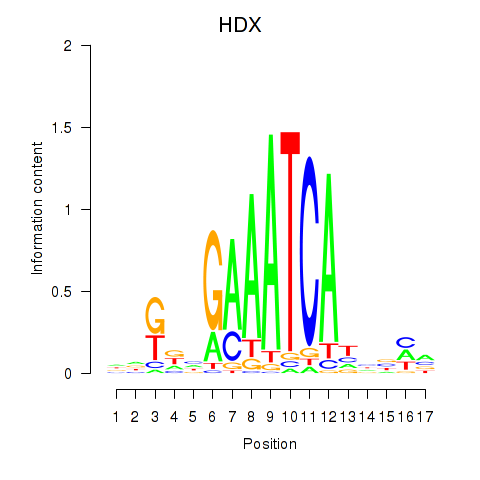
Results for HDX
Z-value: 0.60
Motif logo
Transcription factors associated with HDX
| Gene Symbol | Gene ID | Gene Info |
|---|---|---|
|
HDX
|
ENSG00000165259.14 | highly divergent homeobox |
Activity-expression correlation:
| Gene | Promoter | Pearson corr. coef. | P-value | Plot |
|---|---|---|---|---|
| HDX | hg38_v1_chrX_-_84502442_84502501 | 0.33 | 6.2e-02 | Click! |
Activity profile of HDX motif
Sorted Z-values of HDX motif
| Promoter | Log-likelihood | Transcript | Gene | Gene Info |
|---|---|---|---|---|
| chr7_+_142800957 | 2.43 |
ENST00000466254.1
|
TRBC2
|
T cell receptor beta constant 2 |
| chr12_+_56763316 | 2.26 |
ENST00000322165.1
|
HSD17B6
|
hydroxysteroid 17-beta dehydrogenase 6 |
| chr3_-_165837412 | 2.06 |
ENST00000479451.5
ENST00000488954.1 ENST00000264381.8 |
BCHE
|
butyrylcholinesterase |
| chr1_-_153390976 | 1.80 |
ENST00000368732.5
ENST00000368733.4 |
S100A8
|
S100 calcium binding protein A8 |
| chr1_-_159714581 | 1.45 |
ENST00000255030.9
ENST00000437342.1 ENST00000368112.5 ENST00000368111.5 ENST00000368110.1 |
CRP
|
C-reactive protein |
| chr2_-_112836702 | 1.42 |
ENST00000416750.1
ENST00000263341.7 ENST00000418817.5 |
IL1B
|
interleukin 1 beta |
| chr1_-_169711603 | 1.22 |
ENST00000236147.6
ENST00000650983.1 |
SELL
|
selectin L |
| chr11_+_60699605 | 1.07 |
ENST00000300226.7
|
MS4A8
|
membrane spanning 4-domains A8 |
| chr1_+_62597510 | 0.93 |
ENST00000371129.4
|
ANGPTL3
|
angiopoietin like 3 |
| chr1_+_84164684 | 0.84 |
ENST00000370680.5
|
PRKACB
|
protein kinase cAMP-activated catalytic subunit beta |
| chr14_+_79279906 | 0.81 |
ENST00000428277.6
|
NRXN3
|
neurexin 3 |
| chr12_-_102950835 | 0.80 |
ENST00000546844.1
|
PAH
|
phenylalanine hydroxylase |
| chr12_+_10307950 | 0.78 |
ENST00000543420.5
ENST00000543777.5 |
KLRD1
|
killer cell lectin like receptor D1 |
| chr3_+_54123452 | 0.77 |
ENST00000620722.4
ENST00000490478.5 |
CACNA2D3
|
calcium voltage-gated channel auxiliary subunit alpha2delta 3 |
| chr1_+_84164669 | 0.74 |
ENST00000450730.5
|
PRKACB
|
protein kinase cAMP-activated catalytic subunit beta |
| chr5_-_135954962 | 0.71 |
ENST00000522943.5
ENST00000514447.2 ENST00000274507.6 |
LECT2
|
leukocyte cell derived chemotaxin 2 |
| chr9_+_6215786 | 0.71 |
ENST00000417746.6
ENST00000682010.1 |
IL33
|
interleukin 33 |
| chr1_+_84164370 | 0.71 |
ENST00000446538.5
ENST00000610703.4 ENST00000370682.7 ENST00000394838.6 ENST00000432111.5 |
PRKACB
|
protein kinase cAMP-activated catalytic subunit beta |
| chr7_-_135728177 | 0.70 |
ENST00000682651.1
ENST00000354042.8 |
SLC13A4
|
solute carrier family 13 member 4 |
| chr1_+_84164293 | 0.69 |
ENST00000370684.5
ENST00000436133.5 |
PRKACB
|
protein kinase cAMP-activated catalytic subunit beta |
| chr12_+_10307818 | 0.61 |
ENST00000350274.9
ENST00000336164.9 |
KLRD1
|
killer cell lectin like receptor D1 |
| chr2_+_169069537 | 0.59 |
ENST00000428522.5
ENST00000450153.1 ENST00000674881.1 ENST00000421653.5 |
DHRS9
|
dehydrogenase/reductase 9 |
| chr12_-_39340963 | 0.56 |
ENST00000552961.5
|
KIF21A
|
kinesin family member 21A |
| chr11_+_60699669 | 0.56 |
ENST00000529752.5
|
MS4A8
|
membrane spanning 4-domains A8 |
| chr8_+_24294044 | 0.50 |
ENST00000265769.9
|
ADAM28
|
ADAM metallopeptidase domain 28 |
| chr14_+_79279403 | 0.46 |
ENST00000281127.11
|
NRXN3
|
neurexin 3 |
| chr8_+_24294107 | 0.45 |
ENST00000437154.6
|
ADAM28
|
ADAM metallopeptidase domain 28 |
| chr7_-_108243234 | 0.41 |
ENST00000417701.5
|
NRCAM
|
neuronal cell adhesion molecule |
| chr4_+_70334963 | 0.41 |
ENST00000273936.6
|
CABS1
|
calcium binding protein, spermatid associated 1 |
| chr10_+_18400562 | 0.36 |
ENST00000377315.5
ENST00000650685.1 |
CACNB2
|
calcium voltage-gated channel auxiliary subunit beta 2 |
| chr20_-_37158904 | 0.35 |
ENST00000417458.5
|
MROH8
|
maestro heat like repeat family member 8 |
| chr14_+_79279339 | 0.33 |
ENST00000557594.5
|
NRXN3
|
neurexin 3 |
| chr3_+_107523026 | 0.32 |
ENST00000416476.6
|
BBX
|
BBX high mobility group box domain containing |
| chr14_+_79279681 | 0.29 |
ENST00000679122.1
|
NRXN3
|
neurexin 3 |
| chr7_+_80135694 | 0.25 |
ENST00000457358.7
|
GNAI1
|
G protein subunit alpha i1 |
| chr1_-_205422050 | 0.22 |
ENST00000367153.9
|
LEMD1
|
LEM domain containing 1 |
| chr3_+_107522936 | 0.22 |
ENST00000415149.6
ENST00000402543.5 ENST00000325805.13 ENST00000427402.5 |
BBX
|
BBX high mobility group box domain containing |
| chr5_+_141370236 | 0.19 |
ENST00000576222.2
ENST00000618934.1 |
PCDHGB3
|
protocadherin gamma subfamily B, 3 |
| chr1_+_197268222 | 0.19 |
ENST00000367400.8
ENST00000638467.1 ENST00000367399.6 |
CRB1
|
crumbs cell polarity complex component 1 |
| chrX_+_27590376 | 0.18 |
ENST00000451261.6
|
DCAF8L2
|
DDB1 and CUL4 associated factor 8 like 2 |
| chr1_-_48400826 | 0.17 |
ENST00000371841.1
|
SPATA6
|
spermatogenesis associated 6 |
| chrX_+_100969687 | 0.16 |
ENST00000450049.7
|
ARL13A
|
ADP ribosylation factor like GTPase 13A |
| chr2_+_127645864 | 0.14 |
ENST00000544369.5
|
GPR17
|
G protein-coupled receptor 17 |
| chr7_-_29969927 | 0.14 |
ENST00000438497.5
|
SCRN1
|
secernin 1 |
| chr6_+_32969345 | 0.09 |
ENST00000678250.1
|
BRD2
|
bromodomain containing 2 |
| chr2_+_127646145 | 0.07 |
ENST00000486700.2
ENST00000272644.7 |
GPR17
|
G protein-coupled receptor 17 |
| chr14_+_71321379 | 0.07 |
ENST00000557151.5
|
SIPA1L1
|
signal induced proliferation associated 1 like 1 |
| chr5_+_140786291 | 0.06 |
ENST00000394633.7
|
PCDHA1
|
protocadherin alpha 1 |
| chr1_-_209652329 | 0.05 |
ENST00000367030.7
ENST00000356082.9 |
LAMB3
|
laminin subunit beta 3 |
| chr2_+_112977998 | 0.05 |
ENST00000259205.5
ENST00000376489.6 |
IL36G
|
interleukin 36 gamma |
| chr19_+_36111151 | 0.01 |
ENST00000633214.1
ENST00000585332.3 |
OVOL3
|
ovo like zinc finger 3 |
| chr10_-_22210021 | 0.00 |
ENST00000422359.2
|
EBLN1
|
endogenous Bornavirus like nucleoprotein 1 |
| chr19_-_41428730 | 0.00 |
ENST00000321702.2
|
B3GNT8
|
UDP-GlcNAc:betaGal beta-1,3-N-acetylglucosaminyltransferase 8 |
Network of associatons between targets according to the STRING database.

First level regulatory network of HDX
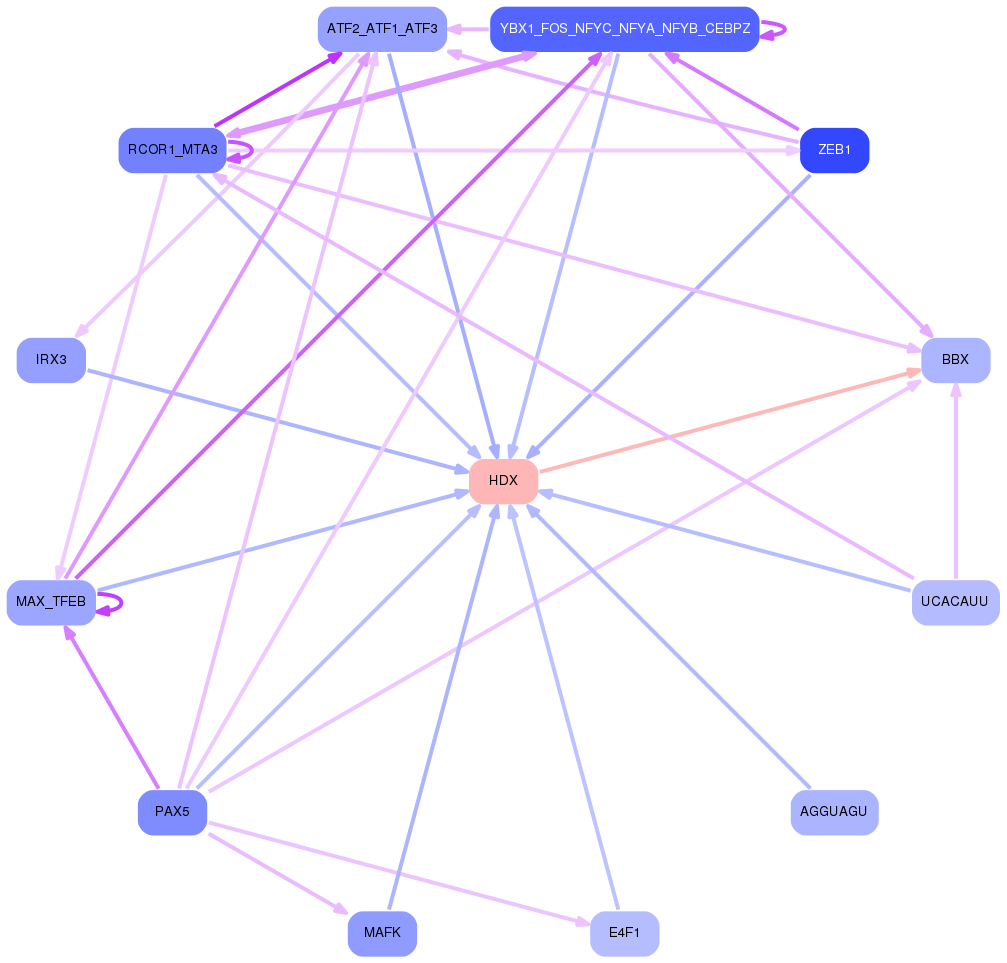
Gene Ontology Analysis
Gene overrepresentation in biological process category:
| Log-likelihood per target | Total log-likelihood | Term | Description |
|---|---|---|---|
| 0.7 | 2.1 | GO:0014016 | neuroblast differentiation(GO:0014016) |
| 0.5 | 1.4 | GO:0060557 | positive regulation of vitamin metabolic process(GO:0046136) positive regulation of vitamin D biosynthetic process(GO:0060557) positive regulation of calcidiol 1-monooxygenase activity(GO:0060559) |
| 0.3 | 3.0 | GO:0097338 | response to clozapine(GO:0097338) |
| 0.3 | 2.3 | GO:0006710 | androgen catabolic process(GO:0006710) |
| 0.1 | 0.7 | GO:0002282 | microglial cell activation involved in immune response(GO:0002282) |
| 0.1 | 1.8 | GO:0032119 | sequestering of zinc ion(GO:0032119) |
| 0.1 | 0.9 | GO:0051005 | negative regulation of phospholipase activity(GO:0010519) negative regulation of lipoprotein lipase activity(GO:0051005) |
| 0.1 | 0.6 | GO:0042905 | 9-cis-retinoic acid biosynthetic process(GO:0042904) 9-cis-retinoic acid metabolic process(GO:0042905) |
| 0.1 | 1.4 | GO:0032930 | positive regulation of superoxide anion generation(GO:0032930) |
| 0.0 | 1.9 | GO:0090129 | positive regulation of synapse maturation(GO:0090129) |
| 0.0 | 0.8 | GO:0006559 | L-phenylalanine metabolic process(GO:0006558) L-phenylalanine catabolic process(GO:0006559) erythrose 4-phosphate/phosphoenolpyruvate family amino acid metabolic process(GO:1902221) erythrose 4-phosphate/phosphoenolpyruvate family amino acid catabolic process(GO:1902222) |
| 0.0 | 0.4 | GO:1904879 | positive regulation of calcium ion transmembrane transport via high voltage-gated calcium channel(GO:1904879) |
| 0.0 | 0.7 | GO:0008272 | sulfate transport(GO:0008272) |
| 0.0 | 2.4 | GO:0006910 | phagocytosis, recognition(GO:0006910) |
| 0.0 | 1.2 | GO:0033198 | response to ATP(GO:0033198) |
| 0.0 | 0.4 | GO:0019227 | neuronal action potential propagation(GO:0019227) action potential propagation(GO:0098870) |
| 0.0 | 0.2 | GO:1904321 | response to forskolin(GO:1904321) cellular response to forskolin(GO:1904322) |
| 0.0 | 1.4 | GO:0002228 | natural killer cell mediated immunity(GO:0002228) |
| 0.0 | 0.2 | GO:0002862 | negative regulation of inflammatory response to antigenic stimulus(GO:0002862) |
Gene overrepresentation in cellular component category:
| Log-likelihood per target | Total log-likelihood | Term | Description |
|---|---|---|---|
| 0.1 | 3.0 | GO:0005952 | cAMP-dependent protein kinase complex(GO:0005952) |
| 0.1 | 2.1 | GO:0005641 | nuclear envelope lumen(GO:0005641) |
| 0.1 | 0.2 | GO:0097224 | sperm connecting piece(GO:0097224) |
| 0.0 | 2.4 | GO:0042571 | immunoglobulin complex, circulating(GO:0042571) |
| 0.0 | 0.4 | GO:1990454 | L-type voltage-gated calcium channel complex(GO:1990454) |
| 0.0 | 0.4 | GO:0043194 | axon initial segment(GO:0043194) |
Gene overrepresentation in molecular function category:
| Log-likelihood per target | Total log-likelihood | Term | Description |
|---|---|---|---|
| 0.9 | 3.5 | GO:0033265 | choline binding(GO:0033265) |
| 0.3 | 1.4 | GO:0023024 | MHC class I protein complex binding(GO:0023024) |
| 0.2 | 2.9 | GO:0047035 | testosterone dehydrogenase (NAD+) activity(GO:0047035) |
| 0.2 | 1.8 | GO:0035662 | Toll-like receptor 4 binding(GO:0035662) |
| 0.2 | 1.2 | GO:0043208 | glycosphingolipid binding(GO:0043208) |
| 0.1 | 0.8 | GO:0004505 | phenylalanine 4-monooxygenase activity(GO:0004505) |
| 0.1 | 3.0 | GO:0004691 | cAMP-dependent protein kinase activity(GO:0004691) |
| 0.1 | 1.5 | GO:0005149 | interleukin-1 receptor binding(GO:0005149) |
| 0.1 | 1.9 | GO:0097109 | neuroligin family protein binding(GO:0097109) |
| 0.0 | 0.7 | GO:0008271 | secondary active sulfate transmembrane transporter activity(GO:0008271) |
| 0.0 | 2.4 | GO:0034987 | immunoglobulin receptor binding(GO:0034987) |
| 0.0 | 0.9 | GO:0004859 | phospholipase inhibitor activity(GO:0004859) |
| 0.0 | 0.4 | GO:0086056 | voltage-gated calcium channel activity involved in AV node cell action potential(GO:0086056) |
| 0.0 | 0.4 | GO:0086080 | protein binding involved in heterotypic cell-cell adhesion(GO:0086080) |
| 0.0 | 0.2 | GO:0031821 | G-protein coupled serotonin receptor binding(GO:0031821) |
| 0.0 | 0.2 | GO:0032027 | myosin light chain binding(GO:0032027) |
Gene overrepresentation in curated gene sets: canonical pathways category:
| Log-likelihood per target | Total log-likelihood | Term | Description |
|---|---|---|---|
| 0.1 | 2.6 | SA MMP CYTOKINE CONNECTION | Cytokines can induce activation of matrix metalloproteinases, which degrade extracellular matrix. |
| 0.0 | 1.8 | PID TOLL ENDOGENOUS PATHWAY | Endogenous TLR signaling |
| 0.0 | 3.0 | PID IL3 PATHWAY | IL3-mediated signaling events |
| 0.0 | 1.4 | PID IL6 7 PATHWAY | IL6-mediated signaling events |
| 0.0 | 0.9 | PID INTEGRIN A4B1 PATHWAY | Alpha4 beta1 integrin signaling events |
Gene overrepresentation in curated gene sets: REACTOME pathways category:
| Log-likelihood per target | Total log-likelihood | Term | Description |
|---|---|---|---|
| 0.1 | 1.4 | REACTOME CREATION OF C4 AND C2 ACTIVATORS | Genes involved in Creation of C4 and C2 activators |
| 0.1 | 2.1 | REACTOME SYNTHESIS SECRETION AND DEACYLATION OF GHRELIN | Genes involved in Synthesis, Secretion, and Deacylation of Ghrelin |
| 0.1 | 3.0 | REACTOME HORMONE SENSITIVE LIPASE HSL MEDIATED TRIACYLGLYCEROL HYDROLYSIS | Genes involved in Hormone-sensitive lipase (HSL)-mediated triacylglycerol hydrolysis |
| 0.0 | 2.6 | REACTOME IMMUNOREGULATORY INTERACTIONS BETWEEN A LYMPHOID AND A NON LYMPHOID CELL | Genes involved in Immunoregulatory interactions between a Lymphoid and a non-Lymphoid cell |
| 0.0 | 0.6 | REACTOME INHIBITION OF INSULIN SECRETION BY ADRENALINE NORADRENALINE | Genes involved in Inhibition of Insulin Secretion by Adrenaline/Noradrenaline |