Project
Illumina Body Map 2 (GSE30611)
Navigation
Downloads
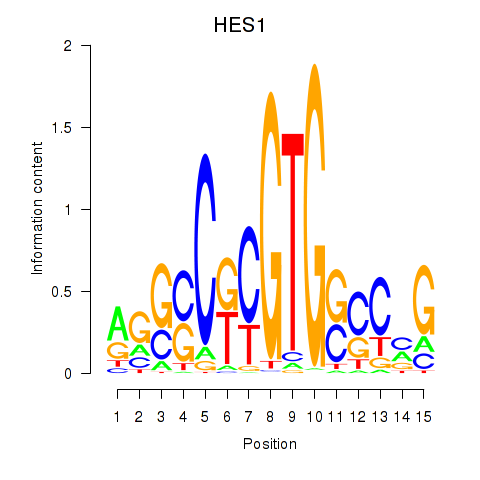
Results for HES1
Z-value: 1.04
Motif logo
Transcription factors associated with HES1
| Gene Symbol | Gene ID | Gene Info |
|---|---|---|
|
HES1
|
ENSG00000114315.4 | hes family bHLH transcription factor 1 |
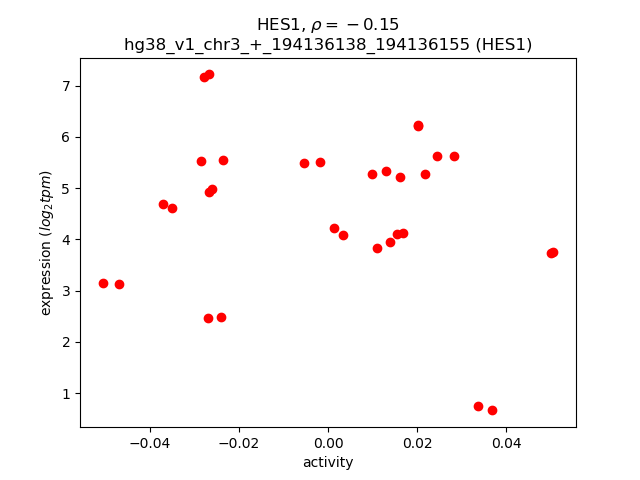
Activity-expression correlation:
| Gene | Promoter | Pearson corr. coef. | P-value | Plot |
|---|---|---|---|---|
| HES1 | hg38_v1_chr3_+_194136138_194136155 | -0.15 | 4.1e-01 | Click! |
Activity profile of HES1 motif
Sorted Z-values of HES1 motif
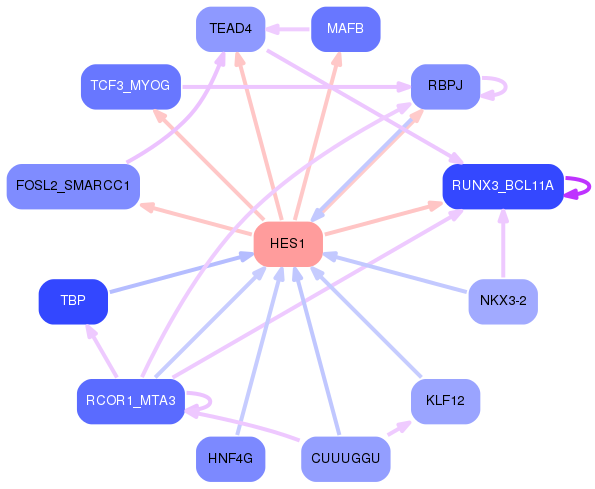
Network of associatons between targets according to the STRING database.

First level regulatory network of HES1
Gene Ontology Analysis
Gene overrepresentation in biological process category:
| Log-likelihood per target | Total log-likelihood | Term | Description |
|---|---|---|---|
| 0.6 | 2.3 | GO:0000738 | DNA catabolic process, exonucleolytic(GO:0000738) |
| 0.4 | 1.3 | GO:0019483 | uracil catabolic process(GO:0006212) beta-alanine biosynthetic process(GO:0019483) |
| 0.4 | 3.9 | GO:0070236 | negative regulation of activation-induced cell death of T cells(GO:0070236) |
| 0.4 | 1.7 | GO:0003169 | coronary vein morphogenesis(GO:0003169) |
| 0.4 | 1.6 | GO:0002086 | diaphragm contraction(GO:0002086) |
| 0.4 | 1.2 | GO:0034970 | regulation of growth plate cartilage chondrocyte proliferation(GO:0003420) histone H3-R2 methylation(GO:0034970) |
| 0.3 | 1.0 | GO:2000740 | amniotic stem cell differentiation(GO:0097086) negative regulation of dense core granule biogenesis(GO:2000706) negative regulation of mesenchymal stem cell differentiation(GO:2000740) regulation of amniotic stem cell differentiation(GO:2000797) negative regulation of amniotic stem cell differentiation(GO:2000798) |
| 0.3 | 1.0 | GO:0046521 | sphingoid catabolic process(GO:0046521) |
| 0.3 | 0.9 | GO:1903526 | negative regulation of membrane tubulation(GO:1903526) |
| 0.3 | 1.8 | GO:0071494 | cellular response to UV-C(GO:0071494) |
| 0.3 | 1.2 | GO:0006238 | CMP salvage(GO:0006238) CMP biosynthetic process(GO:0009224) CMP metabolic process(GO:0046035) |
| 0.3 | 2.3 | GO:0090625 | mRNA cleavage involved in gene silencing by siRNA(GO:0090625) |
| 0.3 | 0.9 | GO:0010931 | macrophage tolerance induction(GO:0010931) regulation of macrophage tolerance induction(GO:0010932) positive regulation of macrophage tolerance induction(GO:0010933) |
| 0.3 | 1.7 | GO:0098838 | reduced folate transmembrane transport(GO:0098838) |
| 0.3 | 0.8 | GO:0035281 | pre-miRNA export from nucleus(GO:0035281) |
| 0.3 | 1.3 | GO:0009298 | GDP-mannose biosynthetic process(GO:0009298) |
| 0.3 | 1.0 | GO:0010260 | organ senescence(GO:0010260) |
| 0.3 | 0.8 | GO:0070078 | peptidyl-lysine hydroxylation to 5-hydroxy-L-lysine(GO:0018395) histone arginine demethylation(GO:0070077) histone H3-R2 demethylation(GO:0070078) histone H4-R3 demethylation(GO:0070079) |
| 0.3 | 0.8 | GO:0070662 | mast cell proliferation(GO:0070662) |
| 0.2 | 0.7 | GO:0045082 | interleukin-13 biosynthetic process(GO:0042231) positive regulation of interleukin-10 biosynthetic process(GO:0045082) |
| 0.2 | 0.9 | GO:0021571 | rhombomere 5 development(GO:0021571) central nervous system segmentation(GO:0035283) brain segmentation(GO:0035284) |
| 0.2 | 2.5 | GO:0031022 | nuclear migration along microfilament(GO:0031022) |
| 0.2 | 1.1 | GO:0072365 | regulation of cellular ketone metabolic process by negative regulation of transcription from RNA polymerase II promoter(GO:0072365) |
| 0.2 | 0.7 | GO:0046041 | ITP metabolic process(GO:0046041) |
| 0.2 | 0.6 | GO:0070105 | positive regulation of interleukin-6-mediated signaling pathway(GO:0070105) |
| 0.2 | 0.6 | GO:0060957 | endocardial cell fate commitment(GO:0060957) endocardial cushion cell fate commitment(GO:0061445) |
| 0.2 | 1.2 | GO:2000563 | positive regulation of CD4-positive, alpha-beta T cell proliferation(GO:2000563) |
| 0.2 | 0.8 | GO:1904381 | Golgi apparatus mannose trimming(GO:1904381) |
| 0.2 | 4.9 | GO:0034356 | NAD biosynthesis via nicotinamide riboside salvage pathway(GO:0034356) |
| 0.2 | 2.6 | GO:0035095 | behavioral response to nicotine(GO:0035095) |
| 0.2 | 1.1 | GO:0033387 | putrescine biosynthetic process from ornithine(GO:0033387) |
| 0.2 | 0.9 | GO:0032796 | uropod organization(GO:0032796) |
| 0.2 | 0.7 | GO:0002032 | desensitization of G-protein coupled receptor protein signaling pathway by arrestin(GO:0002032) |
| 0.2 | 1.2 | GO:0031291 | Ran protein signal transduction(GO:0031291) |
| 0.2 | 2.5 | GO:0010499 | proteasomal ubiquitin-independent protein catabolic process(GO:0010499) |
| 0.2 | 0.8 | GO:0090402 | oncogene-induced cell senescence(GO:0090402) |
| 0.2 | 0.5 | GO:0071626 | mastication(GO:0071626) learned vocalization behavior(GO:0098583) |
| 0.2 | 0.5 | GO:0006679 | glucosylceramide biosynthetic process(GO:0006679) |
| 0.2 | 1.3 | GO:0045007 | depurination(GO:0045007) |
| 0.2 | 1.1 | GO:0033152 | immunoglobulin V(D)J recombination(GO:0033152) |
| 0.2 | 0.5 | GO:1904844 | positive regulation of mRNA polyadenylation(GO:1900365) positive regulation of apoptotic DNA fragmentation(GO:1902512) response to L-glutamine(GO:1904844) cellular response to L-glutamine(GO:1904845) |
| 0.1 | 3.2 | GO:0006878 | cellular copper ion homeostasis(GO:0006878) |
| 0.1 | 1.0 | GO:0034959 | substance P catabolic process(GO:0010814) calcitonin catabolic process(GO:0010816) endothelin maturation(GO:0034959) |
| 0.1 | 0.9 | GO:1904217 | regulation of CDP-diacylglycerol-serine O-phosphatidyltransferase activity(GO:1904217) positive regulation of CDP-diacylglycerol-serine O-phosphatidyltransferase activity(GO:1904219) positive regulation of serine C-palmitoyltransferase activity(GO:1904222) |
| 0.1 | 0.4 | GO:0044349 | nucleotide-excision repair, DNA damage removal(GO:0000718) DNA excision(GO:0044349) DNA 3' dephosphorylation(GO:0098503) DNA 3' dephosphorylation involved in DNA repair(GO:0098504) polynucleotide 3' dephosphorylation(GO:0098506) |
| 0.1 | 1.0 | GO:2000819 | regulation of nucleotide-excision repair(GO:2000819) |
| 0.1 | 0.4 | GO:0070837 | dehydroascorbic acid transport(GO:0070837) |
| 0.1 | 0.4 | GO:0000294 | nuclear-transcribed mRNA catabolic process, endonucleolytic cleavage-dependent decay(GO:0000294) |
| 0.1 | 0.1 | GO:0071262 | regulation of eIF2 alpha phosphorylation by amino acid starvation(GO:0060733) regulation of translational initiation in response to starvation(GO:0071262) positive regulation of translational initiation in response to starvation(GO:0071264) |
| 0.1 | 0.5 | GO:0010956 | negative regulation of calcidiol 1-monooxygenase activity(GO:0010956) |
| 0.1 | 0.4 | GO:0097010 | eukaryotic translation initiation factor 4F complex assembly(GO:0097010) |
| 0.1 | 0.5 | GO:1902868 | regulation of transcription from RNA polymerase II promoter involved in forebrain neuron fate commitment(GO:0021882) cerebral cortex GABAergic interneuron fate commitment(GO:0021893) positive regulation of neural retina development(GO:0061075) positive regulation of retina development in camera-type eye(GO:1902868) positive regulation of amacrine cell differentiation(GO:1902871) |
| 0.1 | 1.2 | GO:0008626 | granzyme-mediated apoptotic signaling pathway(GO:0008626) |
| 0.1 | 1.0 | GO:0045759 | negative regulation of action potential(GO:0045759) |
| 0.1 | 3.2 | GO:0060019 | radial glial cell differentiation(GO:0060019) |
| 0.1 | 0.5 | GO:0018106 | peptidyl-histidine phosphorylation(GO:0018106) |
| 0.1 | 0.8 | GO:0015798 | myo-inositol transport(GO:0015798) |
| 0.1 | 0.4 | GO:1902594 | viral penetration into host nucleus(GO:0075732) multi-organism nuclear import(GO:1902594) |
| 0.1 | 0.2 | GO:2000182 | regulation of progesterone biosynthetic process(GO:2000182) |
| 0.1 | 0.9 | GO:0006741 | NADP biosynthetic process(GO:0006741) |
| 0.1 | 0.6 | GO:1902047 | polyamine transmembrane transport(GO:1902047) regulation of polyamine transmembrane transport(GO:1902267) negative regulation of polyamine transmembrane transport(GO:1902268) |
| 0.1 | 0.6 | GO:0030806 | negative regulation of cyclic nucleotide catabolic process(GO:0030806) negative regulation of cAMP catabolic process(GO:0030821) |
| 0.1 | 4.1 | GO:0035590 | purinergic nucleotide receptor signaling pathway(GO:0035590) |
| 0.1 | 0.6 | GO:0035407 | histone H3-T11 phosphorylation(GO:0035407) |
| 0.1 | 0.4 | GO:1903722 | regulation of centriole elongation(GO:1903722) |
| 0.1 | 0.5 | GO:0071894 | histone H2B conserved C-terminal lysine ubiquitination(GO:0071894) |
| 0.1 | 0.3 | GO:0035992 | tendon cell differentiation(GO:0035990) tendon formation(GO:0035992) |
| 0.1 | 0.6 | GO:0006177 | GMP biosynthetic process(GO:0006177) |
| 0.1 | 0.4 | GO:2000342 | negative regulation of chemokine (C-X-C motif) ligand 2 production(GO:2000342) |
| 0.1 | 2.9 | GO:0017121 | phospholipid scrambling(GO:0017121) |
| 0.1 | 0.6 | GO:1901097 | negative regulation of autophagosome maturation(GO:1901097) |
| 0.1 | 0.4 | GO:0003162 | atrioventricular node development(GO:0003162) cardiac septum cell differentiation(GO:0003292) atrioventricular node cell differentiation(GO:0060922) atrioventricular node cell development(GO:0060928) |
| 0.1 | 0.6 | GO:0097029 | mature conventional dendritic cell differentiation(GO:0097029) |
| 0.1 | 0.4 | GO:1904761 | negative regulation of myofibroblast differentiation(GO:1904761) |
| 0.1 | 0.8 | GO:0051343 | positive regulation of cyclic-nucleotide phosphodiesterase activity(GO:0051343) |
| 0.1 | 0.5 | GO:0018242 | protein O-linked glycosylation via serine(GO:0018242) |
| 0.1 | 1.8 | GO:0001574 | ganglioside biosynthetic process(GO:0001574) |
| 0.1 | 0.6 | GO:1990253 | cellular response to leucine starvation(GO:1990253) |
| 0.1 | 0.3 | GO:0003430 | growth plate cartilage chondrocyte growth(GO:0003430) |
| 0.1 | 1.2 | GO:0070862 | negative regulation of protein exit from endoplasmic reticulum(GO:0070862) negative regulation of retrograde protein transport, ER to cytosol(GO:1904153) |
| 0.1 | 0.8 | GO:0010793 | regulation of mRNA export from nucleus(GO:0010793) |
| 0.1 | 0.4 | GO:0036233 | glycine import(GO:0036233) |
| 0.1 | 0.6 | GO:0000430 | regulation of transcription from RNA polymerase II promoter by glucose(GO:0000430) positive regulation of transcription from RNA polymerase II promoter by glucose(GO:0000432) |
| 0.1 | 0.8 | GO:0070345 | negative regulation of fat cell proliferation(GO:0070345) |
| 0.1 | 0.5 | GO:0036493 | positive regulation of translation in response to endoplasmic reticulum stress(GO:0036493) |
| 0.1 | 1.7 | GO:0032836 | glomerular basement membrane development(GO:0032836) |
| 0.1 | 0.4 | GO:0000379 | tRNA-type intron splice site recognition and cleavage(GO:0000379) |
| 0.1 | 0.3 | GO:0046909 | intermembrane transport(GO:0046909) protein transport from ciliary membrane to plasma membrane(GO:1903445) |
| 0.1 | 0.2 | GO:0035565 | regulation of pronephros size(GO:0035565) |
| 0.1 | 0.5 | GO:0051534 | negative regulation of NFAT protein import into nucleus(GO:0051534) |
| 0.1 | 1.2 | GO:1901970 | positive regulation of mitotic metaphase/anaphase transition(GO:0045842) positive regulation of mitotic sister chromatid separation(GO:1901970) positive regulation of metaphase/anaphase transition of cell cycle(GO:1902101) |
| 0.1 | 0.4 | GO:0015770 | disaccharide transport(GO:0015766) sucrose transport(GO:0015770) oligosaccharide transport(GO:0015772) |
| 0.1 | 0.8 | GO:0033088 | negative regulation of immature T cell proliferation in thymus(GO:0033088) |
| 0.1 | 0.3 | GO:0072114 | pronephros morphogenesis(GO:0072114) |
| 0.1 | 0.4 | GO:0018076 | N-terminal peptidyl-lysine acetylation(GO:0018076) |
| 0.1 | 2.1 | GO:0048935 | peripheral nervous system neuron differentiation(GO:0048934) peripheral nervous system neuron development(GO:0048935) |
| 0.1 | 0.9 | GO:0046476 | galactosylceramide biosynthetic process(GO:0006682) galactolipid biosynthetic process(GO:0019375) glycosylceramide biosynthetic process(GO:0046476) |
| 0.1 | 0.6 | GO:0040031 | snRNA modification(GO:0040031) |
| 0.1 | 0.6 | GO:1901838 | positive regulation of transcription of nuclear large rRNA transcript from RNA polymerase I promoter(GO:1901838) |
| 0.1 | 0.9 | GO:0097011 | cellular response to granulocyte macrophage colony-stimulating factor stimulus(GO:0097011) response to granulocyte macrophage colony-stimulating factor(GO:0097012) |
| 0.1 | 1.5 | GO:0030812 | negative regulation of nucleotide catabolic process(GO:0030812) negative regulation of glycolytic process(GO:0045820) negative regulation of cofactor metabolic process(GO:0051195) negative regulation of coenzyme metabolic process(GO:0051198) |
| 0.1 | 0.2 | GO:0010735 | positive regulation of transcription via serum response element binding(GO:0010735) sulfur oxidation(GO:0019417) |
| 0.1 | 0.3 | GO:1904387 | cellular response to thyroxine stimulus(GO:0097069) cellular response to L-phenylalanine derivative(GO:1904387) |
| 0.1 | 0.6 | GO:2000048 | negative regulation of cell-cell adhesion mediated by cadherin(GO:2000048) |
| 0.1 | 1.2 | GO:0071285 | cellular response to lithium ion(GO:0071285) |
| 0.1 | 1.2 | GO:0036066 | protein O-linked fucosylation(GO:0036066) |
| 0.1 | 1.1 | GO:0071340 | skeletal muscle acetylcholine-gated channel clustering(GO:0071340) |
| 0.1 | 1.1 | GO:0034134 | toll-like receptor 2 signaling pathway(GO:0034134) |
| 0.1 | 0.6 | GO:1900748 | positive regulation of vascular endothelial growth factor signaling pathway(GO:1900748) |
| 0.1 | 0.3 | GO:0001777 | T cell homeostatic proliferation(GO:0001777) regulation of T cell homeostatic proliferation(GO:0046013) |
| 0.1 | 1.0 | GO:0035331 | negative regulation of hippo signaling(GO:0035331) |
| 0.1 | 0.6 | GO:0090116 | C-5 methylation of cytosine(GO:0090116) |
| 0.1 | 0.3 | GO:0071963 | establishment or maintenance of cell polarity regulating cell shape(GO:0071963) |
| 0.1 | 0.6 | GO:0040033 | miRNA mediated inhibition of translation(GO:0035278) negative regulation of translation, ncRNA-mediated(GO:0040033) regulation of translation, ncRNA-mediated(GO:0045974) |
| 0.1 | 0.6 | GO:0061737 | leukotriene signaling pathway(GO:0061737) |
| 0.1 | 0.2 | GO:0035359 | negative regulation of peroxisome proliferator activated receptor signaling pathway(GO:0035359) |
| 0.1 | 0.8 | GO:0000463 | maturation of LSU-rRNA from tricistronic rRNA transcript (SSU-rRNA, 5.8S rRNA, LSU-rRNA)(GO:0000463) |
| 0.1 | 0.7 | GO:0090219 | negative regulation of lipid kinase activity(GO:0090219) |
| 0.1 | 0.2 | GO:0071344 | diphosphate metabolic process(GO:0071344) |
| 0.1 | 0.4 | GO:0072752 | cellular response to rapamycin(GO:0072752) |
| 0.1 | 1.1 | GO:0046784 | viral mRNA export from host cell nucleus(GO:0046784) |
| 0.1 | 0.4 | GO:1903756 | regulation of transcription from RNA polymerase II promoter by histone modification(GO:1903756) negative regulation of transcription from RNA polymerase II promoter by histone modification(GO:1903758) |
| 0.1 | 0.7 | GO:0030643 | cellular phosphate ion homeostasis(GO:0030643) cellular trivalent inorganic anion homeostasis(GO:0072502) |
| 0.1 | 1.8 | GO:0043555 | regulation of translation in response to stress(GO:0043555) |
| 0.1 | 0.2 | GO:0070902 | mitochondrial tRNA pseudouridine synthesis(GO:0070902) |
| 0.1 | 0.3 | GO:0003199 | endocardial cushion to mesenchymal transition involved in heart valve formation(GO:0003199) |
| 0.1 | 1.6 | GO:0006895 | Golgi to endosome transport(GO:0006895) |
| 0.1 | 0.3 | GO:0097021 | lymphocyte migration into lymphoid organs(GO:0097021) |
| 0.1 | 0.9 | GO:0015886 | heme transport(GO:0015886) |
| 0.1 | 0.3 | GO:1902896 | terminal web assembly(GO:1902896) |
| 0.1 | 0.3 | GO:0021937 | cerebellar Purkinje cell-granule cell precursor cell signaling involved in regulation of granule cell precursor cell proliferation(GO:0021937) |
| 0.1 | 1.8 | GO:1904886 | beta-catenin destruction complex disassembly(GO:1904886) |
| 0.1 | 0.2 | GO:0060743 | epithelial cell maturation involved in prostate gland development(GO:0060743) |
| 0.1 | 0.4 | GO:1903300 | negative regulation of glucokinase activity(GO:0033132) negative regulation of hexokinase activity(GO:1903300) |
| 0.1 | 2.8 | GO:0035329 | hippo signaling(GO:0035329) |
| 0.0 | 0.8 | GO:0045792 | negative regulation of cell size(GO:0045792) |
| 0.0 | 0.2 | GO:1903862 | positive regulation of oxidative phosphorylation(GO:1903862) |
| 0.0 | 0.3 | GO:0006651 | diacylglycerol biosynthetic process(GO:0006651) |
| 0.0 | 0.5 | GO:0018401 | peptidyl-proline hydroxylation to 4-hydroxy-L-proline(GO:0018401) |
| 0.0 | 0.5 | GO:0007549 | dosage compensation(GO:0007549) dosage compensation by inactivation of X chromosome(GO:0009048) |
| 0.0 | 0.4 | GO:0033353 | S-adenosylmethionine cycle(GO:0033353) |
| 0.0 | 0.4 | GO:0010748 | regulation of plasma membrane long-chain fatty acid transport(GO:0010746) negative regulation of plasma membrane long-chain fatty acid transport(GO:0010748) |
| 0.0 | 0.7 | GO:1901299 | negative regulation of hydrogen peroxide-mediated programmed cell death(GO:1901299) |
| 0.0 | 1.3 | GO:1904714 | regulation of chaperone-mediated autophagy(GO:1904714) |
| 0.0 | 1.0 | GO:0075522 | IRES-dependent viral translational initiation(GO:0075522) |
| 0.0 | 0.5 | GO:0010993 | regulation of ubiquitin homeostasis(GO:0010993) free ubiquitin chain polymerization(GO:0010994) |
| 0.0 | 0.3 | GO:0071955 | recycling endosome to Golgi transport(GO:0071955) |
| 0.0 | 7.3 | GO:0006614 | SRP-dependent cotranslational protein targeting to membrane(GO:0006614) |
| 0.0 | 0.4 | GO:0006065 | UDP-glucuronate biosynthetic process(GO:0006065) |
| 0.0 | 0.6 | GO:0019885 | antigen processing and presentation of endogenous peptide antigen via MHC class I(GO:0019885) |
| 0.0 | 0.1 | GO:0002465 | peripheral T cell tolerance induction(GO:0002458) peripheral tolerance induction(GO:0002465) thymus epithelium morphogenesis(GO:0097536) regulation of thymocyte migration(GO:2000410) |
| 0.0 | 0.1 | GO:1990051 | activation of protein kinase C activity(GO:1990051) |
| 0.0 | 0.9 | GO:0030150 | protein import into mitochondrial matrix(GO:0030150) |
| 0.0 | 0.2 | GO:0035606 | peptidyl-cysteine S-trans-nitrosylation(GO:0035606) |
| 0.0 | 0.9 | GO:0043097 | pyrimidine-containing compound salvage(GO:0008655) pyrimidine nucleoside salvage(GO:0043097) |
| 0.0 | 0.7 | GO:0031584 | activation of phospholipase D activity(GO:0031584) |
| 0.0 | 0.5 | GO:1900246 | positive regulation of RIG-I signaling pathway(GO:1900246) |
| 0.0 | 0.2 | GO:0006169 | adenosine salvage(GO:0006169) dATP biosynthetic process(GO:0006175) |
| 0.0 | 0.5 | GO:0001561 | fatty acid alpha-oxidation(GO:0001561) |
| 0.0 | 0.6 | GO:0071550 | death-inducing signaling complex assembly(GO:0071550) |
| 0.0 | 1.1 | GO:0006098 | pentose-phosphate shunt(GO:0006098) |
| 0.0 | 1.2 | GO:0015671 | oxygen transport(GO:0015671) |
| 0.0 | 0.3 | GO:0042699 | follicle-stimulating hormone signaling pathway(GO:0042699) |
| 0.0 | 0.5 | GO:0048227 | plasma membrane to endosome transport(GO:0048227) |
| 0.0 | 0.1 | GO:0018963 | phthalate metabolic process(GO:0018963) |
| 0.0 | 0.4 | GO:0031274 | positive regulation of pseudopodium assembly(GO:0031274) |
| 0.0 | 0.5 | GO:2000774 | positive regulation of cellular senescence(GO:2000774) |
| 0.0 | 0.6 | GO:0038129 | directional guidance of interneurons involved in migration from the subpallium to the cortex(GO:0021840) chemorepulsion involved in interneuron migration from the subpallium to the cortex(GO:0021842) ERBB3 signaling pathway(GO:0038129) |
| 0.0 | 0.2 | GO:0046963 | 3'-phosphoadenosine 5'-phosphosulfate transport(GO:0046963) 3'-phospho-5'-adenylyl sulfate transmembrane transport(GO:1902559) |
| 0.0 | 1.1 | GO:0002115 | store-operated calcium entry(GO:0002115) |
| 0.0 | 1.4 | GO:0032986 | nucleosome disassembly(GO:0006337) protein-DNA complex disassembly(GO:0032986) |
| 0.0 | 0.4 | GO:1905068 | positive regulation of ephrin receptor signaling pathway(GO:1901189) positive regulation of canonical Wnt signaling pathway involved in cardiac muscle cell fate commitment(GO:1901297) positive regulation of canonical Wnt signaling pathway involved in heart development(GO:1905068) |
| 0.0 | 0.5 | GO:0036444 | calcium ion transmembrane import into mitochondrion(GO:0036444) |
| 0.0 | 0.1 | GO:0090238 | positive regulation of arachidonic acid secretion(GO:0090238) |
| 0.0 | 0.2 | GO:0006642 | triglyceride mobilization(GO:0006642) |
| 0.0 | 0.2 | GO:2000661 | positive regulation of interleukin-1-mediated signaling pathway(GO:2000661) |
| 0.0 | 0.5 | GO:0035826 | rubidium ion transport(GO:0035826) regulation of rubidium ion transport(GO:2000680) |
| 0.0 | 1.0 | GO:0035162 | embryonic hemopoiesis(GO:0035162) |
| 0.0 | 0.3 | GO:0000244 | spliceosomal tri-snRNP complex assembly(GO:0000244) |
| 0.0 | 0.3 | GO:0045950 | negative regulation of mitotic recombination(GO:0045950) |
| 0.0 | 0.4 | GO:0035965 | cardiolipin acyl-chain remodeling(GO:0035965) |
| 0.0 | 0.2 | GO:0042796 | snRNA transcription from RNA polymerase III promoter(GO:0042796) |
| 0.0 | 0.0 | GO:1902824 | positive regulation of late endosome to lysosome transport(GO:1902824) |
| 0.0 | 0.4 | GO:0006689 | ganglioside catabolic process(GO:0006689) |
| 0.0 | 0.4 | GO:0043923 | positive regulation by host of viral transcription(GO:0043923) |
| 0.0 | 0.3 | GO:1902416 | positive regulation of mRNA binding(GO:1902416) |
| 0.0 | 0.2 | GO:1903251 | multi-ciliated epithelial cell differentiation(GO:1903251) |
| 0.0 | 3.3 | GO:0006369 | termination of RNA polymerase II transcription(GO:0006369) |
| 0.0 | 0.1 | GO:0003290 | septum secundum development(GO:0003285) atrial septum secundum morphogenesis(GO:0003290) |
| 0.0 | 0.4 | GO:0006384 | transcription initiation from RNA polymerase III promoter(GO:0006384) |
| 0.0 | 0.3 | GO:0048386 | positive regulation of retinoic acid receptor signaling pathway(GO:0048386) |
| 0.0 | 0.4 | GO:1901552 | positive regulation of endothelial cell development(GO:1901552) positive regulation of establishment of endothelial barrier(GO:1903142) |
| 0.0 | 0.2 | GO:0048537 | mucosal-associated lymphoid tissue development(GO:0048537) Peyer's patch development(GO:0048541) |
| 0.0 | 0.3 | GO:0019064 | fusion of virus membrane with host plasma membrane(GO:0019064) membrane fusion involved in viral entry into host cell(GO:0039663) multi-organism membrane fusion(GO:0044800) |
| 0.0 | 0.4 | GO:0000012 | single strand break repair(GO:0000012) |
| 0.0 | 0.2 | GO:0010815 | bradykinin catabolic process(GO:0010815) |
| 0.0 | 1.5 | GO:1900739 | regulation of protein insertion into mitochondrial membrane involved in apoptotic signaling pathway(GO:1900739) positive regulation of protein insertion into mitochondrial membrane involved in apoptotic signaling pathway(GO:1900740) |
| 0.0 | 0.4 | GO:0090037 | positive regulation of protein kinase C signaling(GO:0090037) |
| 0.0 | 0.1 | GO:0021526 | medial motor column neuron differentiation(GO:0021526) |
| 0.0 | 0.3 | GO:2000049 | positive regulation of cell-cell adhesion mediated by cadherin(GO:2000049) |
| 0.0 | 0.4 | GO:0035414 | negative regulation of catenin import into nucleus(GO:0035414) |
| 0.0 | 0.2 | GO:2000825 | positive regulation of androgen receptor activity(GO:2000825) |
| 0.0 | 2.6 | GO:0034644 | cellular response to UV(GO:0034644) |
| 0.0 | 1.7 | GO:0042149 | cellular response to glucose starvation(GO:0042149) |
| 0.0 | 0.5 | GO:0090073 | positive regulation of protein homodimerization activity(GO:0090073) |
| 0.0 | 0.4 | GO:0034378 | chylomicron assembly(GO:0034378) |
| 0.0 | 0.3 | GO:0035457 | cellular response to interferon-alpha(GO:0035457) |
| 0.0 | 0.5 | GO:0043983 | histone H4-K12 acetylation(GO:0043983) |
| 0.0 | 0.4 | GO:0006477 | protein sulfation(GO:0006477) heparan sulfate proteoglycan biosynthetic process, polysaccharide chain biosynthetic process(GO:0015014) |
| 0.0 | 1.2 | GO:0050434 | positive regulation of viral transcription(GO:0050434) |
| 0.0 | 0.5 | GO:1903818 | positive regulation of voltage-gated potassium channel activity(GO:1903818) |
| 0.0 | 0.1 | GO:0032474 | otolith morphogenesis(GO:0032474) |
| 0.0 | 5.8 | GO:0043484 | regulation of RNA splicing(GO:0043484) |
| 0.0 | 0.2 | GO:1902174 | positive regulation of keratinocyte apoptotic process(GO:1902174) positive regulation of intrinsic apoptotic signaling pathway in response to DNA damage(GO:1902231) |
| 0.0 | 0.8 | GO:0007216 | G-protein coupled glutamate receptor signaling pathway(GO:0007216) |
| 0.0 | 0.4 | GO:0000338 | protein deneddylation(GO:0000338) |
| 0.0 | 1.0 | GO:0001504 | neurotransmitter uptake(GO:0001504) |
| 0.0 | 0.2 | GO:1903433 | regulation of constitutive secretory pathway(GO:1903433) |
| 0.0 | 0.3 | GO:1903748 | negative regulation of establishment of protein localization to mitochondrion(GO:1903748) |
| 0.0 | 0.3 | GO:0060340 | positive regulation of type I interferon-mediated signaling pathway(GO:0060340) |
| 0.0 | 0.8 | GO:0030970 | retrograde protein transport, ER to cytosol(GO:0030970) |
| 0.0 | 0.1 | GO:0019242 | methylglyoxal biosynthetic process(GO:0019242) |
| 0.0 | 0.1 | GO:0061086 | negative regulation of histone H3-K27 methylation(GO:0061086) |
| 0.0 | 0.6 | GO:0035455 | response to interferon-alpha(GO:0035455) |
| 0.0 | 0.8 | GO:0038092 | nodal signaling pathway(GO:0038092) |
| 0.0 | 0.3 | GO:0000028 | ribosomal small subunit assembly(GO:0000028) |
| 0.0 | 0.4 | GO:0021853 | cerebral cortex GABAergic interneuron migration(GO:0021853) interneuron migration(GO:1904936) |
| 0.0 | 0.8 | GO:0071880 | adenylate cyclase-activating adrenergic receptor signaling pathway(GO:0071880) |
| 0.0 | 1.3 | GO:0070979 | protein K11-linked ubiquitination(GO:0070979) |
| 0.0 | 0.4 | GO:0046085 | adenosine metabolic process(GO:0046085) |
| 0.0 | 2.4 | GO:0045454 | cell redox homeostasis(GO:0045454) |
| 0.0 | 0.8 | GO:0007263 | nitric oxide mediated signal transduction(GO:0007263) |
| 0.0 | 1.1 | GO:0006198 | cAMP catabolic process(GO:0006198) |
| 0.0 | 0.4 | GO:0070493 | thrombin receptor signaling pathway(GO:0070493) |
| 0.0 | 0.6 | GO:0050860 | negative regulation of T cell receptor signaling pathway(GO:0050860) |
| 0.0 | 0.3 | GO:1904352 | positive regulation of protein catabolic process in the vacuole(GO:1904352) |
| 0.0 | 0.5 | GO:0016075 | rRNA catabolic process(GO:0016075) |
| 0.0 | 0.4 | GO:0035269 | protein O-linked mannosylation(GO:0035269) |
| 0.0 | 0.2 | GO:0035726 | common myeloid progenitor cell proliferation(GO:0035726) |
| 0.0 | 1.2 | GO:0060314 | regulation of ryanodine-sensitive calcium-release channel activity(GO:0060314) |
| 0.0 | 0.2 | GO:0030241 | skeletal muscle myosin thick filament assembly(GO:0030241) |
| 0.0 | 0.4 | GO:2001224 | positive regulation of neuron migration(GO:2001224) |
| 0.0 | 0.3 | GO:0071985 | multivesicular body sorting pathway(GO:0071985) |
| 0.0 | 0.3 | GO:0060992 | response to fungicide(GO:0060992) |
| 0.0 | 0.9 | GO:0007176 | regulation of epidermal growth factor-activated receptor activity(GO:0007176) |
| 0.0 | 1.2 | GO:0042059 | negative regulation of epidermal growth factor receptor signaling pathway(GO:0042059) |
| 0.0 | 0.2 | GO:0001682 | tRNA 5'-leader removal(GO:0001682) |
| 0.0 | 0.2 | GO:0015866 | ADP transport(GO:0015866) |
| 0.0 | 0.0 | GO:0090526 | regulation of gluconeogenesis involved in cellular glucose homeostasis(GO:0090526) |
| 0.0 | 0.2 | GO:0006686 | sphingomyelin biosynthetic process(GO:0006686) |
| 0.0 | 0.3 | GO:0030050 | vesicle transport along actin filament(GO:0030050) |
| 0.0 | 1.5 | GO:0043268 | positive regulation of potassium ion transport(GO:0043268) |
| 0.0 | 0.2 | GO:0052204 | modulation of molecular function in other organism(GO:0044359) negative regulation of molecular function in other organism(GO:0044362) negative regulation of molecular function in other organism involved in symbiotic interaction(GO:0052204) modulation of molecular function in other organism involved in symbiotic interaction(GO:0052205) negative regulation by host of symbiont molecular function(GO:0052405) modification by host of symbiont molecular function(GO:0052428) |
| 0.0 | 0.2 | GO:0019262 | N-acetylneuraminate catabolic process(GO:0019262) |
| 0.0 | 0.2 | GO:0014807 | regulation of somitogenesis(GO:0014807) |
| 0.0 | 0.3 | GO:0002934 | desmosome organization(GO:0002934) |
| 0.0 | 0.1 | GO:0007440 | foregut morphogenesis(GO:0007440) |
| 0.0 | 1.1 | GO:0008333 | endosome to lysosome transport(GO:0008333) |
| 0.0 | 0.1 | GO:1904751 | positive regulation of protein localization to nucleolus(GO:1904751) |
| 0.0 | 0.1 | GO:0061087 | regulation of histone H3-K27 methylation(GO:0061085) positive regulation of histone H3-K27 methylation(GO:0061087) |
| 0.0 | 0.4 | GO:0050961 | detection of temperature stimulus involved in sensory perception(GO:0050961) detection of temperature stimulus involved in sensory perception of pain(GO:0050965) |
| 0.0 | 0.4 | GO:0097094 | craniofacial suture morphogenesis(GO:0097094) |
| 0.0 | 0.1 | GO:0044210 | 'de novo' CTP biosynthetic process(GO:0044210) |
| 0.0 | 0.1 | GO:0060754 | positive regulation of mast cell chemotaxis(GO:0060754) |
| 0.0 | 1.0 | GO:0050690 | regulation of defense response to virus by virus(GO:0050690) |
| 0.0 | 0.2 | GO:0032786 | positive regulation of DNA-templated transcription, elongation(GO:0032786) |
| 0.0 | 0.2 | GO:0072553 | terminal button organization(GO:0072553) |
| 0.0 | 0.1 | GO:0010269 | response to selenium ion(GO:0010269) |
| 0.0 | 0.1 | GO:1900039 | positive regulation of cellular response to hypoxia(GO:1900039) |
| 0.0 | 0.4 | GO:0097264 | self proteolysis(GO:0097264) |
| 0.0 | 0.7 | GO:0072337 | modified amino acid transport(GO:0072337) |
| 0.0 | 0.4 | GO:0006346 | methylation-dependent chromatin silencing(GO:0006346) |
| 0.0 | 0.5 | GO:0099514 | anterograde synaptic vesicle transport(GO:0048490) synaptic vesicle cytoskeletal transport(GO:0099514) synaptic vesicle transport along microtubule(GO:0099517) |
| 0.0 | 0.1 | GO:0048312 | intracellular distribution of mitochondria(GO:0048312) |
| 0.0 | 0.5 | GO:0006744 | ubiquinone biosynthetic process(GO:0006744) quinone biosynthetic process(GO:1901663) |
| 0.0 | 0.1 | GO:1900113 | negative regulation of histone H3-K9 trimethylation(GO:1900113) |
| 0.0 | 0.3 | GO:0006851 | mitochondrial calcium ion transport(GO:0006851) |
| 0.0 | 0.1 | GO:0007000 | nucleolus organization(GO:0007000) |
| 0.0 | 0.2 | GO:0006335 | DNA replication-dependent nucleosome assembly(GO:0006335) DNA replication-dependent nucleosome organization(GO:0034723) |
| 0.0 | 0.1 | GO:0034499 | late endosome to Golgi transport(GO:0034499) |
| 0.0 | 0.3 | GO:0034501 | protein localization to kinetochore(GO:0034501) |
| 0.0 | 0.2 | GO:0098703 | calcium ion import across plasma membrane(GO:0098703) calcium ion import into cell(GO:1990035) |
| 0.0 | 0.0 | GO:0061181 | regulation of chondrocyte development(GO:0061181) negative regulation of chondrocyte development(GO:0061182) |
| 0.0 | 0.1 | GO:1904450 | negative regulation of gamma-aminobutyric acid secretion(GO:0014053) negative regulation of dopamine secretion(GO:0033602) aspartate secretion(GO:0061528) positive regulation of prolactin secretion(GO:1902722) regulation of aspartate secretion(GO:1904448) positive regulation of aspartate secretion(GO:1904450) |
| 0.0 | 0.2 | GO:0000470 | maturation of LSU-rRNA(GO:0000470) |
| 0.0 | 0.7 | GO:0021772 | olfactory bulb development(GO:0021772) |
| 0.0 | 0.2 | GO:0002315 | marginal zone B cell differentiation(GO:0002315) |
| 0.0 | 0.6 | GO:0042347 | negative regulation of NF-kappaB import into nucleus(GO:0042347) |
| 0.0 | 0.4 | GO:0031581 | hemidesmosome assembly(GO:0031581) |
| 0.0 | 1.0 | GO:0031100 | organ regeneration(GO:0031100) |
| 0.0 | 0.1 | GO:0006668 | sphinganine-1-phosphate metabolic process(GO:0006668) |
| 0.0 | 0.4 | GO:0010172 | embryonic body morphogenesis(GO:0010172) |
| 0.0 | 0.2 | GO:0001833 | inner cell mass cell proliferation(GO:0001833) |
| 0.0 | 0.1 | GO:0032815 | negative regulation of natural killer cell activation(GO:0032815) |
| 0.0 | 2.1 | GO:0006414 | translational elongation(GO:0006414) |
| 0.0 | 0.1 | GO:1902866 | regulation of neural retina development(GO:0061074) regulation of retina development in camera-type eye(GO:1902866) |
| 0.0 | 0.2 | GO:0098877 | neurotransmitter receptor transport to plasma membrane(GO:0098877) neurotransmitter receptor transport to postsynaptic membrane(GO:0098969) protein localization to postsynaptic membrane(GO:1903539) establishment of protein localization to postsynaptic membrane(GO:1903540) |
| 0.0 | 0.4 | GO:0007020 | microtubule nucleation(GO:0007020) |
| 0.0 | 0.9 | GO:0001706 | endoderm formation(GO:0001706) |
| 0.0 | 0.2 | GO:0035635 | entry of bacterium into host cell(GO:0035635) |
| 0.0 | 0.1 | GO:0035745 | T-helper 2 cell cytokine production(GO:0035745) |
| 0.0 | 0.4 | GO:0015695 | organic cation transport(GO:0015695) |
| 0.0 | 0.8 | GO:0018279 | protein N-linked glycosylation via asparagine(GO:0018279) |
| 0.0 | 0.1 | GO:1990403 | embryonic brain development(GO:1990403) |
| 0.0 | 0.2 | GO:0001765 | membrane raft assembly(GO:0001765) |
Gene overrepresentation in cellular component category:
| Log-likelihood per target | Total log-likelihood | Term | Description |
|---|---|---|---|
| 0.3 | 0.8 | GO:0042565 | RNA nuclear export complex(GO:0042565) |
| 0.3 | 3.5 | GO:0005853 | eukaryotic translation elongation factor 1 complex(GO:0005853) |
| 0.2 | 7.4 | GO:0005639 | integral component of nuclear inner membrane(GO:0005639) intrinsic component of nuclear inner membrane(GO:0031229) |
| 0.2 | 0.8 | GO:0045323 | interleukin-1 receptor complex(GO:0045323) |
| 0.2 | 0.9 | GO:0001405 | presequence translocase-associated import motor(GO:0001405) |
| 0.2 | 2.1 | GO:0000808 | origin recognition complex(GO:0000808) nuclear origin of replication recognition complex(GO:0005664) |
| 0.2 | 0.8 | GO:0000839 | Hrd1p ubiquitin ligase ERAD-L complex(GO:0000839) |
| 0.2 | 2.3 | GO:0035068 | micro-ribonucleoprotein complex(GO:0035068) |
| 0.2 | 0.5 | GO:0000805 | X chromosome(GO:0000805) |
| 0.2 | 1.2 | GO:0045298 | tubulin complex(GO:0045298) |
| 0.1 | 1.0 | GO:0031302 | intrinsic component of endosome membrane(GO:0031302) |
| 0.1 | 0.4 | GO:0005600 | collagen type XIII trimer(GO:0005600) transmembrane collagen trimer(GO:0030936) |
| 0.1 | 1.7 | GO:0002193 | MAML1-RBP-Jkappa- ICN1 complex(GO:0002193) |
| 0.1 | 1.0 | GO:0070435 | Shc-EGFR complex(GO:0070435) |
| 0.1 | 0.9 | GO:0097513 | myosin II filament(GO:0097513) |
| 0.1 | 0.8 | GO:0034666 | integrin alpha2-beta1 complex(GO:0034666) |
| 0.1 | 1.7 | GO:0005587 | collagen type IV trimer(GO:0005587) |
| 0.1 | 0.8 | GO:0097165 | nuclear stress granule(GO:0097165) |
| 0.1 | 0.6 | GO:0045160 | myosin I complex(GO:0045160) |
| 0.1 | 0.5 | GO:0071001 | U4/U6 snRNP(GO:0071001) |
| 0.1 | 0.7 | GO:0032807 | DNA ligase IV complex(GO:0032807) |
| 0.1 | 0.8 | GO:0070545 | PeBoW complex(GO:0070545) |
| 0.1 | 0.6 | GO:0048179 | activin receptor complex(GO:0048179) |
| 0.1 | 0.7 | GO:0000788 | nuclear nucleosome(GO:0000788) |
| 0.1 | 0.8 | GO:0035985 | senescence-associated heterochromatin focus(GO:0035985) |
| 0.1 | 2.6 | GO:0005892 | acetylcholine-gated channel complex(GO:0005892) |
| 0.1 | 0.8 | GO:1990630 | IRE1-RACK1-PP2A complex(GO:1990630) |
| 0.1 | 1.7 | GO:0001741 | XY body(GO:0001741) |
| 0.1 | 1.0 | GO:0005785 | signal recognition particle receptor complex(GO:0005785) |
| 0.1 | 1.2 | GO:0005833 | hemoglobin complex(GO:0005833) |
| 0.1 | 0.3 | GO:0017109 | glutamate-cysteine ligase complex(GO:0017109) |
| 0.1 | 0.3 | GO:0098592 | cytoplasmic side of apical plasma membrane(GO:0098592) |
| 0.1 | 0.4 | GO:0000214 | tRNA-intron endonuclease complex(GO:0000214) |
| 0.1 | 0.4 | GO:0016035 | zeta DNA polymerase complex(GO:0016035) |
| 0.1 | 0.3 | GO:0000818 | nuclear MIS12/MIND complex(GO:0000818) |
| 0.1 | 0.2 | GO:0035517 | PR-DUB complex(GO:0035517) |
| 0.1 | 1.2 | GO:0005641 | nuclear envelope lumen(GO:0005641) |
| 0.1 | 0.8 | GO:0016442 | RISC complex(GO:0016442) RNAi effector complex(GO:0031332) |
| 0.1 | 0.4 | GO:0032311 | angiogenin-PRI complex(GO:0032311) |
| 0.1 | 0.7 | GO:0031464 | Cul4A-RING E3 ubiquitin ligase complex(GO:0031464) |
| 0.1 | 0.4 | GO:0036020 | endolysosome membrane(GO:0036020) |
| 0.1 | 6.1 | GO:0022625 | cytosolic large ribosomal subunit(GO:0022625) |
| 0.1 | 1.7 | GO:0030131 | clathrin adaptor complex(GO:0030131) |
| 0.1 | 0.2 | GO:0000811 | GINS complex(GO:0000811) |
| 0.1 | 0.2 | GO:0033186 | CAF-1 complex(GO:0033186) |
| 0.1 | 1.1 | GO:0005847 | mRNA cleavage and polyadenylation specificity factor complex(GO:0005847) |
| 0.1 | 0.4 | GO:0044530 | supraspliceosomal complex(GO:0044530) |
| 0.1 | 0.2 | GO:0005745 | m-AAA complex(GO:0005745) |
| 0.1 | 0.6 | GO:0098559 | cytoplasmic side of early endosome membrane(GO:0098559) cytoplasmic side of late endosome membrane(GO:0098560) |
| 0.0 | 0.2 | GO:0071008 | U2-type post-mRNA release spliceosomal complex(GO:0071008) |
| 0.0 | 0.3 | GO:0000120 | RNA polymerase I transcription factor complex(GO:0000120) |
| 0.0 | 0.2 | GO:0035363 | histone locus body(GO:0035363) |
| 0.0 | 1.0 | GO:0005736 | DNA-directed RNA polymerase I complex(GO:0005736) |
| 0.0 | 1.6 | GO:0005680 | anaphase-promoting complex(GO:0005680) |
| 0.0 | 1.3 | GO:0031095 | platelet dense tubular network membrane(GO:0031095) |
| 0.0 | 1.1 | GO:0000346 | transcription export complex(GO:0000346) |
| 0.0 | 0.2 | GO:0097362 | MCM8-MCM9 complex(GO:0097362) |
| 0.0 | 0.5 | GO:0097487 | multivesicular body, internal vesicle(GO:0097487) |
| 0.0 | 0.4 | GO:0019774 | proteasome core complex, beta-subunit complex(GO:0019774) |
| 0.0 | 0.2 | GO:0000172 | ribonuclease MRP complex(GO:0000172) |
| 0.0 | 0.3 | GO:0089701 | U2AF(GO:0089701) |
| 0.0 | 0.5 | GO:0033256 | I-kappaB/NF-kappaB complex(GO:0033256) |
| 0.0 | 0.3 | GO:1990111 | spermatoproteasome complex(GO:1990111) |
| 0.0 | 1.7 | GO:0071782 | endoplasmic reticulum tubular network(GO:0071782) |
| 0.0 | 0.8 | GO:0016281 | eukaryotic translation initiation factor 4F complex(GO:0016281) |
| 0.0 | 0.3 | GO:1990745 | EARP complex(GO:1990745) |
| 0.0 | 0.4 | GO:0061689 | tricellular tight junction(GO:0061689) |
| 0.0 | 0.2 | GO:0005658 | alpha DNA polymerase:primase complex(GO:0005658) |
| 0.0 | 0.7 | GO:0035102 | PRC1 complex(GO:0035102) |
| 0.0 | 0.2 | GO:0000138 | Golgi trans cisterna(GO:0000138) |
| 0.0 | 0.2 | GO:0032021 | NELF complex(GO:0032021) |
| 0.0 | 1.1 | GO:0005763 | organellar small ribosomal subunit(GO:0000314) mitochondrial small ribosomal subunit(GO:0005763) |
| 0.0 | 4.5 | GO:0005905 | clathrin-coated pit(GO:0005905) |
| 0.0 | 4.8 | GO:0017053 | transcriptional repressor complex(GO:0017053) |
| 0.0 | 0.2 | GO:0033263 | CORVET complex(GO:0033263) |
| 0.0 | 0.2 | GO:0033565 | ESCRT-0 complex(GO:0033565) |
| 0.0 | 0.3 | GO:0098554 | cytoplasmic side of endoplasmic reticulum membrane(GO:0098554) |
| 0.0 | 0.6 | GO:0031588 | nucleotide-activated protein kinase complex(GO:0031588) |
| 0.0 | 2.7 | GO:0031463 | Cul3-RING ubiquitin ligase complex(GO:0031463) |
| 0.0 | 0.4 | GO:0005845 | mRNA cap binding complex(GO:0005845) |
| 0.0 | 0.7 | GO:0005852 | eukaryotic translation initiation factor 3 complex(GO:0005852) |
| 0.0 | 0.2 | GO:0000125 | PCAF complex(GO:0000125) |
| 0.0 | 0.4 | GO:0031931 | TORC1 complex(GO:0031931) |
| 0.0 | 0.2 | GO:0097452 | GAIT complex(GO:0097452) |
| 0.0 | 1.3 | GO:0022627 | cytosolic small ribosomal subunit(GO:0022627) |
| 0.0 | 2.7 | GO:0101003 | ficolin-1-rich granule membrane(GO:0101003) |
| 0.0 | 0.5 | GO:0031265 | CD95 death-inducing signaling complex(GO:0031265) |
| 0.0 | 0.4 | GO:0000815 | ESCRT III complex(GO:0000815) |
| 0.0 | 0.1 | GO:0032777 | Piccolo NuA4 histone acetyltransferase complex(GO:0032777) |
| 0.0 | 0.3 | GO:0005869 | dynactin complex(GO:0005869) |
| 0.0 | 1.4 | GO:0042645 | nucleoid(GO:0009295) mitochondrial nucleoid(GO:0042645) |
| 0.0 | 1.5 | GO:0010494 | cytoplasmic stress granule(GO:0010494) |
| 0.0 | 3.1 | GO:0035578 | azurophil granule lumen(GO:0035578) |
| 0.0 | 0.1 | GO:0032280 | symmetric synapse(GO:0032280) |
| 0.0 | 0.3 | GO:1990909 | Wnt signalosome(GO:1990909) |
| 0.0 | 0.2 | GO:0005849 | mRNA cleavage factor complex(GO:0005849) |
| 0.0 | 0.2 | GO:0008024 | cyclin/CDK positive transcription elongation factor complex(GO:0008024) |
| 0.0 | 1.0 | GO:0090665 | dystrophin-associated glycoprotein complex(GO:0016010) glycoprotein complex(GO:0090665) |
| 0.0 | 1.3 | GO:0005844 | polysome(GO:0005844) |
| 0.0 | 0.3 | GO:0043240 | Fanconi anaemia nuclear complex(GO:0043240) |
| 0.0 | 0.1 | GO:0032806 | carboxy-terminal domain protein kinase complex(GO:0032806) |
| 0.0 | 1.4 | GO:0015030 | Cajal body(GO:0015030) |
| 0.0 | 0.6 | GO:0031143 | pseudopodium(GO:0031143) |
| 0.0 | 0.4 | GO:0046540 | U4/U6 x U5 tri-snRNP complex(GO:0046540) |
| 0.0 | 1.7 | GO:0031526 | brush border membrane(GO:0031526) |
| 0.0 | 2.4 | GO:0060170 | ciliary membrane(GO:0060170) |
| 0.0 | 0.3 | GO:0008250 | oligosaccharyltransferase complex(GO:0008250) |
| 0.0 | 1.8 | GO:0005811 | lipid particle(GO:0005811) |
| 0.0 | 0.3 | GO:0036038 | MKS complex(GO:0036038) |
| 0.0 | 9.4 | GO:0005667 | transcription factor complex(GO:0005667) |
| 0.0 | 1.4 | GO:0005903 | brush border(GO:0005903) |
| 0.0 | 0.5 | GO:0031083 | BLOC-1 complex(GO:0031083) |
| 0.0 | 0.1 | GO:0030891 | VCB complex(GO:0030891) |
| 0.0 | 0.2 | GO:0051286 | cell tip(GO:0051286) |
| 0.0 | 0.1 | GO:0032144 | 4-aminobutyrate transaminase complex(GO:0032144) |
| 0.0 | 0.6 | GO:0016592 | mediator complex(GO:0016592) |
| 0.0 | 0.4 | GO:0016327 | apicolateral plasma membrane(GO:0016327) |
| 0.0 | 1.0 | GO:0035580 | specific granule lumen(GO:0035580) |
| 0.0 | 0.2 | GO:0070776 | H3 histone acetyltransferase complex(GO:0070775) MOZ/MORF histone acetyltransferase complex(GO:0070776) |
Gene overrepresentation in molecular function category:
| Log-likelihood per target | Total log-likelihood | Term | Description |
|---|---|---|---|
| 0.9 | 4.5 | GO:0047280 | nicotinamide phosphoribosyltransferase activity(GO:0047280) |
| 0.8 | 2.3 | GO:0008859 | exoribonuclease II activity(GO:0008859) |
| 0.5 | 1.6 | GO:0004574 | oligo-1,6-glucosidase activity(GO:0004574) |
| 0.4 | 1.8 | GO:0047291 | neolactotetraosylceramide alpha-2,3-sialyltransferase activity(GO:0004513) lactosylceramide alpha-2,3-sialyltransferase activity(GO:0047291) |
| 0.4 | 3.9 | GO:0043426 | MRF binding(GO:0043426) |
| 0.4 | 2.0 | GO:0098808 | mRNA cap binding(GO:0098808) |
| 0.4 | 4.6 | GO:0004931 | extracellular ATP-gated cation channel activity(GO:0004931) ATP-gated ion channel activity(GO:0035381) |
| 0.3 | 1.0 | GO:0031752 | D5 dopamine receptor binding(GO:0031752) |
| 0.3 | 1.3 | GO:0032408 | MutLbeta complex binding(GO:0032406) MutSbeta complex binding(GO:0032408) |
| 0.3 | 1.0 | GO:0009032 | thymidine phosphorylase activity(GO:0009032) pyrimidine-nucleoside phosphorylase activity(GO:0016154) |
| 0.3 | 0.9 | GO:0008330 | protein tyrosine/threonine phosphatase activity(GO:0008330) |
| 0.3 | 2.3 | GO:0004645 | phosphorylase activity(GO:0004645) |
| 0.3 | 1.1 | GO:0017057 | glucose-6-phosphate dehydrogenase activity(GO:0004345) 6-phosphogluconolactonase activity(GO:0017057) |
| 0.3 | 1.7 | GO:0008518 | reduced folate carrier activity(GO:0008518) |
| 0.3 | 0.8 | GO:0090631 | pre-miRNA transporter activity(GO:0090631) |
| 0.3 | 0.8 | GO:0033749 | histone demethylase activity (H3-R2 specific)(GO:0033746) histone demethylase activity (H4-R3 specific)(GO:0033749) |
| 0.2 | 1.2 | GO:0005010 | insulin-like growth factor-activated receptor activity(GO:0005010) |
| 0.2 | 0.6 | GO:0004615 | phosphomannomutase activity(GO:0004615) |
| 0.2 | 1.0 | GO:0031691 | alpha-1A adrenergic receptor binding(GO:0031691) follicle-stimulating hormone receptor binding(GO:0031762) |
| 0.2 | 0.9 | GO:0004905 | type I interferon receptor activity(GO:0004905) |
| 0.2 | 0.3 | GO:0002060 | purine nucleobase binding(GO:0002060) |
| 0.2 | 0.8 | GO:0043183 | vascular endothelial growth factor receptor 1 binding(GO:0043183) |
| 0.2 | 0.5 | GO:0047322 | [hydroxymethylglutaryl-CoA reductase (NADPH)] kinase activity(GO:0047322) [acetyl-CoA carboxylase] kinase activity(GO:0050405) |
| 0.2 | 1.1 | GO:0070644 | vitamin D response element binding(GO:0070644) |
| 0.2 | 0.6 | GO:0005151 | interleukin-1, Type II receptor binding(GO:0005151) |
| 0.2 | 0.8 | GO:0051734 | ATP-dependent polydeoxyribonucleotide 5'-hydroxyl-kinase activity(GO:0046404) polydeoxyribonucleotide kinase activity(GO:0051733) ATP-dependent polynucleotide kinase activity(GO:0051734) |
| 0.2 | 0.9 | GO:0031749 | D2 dopamine receptor binding(GO:0031749) |
| 0.1 | 0.4 | GO:0008193 | tRNA guanylyltransferase activity(GO:0008193) |
| 0.1 | 4.4 | GO:0043495 | protein anchor(GO:0043495) |
| 0.1 | 0.6 | GO:0001632 | leukotriene B4 receptor activity(GO:0001632) |
| 0.1 | 0.4 | GO:0034057 | RNA strand-exchange activity(GO:0034057) |
| 0.1 | 0.7 | GO:0070568 | guanylyltransferase activity(GO:0070568) |
| 0.1 | 3.0 | GO:0034450 | ubiquitin-ubiquitin ligase activity(GO:0034450) |
| 0.1 | 0.4 | GO:0036328 | VEGF-C-activated receptor activity(GO:0036328) |
| 0.1 | 1.0 | GO:0008481 | sphinganine kinase activity(GO:0008481) D-erythro-sphingosine kinase activity(GO:0017050) |
| 0.1 | 0.6 | GO:0003938 | IMP dehydrogenase activity(GO:0003938) |
| 0.1 | 0.4 | GO:0033699 | DNA 5'-adenosine monophosphate hydrolase activity(GO:0033699) |
| 0.1 | 0.6 | GO:0008073 | ornithine decarboxylase inhibitor activity(GO:0008073) |
| 0.1 | 0.5 | GO:0097677 | STAT family protein binding(GO:0097677) |
| 0.1 | 1.1 | GO:0042835 | BRE binding(GO:0042835) |
| 0.1 | 0.7 | GO:0046899 | nucleoside triphosphate adenylate kinase activity(GO:0046899) |
| 0.1 | 1.2 | GO:0035242 | protein-arginine omega-N asymmetric methyltransferase activity(GO:0035242) |
| 0.1 | 1.1 | GO:0001025 | RNA polymerase III transcription factor binding(GO:0001025) |
| 0.1 | 1.2 | GO:0004849 | uridine kinase activity(GO:0004849) |
| 0.1 | 0.6 | GO:0035402 | histone kinase activity (H3-T11 specific)(GO:0035402) |
| 0.1 | 0.4 | GO:0008665 | 2'-phosphotransferase activity(GO:0008665) |
| 0.1 | 0.8 | GO:0043208 | glycosphingolipid binding(GO:0043208) |
| 0.1 | 1.0 | GO:0048408 | epidermal growth factor binding(GO:0048408) |
| 0.1 | 1.0 | GO:0071253 | connexin binding(GO:0071253) |
| 0.1 | 2.9 | GO:0003756 | protein disulfide isomerase activity(GO:0003756) intramolecular oxidoreductase activity, transposing S-S bonds(GO:0016864) |
| 0.1 | 2.6 | GO:0017128 | phospholipid scramblase activity(GO:0017128) |
| 0.1 | 0.8 | GO:0004704 | NF-kappaB-inducing kinase activity(GO:0004704) |
| 0.1 | 3.3 | GO:0003746 | translation elongation factor activity(GO:0003746) |
| 0.1 | 0.3 | GO:0000386 | second spliceosomal transesterification activity(GO:0000386) |
| 0.1 | 2.6 | GO:0022848 | acetylcholine-gated cation channel activity(GO:0022848) |
| 0.1 | 0.8 | GO:0004571 | mannosyl-oligosaccharide 1,2-alpha-mannosidase activity(GO:0004571) |
| 0.1 | 1.1 | GO:0015279 | store-operated calcium channel activity(GO:0015279) |
| 0.1 | 1.1 | GO:0070181 | small ribosomal subunit rRNA binding(GO:0070181) |
| 0.1 | 0.3 | GO:0008513 | secondary active organic cation transmembrane transporter activity(GO:0008513) |
| 0.1 | 0.8 | GO:0030292 | protein tyrosine kinase inhibitor activity(GO:0030292) |
| 0.1 | 1.5 | GO:0042975 | peroxisome proliferator activated receptor binding(GO:0042975) |
| 0.1 | 0.4 | GO:0008515 | sucrose:proton symporter activity(GO:0008506) sucrose transmembrane transporter activity(GO:0008515) disaccharide transmembrane transporter activity(GO:0015154) oligosaccharide transmembrane transporter activity(GO:0015157) |
| 0.1 | 0.1 | GO:0034617 | tetrahydrobiopterin binding(GO:0034617) |
| 0.1 | 0.3 | GO:0008431 | vitamin E binding(GO:0008431) |
| 0.1 | 0.6 | GO:0044547 | DNA topoisomerase binding(GO:0044547) |
| 0.1 | 1.5 | GO:0030306 | ADP-ribosylation factor binding(GO:0030306) |
| 0.1 | 0.6 | GO:0030267 | hydroxypyruvate reductase activity(GO:0016618) glyoxylate reductase (NADP) activity(GO:0030267) |
| 0.1 | 0.3 | GO:0004357 | glutamate-cysteine ligase activity(GO:0004357) |
| 0.1 | 0.4 | GO:0008240 | tripeptidyl-peptidase activity(GO:0008240) |
| 0.1 | 0.6 | GO:0016361 | activin receptor activity, type I(GO:0016361) |
| 0.1 | 0.5 | GO:0001515 | opioid peptide activity(GO:0001515) |
| 0.1 | 0.3 | GO:0033829 | O-fucosylpeptide 3-beta-N-acetylglucosaminyltransferase activity(GO:0033829) |
| 0.1 | 1.0 | GO:0031545 | peptidyl-proline 4-dioxygenase activity(GO:0031545) |
| 0.1 | 0.5 | GO:0043120 | tumor necrosis factor binding(GO:0043120) |
| 0.1 | 0.4 | GO:0001010 | transcription factor activity, sequence-specific DNA binding transcription factor recruiting(GO:0001010) |
| 0.1 | 0.6 | GO:0003886 | DNA (cytosine-5-)-methyltransferase activity(GO:0003886) |
| 0.1 | 2.1 | GO:0005112 | Notch binding(GO:0005112) |
| 0.1 | 0.4 | GO:0016509 | long-chain-3-hydroxyacyl-CoA dehydrogenase activity(GO:0016509) |
| 0.1 | 0.2 | GO:2001069 | glycogen binding(GO:2001069) |
| 0.1 | 0.2 | GO:0035605 | peptidyl-cysteine S-nitrosylase activity(GO:0035605) |
| 0.1 | 0.9 | GO:0015232 | heme transporter activity(GO:0015232) |
| 0.1 | 0.4 | GO:0004301 | epoxide hydrolase activity(GO:0004301) |
| 0.1 | 0.3 | GO:0050254 | rhodopsin kinase activity(GO:0050254) |
| 0.1 | 0.2 | GO:0004730 | pseudouridylate synthase activity(GO:0004730) |
| 0.1 | 0.4 | GO:0010484 | H3 histone acetyltransferase activity(GO:0010484) |
| 0.1 | 0.7 | GO:0097027 | ubiquitin-protein transferase activator activity(GO:0097027) |
| 0.1 | 0.4 | GO:0050119 | N-acetylglucosamine deacetylase activity(GO:0050119) |
| 0.1 | 1.0 | GO:0001055 | RNA polymerase II activity(GO:0001055) |
| 0.1 | 1.2 | GO:0005344 | oxygen transporter activity(GO:0005344) |
| 0.1 | 0.4 | GO:0052795 | exo-alpha-(2->3)-sialidase activity(GO:0052794) exo-alpha-(2->6)-sialidase activity(GO:0052795) exo-alpha-(2->8)-sialidase activity(GO:0052796) |
| 0.1 | 0.5 | GO:0019784 | NEDD8-specific protease activity(GO:0019784) |
| 0.1 | 0.9 | GO:0022889 | L-serine transmembrane transporter activity(GO:0015194) serine transmembrane transporter activity(GO:0022889) |
| 0.1 | 0.3 | GO:0047066 | phospholipid-hydroperoxide glutathione peroxidase activity(GO:0047066) |
| 0.0 | 0.1 | GO:0070984 | SET domain binding(GO:0070984) |
| 0.0 | 0.4 | GO:0071535 | RING-like zinc finger domain binding(GO:0071535) |
| 0.0 | 0.4 | GO:0004468 | lysine N-acetyltransferase activity, acting on acetyl phosphate as donor(GO:0004468) |
| 0.0 | 0.2 | GO:0047256 | beta-galactosyl-N-acetylglucosaminylgalactosylglucosyl-ceramide beta-1,3-acetylglucosaminyltransferase activity(GO:0008457) lactosylceramide 1,3-N-acetyl-beta-D-glucosaminyltransferase activity(GO:0047256) |
| 0.0 | 0.8 | GO:0005542 | folic acid binding(GO:0005542) |
| 0.0 | 0.5 | GO:0047134 | protein-disulfide reductase activity(GO:0047134) |
| 0.0 | 0.9 | GO:0001206 | transcriptional repressor activity, RNA polymerase II distal enhancer sequence-specific binding(GO:0001206) |
| 0.0 | 0.4 | GO:0000213 | tRNA-intron endonuclease activity(GO:0000213) |
| 0.0 | 0.7 | GO:0015321 | sodium-dependent phosphate transmembrane transporter activity(GO:0015321) |
| 0.0 | 0.3 | GO:0004144 | diacylglycerol O-acyltransferase activity(GO:0004144) |
| 0.0 | 0.2 | GO:0004906 | interferon-gamma receptor activity(GO:0004906) |
| 0.0 | 0.3 | GO:0032422 | purine-rich negative regulatory element binding(GO:0032422) |
| 0.0 | 0.5 | GO:0030621 | U4 snRNA binding(GO:0030621) |
| 0.0 | 0.3 | GO:0010858 | calcium-dependent protein kinase regulator activity(GO:0010858) |
| 0.0 | 0.2 | GO:0004001 | adenosine kinase activity(GO:0004001) |
| 0.0 | 0.5 | GO:0030976 | thiamine pyrophosphate binding(GO:0030976) |
| 0.0 | 0.4 | GO:0042285 | UDP-xylosyltransferase activity(GO:0035252) xylosyltransferase activity(GO:0042285) |
| 0.0 | 0.8 | GO:0004935 | adrenergic receptor activity(GO:0004935) |
| 0.0 | 0.3 | GO:0004694 | eukaryotic translation initiation factor 2alpha kinase activity(GO:0004694) |
| 0.0 | 0.5 | GO:0004969 | histamine receptor activity(GO:0004969) |
| 0.0 | 1.1 | GO:0035925 | mRNA 3'-UTR AU-rich region binding(GO:0035925) |
| 0.0 | 0.9 | GO:0030297 | transmembrane receptor protein tyrosine kinase activator activity(GO:0030297) |
| 0.0 | 1.6 | GO:0016628 | oxidoreductase activity, acting on the CH-CH group of donors, NAD or NADP as acceptor(GO:0016628) |
| 0.0 | 0.5 | GO:0008420 | CTD phosphatase activity(GO:0008420) |
| 0.0 | 0.2 | GO:0046964 | 3'-phosphoadenosine 5'-phosphosulfate transmembrane transporter activity(GO:0046964) |
| 0.0 | 0.2 | GO:0047493 | sphingomyelin synthase activity(GO:0033188) ceramide cholinephosphotransferase activity(GO:0047493) |
| 0.0 | 0.4 | GO:0003958 | NADPH-hemoprotein reductase activity(GO:0003958) |
| 0.0 | 1.3 | GO:0003887 | DNA-directed DNA polymerase activity(GO:0003887) |
| 0.0 | 0.5 | GO:0004673 | protein histidine kinase activity(GO:0004673) |
| 0.0 | 7.7 | GO:0003735 | structural constituent of ribosome(GO:0003735) |
| 0.0 | 0.3 | GO:0055131 | C3HC4-type RING finger domain binding(GO:0055131) |
| 0.0 | 0.4 | GO:0008428 | ribonuclease inhibitor activity(GO:0008428) |
| 0.0 | 0.2 | GO:0016213 | linoleoyl-CoA desaturase activity(GO:0016213) |
| 0.0 | 1.7 | GO:0043027 | cysteine-type endopeptidase inhibitor activity involved in apoptotic process(GO:0043027) |
| 0.0 | 0.3 | GO:0016416 | O-palmitoyltransferase activity(GO:0016416) |
| 0.0 | 0.3 | GO:1990829 | C-rich single-stranded DNA binding(GO:1990829) |
| 0.0 | 0.2 | GO:0004427 | inorganic diphosphatase activity(GO:0004427) |
| 0.0 | 1.8 | GO:0061631 | ubiquitin conjugating enzyme activity(GO:0061631) ubiquitin-like protein conjugating enzyme activity(GO:0061650) |
| 0.0 | 0.2 | GO:0004909 | interleukin-1, Type I, activating receptor activity(GO:0004909) |
| 0.0 | 2.9 | GO:0004004 | ATP-dependent RNA helicase activity(GO:0004004) |
| 0.0 | 1.1 | GO:0005388 | calcium-transporting ATPase activity(GO:0005388) |
| 0.0 | 0.4 | GO:0070888 | E-box binding(GO:0070888) |
| 0.0 | 0.2 | GO:0030628 | pre-mRNA 3'-splice site binding(GO:0030628) |
| 0.0 | 1.3 | GO:0008187 | poly-pyrimidine tract binding(GO:0008187) |
| 0.0 | 0.9 | GO:0005095 | GTPase inhibitor activity(GO:0005095) |
| 0.0 | 1.6 | GO:0031492 | nucleosomal DNA binding(GO:0031492) |
| 0.0 | 0.9 | GO:0003951 | NAD+ kinase activity(GO:0003951) |
| 0.0 | 3.3 | GO:0004843 | thiol-dependent ubiquitin-specific protease activity(GO:0004843) |
| 0.0 | 1.5 | GO:0008536 | Ran GTPase binding(GO:0008536) |
| 0.0 | 0.1 | GO:0004347 | glucose-6-phosphate isomerase activity(GO:0004347) |
| 0.0 | 0.1 | GO:0008097 | 5S rRNA binding(GO:0008097) |
| 0.0 | 0.2 | GO:0016833 | oxo-acid-lyase activity(GO:0016833) |
| 0.0 | 0.9 | GO:0070577 | lysine-acetylated histone binding(GO:0070577) |
| 0.0 | 0.1 | GO:0000026 | alpha-1,2-mannosyltransferase activity(GO:0000026) |
| 0.0 | 0.6 | GO:0035198 | miRNA binding(GO:0035198) |
| 0.0 | 1.3 | GO:0030159 | receptor signaling complex scaffold activity(GO:0030159) |
| 0.0 | 2.1 | GO:0004712 | protein serine/threonine/tyrosine kinase activity(GO:0004712) |
| 0.0 | 0.6 | GO:0030898 | actin-dependent ATPase activity(GO:0030898) |
| 0.0 | 0.4 | GO:0015187 | glycine transmembrane transporter activity(GO:0015187) |
| 0.0 | 0.4 | GO:0008494 | translation activator activity(GO:0008494) |
| 0.0 | 0.1 | GO:0004515 | nicotinate-nucleotide adenylyltransferase activity(GO:0004515) |
| 0.0 | 0.2 | GO:0051373 | FATZ binding(GO:0051373) |
| 0.0 | 0.4 | GO:0034452 | dynactin binding(GO:0034452) |
| 0.0 | 0.5 | GO:0005522 | profilin binding(GO:0005522) |
| 0.0 | 0.3 | GO:0008142 | oxysterol binding(GO:0008142) |
| 0.0 | 0.3 | GO:0015288 | porin activity(GO:0015288) |
| 0.0 | 0.3 | GO:0047499 | calcium-independent phospholipase A2 activity(GO:0047499) |
| 0.0 | 1.1 | GO:0004115 | 3',5'-cyclic-AMP phosphodiesterase activity(GO:0004115) |
| 0.0 | 0.2 | GO:0004526 | ribonuclease P activity(GO:0004526) |
| 0.0 | 0.1 | GO:0046975 | histone methyltransferase activity (H3-K36 specific)(GO:0046975) |
| 0.0 | 0.4 | GO:0004887 | thyroid hormone receptor activity(GO:0004887) |
| 0.0 | 0.3 | GO:0046790 | virion binding(GO:0046790) |
| 0.0 | 0.2 | GO:0097322 | 7SK snRNA binding(GO:0097322) |
| 0.0 | 0.5 | GO:0008191 | metalloendopeptidase inhibitor activity(GO:0008191) |
| 0.0 | 0.1 | GO:0019777 | Atg12 transferase activity(GO:0019777) |
| 0.0 | 0.5 | GO:0015271 | outward rectifier potassium channel activity(GO:0015271) |
| 0.0 | 0.2 | GO:0042799 | histone methyltransferase activity (H4-K20 specific)(GO:0042799) |
| 0.0 | 1.2 | GO:0017046 | peptide hormone binding(GO:0017046) |
| 0.0 | 0.2 | GO:0004791 | thioredoxin-disulfide reductase activity(GO:0004791) |
| 0.0 | 0.1 | GO:0003883 | CTP synthase activity(GO:0003883) |
| 0.0 | 0.0 | GO:0098770 | FBXO family protein binding(GO:0098770) |
| 0.0 | 0.6 | GO:0031434 | mitogen-activated protein kinase kinase binding(GO:0031434) |
| 0.0 | 0.2 | GO:0015217 | ATP transmembrane transporter activity(GO:0005347) ADP transmembrane transporter activity(GO:0015217) |
| 0.0 | 0.2 | GO:0035613 | RNA stem-loop binding(GO:0035613) |
| 0.0 | 0.3 | GO:0031996 | thioesterase binding(GO:0031996) |
| 0.0 | 4.0 | GO:0001085 | RNA polymerase II transcription factor binding(GO:0001085) |
| 0.0 | 1.0 | GO:0001205 | transcriptional activator activity, RNA polymerase II distal enhancer sequence-specific binding(GO:0001205) |
| 0.0 | 1.3 | GO:0003705 | transcription factor activity, RNA polymerase II distal enhancer sequence-specific binding(GO:0003705) |
| 0.0 | 0.1 | GO:0030144 | alpha-1,6-mannosylglycoprotein 6-beta-N-acetylglucosaminyltransferase activity(GO:0030144) |
| 0.0 | 0.1 | GO:0043023 | ribosomal large subunit binding(GO:0043023) |
| 0.0 | 0.2 | GO:0046703 | natural killer cell lectin-like receptor binding(GO:0046703) |
| 0.0 | 0.1 | GO:0019788 | NEDD8 transferase activity(GO:0019788) |
| 0.0 | 0.7 | GO:0031369 | translation initiation factor binding(GO:0031369) |
| 0.0 | 0.1 | GO:0047298 | 4-aminobutyrate transaminase activity(GO:0003867) succinate-semialdehyde dehydrogenase binding(GO:0032145) (S)-3-amino-2-methylpropionate transaminase activity(GO:0047298) |
| 0.0 | 0.3 | GO:0015467 | G-protein activated inward rectifier potassium channel activity(GO:0015467) |
| 0.0 | 0.2 | GO:0043138 | 3'-5' DNA helicase activity(GO:0043138) |
| 0.0 | 0.4 | GO:0000993 | RNA polymerase II core binding(GO:0000993) |
| 0.0 | 0.1 | GO:0042392 | sphingosine-1-phosphate phosphatase activity(GO:0042392) |
| 0.0 | 0.7 | GO:0070412 | R-SMAD binding(GO:0070412) |
| 0.0 | 0.3 | GO:0003708 | retinoic acid receptor activity(GO:0003708) |
| 0.0 | 5.4 | GO:0001077 | transcriptional activator activity, RNA polymerase II core promoter proximal region sequence-specific binding(GO:0001077) |
| 0.0 | 0.2 | GO:0004579 | dolichyl-diphosphooligosaccharide-protein glycotransferase activity(GO:0004579) |
| 0.0 | 2.4 | GO:0000982 | transcription factor activity, RNA polymerase II core promoter proximal region sequence-specific binding(GO:0000982) |
| 0.0 | 0.8 | GO:0008173 | RNA methyltransferase activity(GO:0008173) |
| 0.0 | 0.1 | GO:0001042 | RNA polymerase I core binding(GO:0001042) |
| 0.0 | 0.4 | GO:0043548 | phosphatidylinositol 3-kinase binding(GO:0043548) |
| 0.0 | 0.2 | GO:0008195 | phosphatidate phosphatase activity(GO:0008195) |
| 0.0 | 0.7 | GO:0030145 | manganese ion binding(GO:0030145) |
| 0.0 | 0.5 | GO:0000979 | RNA polymerase II core promoter sequence-specific DNA binding(GO:0000979) |
Gene overrepresentation in curated gene sets: canonical pathways category:
| Log-likelihood per target | Total log-likelihood | Term | Description |
|---|---|---|---|
| 0.1 | 3.9 | SA B CELL RECEPTOR COMPLEXES | Antigen binding to B cell receptors activates protein tyrosine kinases, such as the Src family, which ultimate activate MAP kinases. |
| 0.1 | 6.0 | PID HES HEY PATHWAY | Notch-mediated HES/HEY network |
| 0.1 | 1.0 | PID VEGF VEGFR PATHWAY | VEGF and VEGFR signaling network |
| 0.0 | 1.5 | PID ARF 3PATHWAY | Arf1 pathway |
| 0.0 | 1.3 | PID RANBP2 PATHWAY | Sumoylation by RanBP2 regulates transcriptional repression |
| 0.0 | 1.3 | PID NFKAPPAB ATYPICAL PATHWAY | Atypical NF-kappaB pathway |
| 0.0 | 1.5 | PID DNA PK PATHWAY | DNA-PK pathway in nonhomologous end joining |
| 0.0 | 1.0 | PID PDGFRA PATHWAY | PDGFR-alpha signaling pathway |
| 0.0 | 4.5 | PID AR TF PATHWAY | Regulation of Androgen receptor activity |
| 0.0 | 1.8 | PID S1P META PATHWAY | Sphingosine 1-phosphate (S1P) pathway |
| 0.0 | 0.6 | PID TCR RAS PATHWAY | Ras signaling in the CD4+ TCR pathway |
| 0.0 | 1.0 | PID HIF1A PATHWAY | Hypoxic and oxygen homeostasis regulation of HIF-1-alpha |
| 0.0 | 0.6 | PID MYC PATHWAY | C-MYC pathway |
| 0.0 | 1.4 | PID SMAD2 3PATHWAY | Regulation of cytoplasmic and nuclear SMAD2/3 signaling |
| 0.0 | 2.0 | PID THROMBIN PAR1 PATHWAY | PAR1-mediated thrombin signaling events |
| 0.0 | 0.3 | ST TYPE I INTERFERON PATHWAY | Type I Interferon (alpha/beta IFN) Pathway |
| 0.0 | 0.2 | ST INTERFERON GAMMA PATHWAY | Interferon gamma pathway. |
| 0.0 | 0.2 | PID IL2 PI3K PATHWAY | IL2 signaling events mediated by PI3K |
| 0.0 | 1.4 | PID EPO PATHWAY | EPO signaling pathway |
| 0.0 | 1.8 | PID BCR 5PATHWAY | BCR signaling pathway |
| 0.0 | 1.1 | PID TOLL ENDOGENOUS PATHWAY | Endogenous TLR signaling |
| 0.0 | 4.0 | PID P73PATHWAY | p73 transcription factor network |
| 0.0 | 3.5 | PID MYC ACTIV PATHWAY | Validated targets of C-MYC transcriptional activation |
| 0.0 | 3.3 | PID SMAD2 3NUCLEAR PATHWAY | Regulation of nuclear SMAD2/3 signaling |
| 0.0 | 0.6 | PID IL2 STAT5 PATHWAY | IL2 signaling events mediated by STAT5 |
| 0.0 | 1.7 | PID INTEGRIN3 PATHWAY | Beta3 integrin cell surface interactions |
| 0.0 | 0.7 | PID EPHA FWDPATHWAY | EPHA forward signaling |
| 0.0 | 2.2 | PID MET PATHWAY | Signaling events mediated by Hepatocyte Growth Factor Receptor (c-Met) |
| 0.0 | 1.1 | PID CD8 TCR PATHWAY | TCR signaling in naïve CD8+ T cells |
| 0.0 | 0.6 | PID FCER1 PATHWAY | Fc-epsilon receptor I signaling in mast cells |
| 0.0 | 0.8 | PID IL1 PATHWAY | IL1-mediated signaling events |
| 0.0 | 0.2 | SA G1 AND S PHASES | Cdk2, 4, and 6 bind cyclin D in G1, while cdk2/cyclin E promotes the G1/S transition. |
| 0.0 | 1.2 | ST FAS SIGNALING PATHWAY | Fas Signaling Pathway |
| 0.0 | 0.5 | PID CONE PATHWAY | Visual signal transduction: Cones |
| 0.0 | 0.6 | PID ERBB NETWORK PATHWAY | ErbB receptor signaling network |
| 0.0 | 0.5 | PID PS1 PATHWAY | Presenilin action in Notch and Wnt signaling |
| 0.0 | 0.5 | PID NOTCH PATHWAY | Notch signaling pathway |
| 0.0 | 0.3 | PID CD40 PATHWAY | CD40/CD40L signaling |
| 0.0 | 0.4 | ST PHOSPHOINOSITIDE 3 KINASE PATHWAY | PI3K Pathway |
| 0.0 | 0.3 | PID RETINOIC ACID PATHWAY | Retinoic acid receptors-mediated signaling |
| 0.0 | 0.5 | PID VEGFR1 2 PATHWAY | Signaling events mediated by VEGFR1 and VEGFR2 |
Gene overrepresentation in curated gene sets: REACTOME pathways category:
| Log-likelihood per target | Total log-likelihood | Term | Description |
|---|---|---|---|
| 0.1 | 2.3 | REACTOME PYRIMIDINE CATABOLISM | Genes involved in Pyrimidine catabolism |
| 0.1 | 1.5 | REACTOME APOPTOSIS INDUCED DNA FRAGMENTATION | Genes involved in Apoptosis induced DNA fragmentation |
| 0.1 | 1.1 | REACTOME ELEVATION OF CYTOSOLIC CA2 LEVELS | Genes involved in Elevation of cytosolic Ca2+ levels |
| 0.1 | 4.0 | REACTOME YAP1 AND WWTR1 TAZ STIMULATED GENE EXPRESSION | Genes involved in YAP1- and WWTR1 (TAZ)-stimulated gene expression |
| 0.1 | 1.3 | REACTOME SYNTHESIS OF SUBSTRATES IN N GLYCAN BIOSYTHESIS | Genes involved in Synthesis of substrates in N-glycan biosythesis |
| 0.1 | 0.8 | REACTOME TRAF6 MEDIATED IRF7 ACTIVATION IN TLR7 8 OR 9 SIGNALING | Genes involved in TRAF6 mediated IRF7 activation in TLR7/8 or 9 signaling |
| 0.1 | 1.7 | REACTOME REGULATION OF KIT SIGNALING | Genes involved in Regulation of KIT signaling |
| 0.1 | 1.3 | REACTOME BASE FREE SUGAR PHOSPHATE REMOVAL VIA THE SINGLE NUCLEOTIDE REPLACEMENT PATHWAY | Genes involved in Base-free sugar-phosphate removal via the single-nucleotide replacement pathway |
| 0.1 | 1.5 | REACTOME SIGNAL ATTENUATION | Genes involved in Signal attenuation |
| 0.1 | 0.6 | REACTOME SOS MEDIATED SIGNALLING | Genes involved in SOS-mediated signalling |
| 0.1 | 8.7 | REACTOME PEPTIDE CHAIN ELONGATION | Genes involved in Peptide chain elongation |
| 0.1 | 3.9 | REACTOME PRE NOTCH EXPRESSION AND PROCESSING | Genes involved in Pre-NOTCH Expression and Processing |
| 0.1 | 1.3 | REACTOME EGFR DOWNREGULATION | Genes involved in EGFR downregulation |
| 0.1 | 3.1 | REACTOME RECYCLING PATHWAY OF L1 | Genes involved in Recycling pathway of L1 |
| 0.0 | 1.0 | REACTOME VEGF LIGAND RECEPTOR INTERACTIONS | Genes involved in VEGF ligand-receptor interactions |
| 0.0 | 1.7 | REACTOME PHOSPHORYLATION OF THE APC C | Genes involved in Phosphorylation of the APC/C |
| 0.0 | 1.0 | REACTOME OXYGEN DEPENDENT PROLINE HYDROXYLATION OF HYPOXIA INDUCIBLE FACTOR ALPHA | Genes involved in Oxygen-dependent Proline Hydroxylation of Hypoxia-inducible Factor Alpha |
| 0.0 | 0.3 | REACTOME BINDING AND ENTRY OF HIV VIRION | Genes involved in Binding and entry of HIV virion |
| 0.0 | 1.2 | REACTOME PYRIMIDINE METABOLISM | Genes involved in Pyrimidine metabolism |
| 0.0 | 1.2 | REACTOME REGULATION OF COMPLEMENT CASCADE | Genes involved in Regulation of Complement cascade |
| 0.0 | 1.5 | REACTOME CTNNB1 PHOSPHORYLATION CASCADE | Genes involved in Beta-catenin phosphorylation cascade |
| 0.0 | 1.1 | REACTOME RNA POL III CHAIN ELONGATION | Genes involved in RNA Polymerase III Chain Elongation |
| 0.0 | 0.3 | REACTOME INHIBITION OF REPLICATION INITIATION OF DAMAGED DNA BY RB1 E2F1 | Genes involved in Inhibition of replication initiation of damaged DNA by RB1/E2F1 |
| 0.0 | 2.3 | REACTOME MRNA 3 END PROCESSING | Genes involved in mRNA 3'-end processing |
| 0.0 | 1.9 | REACTOME DOWNREGULATION OF SMAD2 3 SMAD4 TRANSCRIPTIONAL ACTIVITY | Genes involved in Downregulation of SMAD2/3:SMAD4 transcriptional activity |
| 0.0 | 0.4 | REACTOME SYNTHESIS SECRETION AND DEACYLATION OF GHRELIN | Genes involved in Synthesis, Secretion, and Deacylation of Ghrelin |
| 0.0 | 0.9 | REACTOME REGULATION OF IFNA SIGNALING | Genes involved in Regulation of IFNA signaling |
| 0.0 | 2.4 | REACTOME REGULATION OF ORNITHINE DECARBOXYLASE ODC | Genes involved in Regulation of ornithine decarboxylase (ODC) |
| 0.0 | 2.5 | REACTOME INTERFERON ALPHA BETA SIGNALING | Genes involved in Interferon alpha/beta signaling |
| 0.0 | 2.3 | REACTOME MEIOTIC SYNAPSIS | Genes involved in Meiotic Synapsis |
| 0.0 | 3.1 | REACTOME TRANSLATION | Genes involved in Translation |
| 0.0 | 1.3 | REACTOME NEGATIVE REGULATORS OF RIG I MDA5 SIGNALING | Genes involved in Negative regulators of RIG-I/MDA5 signaling |
| 0.0 | 0.3 | REACTOME PURINE CATABOLISM | Genes involved in Purine catabolism |
| 0.0 | 0.4 | REACTOME SEROTONIN RECEPTORS | Genes involved in Serotonin receptors |
| 0.0 | 1.7 | REACTOME REGULATION OF BETA CELL DEVELOPMENT | Genes involved in Regulation of beta-cell development |
| 0.0 | 0.1 | REACTOME KINESINS | Genes involved in Kinesins |
| 0.0 | 0.4 | REACTOME AKT PHOSPHORYLATES TARGETS IN THE CYTOSOL | Genes involved in AKT phosphorylates targets in the cytosol |
| 0.0 | 0.6 | REACTOME EICOSANOID LIGAND BINDING RECEPTORS | Genes involved in Eicosanoid ligand-binding receptors |
| 0.0 | 0.6 | REACTOME SHC1 EVENTS IN ERBB4 SIGNALING | Genes involved in SHC1 events in ERBB4 signaling |
| 0.0 | 0.2 | REACTOME ALPHA LINOLENIC ACID ALA METABOLISM | Genes involved in alpha-linolenic acid (ALA) metabolism |
| 0.0 | 0.3 | REACTOME RNA POL III TRANSCRIPTION INITIATION FROM TYPE 2 PROMOTER | Genes involved in RNA Polymerase III Transcription Initiation From Type 2 Promoter |
| 0.0 | 0.7 | REACTOME ELONGATION ARREST AND RECOVERY | Genes involved in Elongation arrest and recovery |
| 0.0 | 0.3 | REACTOME REGULATORY RNA PATHWAYS | Genes involved in Regulatory RNA pathways |
| 0.0 | 2.0 | REACTOME NCAM1 INTERACTIONS | Genes involved in NCAM1 interactions |
| 0.0 | 1.9 | REACTOME GOLGI ASSOCIATED VESICLE BIOGENESIS | Genes involved in Golgi Associated Vesicle Biogenesis |
| 0.0 | 1.1 | REACTOME ASSOCIATION OF TRIC CCT WITH TARGET PROTEINS DURING BIOSYNTHESIS | Genes involved in Association of TriC/CCT with target proteins during biosynthesis |
| 0.0 | 1.8 | REACTOME MRNA SPLICING | Genes involved in mRNA Splicing |
| 0.0 | 1.3 | REACTOME AMINO ACID TRANSPORT ACROSS THE PLASMA MEMBRANE | Genes involved in Amino acid transport across the plasma membrane |
| 0.0 | 0.3 | REACTOME MITOCHONDRIAL FATTY ACID BETA OXIDATION | Genes involved in Mitochondrial Fatty Acid Beta-Oxidation |
| 0.0 | 0.2 | REACTOME REGULATION OF IFNG SIGNALING | Genes involved in Regulation of IFNG signaling |
| 0.0 | 1.1 | REACTOME TRANSPORT TO THE GOLGI AND SUBSEQUENT MODIFICATION | Genes involved in Transport to the Golgi and subsequent modification |
| 0.0 | 1.0 | REACTOME IL1 SIGNALING | Genes involved in Interleukin-1 signaling |
| 0.0 | 0.3 | REACTOME TAK1 ACTIVATES NFKB BY PHOSPHORYLATION AND ACTIVATION OF IKKS COMPLEX | Genes involved in TAK1 activates NFkB by phosphorylation and activation of IKKs complex |
| 0.0 | 0.5 | REACTOME PEROXISOMAL LIPID METABOLISM | Genes involved in Peroxisomal lipid metabolism |
| 0.0 | 0.5 | REACTOME EXTRINSIC PATHWAY FOR APOPTOSIS | Genes involved in Extrinsic Pathway for Apoptosis |
| 0.0 | 0.4 | REACTOME ENDOSOMAL SORTING COMPLEX REQUIRED FOR TRANSPORT ESCRT | Genes involved in Endosomal Sorting Complex Required For Transport (ESCRT) |
| 0.0 | 0.2 | REACTOME UNWINDING OF DNA | Genes involved in Unwinding of DNA |
| 0.0 | 0.4 | REACTOME GLUCURONIDATION | Genes involved in Glucuronidation |
| 0.0 | 0.9 | REACTOME MITOCHONDRIAL PROTEIN IMPORT | Genes involved in Mitochondrial Protein Import |
| 0.0 | 0.4 | REACTOME ACTIVATION OF RAC | Genes involved in Activation of Rac |
| 0.0 | 0.3 | REACTOME ORGANIC CATION ANION ZWITTERION TRANSPORT | Genes involved in Organic cation/anion/zwitterion transport |
| 0.0 | 0.5 | REACTOME SYNTHESIS AND INTERCONVERSION OF NUCLEOTIDE DI AND TRIPHOSPHATES | Genes involved in Synthesis and interconversion of nucleotide di- and triphosphates |
| 0.0 | 0.2 | REACTOME PURINE RIBONUCLEOSIDE MONOPHOSPHATE BIOSYNTHESIS | Genes involved in Purine ribonucleoside monophosphate biosynthesis |
| 0.0 | 1.5 | REACTOME DNA REPAIR | Genes involved in DNA Repair |
| 0.0 | 1.0 | REACTOME MYOGENESIS | Genes involved in Myogenesis |
| 0.0 | 0.3 | REACTOME INHIBITION OF VOLTAGE GATED CA2 CHANNELS VIA GBETA GAMMA SUBUNITS | Genes involved in Inhibition of voltage gated Ca2+ channels via Gbeta/gamma subunits |
| 0.0 | 0.2 | REACTOME REGULATION OF RHEB GTPASE ACTIVITY BY AMPK | Genes involved in Regulation of Rheb GTPase activity by AMPK |
| 0.0 | 0.1 | REACTOME ANTIGEN PRESENTATION FOLDING ASSEMBLY AND PEPTIDE LOADING OF CLASS I MHC | Genes involved in Antigen Presentation: Folding, assembly and peptide loading of class I MHC |
| 0.0 | 0.1 | REACTOME COPI MEDIATED TRANSPORT | Genes involved in COPI Mediated Transport |
| 0.0 | 0.7 | REACTOME NOTCH1 INTRACELLULAR DOMAIN REGULATES TRANSCRIPTION | Genes involved in NOTCH1 Intracellular Domain Regulates Transcription |