Project
Illumina Body Map 2 (GSE30611)
Navigation
Downloads
Results for HIC2
Z-value: 1.54
Motif logo
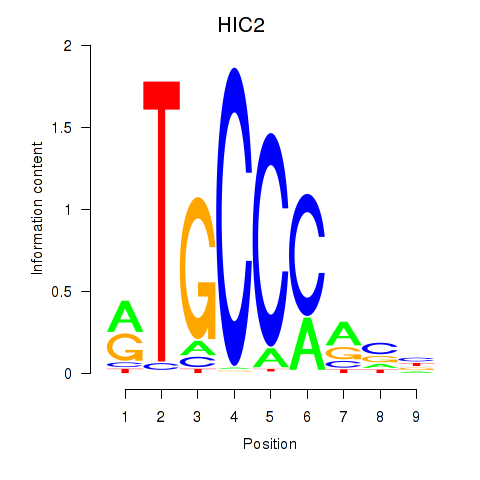
Transcription factors associated with HIC2
| Gene Symbol | Gene ID | Gene Info |
|---|---|---|
|
HIC2
|
ENSG00000169635.10 | HIC ZBTB transcriptional repressor 2 |
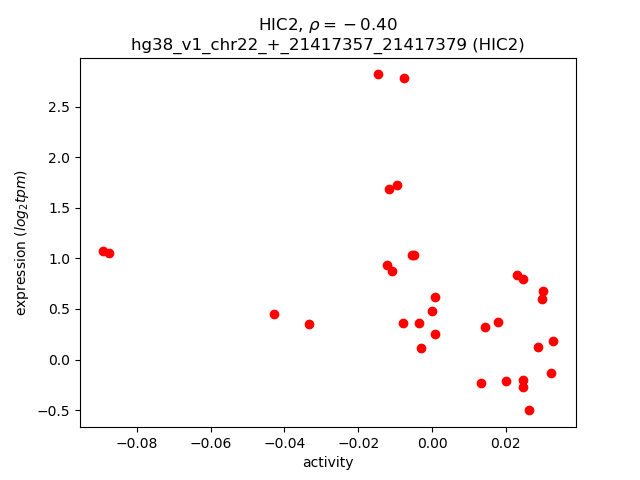
Activity-expression correlation:
| Gene | Promoter | Pearson corr. coef. | P-value | Plot |
|---|---|---|---|---|
| HIC2 | hg38_v1_chr22_+_21417357_21417379 | -0.40 | 2.4e-02 | Click! |
Activity profile of HIC2 motif
Sorted Z-values of HIC2 motif
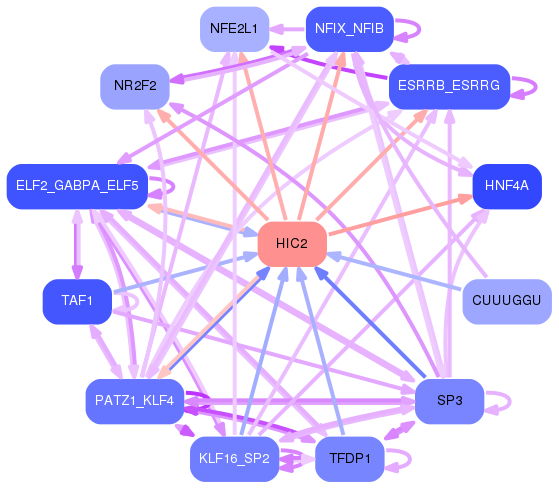
Network of associatons between targets according to the STRING database.

First level regulatory network of HIC2
Gene Ontology Analysis
Gene overrepresentation in biological process category:
| Log-likelihood per target | Total log-likelihood | Term | Description |
|---|---|---|---|
| 1.2 | 3.6 | GO:1903280 | negative regulation of calcium:sodium antiporter activity(GO:1903280) |
| 1.2 | 3.5 | GO:1901899 | positive regulation of relaxation of cardiac muscle(GO:1901899) |
| 1.1 | 5.5 | GO:0042853 | L-alanine metabolic process(GO:0042851) L-alanine catabolic process(GO:0042853) |
| 1.1 | 4.2 | GO:0086097 | phospholipase C-activating angiotensin-activated signaling pathway(GO:0086097) |
| 0.9 | 3.8 | GO:0072023 | thick ascending limb development(GO:0072023) metanephric thick ascending limb development(GO:0072233) |
| 0.9 | 3.6 | GO:0003095 | pressure natriuresis(GO:0003095) |
| 0.9 | 3.6 | GO:0071288 | cellular response to mercury ion(GO:0071288) |
| 0.9 | 3.6 | GO:1903984 | positive regulation of TRAIL-activated apoptotic signaling pathway(GO:1903984) |
| 0.9 | 3.4 | GO:1990926 | short-term synaptic potentiation(GO:1990926) |
| 0.8 | 2.4 | GO:0097187 | dentinogenesis(GO:0097187) |
| 0.8 | 2.3 | GO:0015920 | lipopolysaccharide transport(GO:0015920) |
| 0.8 | 5.3 | GO:0090258 | negative regulation of mitochondrial fission(GO:0090258) |
| 0.7 | 2.9 | GO:0010133 | proline catabolic process to glutamate(GO:0010133) |
| 0.7 | 2.7 | GO:0010652 | regulation of cell communication by chemical coupling(GO:0010645) positive regulation of cell communication by chemical coupling(GO:0010652) |
| 0.7 | 2.0 | GO:0071314 | cellular response to cocaine(GO:0071314) |
| 0.7 | 4.0 | GO:0098886 | modification of dendritic spine(GO:0098886) |
| 0.7 | 2.0 | GO:0034769 | basement membrane disassembly(GO:0034769) |
| 0.6 | 1.9 | GO:0042323 | negative regulation of circadian sleep/wake cycle, non-REM sleep(GO:0042323) negative regulation of mucus secretion(GO:0070256) |
| 0.6 | 1.9 | GO:0014873 | G-protein coupled receptor signaling pathway coupled to cGMP nucleotide second messenger(GO:0007199) response to muscle activity involved in regulation of muscle adaptation(GO:0014873) |
| 0.6 | 1.9 | GO:0010593 | negative regulation of lamellipodium assembly(GO:0010593) |
| 0.6 | 1.9 | GO:0035674 | tricarboxylic acid transmembrane transport(GO:0035674) |
| 0.6 | 10.2 | GO:0046951 | ketone body biosynthetic process(GO:0046951) |
| 0.6 | 1.8 | GO:0036323 | vascular endothelial growth factor receptor-1 signaling pathway(GO:0036323) |
| 0.6 | 1.8 | GO:0015993 | molecular hydrogen transport(GO:0015993) |
| 0.6 | 2.4 | GO:2000910 | negative regulation of cholesterol import(GO:0060621) negative regulation of sterol import(GO:2000910) |
| 0.6 | 2.3 | GO:0060262 | regulation of N-terminal protein palmitoylation(GO:0060254) negative regulation of N-terminal protein palmitoylation(GO:0060262) negative regulation of protein lipidation(GO:1903060) |
| 0.6 | 1.7 | GO:0051387 | negative regulation of neurotrophin TRK receptor signaling pathway(GO:0051387) |
| 0.6 | 2.2 | GO:1903892 | negative regulation of ATF6-mediated unfolded protein response(GO:1903892) |
| 0.5 | 0.5 | GO:0086053 | AV node cell to bundle of His cell communication by electrical coupling(GO:0086053) |
| 0.5 | 1.5 | GO:0045715 | negative regulation of low-density lipoprotein particle receptor biosynthetic process(GO:0045715) |
| 0.5 | 1.5 | GO:0044278 | cell wall disruption in other organism(GO:0044278) |
| 0.5 | 1.5 | GO:0002415 | immunoglobulin transcytosis in epithelial cells mediated by polymeric immunoglobulin receptor(GO:0002415) |
| 0.5 | 2.5 | GO:2000866 | positive regulation of estrogen secretion(GO:2000863) positive regulation of estradiol secretion(GO:2000866) |
| 0.5 | 1.5 | GO:0051041 | positive regulation of calcium-independent cell-cell adhesion(GO:0051041) |
| 0.5 | 3.9 | GO:2000230 | regulation of cholesterol transporter activity(GO:0060694) response to metformin(GO:1901558) negative regulation of pancreatic stellate cell proliferation(GO:2000230) |
| 0.5 | 5.8 | GO:0052697 | flavonoid glucuronidation(GO:0052696) xenobiotic glucuronidation(GO:0052697) |
| 0.5 | 1.9 | GO:0010902 | positive regulation of very-low-density lipoprotein particle remodeling(GO:0010902) |
| 0.5 | 1.4 | GO:0000412 | histone peptidyl-prolyl isomerization(GO:0000412) |
| 0.5 | 1.4 | GO:0060392 | negative regulation of SMAD protein import into nucleus(GO:0060392) |
| 0.5 | 2.8 | GO:0035105 | sterol regulatory element binding protein import into nucleus(GO:0035105) |
| 0.4 | 5.3 | GO:0006116 | NADH oxidation(GO:0006116) |
| 0.4 | 1.7 | GO:0006781 | succinyl-CoA pathway(GO:0006781) |
| 0.4 | 1.3 | GO:0099540 | synaptic signaling via neuropeptide(GO:0099538) trans-synaptic signaling by neuropeptide(GO:0099540) trans-synaptic signaling by neuropeptide, modulating synaptic transmission(GO:0099551) |
| 0.4 | 1.3 | GO:1903570 | regulation of protein kinase D signaling(GO:1903570) positive regulation of protein kinase D signaling(GO:1903572) |
| 0.4 | 2.9 | GO:0010734 | protein glutathionylation(GO:0010731) regulation of protein glutathionylation(GO:0010732) negative regulation of protein glutathionylation(GO:0010734) |
| 0.4 | 0.4 | GO:0070093 | negative regulation of glucagon secretion(GO:0070093) |
| 0.4 | 2.5 | GO:1902283 | negative regulation of primary amine oxidase activity(GO:1902283) |
| 0.4 | 5.8 | GO:0003360 | brainstem development(GO:0003360) |
| 0.4 | 2.0 | GO:0061034 | olfactory bulb mitral cell layer development(GO:0061034) |
| 0.4 | 2.4 | GO:0036118 | hyaluranon cable assembly(GO:0036118) regulation of hyaluranon cable assembly(GO:1900104) positive regulation of hyaluranon cable assembly(GO:1900106) |
| 0.4 | 1.6 | GO:0031455 | glycine betaine biosynthetic process from choline(GO:0019285) glycine betaine metabolic process(GO:0031455) glycine betaine biosynthetic process(GO:0031456) |
| 0.4 | 1.6 | GO:0046950 | cellular ketone body metabolic process(GO:0046950) ketone body catabolic process(GO:0046952) |
| 0.4 | 1.2 | GO:0016487 | sesquiterpenoid metabolic process(GO:0006714) sesquiterpenoid catabolic process(GO:0016107) farnesol metabolic process(GO:0016487) farnesol catabolic process(GO:0016488) |
| 0.4 | 1.2 | GO:0070564 | positive regulation of vitamin D receptor signaling pathway(GO:0070564) |
| 0.4 | 2.4 | GO:0021966 | corticospinal neuron axon guidance(GO:0021966) |
| 0.4 | 2.7 | GO:0014063 | negative regulation of serotonin secretion(GO:0014063) |
| 0.4 | 1.5 | GO:0015793 | glycerol transport(GO:0015793) |
| 0.4 | 1.5 | GO:0034444 | regulation of plasma lipoprotein particle oxidation(GO:0034444) negative regulation of plasma lipoprotein particle oxidation(GO:0034445) |
| 0.4 | 1.9 | GO:0035106 | negative regulation of luteinizing hormone secretion(GO:0033685) operant conditioning(GO:0035106) |
| 0.4 | 1.5 | GO:0006175 | adenosine salvage(GO:0006169) dATP biosynthetic process(GO:0006175) |
| 0.4 | 2.3 | GO:0008614 | pyridoxine metabolic process(GO:0008614) pyridoxine biosynthetic process(GO:0008615) vitamin B6 biosynthetic process(GO:0042819) |
| 0.4 | 2.3 | GO:0098707 | ferrous iron import into cell(GO:0097460) ferrous iron import across plasma membrane(GO:0098707) |
| 0.4 | 1.9 | GO:1901350 | cell-cell signaling involved in cell-cell junction organization(GO:1901350) |
| 0.4 | 4.1 | GO:0000101 | sulfur amino acid transport(GO:0000101) |
| 0.4 | 0.4 | GO:0035993 | deltoid tuberosity development(GO:0035993) |
| 0.4 | 4.4 | GO:0045542 | positive regulation of cholesterol biosynthetic process(GO:0045542) |
| 0.4 | 1.1 | GO:0001579 | medium-chain fatty acid transport(GO:0001579) |
| 0.4 | 2.9 | GO:0016557 | peroxisome membrane biogenesis(GO:0016557) |
| 0.4 | 3.2 | GO:0033564 | anterior/posterior axon guidance(GO:0033564) |
| 0.4 | 2.8 | GO:0097327 | response to antineoplastic agent(GO:0097327) |
| 0.4 | 0.7 | GO:0009450 | gamma-aminobutyric acid catabolic process(GO:0009450) |
| 0.3 | 1.0 | GO:2000669 | negative regulation of dendritic cell apoptotic process(GO:2000669) |
| 0.3 | 1.7 | GO:0071934 | thiamine transmembrane transport(GO:0071934) |
| 0.3 | 1.4 | GO:0032223 | negative regulation of synaptic transmission, cholinergic(GO:0032223) neurotransmitter receptor biosynthetic process(GO:0045212) |
| 0.3 | 0.3 | GO:1901079 | positive regulation of relaxation of muscle(GO:1901079) |
| 0.3 | 1.4 | GO:0010728 | regulation of hydrogen peroxide biosynthetic process(GO:0010728) |
| 0.3 | 2.0 | GO:0061107 | seminal vesicle development(GO:0061107) |
| 0.3 | 2.3 | GO:0048807 | female genitalia morphogenesis(GO:0048807) |
| 0.3 | 1.3 | GO:1903609 | negative regulation of peptidyl-tyrosine autophosphorylation(GO:1900085) negative regulation of inward rectifier potassium channel activity(GO:1903609) |
| 0.3 | 1.0 | GO:1902688 | regulation of NAD metabolic process(GO:1902688) |
| 0.3 | 1.3 | GO:0032185 | septin cytoskeleton organization(GO:0032185) |
| 0.3 | 1.3 | GO:0006740 | NADPH regeneration(GO:0006740) |
| 0.3 | 0.3 | GO:0034625 | fatty acid elongation, saturated fatty acid(GO:0019367) fatty acid elongation, unsaturated fatty acid(GO:0019368) fatty acid elongation, monounsaturated fatty acid(GO:0034625) fatty acid elongation, polyunsaturated fatty acid(GO:0034626) |
| 0.3 | 1.0 | GO:0006212 | uracil catabolic process(GO:0006212) |
| 0.3 | 1.0 | GO:0035928 | rRNA import into mitochondrion(GO:0035928) |
| 0.3 | 5.4 | GO:0055091 | phospholipid homeostasis(GO:0055091) |
| 0.3 | 1.0 | GO:1901383 | negative regulation of chorionic trophoblast cell proliferation(GO:1901383) |
| 0.3 | 0.9 | GO:1904732 | regulation of electron carrier activity(GO:1904732) |
| 0.3 | 1.3 | GO:1990169 | detoxification of copper ion(GO:0010273) stress response to copper ion(GO:1990169) |
| 0.3 | 1.3 | GO:0044313 | protein K6-linked deubiquitination(GO:0044313) |
| 0.3 | 0.9 | GO:1904729 | regulation of intestinal cholesterol absorption(GO:0030300) regulation of intestinal lipid absorption(GO:1904729) |
| 0.3 | 1.2 | GO:0000961 | negative regulation of mitochondrial RNA catabolic process(GO:0000961) |
| 0.3 | 1.5 | GO:0010621 | negative regulation of transcription by transcription factor localization(GO:0010621) |
| 0.3 | 0.9 | GO:0050917 | sensory perception of umami taste(GO:0050917) |
| 0.3 | 2.6 | GO:2001023 | regulation of response to drug(GO:2001023) |
| 0.3 | 1.5 | GO:0003199 | endocardial cushion to mesenchymal transition involved in heart valve formation(GO:0003199) |
| 0.3 | 0.6 | GO:0016095 | polyprenol catabolic process(GO:0016095) |
| 0.3 | 1.7 | GO:0006982 | response to lipid hydroperoxide(GO:0006982) |
| 0.3 | 4.9 | GO:0030043 | actin filament fragmentation(GO:0030043) |
| 0.3 | 0.9 | GO:0070407 | oxidation-dependent protein catabolic process(GO:0070407) |
| 0.3 | 0.9 | GO:2001287 | negative regulation of caveolin-mediated endocytosis(GO:2001287) |
| 0.3 | 0.6 | GO:0098904 | regulation of AV node cell action potential(GO:0098904) |
| 0.3 | 0.9 | GO:0030505 | inorganic diphosphate transport(GO:0030505) |
| 0.3 | 2.0 | GO:0045196 | establishment or maintenance of neuroblast polarity(GO:0045196) establishment of neuroblast polarity(GO:0045200) |
| 0.3 | 1.4 | GO:0019626 | short-chain fatty acid catabolic process(GO:0019626) |
| 0.3 | 0.8 | GO:0075509 | receptor-mediated endocytosis of virus by host cell(GO:0019065) endocytosis involved in viral entry into host cell(GO:0075509) |
| 0.3 | 2.7 | GO:0038028 | insulin receptor signaling pathway via phosphatidylinositol 3-kinase(GO:0038028) |
| 0.3 | 1.4 | GO:0019242 | methylglyoxal biosynthetic process(GO:0019242) |
| 0.3 | 1.1 | GO:0009956 | radial pattern formation(GO:0009956) |
| 0.3 | 7.7 | GO:0015812 | gamma-aminobutyric acid transport(GO:0015812) |
| 0.3 | 0.8 | GO:0009216 | purine deoxyribonucleoside triphosphate biosynthetic process(GO:0009216) |
| 0.3 | 1.8 | GO:0046618 | drug export(GO:0046618) |
| 0.3 | 0.5 | GO:0003420 | regulation of growth plate cartilage chondrocyte proliferation(GO:0003420) |
| 0.3 | 2.8 | GO:0021940 | positive regulation of cerebellar granule cell precursor proliferation(GO:0021940) |
| 0.3 | 2.8 | GO:0046959 | habituation(GO:0046959) |
| 0.3 | 0.5 | GO:1904578 | response to thapsigargin(GO:1904578) cellular response to thapsigargin(GO:1904579) |
| 0.3 | 3.5 | GO:0070327 | thyroid hormone transport(GO:0070327) |
| 0.2 | 1.7 | GO:1902669 | positive regulation of axon guidance(GO:1902669) |
| 0.2 | 0.5 | GO:0014050 | negative regulation of glutamate secretion(GO:0014050) |
| 0.2 | 1.0 | GO:0048627 | myoblast development(GO:0048627) |
| 0.2 | 1.7 | GO:0050916 | sensory perception of sweet taste(GO:0050916) |
| 0.2 | 0.7 | GO:0003050 | regulation of systemic arterial blood pressure by atrial natriuretic peptide(GO:0003050) |
| 0.2 | 1.4 | GO:0042776 | mitochondrial ATP synthesis coupled proton transport(GO:0042776) |
| 0.2 | 1.4 | GO:0021633 | optic nerve structural organization(GO:0021633) |
| 0.2 | 0.7 | GO:0090675 | intermicrovillar adhesion(GO:0090675) |
| 0.2 | 0.7 | GO:1900154 | regulation of bone trabecula formation(GO:1900154) negative regulation of bone trabecula formation(GO:1900155) |
| 0.2 | 1.4 | GO:0032000 | positive regulation of fatty acid beta-oxidation(GO:0032000) |
| 0.2 | 2.3 | GO:0019276 | UDP-N-acetylgalactosamine metabolic process(GO:0019276) |
| 0.2 | 0.7 | GO:0003365 | establishment of cell polarity involved in ameboidal cell migration(GO:0003365) |
| 0.2 | 0.7 | GO:0071206 | establishment of protein localization to juxtaparanode region of axon(GO:0071206) |
| 0.2 | 2.8 | GO:0045329 | carnitine biosynthetic process(GO:0045329) |
| 0.2 | 1.5 | GO:0006543 | glutamine catabolic process(GO:0006543) |
| 0.2 | 1.7 | GO:0071918 | urea transmembrane transport(GO:0071918) |
| 0.2 | 1.3 | GO:0046440 | L-lysine catabolic process to acetyl-CoA(GO:0019474) L-lysine catabolic process(GO:0019477) L-lysine metabolic process(GO:0046440) |
| 0.2 | 2.5 | GO:0001886 | endothelial cell morphogenesis(GO:0001886) |
| 0.2 | 1.3 | GO:0070086 | ubiquitin-dependent endocytosis(GO:0070086) |
| 0.2 | 0.6 | GO:0015881 | creatine transport(GO:0015881) creatine transmembrane transport(GO:1902598) |
| 0.2 | 1.5 | GO:0032439 | endosome localization(GO:0032439) |
| 0.2 | 1.9 | GO:0006729 | tetrahydrobiopterin biosynthetic process(GO:0006729) tetrahydrobiopterin metabolic process(GO:0046146) |
| 0.2 | 0.6 | GO:0009386 | translational attenuation(GO:0009386) |
| 0.2 | 0.8 | GO:0042412 | taurine biosynthetic process(GO:0042412) |
| 0.2 | 1.2 | GO:0032971 | regulation of muscle filament sliding(GO:0032971) |
| 0.2 | 2.0 | GO:0051549 | positive regulation of keratinocyte migration(GO:0051549) |
| 0.2 | 1.6 | GO:0038033 | positive regulation of endothelial cell chemotaxis by VEGF-activated vascular endothelial growth factor receptor signaling pathway(GO:0038033) |
| 0.2 | 2.0 | GO:0035995 | detection of muscle stretch(GO:0035995) |
| 0.2 | 1.2 | GO:1900220 | semaphorin-plexin signaling pathway involved in bone trabecula morphogenesis(GO:1900220) |
| 0.2 | 3.4 | GO:0016264 | gap junction assembly(GO:0016264) |
| 0.2 | 1.4 | GO:0048630 | skeletal muscle tissue growth(GO:0048630) |
| 0.2 | 0.6 | GO:0045925 | positive regulation of female receptivity(GO:0045925) |
| 0.2 | 0.6 | GO:0019364 | NADP catabolic process(GO:0006742) pyridine nucleotide catabolic process(GO:0019364) |
| 0.2 | 1.2 | GO:0018916 | nitrobenzene metabolic process(GO:0018916) |
| 0.2 | 0.6 | GO:0001300 | chronological cell aging(GO:0001300) |
| 0.2 | 2.0 | GO:0043589 | skin morphogenesis(GO:0043589) |
| 0.2 | 1.6 | GO:0042904 | 9-cis-retinoic acid biosynthetic process(GO:0042904) 9-cis-retinoic acid metabolic process(GO:0042905) |
| 0.2 | 6.7 | GO:0014850 | response to muscle activity(GO:0014850) |
| 0.2 | 1.4 | GO:0002933 | lipid hydroxylation(GO:0002933) |
| 0.2 | 2.9 | GO:0071257 | cellular response to electrical stimulus(GO:0071257) |
| 0.2 | 1.4 | GO:0071279 | cellular response to cobalt ion(GO:0071279) |
| 0.2 | 2.3 | GO:0072592 | oxygen metabolic process(GO:0072592) |
| 0.2 | 0.6 | GO:0030327 | prenylated protein catabolic process(GO:0030327) |
| 0.2 | 1.2 | GO:0001080 | nitrogen catabolite regulation of transcription from RNA polymerase II promoter(GO:0001079) nitrogen catabolite activation of transcription from RNA polymerase II promoter(GO:0001080) regulation of urea metabolic process(GO:0034255) histone H3-R17 methylation(GO:0034971) intracellular bile acid receptor signaling pathway(GO:0038185) interleukin-17 secretion(GO:0072615) nitrogen catabolite regulation of transcription(GO:0090293) nitrogen catabolite activation of transcription(GO:0090294) regulation of nitrogen cycle metabolic process(GO:1903314) positive regulation of glutamate metabolic process(GO:2000213) regulation of ammonia assimilation cycle(GO:2001248) positive regulation of ammonia assimilation cycle(GO:2001250) |
| 0.2 | 2.7 | GO:0021859 | pyramidal neuron differentiation(GO:0021859) |
| 0.2 | 0.6 | GO:0019442 | tryptophan catabolic process to acetyl-CoA(GO:0019442) |
| 0.2 | 0.2 | GO:0000957 | mitochondrial RNA catabolic process(GO:0000957) regulation of mitochondrial RNA catabolic process(GO:0000960) |
| 0.2 | 5.5 | GO:0022010 | central nervous system myelination(GO:0022010) axon ensheathment in central nervous system(GO:0032291) |
| 0.2 | 3.0 | GO:0071688 | striated muscle myosin thick filament assembly(GO:0071688) |
| 0.2 | 2.1 | GO:0036072 | intramembranous ossification(GO:0001957) direct ossification(GO:0036072) |
| 0.2 | 0.9 | GO:0044858 | plasma membrane raft distribution(GO:0044855) plasma membrane raft localization(GO:0044856) plasma membrane raft polarization(GO:0044858) renal protein absorption(GO:0097017) regulation of plasma membrane raft polarization(GO:1903906) |
| 0.2 | 0.5 | GO:0060459 | subthalamus development(GO:0021539) subthalamic nucleus development(GO:0021763) prolactin secreting cell differentiation(GO:0060127) left lung development(GO:0060459) left lung morphogenesis(GO:0060460) superior vena cava morphogenesis(GO:0060578) |
| 0.2 | 0.9 | GO:0038091 | VEGF-activated platelet-derived growth factor receptor signaling pathway(GO:0038086) positive regulation of cell proliferation by VEGF-activated platelet derived growth factor receptor signaling pathway(GO:0038091) |
| 0.2 | 1.1 | GO:0060370 | susceptibility to T cell mediated cytotoxicity(GO:0060370) |
| 0.2 | 0.4 | GO:0070101 | positive regulation of chemokine-mediated signaling pathway(GO:0070101) |
| 0.2 | 0.9 | GO:0071504 | cellular response to heparin(GO:0071504) |
| 0.2 | 1.1 | GO:2000672 | negative regulation of motor neuron apoptotic process(GO:2000672) |
| 0.2 | 0.5 | GO:0090381 | cardiac cell fate determination(GO:0060913) cardiac vascular smooth muscle cell differentiation(GO:0060947) regulation of heart induction(GO:0090381) regulation of heart induction by canonical Wnt signaling pathway(GO:0100012) |
| 0.2 | 1.4 | GO:0045918 | negative regulation of cytolysis(GO:0045918) |
| 0.2 | 0.9 | GO:0060214 | stem cell fate commitment(GO:0048865) endocardium formation(GO:0060214) |
| 0.2 | 1.9 | GO:1901166 | trunk segmentation(GO:0035290) trunk neural crest cell migration(GO:0036484) ventral trunk neural crest cell migration(GO:0036486) neural crest cell migration involved in autonomic nervous system development(GO:1901166) |
| 0.2 | 5.3 | GO:0032060 | bleb assembly(GO:0032060) |
| 0.2 | 0.5 | GO:2000097 | regulation of smooth muscle cell-matrix adhesion(GO:2000097) |
| 0.2 | 0.7 | GO:0070681 | glutaminyl-tRNAGln biosynthesis via transamidation(GO:0070681) |
| 0.2 | 0.8 | GO:0060244 | negative regulation of cell proliferation involved in contact inhibition(GO:0060244) |
| 0.2 | 0.8 | GO:0001994 | norepinephrine-epinephrine vasoconstriction involved in regulation of systemic arterial blood pressure(GO:0001994) |
| 0.2 | 0.7 | GO:0090107 | regulation of high-density lipoprotein particle assembly(GO:0090107) |
| 0.2 | 0.5 | GO:1901253 | negative regulation of intracellular transport of viral material(GO:1901253) |
| 0.2 | 0.8 | GO:1903070 | negative regulation of ER-associated ubiquitin-dependent protein catabolic process(GO:1903070) |
| 0.2 | 2.9 | GO:0035878 | nail development(GO:0035878) |
| 0.2 | 0.5 | GO:0035054 | embryonic heart tube anterior/posterior pattern specification(GO:0035054) |
| 0.2 | 1.9 | GO:0045792 | negative regulation of cell size(GO:0045792) |
| 0.2 | 0.6 | GO:1902310 | positive regulation of peptidyl-serine dephosphorylation(GO:1902310) |
| 0.2 | 0.3 | GO:0010643 | cell communication by chemical coupling(GO:0010643) |
| 0.2 | 1.3 | GO:0036324 | vascular endothelial growth factor receptor-2 signaling pathway(GO:0036324) |
| 0.2 | 0.5 | GO:0035759 | mesangial cell-matrix adhesion(GO:0035759) |
| 0.2 | 2.3 | GO:1990573 | potassium ion import across plasma membrane(GO:1990573) |
| 0.2 | 0.9 | GO:0050915 | sensory perception of sour taste(GO:0050915) |
| 0.2 | 0.5 | GO:0060447 | bud outgrowth involved in lung branching(GO:0060447) mesenchymal-epithelial cell signaling involved in prostate gland development(GO:0060739) |
| 0.2 | 0.5 | GO:0031247 | actin rod assembly(GO:0031247) |
| 0.2 | 1.4 | GO:0021564 | vagus nerve development(GO:0021564) |
| 0.2 | 3.3 | GO:0045162 | clustering of voltage-gated sodium channels(GO:0045162) |
| 0.2 | 0.6 | GO:0016115 | diterpenoid catabolic process(GO:0016103) terpenoid catabolic process(GO:0016115) retinoic acid catabolic process(GO:0034653) |
| 0.1 | 0.3 | GO:0043449 | cellular alkene metabolic process(GO:0043449) |
| 0.1 | 1.5 | GO:0019720 | Mo-molybdopterin cofactor biosynthetic process(GO:0006777) Mo-molybdopterin cofactor metabolic process(GO:0019720) |
| 0.1 | 0.4 | GO:0030240 | skeletal muscle thin filament assembly(GO:0030240) |
| 0.1 | 0.7 | GO:0046439 | cysteine catabolic process(GO:0009093) L-cysteine catabolic process(GO:0019448) L-cysteine metabolic process(GO:0046439) |
| 0.1 | 0.9 | GO:0090611 | ubiquitin-independent protein catabolic process via the multivesicular body sorting pathway(GO:0090611) |
| 0.1 | 1.6 | GO:0071073 | positive regulation of phospholipid biosynthetic process(GO:0071073) |
| 0.1 | 0.9 | GO:0048669 | collateral sprouting in absence of injury(GO:0048669) |
| 0.1 | 1.0 | GO:0072103 | glomerulus vasculature morphogenesis(GO:0072103) glomerular capillary formation(GO:0072104) |
| 0.1 | 0.4 | GO:0034378 | chylomicron assembly(GO:0034378) |
| 0.1 | 0.3 | GO:1904616 | regulation of actin filament binding(GO:1904529) regulation of actin binding(GO:1904616) |
| 0.1 | 1.3 | GO:0051005 | negative regulation of lipoprotein lipase activity(GO:0051005) |
| 0.1 | 0.9 | GO:0007217 | tachykinin receptor signaling pathway(GO:0007217) |
| 0.1 | 0.9 | GO:0044829 | positive regulation by host of viral genome replication(GO:0044829) |
| 0.1 | 2.8 | GO:0060973 | cell migration involved in heart development(GO:0060973) |
| 0.1 | 1.3 | GO:0010890 | positive regulation of sequestering of triglyceride(GO:0010890) |
| 0.1 | 0.3 | GO:0006550 | isoleucine catabolic process(GO:0006550) |
| 0.1 | 1.9 | GO:1903142 | positive regulation of endothelial cell development(GO:1901552) positive regulation of establishment of endothelial barrier(GO:1903142) |
| 0.1 | 4.2 | GO:0070584 | mitochondrion morphogenesis(GO:0070584) |
| 0.1 | 7.4 | GO:0032958 | inositol phosphate biosynthetic process(GO:0032958) |
| 0.1 | 0.6 | GO:1902463 | protein localization to cell leading edge(GO:1902463) |
| 0.1 | 1.0 | GO:0034316 | negative regulation of Arp2/3 complex-mediated actin nucleation(GO:0034316) |
| 0.1 | 5.1 | GO:0003298 | physiological muscle hypertrophy(GO:0003298) physiological cardiac muscle hypertrophy(GO:0003301) cell growth involved in cardiac muscle cell development(GO:0061049) |
| 0.1 | 0.6 | GO:0036116 | medium-chain fatty-acyl-CoA catabolic process(GO:0036114) long-chain fatty-acyl-CoA catabolic process(GO:0036116) palmitic acid metabolic process(GO:1900533) palmitic acid biosynthetic process(GO:1900535) |
| 0.1 | 0.7 | GO:0034436 | glycoprotein transport(GO:0034436) |
| 0.1 | 0.3 | GO:0014034 | neural crest cell fate commitment(GO:0014034) |
| 0.1 | 3.3 | GO:1900745 | positive regulation of p38MAPK cascade(GO:1900745) |
| 0.1 | 3.2 | GO:0008090 | retrograde axonal transport(GO:0008090) |
| 0.1 | 0.7 | GO:0032097 | positive regulation of response to food(GO:0032097) positive regulation of appetite(GO:0032100) |
| 0.1 | 0.7 | GO:0035645 | enteric smooth muscle cell differentiation(GO:0035645) |
| 0.1 | 1.2 | GO:1902261 | positive regulation of delayed rectifier potassium channel activity(GO:1902261) |
| 0.1 | 2.2 | GO:0098712 | L-glutamate import across plasma membrane(GO:0098712) |
| 0.1 | 1.2 | GO:0086073 | cardiac muscle cell-cardiac muscle cell adhesion(GO:0086042) bundle of His cell-Purkinje myocyte adhesion involved in cell communication(GO:0086073) |
| 0.1 | 2.3 | GO:1904322 | response to forskolin(GO:1904321) cellular response to forskolin(GO:1904322) |
| 0.1 | 0.5 | GO:1990166 | protein localization to site of double-strand break(GO:1990166) |
| 0.1 | 1.2 | GO:0051725 | protein de-ADP-ribosylation(GO:0051725) |
| 0.1 | 1.6 | GO:0035864 | response to potassium ion(GO:0035864) |
| 0.1 | 0.5 | GO:0048105 | establishment of body hair or bristle planar orientation(GO:0048104) establishment of body hair planar orientation(GO:0048105) |
| 0.1 | 0.7 | GO:0033058 | directional locomotion(GO:0033058) |
| 0.1 | 1.4 | GO:0070560 | protein secretion by platelet(GO:0070560) |
| 0.1 | 2.1 | GO:0042420 | dopamine catabolic process(GO:0042420) |
| 0.1 | 0.5 | GO:0021827 | cerebral cortex tangential migration using cell-cell interactions(GO:0021823) substrate-dependent cerebral cortex tangential migration(GO:0021825) postnatal olfactory bulb interneuron migration(GO:0021827) chemorepulsion involved in postnatal olfactory bulb interneuron migration(GO:0021836) |
| 0.1 | 2.1 | GO:0061302 | smooth muscle cell-matrix adhesion(GO:0061302) |
| 0.1 | 0.6 | GO:0072434 | signal transduction involved in G2 DNA damage checkpoint(GO:0072425) signal transduction involved in mitotic G2 DNA damage checkpoint(GO:0072434) |
| 0.1 | 0.1 | GO:0061443 | endocardial cushion cell differentiation(GO:0061443) |
| 0.1 | 0.5 | GO:0072287 | metanephric distal tubule morphogenesis(GO:0072287) |
| 0.1 | 1.5 | GO:0034392 | negative regulation of smooth muscle cell apoptotic process(GO:0034392) |
| 0.1 | 0.6 | GO:1902573 | positive regulation of serine-type endopeptidase activity(GO:1900005) positive regulation of serine-type peptidase activity(GO:1902573) |
| 0.1 | 1.5 | GO:0034374 | low-density lipoprotein particle remodeling(GO:0034374) |
| 0.1 | 0.8 | GO:0019919 | peptidyl-arginine methylation, to asymmetrical-dimethyl arginine(GO:0019919) |
| 0.1 | 0.4 | GO:0090131 | mesenchyme migration(GO:0090131) |
| 0.1 | 0.4 | GO:0050760 | negative regulation of thymidylate synthase biosynthetic process(GO:0050760) |
| 0.1 | 0.4 | GO:0042369 | vitamin D catabolic process(GO:0042369) |
| 0.1 | 0.6 | GO:0038089 | positive regulation of cell migration by vascular endothelial growth factor signaling pathway(GO:0038089) |
| 0.1 | 0.6 | GO:2000465 | regulation of glycogen (starch) synthase activity(GO:2000465) |
| 0.1 | 1.9 | GO:0015886 | heme transport(GO:0015886) |
| 0.1 | 0.8 | GO:0034499 | late endosome to Golgi transport(GO:0034499) |
| 0.1 | 0.6 | GO:0023019 | signal transduction involved in regulation of gene expression(GO:0023019) |
| 0.1 | 4.1 | GO:0016338 | calcium-independent cell-cell adhesion via plasma membrane cell-adhesion molecules(GO:0016338) |
| 0.1 | 0.4 | GO:0018894 | dibenzo-p-dioxin metabolic process(GO:0018894) |
| 0.1 | 0.7 | GO:0016185 | synaptic vesicle budding from presynaptic endocytic zone membrane(GO:0016185) |
| 0.1 | 1.1 | GO:0046726 | positive regulation by virus of viral protein levels in host cell(GO:0046726) |
| 0.1 | 1.2 | GO:0008063 | Toll signaling pathway(GO:0008063) |
| 0.1 | 0.5 | GO:0044240 | multicellular organism lipid catabolic process(GO:0044240) |
| 0.1 | 0.2 | GO:0044691 | tooth eruption(GO:0044691) |
| 0.1 | 0.5 | GO:0003221 | right ventricular cardiac muscle tissue morphogenesis(GO:0003221) |
| 0.1 | 2.0 | GO:0051601 | exocyst localization(GO:0051601) |
| 0.1 | 0.6 | GO:0045356 | positive regulation of interferon-alpha biosynthetic process(GO:0045356) |
| 0.1 | 2.5 | GO:2000766 | negative regulation of cytoplasmic translation(GO:2000766) |
| 0.1 | 0.2 | GO:2000276 | negative regulation of oxidative phosphorylation uncoupler activity(GO:2000276) |
| 0.1 | 0.6 | GO:0007206 | phospholipase C-activating G-protein coupled glutamate receptor signaling pathway(GO:0007206) |
| 0.1 | 0.9 | GO:0070164 | negative regulation of adiponectin secretion(GO:0070164) |
| 0.1 | 0.6 | GO:1903288 | regulation of sodium ion export(GO:1903273) positive regulation of sodium ion export(GO:1903275) regulation of sodium ion export from cell(GO:1903276) positive regulation of sodium ion export from cell(GO:1903278) positive regulation of potassium ion import(GO:1903288) |
| 0.1 | 0.7 | GO:0060754 | positive regulation of mast cell chemotaxis(GO:0060754) |
| 0.1 | 3.5 | GO:0006750 | glutathione biosynthetic process(GO:0006750) |
| 0.1 | 1.3 | GO:0006621 | protein retention in ER lumen(GO:0006621) |
| 0.1 | 0.6 | GO:0030070 | insulin processing(GO:0030070) |
| 0.1 | 2.1 | GO:0090361 | platelet-derived growth factor production(GO:0090360) regulation of platelet-derived growth factor production(GO:0090361) |
| 0.1 | 1.2 | GO:0099563 | modification of synaptic structure(GO:0099563) |
| 0.1 | 2.6 | GO:0045725 | positive regulation of glycogen biosynthetic process(GO:0045725) |
| 0.1 | 0.6 | GO:0097056 | selenocysteinyl-tRNA(Sec) biosynthetic process(GO:0097056) |
| 0.1 | 0.9 | GO:0055011 | atrial cardiac muscle cell differentiation(GO:0055011) atrial cardiac muscle cell development(GO:0055014) |
| 0.1 | 0.7 | GO:1901911 | diadenosine polyphosphate catabolic process(GO:0015961) diphosphoinositol polyphosphate metabolic process(GO:0071543) diadenosine pentaphosphate metabolic process(GO:1901906) diadenosine pentaphosphate catabolic process(GO:1901907) diadenosine hexaphosphate metabolic process(GO:1901908) diadenosine hexaphosphate catabolic process(GO:1901909) adenosine 5'-(hexahydrogen pentaphosphate) metabolic process(GO:1901910) adenosine 5'-(hexahydrogen pentaphosphate) catabolic process(GO:1901911) |
| 0.1 | 0.5 | GO:0006102 | isocitrate metabolic process(GO:0006102) |
| 0.1 | 0.9 | GO:0008050 | female courtship behavior(GO:0008050) |
| 0.1 | 0.4 | GO:0018262 | isopeptide cross-linking via N6-(L-isoglutamyl)-L-lysine(GO:0018153) isopeptide cross-linking(GO:0018262) |
| 0.1 | 0.9 | GO:1904879 | positive regulation of calcium ion transmembrane transport via high voltage-gated calcium channel(GO:1904879) |
| 0.1 | 0.4 | GO:2000381 | negative regulation of mesoderm development(GO:2000381) |
| 0.1 | 2.2 | GO:0010510 | regulation of acetyl-CoA biosynthetic process from pyruvate(GO:0010510) regulation of acyl-CoA biosynthetic process(GO:0050812) |
| 0.1 | 2.2 | GO:0007216 | G-protein coupled glutamate receptor signaling pathway(GO:0007216) |
| 0.1 | 0.4 | GO:1901143 | insulin catabolic process(GO:1901143) |
| 0.1 | 1.4 | GO:0031339 | negative regulation of vesicle fusion(GO:0031339) |
| 0.1 | 0.6 | GO:0006574 | valine catabolic process(GO:0006574) |
| 0.1 | 0.7 | GO:0048739 | cardiac muscle fiber development(GO:0048739) |
| 0.1 | 0.5 | GO:0061502 | early endosome to recycling endosome transport(GO:0061502) |
| 0.1 | 0.9 | GO:0034384 | high-density lipoprotein particle clearance(GO:0034384) |
| 0.1 | 2.7 | GO:0048681 | negative regulation of axon regeneration(GO:0048681) |
| 0.1 | 0.5 | GO:1903961 | positive regulation of anion channel activity(GO:1901529) positive regulation of anion transmembrane transport(GO:1903961) |
| 0.1 | 1.7 | GO:0070389 | chaperone cofactor-dependent protein refolding(GO:0070389) |
| 0.1 | 2.4 | GO:0008053 | mitochondrial fusion(GO:0008053) |
| 0.1 | 0.2 | GO:0021785 | branchiomotor neuron axon guidance(GO:0021785) |
| 0.1 | 0.3 | GO:0046532 | regulation of photoreceptor cell differentiation(GO:0046532) |
| 0.1 | 1.7 | GO:0072189 | ureter development(GO:0072189) |
| 0.1 | 0.5 | GO:0010040 | response to iron(II) ion(GO:0010040) |
| 0.1 | 1.2 | GO:0035524 | proline transmembrane transport(GO:0035524) |
| 0.1 | 0.9 | GO:0001712 | ectoderm formation(GO:0001705) ectodermal cell fate commitment(GO:0001712) |
| 0.1 | 1.3 | GO:0043587 | tongue morphogenesis(GO:0043587) |
| 0.1 | 0.4 | GO:0051919 | activation of plasma proteins involved in acute inflammatory response(GO:0002541) positive regulation of fibrinolysis(GO:0051919) |
| 0.1 | 1.2 | GO:0006682 | galactosylceramide biosynthetic process(GO:0006682) galactolipid biosynthetic process(GO:0019375) |
| 0.1 | 0.5 | GO:0060480 | lung goblet cell differentiation(GO:0060480) |
| 0.1 | 1.1 | GO:1990034 | calcium ion export from cell(GO:1990034) |
| 0.1 | 1.4 | GO:1902866 | regulation of retina development in camera-type eye(GO:1902866) |
| 0.1 | 0.8 | GO:0060075 | regulation of resting membrane potential(GO:0060075) |
| 0.1 | 0.2 | GO:0061055 | myotome development(GO:0061055) |
| 0.1 | 1.4 | GO:0097264 | self proteolysis(GO:0097264) |
| 0.1 | 2.0 | GO:0030150 | protein import into mitochondrial matrix(GO:0030150) |
| 0.1 | 0.2 | GO:0001545 | primary ovarian follicle growth(GO:0001545) |
| 0.1 | 0.4 | GO:0021849 | neuroblast division in subventricular zone(GO:0021849) |
| 0.1 | 1.1 | GO:0051451 | myoblast migration(GO:0051451) |
| 0.1 | 0.1 | GO:0018963 | phthalate metabolic process(GO:0018963) |
| 0.1 | 0.4 | GO:1900204 | pronephric field specification(GO:0039003) pattern specification involved in pronephros development(GO:0039017) kidney field specification(GO:0072004) DCT cell differentiation(GO:0072069) metanephric DCT cell differentiation(GO:0072240) metanephric comma-shaped body morphogenesis(GO:0072278) metanephric nephron tubule formation(GO:0072289) regulation of mesenchymal cell apoptotic process involved in metanephric nephron morphogenesis(GO:0072304) negative regulation of mesenchymal cell apoptotic process involved in metanephric nephron morphogenesis(GO:0072305) mesenchymal stem cell maintenance involved in metanephric nephron morphogenesis(GO:0072309) apoptotic process involved in metanephric collecting duct development(GO:1900204) apoptotic process involved in metanephric nephron tubule development(GO:1900205) regulation of apoptotic process involved in metanephric collecting duct development(GO:1900214) negative regulation of apoptotic process involved in metanephric collecting duct development(GO:1900215) regulation of apoptotic process involved in metanephric nephron tubule development(GO:1900217) negative regulation of apoptotic process involved in metanephric nephron tubule development(GO:1900218) mesenchymal cell apoptotic process involved in metanephric nephron morphogenesis(GO:1901147) regulation of metanephric DCT cell differentiation(GO:2000592) positive regulation of metanephric DCT cell differentiation(GO:2000594) |
| 0.1 | 0.2 | GO:0090370 | negative regulation of cholesterol efflux(GO:0090370) |
| 0.1 | 1.4 | GO:0010499 | proteasomal ubiquitin-independent protein catabolic process(GO:0010499) |
| 0.1 | 0.5 | GO:0015766 | disaccharide transport(GO:0015766) sucrose transport(GO:0015770) oligosaccharide transport(GO:0015772) |
| 0.1 | 0.8 | GO:0048672 | positive regulation of collateral sprouting(GO:0048672) |
| 0.1 | 0.6 | GO:0045919 | positive regulation of cytolysis(GO:0045919) |
| 0.1 | 2.0 | GO:0019800 | peptide cross-linking via chondroitin 4-sulfate glycosaminoglycan(GO:0019800) |
| 0.1 | 1.0 | GO:0010739 | positive regulation of protein kinase A signaling(GO:0010739) |
| 0.1 | 0.7 | GO:0000066 | mitochondrial ornithine transport(GO:0000066) |
| 0.1 | 0.2 | GO:0060003 | copper ion export(GO:0060003) |
| 0.1 | 0.4 | GO:0044376 | RNA polymerase II complex import to nucleus(GO:0044376) RNA polymerase III complex localization to nucleus(GO:1990022) |
| 0.1 | 2.6 | GO:0006744 | ubiquinone biosynthetic process(GO:0006744) quinone biosynthetic process(GO:1901663) |
| 0.1 | 0.2 | GO:1903722 | regulation of centriole elongation(GO:1903722) |
| 0.1 | 1.0 | GO:0032782 | bile acid secretion(GO:0032782) |
| 0.1 | 1.4 | GO:0006600 | creatine metabolic process(GO:0006600) |
| 0.1 | 1.1 | GO:0042448 | progesterone metabolic process(GO:0042448) |
| 0.1 | 0.3 | GO:0009786 | regulation of asymmetric cell division(GO:0009786) |
| 0.1 | 0.2 | GO:0048213 | Golgi vesicle prefusion complex stabilization(GO:0048213) |
| 0.1 | 1.1 | GO:0006662 | glycerol ether metabolic process(GO:0006662) |
| 0.1 | 1.1 | GO:0086067 | AV node cell action potential(GO:0086016) AV node cell to bundle of His cell signaling(GO:0086027) AV node cell to bundle of His cell communication(GO:0086067) |
| 0.1 | 0.7 | GO:0030242 | pexophagy(GO:0030242) |
| 0.1 | 2.3 | GO:0043162 | ubiquitin-dependent protein catabolic process via the multivesicular body sorting pathway(GO:0043162) |
| 0.1 | 0.4 | GO:0038170 | somatostatin receptor signaling pathway(GO:0038169) somatostatin signaling pathway(GO:0038170) |
| 0.1 | 0.6 | GO:0006741 | NADP biosynthetic process(GO:0006741) |
| 0.1 | 3.9 | GO:0016339 | calcium-dependent cell-cell adhesion via plasma membrane cell adhesion molecules(GO:0016339) |
| 0.1 | 0.2 | GO:0051877 | pigment granule aggregation in cell center(GO:0051877) |
| 0.1 | 0.3 | GO:0090301 | regulation of neural crest formation(GO:0090299) negative regulation of neural crest formation(GO:0090301) negative regulation of fibroblast growth factor receptor signaling pathway involved in neural plate anterior/posterior pattern formation(GO:2000314) |
| 0.1 | 0.2 | GO:0090134 | mesendoderm migration(GO:0090133) cell migration involved in mesendoderm migration(GO:0090134) |
| 0.1 | 0.4 | GO:2000418 | positive regulation of eosinophil migration(GO:2000418) |
| 0.1 | 1.0 | GO:0021902 | commitment of neuronal cell to specific neuron type in forebrain(GO:0021902) |
| 0.1 | 1.3 | GO:0019388 | galactose catabolic process(GO:0019388) |
| 0.1 | 0.5 | GO:0044333 | Wnt signaling pathway involved in digestive tract morphogenesis(GO:0044333) |
| 0.1 | 0.8 | GO:2000346 | negative regulation of hepatocyte proliferation(GO:2000346) |
| 0.1 | 0.2 | GO:0031033 | myosin filament organization(GO:0031033) |
| 0.1 | 0.5 | GO:0044210 | 'de novo' CTP biosynthetic process(GO:0044210) |
| 0.1 | 1.9 | GO:0009083 | branched-chain amino acid catabolic process(GO:0009083) |
| 0.1 | 0.2 | GO:0006059 | hexitol metabolic process(GO:0006059) |
| 0.1 | 2.4 | GO:0019372 | lipoxygenase pathway(GO:0019372) |
| 0.1 | 0.4 | GO:2000969 | positive regulation of alpha-amino-3-hydroxy-5-methyl-4-isoxazole propionate selective glutamate receptor activity(GO:2000969) |
| 0.1 | 2.1 | GO:0006646 | phosphatidylethanolamine biosynthetic process(GO:0006646) |
| 0.1 | 0.1 | GO:0036215 | response to stem cell factor(GO:0036215) cellular response to stem cell factor stimulus(GO:0036216) Kit signaling pathway(GO:0038109) |
| 0.1 | 1.1 | GO:0097107 | postsynaptic density organization(GO:0097106) postsynaptic density assembly(GO:0097107) gephyrin clustering involved in postsynaptic density assembly(GO:0097116) |
| 0.1 | 0.2 | GO:0010760 | negative regulation of macrophage chemotaxis(GO:0010760) |
| 0.1 | 0.4 | GO:1903385 | regulation of homophilic cell adhesion(GO:1903385) |
| 0.1 | 0.4 | GO:0060011 | Sertoli cell proliferation(GO:0060011) |
| 0.1 | 0.6 | GO:0006072 | glycerol-3-phosphate metabolic process(GO:0006072) |
| 0.1 | 0.5 | GO:0070358 | actin polymerization-dependent cell motility(GO:0070358) |
| 0.1 | 1.6 | GO:0007021 | tubulin complex assembly(GO:0007021) |
| 0.1 | 1.5 | GO:0006833 | water transport(GO:0006833) |
| 0.1 | 2.4 | GO:0048012 | hepatocyte growth factor receptor signaling pathway(GO:0048012) |
| 0.1 | 0.6 | GO:0061343 | cell adhesion involved in heart morphogenesis(GO:0061343) |
| 0.1 | 0.5 | GO:0051581 | negative regulation of neurotransmitter uptake(GO:0051581) regulation of serotonin uptake(GO:0051611) negative regulation of serotonin uptake(GO:0051612) |
| 0.1 | 1.1 | GO:0006030 | chitin metabolic process(GO:0006030) chitin catabolic process(GO:0006032) |
| 0.1 | 0.4 | GO:0050747 | positive regulation of lipoprotein metabolic process(GO:0050747) |
| 0.1 | 0.9 | GO:0018095 | protein polyglutamylation(GO:0018095) |
| 0.1 | 1.5 | GO:0009313 | oligosaccharide catabolic process(GO:0009313) |
| 0.1 | 1.6 | GO:0006853 | carnitine shuttle(GO:0006853) |
| 0.1 | 0.2 | GO:0035570 | N-terminal peptidyl-alanine methylation(GO:0018011) N-terminal peptidyl-alanine trimethylation(GO:0018012) N-terminal peptidyl-glycine methylation(GO:0018013) N-terminal peptidyl-proline dimethylation(GO:0018016) peptidyl-alanine modification(GO:0018194) N-terminal peptidyl-proline methylation(GO:0035568) N-terminal peptidyl-serine methylation(GO:0035570) N-terminal peptidyl-serine dimethylation(GO:0035572) N-terminal peptidyl-serine trimethylation(GO:0035573) |
| 0.1 | 1.0 | GO:0019532 | oxalate transport(GO:0019532) |
| 0.1 | 0.3 | GO:0010248 | establishment or maintenance of transmembrane electrochemical gradient(GO:0010248) |
| 0.1 | 0.8 | GO:0032482 | Rab protein signal transduction(GO:0032482) |
| 0.1 | 0.6 | GO:1904896 | ESCRT complex disassembly(GO:1904896) ESCRT III complex disassembly(GO:1904903) |
| 0.1 | 0.3 | GO:0033122 | negative regulation of cyclic nucleotide catabolic process(GO:0030806) negative regulation of cAMP catabolic process(GO:0030821) negative regulation of purine nucleotide catabolic process(GO:0033122) |
| 0.1 | 0.5 | GO:0043985 | histone H4-R3 methylation(GO:0043985) |
| 0.1 | 1.2 | GO:0035810 | positive regulation of urine volume(GO:0035810) |
| 0.1 | 0.3 | GO:0035426 | extracellular matrix-cell signaling(GO:0035426) |
| 0.1 | 0.4 | GO:0060040 | retinal bipolar neuron differentiation(GO:0060040) |
| 0.1 | 1.1 | GO:0038003 | opioid receptor signaling pathway(GO:0038003) |
| 0.1 | 0.3 | GO:0006045 | N-acetylglucosamine biosynthetic process(GO:0006045) glucosamine-containing compound biosynthetic process(GO:1901073) |
| 0.1 | 0.6 | GO:0060056 | mammary gland involution(GO:0060056) |
| 0.1 | 0.3 | GO:0035498 | carnosine metabolic process(GO:0035498) |
| 0.1 | 1.1 | GO:0033561 | regulation of water loss via skin(GO:0033561) |
| 0.1 | 0.3 | GO:1904048 | regulation of spontaneous neurotransmitter secretion(GO:1904048) |
| 0.1 | 0.1 | GO:2000439 | positive regulation of monocyte extravasation(GO:2000439) |
| 0.1 | 0.3 | GO:1903974 | mammary gland fat development(GO:0060611) regulation of macrophage colony-stimulating factor signaling pathway(GO:1902226) positive regulation of macrophage colony-stimulating factor signaling pathway(GO:1902228) regulation of response to macrophage colony-stimulating factor(GO:1903969) positive regulation of response to macrophage colony-stimulating factor(GO:1903971) regulation of cellular response to macrophage colony-stimulating factor stimulus(GO:1903972) positive regulation of cellular response to macrophage colony-stimulating factor stimulus(GO:1903974) positive regulation of microglial cell migration(GO:1904141) |
| 0.1 | 0.6 | GO:0071926 | endocannabinoid signaling pathway(GO:0071926) regulation of endocannabinoid signaling pathway(GO:2000124) |
| 0.1 | 1.6 | GO:0046069 | cGMP catabolic process(GO:0046069) |
| 0.1 | 0.8 | GO:0006384 | transcription initiation from RNA polymerase III promoter(GO:0006384) |
| 0.1 | 0.5 | GO:0043569 | negative regulation of insulin-like growth factor receptor signaling pathway(GO:0043569) |
| 0.1 | 0.4 | GO:0031944 | negative regulation of glucocorticoid metabolic process(GO:0031944) negative regulation of glucocorticoid biosynthetic process(GO:0031947) negative regulation of aldosterone metabolic process(GO:0032345) negative regulation of aldosterone biosynthetic process(GO:0032348) negative regulation of steroid hormone biosynthetic process(GO:0090032) negative regulation of cortisol biosynthetic process(GO:2000065) |
| 0.1 | 0.2 | GO:1902530 | regulation of protein linear polyubiquitination(GO:1902528) positive regulation of protein linear polyubiquitination(GO:1902530) |
| 0.1 | 3.0 | GO:0006783 | heme biosynthetic process(GO:0006783) |
| 0.1 | 0.2 | GO:0099566 | regulation of postsynaptic cytosolic calcium ion concentration(GO:0099566) |
| 0.1 | 0.5 | GO:0043615 | astrocyte cell migration(GO:0043615) |
| 0.1 | 0.7 | GO:0048251 | elastic fiber assembly(GO:0048251) |
| 0.1 | 2.7 | GO:0060314 | regulation of ryanodine-sensitive calcium-release channel activity(GO:0060314) |
| 0.1 | 0.8 | GO:0099525 | presynaptic dense core granule exocytosis(GO:0099525) |
| 0.1 | 1.0 | GO:0051823 | regulation of synapse structural plasticity(GO:0051823) |
| 0.1 | 1.9 | GO:0015695 | organic cation transport(GO:0015695) |
| 0.1 | 1.6 | GO:0050482 | arachidonic acid secretion(GO:0050482) arachidonate transport(GO:1903963) |
| 0.1 | 0.3 | GO:0021615 | glossopharyngeal nerve morphogenesis(GO:0021615) |
| 0.1 | 0.2 | GO:0035853 | chromosome passenger complex localization to spindle midzone(GO:0035853) |
| 0.1 | 0.4 | GO:0021914 | negative regulation of smoothened signaling pathway involved in ventral spinal cord patterning(GO:0021914) |
| 0.1 | 0.2 | GO:1900452 | regulation of long term synaptic depression(GO:1900452) |
| 0.1 | 3.3 | GO:0007214 | gamma-aminobutyric acid signaling pathway(GO:0007214) |
| 0.1 | 0.3 | GO:0045617 | negative regulation of keratinocyte differentiation(GO:0045617) |
| 0.1 | 1.5 | GO:0007016 | cytoskeletal anchoring at plasma membrane(GO:0007016) |
| 0.1 | 0.2 | GO:0051458 | corticotropin secretion(GO:0051458) |
| 0.1 | 0.3 | GO:1903026 | negative regulation of RNA polymerase II regulatory region sequence-specific DNA binding(GO:1903026) |
| 0.1 | 0.5 | GO:0048014 | Tie signaling pathway(GO:0048014) |
| 0.1 | 0.9 | GO:0031115 | negative regulation of microtubule polymerization(GO:0031115) |
| 0.1 | 0.4 | GO:0035093 | spermatogenesis, exchange of chromosomal proteins(GO:0035093) |
| 0.1 | 0.1 | GO:0003099 | positive regulation of the force of heart contraction by chemical signal(GO:0003099) |
| 0.1 | 3.1 | GO:0015949 | nucleobase-containing small molecule interconversion(GO:0015949) |
| 0.1 | 0.2 | GO:1903576 | response to L-arginine(GO:1903576) |
| 0.1 | 0.7 | GO:0045078 | positive regulation of interferon-gamma biosynthetic process(GO:0045078) |
| 0.1 | 2.7 | GO:0045773 | positive regulation of axon extension(GO:0045773) |
| 0.1 | 0.9 | GO:0016576 | histone dephosphorylation(GO:0016576) |
| 0.1 | 1.6 | GO:0010832 | negative regulation of myotube differentiation(GO:0010832) |
| 0.0 | 0.1 | GO:0009631 | cold acclimation(GO:0009631) |
| 0.0 | 0.5 | GO:0031643 | positive regulation of myelination(GO:0031643) |
| 0.0 | 1.4 | GO:0001502 | cartilage condensation(GO:0001502) |
| 0.0 | 0.6 | GO:0036309 | protein localization to M-band(GO:0036309) |
| 0.0 | 1.1 | GO:0070262 | peptidyl-serine dephosphorylation(GO:0070262) |
| 0.0 | 0.2 | GO:0061086 | negative regulation of histone H3-K27 methylation(GO:0061086) |
| 0.0 | 2.9 | GO:0003009 | skeletal muscle contraction(GO:0003009) |
| 0.0 | 0.7 | GO:0038007 | netrin-activated signaling pathway(GO:0038007) |
| 0.0 | 0.2 | GO:0007614 | short-term memory(GO:0007614) |
| 0.0 | 0.8 | GO:0045199 | maintenance of apical/basal cell polarity(GO:0035090) maintenance of epithelial cell apical/basal polarity(GO:0045199) |
| 0.0 | 1.2 | GO:0018146 | keratan sulfate biosynthetic process(GO:0018146) |
| 0.0 | 0.4 | GO:0032455 | nerve growth factor processing(GO:0032455) |
| 0.0 | 0.3 | GO:0042989 | sequestering of actin monomers(GO:0042989) |
| 0.0 | 0.4 | GO:0010265 | SCF complex assembly(GO:0010265) |
| 0.0 | 1.2 | GO:0034656 | nucleobase-containing small molecule catabolic process(GO:0034656) |
| 0.0 | 0.9 | GO:0030046 | parallel actin filament bundle assembly(GO:0030046) |
| 0.0 | 0.7 | GO:0051873 | killing by host of symbiont cells(GO:0051873) |
| 0.0 | 0.2 | GO:0070459 | prolactin secretion(GO:0070459) |
| 0.0 | 1.0 | GO:0043567 | regulation of insulin-like growth factor receptor signaling pathway(GO:0043567) |
| 0.0 | 0.2 | GO:0035627 | ceramide transport(GO:0035627) |
| 0.0 | 0.9 | GO:0021681 | cerebellar granular layer development(GO:0021681) |
| 0.0 | 0.1 | GO:0046086 | adenosine biosynthetic process(GO:0046086) |
| 0.0 | 0.7 | GO:0031915 | positive regulation of synaptic plasticity(GO:0031915) |
| 0.0 | 0.6 | GO:0030091 | protein repair(GO:0030091) |
| 0.0 | 0.2 | GO:0035553 | oxidative RNA demethylation(GO:0035513) oxidative single-stranded RNA demethylation(GO:0035553) |
| 0.0 | 0.3 | GO:0090201 | negative regulation of release of cytochrome c from mitochondria(GO:0090201) |
| 0.0 | 2.0 | GO:0070884 | regulation of calcineurin-NFAT signaling cascade(GO:0070884) |
| 0.0 | 0.1 | GO:1904640 | response to methionine(GO:1904640) |
| 0.0 | 2.9 | GO:0006120 | mitochondrial electron transport, NADH to ubiquinone(GO:0006120) |
| 0.0 | 0.4 | GO:0061143 | alveolar primary septum development(GO:0061143) |
| 0.0 | 0.1 | GO:0042668 | auditory receptor cell fate determination(GO:0042668) |
| 0.0 | 0.1 | GO:0015888 | thiamine transport(GO:0015888) |
| 0.0 | 0.6 | GO:0032534 | regulation of microvillus assembly(GO:0032534) |
| 0.0 | 0.2 | GO:0035610 | protein side chain deglutamylation(GO:0035610) |
| 0.0 | 0.4 | GO:0045905 | translational frameshifting(GO:0006452) positive regulation of translational termination(GO:0045905) |
| 0.0 | 0.6 | GO:1900029 | positive regulation of ruffle assembly(GO:1900029) |
| 0.0 | 0.2 | GO:0018277 | protein deamination(GO:0018277) |
| 0.0 | 1.9 | GO:0021952 | central nervous system projection neuron axonogenesis(GO:0021952) |
| 0.0 | 0.4 | GO:0071763 | nuclear membrane organization(GO:0071763) |
| 0.0 | 0.5 | GO:0015867 | ADP transport(GO:0015866) ATP transport(GO:0015867) |
| 0.0 | 0.3 | GO:0030309 | poly-N-acetyllactosamine metabolic process(GO:0030309) |
| 0.0 | 0.3 | GO:0060087 | relaxation of vascular smooth muscle(GO:0060087) |
| 0.0 | 0.5 | GO:0007256 | activation of JNKK activity(GO:0007256) |
| 0.0 | 0.4 | GO:0006700 | C21-steroid hormone biosynthetic process(GO:0006700) |
| 0.0 | 2.8 | GO:0048384 | retinoic acid receptor signaling pathway(GO:0048384) |
| 0.0 | 0.4 | GO:0002860 | positive regulation of natural killer cell mediated immune response to tumor cell(GO:0002857) positive regulation of natural killer cell mediated cytotoxicity directed against tumor cell target(GO:0002860) |
| 0.0 | 0.2 | GO:0015862 | uridine transport(GO:0015862) |
| 0.0 | 0.7 | GO:0035721 | intraciliary retrograde transport(GO:0035721) |
| 0.0 | 0.1 | GO:0015824 | proline transport(GO:0015824) |
| 0.0 | 0.1 | GO:0071372 | cellular response to follicle-stimulating hormone stimulus(GO:0071372) |
| 0.0 | 0.4 | GO:0014029 | neural crest formation(GO:0014029) |
| 0.0 | 0.1 | GO:0005989 | lactose metabolic process(GO:0005988) lactose biosynthetic process(GO:0005989) |
| 0.0 | 0.2 | GO:0060689 | cell differentiation involved in salivary gland development(GO:0060689) |
| 0.0 | 1.6 | GO:0018149 | peptide cross-linking(GO:0018149) |
| 0.0 | 0.4 | GO:0042985 | negative regulation of amyloid precursor protein biosynthetic process(GO:0042985) |
| 0.0 | 1.9 | GO:0001754 | eye photoreceptor cell differentiation(GO:0001754) |
| 0.0 | 1.5 | GO:0010842 | retina layer formation(GO:0010842) |
| 0.0 | 0.1 | GO:2000354 | regulation of ovarian follicle development(GO:2000354) |
| 0.0 | 0.8 | GO:1904714 | regulation of chaperone-mediated autophagy(GO:1904714) |
| 0.0 | 0.5 | GO:0010804 | negative regulation of tumor necrosis factor-mediated signaling pathway(GO:0010804) |
| 0.0 | 1.3 | GO:0050435 | beta-amyloid metabolic process(GO:0050435) |
| 0.0 | 0.3 | GO:0036438 | maintenance of lens transparency(GO:0036438) |
| 0.0 | 0.4 | GO:1990035 | calcium ion import across plasma membrane(GO:0098703) calcium ion import into cell(GO:1990035) |
| 0.0 | 0.4 | GO:0006002 | fructose 6-phosphate metabolic process(GO:0006002) |
| 0.0 | 0.7 | GO:0051256 | mitotic spindle midzone assembly(GO:0051256) |
| 0.0 | 0.9 | GO:0007183 | SMAD protein complex assembly(GO:0007183) |
| 0.0 | 2.5 | GO:0045540 | regulation of cholesterol biosynthetic process(GO:0045540) |
| 0.0 | 0.1 | GO:0060355 | regulation of cell adhesion molecule production(GO:0060353) positive regulation of cell adhesion molecule production(GO:0060355) |
| 0.0 | 0.8 | GO:0006123 | mitochondrial electron transport, cytochrome c to oxygen(GO:0006123) |
| 0.0 | 0.5 | GO:0006610 | ribosomal protein import into nucleus(GO:0006610) |
| 0.0 | 0.5 | GO:0000338 | protein deneddylation(GO:0000338) |
| 0.0 | 0.1 | GO:0097694 | establishment of RNA localization to telomere(GO:0097694) establishment of macromolecular complex localization to telomere(GO:0097695) |
| 0.0 | 0.4 | GO:0060050 | positive regulation of protein glycosylation(GO:0060050) |
| 0.0 | 0.2 | GO:0070889 | platelet alpha granule organization(GO:0070889) |
| 0.0 | 1.0 | GO:0071712 | ER-associated misfolded protein catabolic process(GO:0071712) |
| 0.0 | 0.1 | GO:0009439 | cyanate metabolic process(GO:0009439) cyanate catabolic process(GO:0009440) |
| 0.0 | 3.5 | GO:0016266 | O-glycan processing(GO:0016266) |
| 0.0 | 0.4 | GO:0002862 | negative regulation of inflammatory response to antigenic stimulus(GO:0002862) |
| 0.0 | 0.1 | GO:0001757 | somite specification(GO:0001757) |
| 0.0 | 0.3 | GO:0036148 | phosphatidylglycerol acyl-chain remodeling(GO:0036148) |
| 0.0 | 0.2 | GO:0032525 | somite rostral/caudal axis specification(GO:0032525) |
| 0.0 | 0.1 | GO:0018874 | benzoate metabolic process(GO:0018874) |
| 0.0 | 0.2 | GO:0003383 | apical constriction(GO:0003383) |
| 0.0 | 0.2 | GO:0006657 | CDP-choline pathway(GO:0006657) |
| 0.0 | 0.7 | GO:0006999 | nuclear pore organization(GO:0006999) |
| 0.0 | 0.1 | GO:0035962 | response to interleukin-13(GO:0035962) |
| 0.0 | 0.2 | GO:0060068 | vagina development(GO:0060068) |
| 0.0 | 0.7 | GO:0043090 | amino acid import(GO:0043090) |
| 0.0 | 0.4 | GO:0031580 | membrane raft polarization(GO:0001766) membrane raft distribution(GO:0031580) |
| 0.0 | 0.4 | GO:0018094 | protein polyglycylation(GO:0018094) |
| 0.0 | 0.5 | GO:0007028 | cytoplasm organization(GO:0007028) |
| 0.0 | 0.4 | GO:0042754 | negative regulation of circadian rhythm(GO:0042754) |
| 0.0 | 0.1 | GO:0060979 | vasculogenesis involved in coronary vascular morphogenesis(GO:0060979) |
| 0.0 | 0.1 | GO:0007198 | adenylate cyclase-inhibiting serotonin receptor signaling pathway(GO:0007198) |
| 0.0 | 0.3 | GO:0071847 | TNFSF11-mediated signaling pathway(GO:0071847) |
| 0.0 | 0.2 | GO:0090063 | regulation of microtubule nucleation(GO:0010968) positive regulation of microtubule nucleation(GO:0090063) |
| 0.0 | 0.1 | GO:1904690 | regulation of cap-independent translational initiation(GO:1903677) positive regulation of cap-independent translational initiation(GO:1903679) regulation of cytoplasmic translational initiation(GO:1904688) positive regulation of cytoplasmic translational initiation(GO:1904690) |
| 0.0 | 0.4 | GO:0001514 | selenocysteine incorporation(GO:0001514) translational readthrough(GO:0006451) |
| 0.0 | 0.3 | GO:0030259 | lipid glycosylation(GO:0030259) |
| 0.0 | 0.1 | GO:0097104 | postsynaptic membrane assembly(GO:0097104) |
| 0.0 | 0.7 | GO:0042744 | hydrogen peroxide catabolic process(GO:0042744) |
| 0.0 | 0.8 | GO:0048026 | positive regulation of mRNA splicing, via spliceosome(GO:0048026) |
| 0.0 | 0.2 | GO:2000786 | positive regulation of autophagosome assembly(GO:2000786) |
| 0.0 | 2.1 | GO:0060395 | SMAD protein signal transduction(GO:0060395) |
| 0.0 | 0.2 | GO:0070966 | nuclear-transcribed mRNA catabolic process, no-go decay(GO:0070966) |
| 0.0 | 0.5 | GO:0034116 | positive regulation of heterotypic cell-cell adhesion(GO:0034116) |
| 0.0 | 0.4 | GO:0060124 | positive regulation of growth hormone secretion(GO:0060124) |
| 0.0 | 1.5 | GO:0045214 | sarcomere organization(GO:0045214) |
| 0.0 | 0.1 | GO:1903575 | cornified envelope assembly(GO:1903575) |
| 0.0 | 1.9 | GO:0006734 | NADH metabolic process(GO:0006734) |
| 0.0 | 0.2 | GO:0032510 | endosome to lysosome transport via multivesicular body sorting pathway(GO:0032510) |
| 0.0 | 1.2 | GO:0021762 | substantia nigra development(GO:0021762) |
| 0.0 | 0.5 | GO:0061635 | regulation of protein complex stability(GO:0061635) |
| 0.0 | 0.8 | GO:0033120 | positive regulation of RNA splicing(GO:0033120) |
| 0.0 | 0.2 | GO:1903251 | multi-ciliated epithelial cell differentiation(GO:1903251) |
| 0.0 | 0.7 | GO:0006706 | steroid catabolic process(GO:0006706) |
| 0.0 | 0.1 | GO:0030949 | positive regulation of vascular endothelial growth factor receptor signaling pathway(GO:0030949) |
| 0.0 | 0.4 | GO:0098719 | sodium ion import across plasma membrane(GO:0098719) sodium ion import into cell(GO:1990118) |
| 0.0 | 0.2 | GO:0006880 | intracellular sequestering of iron ion(GO:0006880) sequestering of iron ion(GO:0097577) |
| 0.0 | 0.1 | GO:0071286 | cellular response to magnesium ion(GO:0071286) |
| 0.0 | 0.4 | GO:0006703 | estrogen biosynthetic process(GO:0006703) |
| 0.0 | 0.1 | GO:0018364 | peptidyl-glutamine methylation(GO:0018364) RNA (guanine-N7)-methylation(GO:0036265) rRNA (guanine-N7)-methylation(GO:0070476) |
| 0.0 | 0.6 | GO:0006388 | tRNA splicing, via endonucleolytic cleavage and ligation(GO:0006388) |
| 0.0 | 0.5 | GO:0003322 | pancreatic A cell development(GO:0003322) |
| 0.0 | 0.1 | GO:0070317 | negative regulation of G0 to G1 transition(GO:0070317) |
| 0.0 | 0.4 | GO:0001682 | tRNA 5'-leader removal(GO:0001682) |
| 0.0 | 0.2 | GO:0006105 | succinate metabolic process(GO:0006105) |
| 0.0 | 0.2 | GO:0050968 | detection of chemical stimulus involved in sensory perception of pain(GO:0050968) |
| 0.0 | 0.4 | GO:2000507 | positive regulation of energy homeostasis(GO:2000507) |
| 0.0 | 0.7 | GO:0044872 | lipoprotein transport(GO:0042953) lipoprotein localization(GO:0044872) |
| 0.0 | 0.4 | GO:2000680 | rubidium ion transport(GO:0035826) regulation of rubidium ion transport(GO:2000680) |
| 0.0 | 0.2 | GO:1903464 | negative regulation of mitotic cell cycle DNA replication(GO:1903464) |
| 0.0 | 0.4 | GO:0042136 | neurotransmitter biosynthetic process(GO:0042136) |
| 0.0 | 3.0 | GO:0070125 | mitochondrial translational elongation(GO:0070125) |
| 0.0 | 1.5 | GO:0035987 | endodermal cell differentiation(GO:0035987) |
| 0.0 | 1.0 | GO:0008038 | neuron recognition(GO:0008038) |
| 0.0 | 0.1 | GO:0035407 | histone H3-T11 phosphorylation(GO:0035407) |
| 0.0 | 0.1 | GO:0043137 | DNA replication, removal of RNA primer(GO:0043137) |
| 0.0 | 0.4 | GO:0045717 | negative regulation of fatty acid biosynthetic process(GO:0045717) |
| 0.0 | 2.4 | GO:0007368 | determination of left/right symmetry(GO:0007368) |
| 0.0 | 0.2 | GO:0043117 | positive regulation of vascular permeability(GO:0043117) |
| 0.0 | 0.1 | GO:0030951 | establishment or maintenance of microtubule cytoskeleton polarity(GO:0030951) |
| 0.0 | 0.4 | GO:0040032 | post-embryonic body morphogenesis(GO:0040032) |
| 0.0 | 0.7 | GO:0071425 | hematopoietic stem cell proliferation(GO:0071425) |
| 0.0 | 3.4 | GO:0007156 | homophilic cell adhesion via plasma membrane adhesion molecules(GO:0007156) |
| 0.0 | 0.2 | GO:0072383 | plus-end-directed vesicle transport along microtubule(GO:0072383) |
| 0.0 | 0.2 | GO:1901626 | regulation of postsynaptic membrane organization(GO:1901626) |
| 0.0 | 1.6 | GO:0035914 | skeletal muscle cell differentiation(GO:0035914) |
| 0.0 | 0.1 | GO:0071922 | establishment of sister chromatid cohesion(GO:0034085) cohesin loading(GO:0071921) regulation of cohesin loading(GO:0071922) |
| 0.0 | 1.6 | GO:0090502 | RNA phosphodiester bond hydrolysis, endonucleolytic(GO:0090502) |
| 0.0 | 0.2 | GO:0032377 | regulation of intracellular lipid transport(GO:0032377) regulation of intracellular sterol transport(GO:0032380) regulation of intracellular cholesterol transport(GO:0032383) |
| 0.0 | 0.3 | GO:0050910 | detection of mechanical stimulus involved in sensory perception of sound(GO:0050910) |
| 0.0 | 0.4 | GO:0032228 | regulation of synaptic transmission, GABAergic(GO:0032228) |
| 0.0 | 0.3 | GO:2000810 | regulation of bicellular tight junction assembly(GO:2000810) |
| 0.0 | 0.0 | GO:1990180 | mitochondrial tRNA 3'-end processing(GO:1990180) |
| 0.0 | 0.8 | GO:0030212 | hyaluronan metabolic process(GO:0030212) |
| 0.0 | 0.1 | GO:0061669 | spontaneous neurotransmitter secretion(GO:0061669) spontaneous synaptic transmission(GO:0098814) |
| 0.0 | 0.2 | GO:0098909 | regulation of cardiac muscle cell action potential involved in regulation of contraction(GO:0098909) |
| 0.0 | 1.2 | GO:0007588 | excretion(GO:0007588) |
| 0.0 | 0.5 | GO:0031167 | rRNA methylation(GO:0031167) |
| 0.0 | 0.7 | GO:0019835 | cytolysis(GO:0019835) |
| 0.0 | 0.2 | GO:0032057 | negative regulation of translational initiation in response to stress(GO:0032057) |
| 0.0 | 0.1 | GO:0022027 | interkinetic nuclear migration(GO:0022027) |
| 0.0 | 0.3 | GO:0006268 | DNA unwinding involved in DNA replication(GO:0006268) |
| 0.0 | 0.2 | GO:0016559 | peroxisome fission(GO:0016559) |
| 0.0 | 0.1 | GO:0035616 | histone H2B conserved C-terminal lysine deubiquitination(GO:0035616) |
| 0.0 | 0.2 | GO:0048149 | behavioral response to ethanol(GO:0048149) |
| 0.0 | 0.4 | GO:0030208 | dermatan sulfate biosynthetic process(GO:0030208) |
| 0.0 | 0.5 | GO:0061003 | positive regulation of dendritic spine morphogenesis(GO:0061003) |
| 0.0 | 0.3 | GO:0033617 | mitochondrial respiratory chain complex IV assembly(GO:0033617) |
| 0.0 | 1.2 | GO:0070206 | protein trimerization(GO:0070206) |
| 0.0 | 0.1 | GO:0034433 | steroid esterification(GO:0034433) sterol esterification(GO:0034434) cholesterol esterification(GO:0034435) |
| 0.0 | 0.2 | GO:0045218 | zonula adherens maintenance(GO:0045218) |
| 0.0 | 0.4 | GO:2000369 | regulation of clathrin-mediated endocytosis(GO:2000369) |
| 0.0 | 0.1 | GO:1990697 | protein depalmitoleylation(GO:1990697) |
| 0.0 | 0.2 | GO:0015747 | urate transport(GO:0015747) |
| 0.0 | 0.3 | GO:0061088 | regulation of sequestering of zinc ion(GO:0061088) |
| 0.0 | 0.6 | GO:0097502 | mannosylation(GO:0097502) |
| 0.0 | 1.0 | GO:0032233 | positive regulation of actin filament bundle assembly(GO:0032233) |
| 0.0 | 1.2 | GO:0051965 | positive regulation of synapse assembly(GO:0051965) |
| 0.0 | 0.1 | GO:1904706 | negative regulation of vascular smooth muscle cell proliferation(GO:1904706) |
| 0.0 | 0.2 | GO:0032776 | DNA methylation on cytosine(GO:0032776) |
| 0.0 | 0.1 | GO:1901621 | negative regulation of smoothened signaling pathway involved in dorsal/ventral neural tube patterning(GO:1901621) |
| 0.0 | 0.8 | GO:0006370 | 7-methylguanosine mRNA capping(GO:0006370) |
| 0.0 | 0.2 | GO:0034380 | high-density lipoprotein particle assembly(GO:0034380) |
| 0.0 | 0.2 | GO:0015705 | iodide transport(GO:0015705) |
| 0.0 | 0.4 | GO:0035589 | G-protein coupled purinergic nucleotide receptor signaling pathway(GO:0035589) |
| 0.0 | 0.2 | GO:1902846 | regulation of spindle elongation(GO:0032887) regulation of mitotic spindle elongation(GO:0032888) anastral spindle assembly(GO:0055048) protein localization to spindle pole body(GO:0071988) regulation of protein localization to spindle pole body(GO:1902363) positive regulation of protein localization to spindle pole body(GO:1902365) positive regulation of mitotic spindle elongation(GO:1902846) |
| 0.0 | 0.0 | GO:2000588 | positive regulation of platelet-derived growth factor receptor-beta signaling pathway(GO:2000588) |
| 0.0 | 0.3 | GO:0045008 | depyrimidination(GO:0045008) |
| 0.0 | 0.3 | GO:0034497 | protein localization to pre-autophagosomal structure(GO:0034497) |
| 0.0 | 0.4 | GO:0032094 | response to food(GO:0032094) |
| 0.0 | 0.2 | GO:0007253 | cytoplasmic sequestering of NF-kappaB(GO:0007253) |
| 0.0 | 0.3 | GO:0001675 | acrosome assembly(GO:0001675) |
| 0.0 | 1.0 | GO:0008203 | cholesterol metabolic process(GO:0008203) |
| 0.0 | 0.9 | GO:0036465 | synaptic vesicle recycling(GO:0036465) |
| 0.0 | 0.0 | GO:2000642 | negative regulation of early endosome to late endosome transport(GO:2000642) |
| 0.0 | 1.8 | GO:0006805 | xenobiotic metabolic process(GO:0006805) |
| 0.0 | 0.6 | GO:0043039 | tRNA aminoacylation for protein translation(GO:0006418) tRNA aminoacylation(GO:0043039) |
| 0.0 | 0.4 | GO:0072583 | clathrin-mediated endocytosis(GO:0072583) |
| 0.0 | 0.4 | GO:0010765 | positive regulation of sodium ion transport(GO:0010765) |
| 0.0 | 0.6 | GO:1902475 | L-alpha-amino acid transmembrane transport(GO:1902475) |
| 0.0 | 0.1 | GO:1990314 | cellular response to insulin-like growth factor stimulus(GO:1990314) |
| 0.0 | 0.3 | GO:0022011 | myelination in peripheral nervous system(GO:0022011) peripheral nervous system axon ensheathment(GO:0032292) |
| 0.0 | 0.1 | GO:1904424 | regulation of GTP binding(GO:1904424) |
| 0.0 | 0.2 | GO:0003334 | keratinocyte development(GO:0003334) |
| 0.0 | 0.2 | GO:0001778 | plasma membrane repair(GO:0001778) |
| 0.0 | 0.1 | GO:0039534 | negative regulation of MDA-5 signaling pathway(GO:0039534) |
| 0.0 | 0.1 | GO:1990564 | protein polyufmylation(GO:1990564) protein K69-linked ufmylation(GO:1990592) |
| 0.0 | 0.2 | GO:0042753 | positive regulation of circadian rhythm(GO:0042753) |
| 0.0 | 0.8 | GO:0015701 | bicarbonate transport(GO:0015701) |
| 0.0 | 0.1 | GO:0002159 | desmosome assembly(GO:0002159) |
| 0.0 | 0.1 | GO:0046541 | saliva secretion(GO:0046541) |
| 0.0 | 0.1 | GO:0090669 | telomerase RNA stabilization(GO:0090669) |
| 0.0 | 0.1 | GO:0014912 | negative regulation of smooth muscle cell migration(GO:0014912) |
| 0.0 | 0.2 | GO:0043248 | proteasome assembly(GO:0043248) |
| 0.0 | 0.2 | GO:0009086 | methionine biosynthetic process(GO:0009086) |
| 0.0 | 0.1 | GO:1904354 | negative regulation of telomere capping(GO:1904354) |
| 0.0 | 0.7 | GO:0046710 | GDP metabolic process(GO:0046710) |
| 0.0 | 0.3 | GO:0030501 | positive regulation of bone mineralization(GO:0030501) |
| 0.0 | 0.2 | GO:0016048 | detection of temperature stimulus(GO:0016048) |
| 0.0 | 0.4 | GO:1900151 | regulation of nuclear-transcribed mRNA catabolic process, deadenylation-dependent decay(GO:1900151) positive regulation of nuclear-transcribed mRNA catabolic process, deadenylation-dependent decay(GO:1900153) |
| 0.0 | 0.1 | GO:0030037 | actin filament reorganization involved in cell cycle(GO:0030037) |
| 0.0 | 4.3 | GO:0050911 | detection of chemical stimulus involved in sensory perception of smell(GO:0050911) |
| 0.0 | 0.2 | GO:0006564 | L-serine biosynthetic process(GO:0006564) |
| 0.0 | 1.3 | GO:0035383 | acyl-CoA metabolic process(GO:0006637) thioester metabolic process(GO:0035383) |
| 0.0 | 0.1 | GO:0072366 | positive regulation of gluconeogenesis by positive regulation of transcription from RNA polymerase II promoter(GO:0035948) regulation of cellular ketone metabolic process by positive regulation of transcription from RNA polymerase II promoter(GO:0072366) |
| 0.0 | 0.1 | GO:0046092 | deoxycytidine metabolic process(GO:0046092) |
| 0.0 | 0.2 | GO:0045003 | DNA recombinase assembly(GO:0000730) double-strand break repair via synthesis-dependent strand annealing(GO:0045003) |
| 0.0 | 0.1 | GO:0007625 | grooming behavior(GO:0007625) |
| 0.0 | 0.1 | GO:0044245 | polysaccharide digestion(GO:0044245) |
| 0.0 | 0.1 | GO:1903818 | positive regulation of voltage-gated potassium channel activity(GO:1903818) |
| 0.0 | 0.2 | GO:0050908 | detection of light stimulus involved in visual perception(GO:0050908) detection of light stimulus involved in sensory perception(GO:0050962) |
| 0.0 | 0.2 | GO:0060856 | establishment of blood-brain barrier(GO:0060856) |
| 0.0 | 0.1 | GO:1904936 | cerebral cortex GABAergic interneuron migration(GO:0021853) interneuron migration(GO:1904936) |
| 0.0 | 0.2 | GO:0033344 | cholesterol efflux(GO:0033344) |
| 0.0 | 0.2 | GO:0030239 | myofibril assembly(GO:0030239) |
| 0.0 | 0.1 | GO:0060573 | ventral spinal cord interneuron specification(GO:0021521) cell fate specification involved in pattern specification(GO:0060573) |
| 0.0 | 0.4 | GO:1903146 | regulation of mitophagy(GO:1903146) |
| 0.0 | 0.1 | GO:0097240 | telomere tethering at nuclear periphery(GO:0034398) meiotic telomere tethering at nuclear periphery(GO:0044821) meiotic attachment of telomere to nuclear envelope(GO:0070197) chromosome attachment to the nuclear envelope(GO:0097240) |
| 0.0 | 0.1 | GO:0008635 | activation of cysteine-type endopeptidase activity involved in apoptotic process by cytochrome c(GO:0008635) |
| 0.0 | 0.0 | GO:1902630 | regulation of membrane hyperpolarization(GO:1902630) |
| 0.0 | 0.1 | GO:0051967 | negative regulation of synaptic transmission, glutamatergic(GO:0051967) |
Gene overrepresentation in cellular component category:
| Log-likelihood per target | Total log-likelihood | Term | Description |
|---|---|---|---|
| 1.3 | 4.0 | GO:0097444 | spine apparatus(GO:0097444) |
| 0.8 | 4.0 | GO:0097059 | CNTFR-CLCF1 complex(GO:0097059) |
| 0.7 | 2.1 | GO:0005606 | laminin-1 complex(GO:0005606) |
| 0.7 | 4.8 | GO:0097513 | myosin II filament(GO:0097513) |
| 0.7 | 5.3 | GO:0045298 | tubulin complex(GO:0045298) |
| 0.6 | 2.2 | GO:0034684 | integrin alphav-beta5 complex(GO:0034684) |
| 0.5 | 1.6 | GO:0020005 | symbiont-containing vacuole membrane(GO:0020005) |
| 0.5 | 2.6 | GO:0005899 | insulin receptor complex(GO:0005899) |
| 0.5 | 2.0 | GO:0036025 | protein C inhibitor-TMPRSS7 complex(GO:0036024) protein C inhibitor-TMPRSS11E complex(GO:0036025) protein C inhibitor-PLAT complex(GO:0036026) protein C inhibitor-PLAU complex(GO:0036027) protein C inhibitor-thrombin complex(GO:0036028) protein C inhibitor-KLK3 complex(GO:0036029) protein C inhibitor-plasma kallikrein complex(GO:0036030) serine protease inhibitor complex(GO:0097180) protein C inhibitor-coagulation factor V complex(GO:0097181) protein C inhibitor-coagulation factor Xa complex(GO:0097182) protein C inhibitor-coagulation factor XI complex(GO:0097183) |
| 0.5 | 1.5 | GO:0005914 | spot adherens junction(GO:0005914) |
| 0.5 | 3.7 | GO:0034363 | intermediate-density lipoprotein particle(GO:0034363) |
| 0.5 | 1.4 | GO:0070931 | Golgi-associated vesicle lumen(GO:0070931) |
| 0.5 | 3.2 | GO:0009331 | glycerol-3-phosphate dehydrogenase complex(GO:0009331) |
| 0.4 | 1.3 | GO:0036117 | hyaluranon cable(GO:0036117) |
| 0.4 | 3.0 | GO:0030314 | junctional membrane complex(GO:0030314) |
| 0.4 | 7.6 | GO:0031089 | platelet dense granule lumen(GO:0031089) |
| 0.4 | 0.7 | GO:0044294 | dendritic growth cone(GO:0044294) |
| 0.3 | 1.4 | GO:0005753 | mitochondrial proton-transporting ATP synthase complex(GO:0005753) proton-transporting ATP synthase complex(GO:0045259) |
| 0.3 | 3.1 | GO:0031673 | H zone(GO:0031673) |
| 0.3 | 7.9 | GO:0005890 | sodium:potassium-exchanging ATPase complex(GO:0005890) |
| 0.3 | 0.3 | GO:0032444 | activin responsive factor complex(GO:0032444) |
| 0.3 | 0.9 | GO:0097058 | CRLF-CLCF1 complex(GO:0097058) |
| 0.3 | 2.8 | GO:0005638 | lamin filament(GO:0005638) |
| 0.2 | 1.0 | GO:0034457 | Mpp10 complex(GO:0034457) |
| 0.2 | 7.5 | GO:0005922 | connexon complex(GO:0005922) |
| 0.2 | 3.5 | GO:0033018 | sarcoplasmic reticulum lumen(GO:0033018) |
| 0.2 | 1.2 | GO:0014701 | junctional sarcoplasmic reticulum membrane(GO:0014701) |
| 0.2 | 0.9 | GO:0038038 | G-protein coupled receptor homodimeric complex(GO:0038038) |
| 0.2 | 0.6 | GO:0070939 | Dsl1p complex(GO:0070939) |
| 0.2 | 1.3 | GO:1990032 | parallel fiber(GO:1990032) |
| 0.2 | 2.5 | GO:0031466 | Cul5-RING ubiquitin ligase complex(GO:0031466) |
| 0.2 | 0.6 | GO:0072563 | endothelial microparticle(GO:0072563) |
| 0.2 | 0.9 | GO:0001405 | presequence translocase-associated import motor(GO:0001405) |
| 0.2 | 2.3 | GO:0032009 | early phagosome(GO:0032009) |
| 0.2 | 0.5 | GO:0060187 | cell pole(GO:0060187) |
| 0.2 | 2.4 | GO:0034366 | spherical high-density lipoprotein particle(GO:0034366) |
| 0.2 | 0.7 | GO:0030956 | glutamyl-tRNA(Gln) amidotransferase complex(GO:0030956) |
| 0.2 | 2.5 | GO:0005921 | gap junction(GO:0005921) |
| 0.2 | 0.5 | GO:0044753 | amphisome(GO:0044753) |
| 0.2 | 0.5 | GO:0071665 | gamma-catenin-TCF7L2 complex(GO:0071665) |
| 0.2 | 0.5 | GO:0005584 | collagen type I trimer(GO:0005584) |
| 0.2 | 0.2 | GO:0032541 | cortical endoplasmic reticulum(GO:0032541) |
| 0.2 | 0.8 | GO:0008091 | spectrin(GO:0008091) |
| 0.2 | 2.3 | GO:1990712 | HFE-transferrin receptor complex(GO:1990712) |
| 0.1 | 4.7 | GO:0098563 | integral component of synaptic vesicle membrane(GO:0030285) intrinsic component of synaptic vesicle membrane(GO:0098563) |
| 0.1 | 0.4 | GO:0016222 | procollagen-proline 4-dioxygenase complex(GO:0016222) |
| 0.1 | 1.2 | GO:0005947 | mitochondrial alpha-ketoglutarate dehydrogenase complex(GO:0005947) |
| 0.1 | 4.2 | GO:0001518 | voltage-gated sodium channel complex(GO:0001518) |
| 0.1 | 1.9 | GO:0036454 | insulin-like growth factor binding protein complex(GO:0016942) growth factor complex(GO:0036454) |
| 0.1 | 2.7 | GO:0031045 | dense core granule(GO:0031045) |
| 0.1 | 0.9 | GO:0061617 | MICOS complex(GO:0061617) |
| 0.1 | 2.5 | GO:0097433 | dense body(GO:0097433) |
| 0.1 | 0.8 | GO:0048179 | activin receptor complex(GO:0048179) |
| 0.1 | 0.8 | GO:0097443 | sorting endosome(GO:0097443) |
| 0.1 | 1.6 | GO:0043190 | ATP-binding cassette (ABC) transporter complex(GO:0043190) |
| 0.1 | 0.9 | GO:1990393 | 3M complex(GO:1990393) |
| 0.1 | 1.6 | GO:0097512 | cardiac myofibril(GO:0097512) |
| 0.1 | 0.6 | GO:0016938 | kinesin I complex(GO:0016938) |
| 0.1 | 1.7 | GO:0002116 | semaphorin receptor complex(GO:0002116) |
| 0.1 | 0.7 | GO:0070033 | synaptobrevin 2-SNAP-25-syntaxin-1a-complexin II complex(GO:0070033) synaptobrevin 2-SNAP-25-syntaxin-3-complexin complex(GO:0070554) |
| 0.1 | 2.6 | GO:0005861 | troponin complex(GO:0005861) |
| 0.1 | 0.9 | GO:0070032 | synaptobrevin 2-SNAP-25-syntaxin-1a-complexin I complex(GO:0070032) |
| 0.1 | 0.6 | GO:0045160 | myosin I complex(GO:0045160) |
| 0.1 | 0.8 | GO:0034448 | EGO complex(GO:0034448) |
| 0.1 | 1.0 | GO:1990452 | Parkin-FBXW7-Cul1 ubiquitin ligase complex(GO:1990452) |
| 0.1 | 2.9 | GO:0030056 | hemidesmosome(GO:0030056) |
| 0.1 | 1.4 | GO:0000015 | phosphopyruvate hydratase complex(GO:0000015) |
| 0.1 | 3.2 | GO:0034364 | high-density lipoprotein particle(GO:0034364) |
| 0.1 | 1.4 | GO:0032593 | insulin-responsive compartment(GO:0032593) |
| 0.1 | 1.2 | GO:0005916 | fascia adherens(GO:0005916) |
| 0.1 | 0.7 | GO:0005967 | mitochondrial pyruvate dehydrogenase complex(GO:0005967) |
| 0.1 | 0.3 | GO:0030678 | mitochondrial ribonuclease P complex(GO:0030678) |
| 0.1 | 1.3 | GO:0031464 | Cul4A-RING E3 ubiquitin ligase complex(GO:0031464) |
| 0.1 | 1.0 | GO:0005579 | membrane attack complex(GO:0005579) |
| 0.1 | 4.7 | GO:0032809 | neuronal cell body membrane(GO:0032809) cell body membrane(GO:0044298) |
| 0.1 | 0.9 | GO:0005744 | mitochondrial inner membrane presequence translocase complex(GO:0005744) |
| 0.1 | 1.4 | GO:0043203 | axon hillock(GO:0043203) |
| 0.1 | 2.1 | GO:0045179 | apical cortex(GO:0045179) |
| 0.1 | 0.5 | GO:0002133 | polycystin complex(GO:0002133) |
| 0.1 | 0.5 | GO:0035841 | new growing cell tip(GO:0035841) |
| 0.1 | 0.7 | GO:0030934 | anchoring collagen complex(GO:0030934) |
| 0.1 | 2.1 | GO:0032591 | dendritic spine membrane(GO:0032591) |
| 0.1 | 0.6 | GO:0044214 | spanning component of plasma membrane(GO:0044214) spanning component of membrane(GO:0089717) |
| 0.1 | 4.5 | GO:0009925 | basal plasma membrane(GO:0009925) |
| 0.1 | 0.8 | GO:0001739 | sex chromatin(GO:0001739) |
| 0.1 | 0.6 | GO:0097209 | epidermal lamellar body(GO:0097209) |
| 0.1 | 3.7 | GO:0043218 | compact myelin(GO:0043218) |
| 0.1 | 0.3 | GO:0032133 | chromosome passenger complex(GO:0032133) |
| 0.1 | 0.5 | GO:0000221 | vacuolar proton-transporting V-type ATPase, V1 domain(GO:0000221) |
| 0.1 | 0.4 | GO:0045272 | plasma membrane respiratory chain complex I(GO:0045272) |
| 0.1 | 2.0 | GO:0032426 | stereocilium tip(GO:0032426) |
| 0.1 | 1.6 | GO:0034098 | VCP-NPL4-UFD1 AAA ATPase complex(GO:0034098) |
| 0.1 | 2.9 | GO:0031231 | integral component of peroxisomal membrane(GO:0005779) intrinsic component of peroxisomal membrane(GO:0031231) |
| 0.1 | 0.9 | GO:1990761 | growth cone lamellipodium(GO:1990761) |
| 0.1 | 0.5 | GO:0044393 | microspike(GO:0044393) |
| 0.1 | 2.2 | GO:0005666 | DNA-directed RNA polymerase III complex(GO:0005666) |
| 0.1 | 2.0 | GO:0010369 | chromocenter(GO:0010369) |
| 0.1 | 0.4 | GO:0090498 | extrinsic component of Golgi membrane(GO:0090498) |
| 0.1 | 1.8 | GO:0017146 | NMDA selective glutamate receptor complex(GO:0017146) |
| 0.1 | 1.0 | GO:0033643 | host cell part(GO:0033643) |
| 0.1 | 1.8 | GO:0014704 | intercalated disc(GO:0014704) |
| 0.1 | 19.5 | GO:0030018 | Z disc(GO:0030018) |
| 0.1 | 3.0 | GO:0044295 | axonal growth cone(GO:0044295) |
| 0.1 | 2.6 | GO:1990124 | messenger ribonucleoprotein complex(GO:1990124) |
| 0.1 | 0.8 | GO:0005652 | nuclear lamina(GO:0005652) |
| 0.1 | 1.1 | GO:0005915 | zonula adherens(GO:0005915) |
| 0.1 | 0.1 | GO:0034666 | integrin alpha2-beta1 complex(GO:0034666) |
| 0.1 | 1.7 | GO:0000145 | exocyst(GO:0000145) |
| 0.1 | 6.4 | GO:0031526 | brush border membrane(GO:0031526) |
| 0.1 | 0.9 | GO:0030478 | actin cap(GO:0030478) |
| 0.1 | 1.7 | GO:0033268 | node of Ranvier(GO:0033268) |
| 0.1 | 4.0 | GO:0031907 | peroxisomal matrix(GO:0005782) microbody lumen(GO:0031907) |
| 0.1 | 3.0 | GO:0034451 | centriolar satellite(GO:0034451) |
| 0.1 | 2.8 | GO:0046658 | anchored component of plasma membrane(GO:0046658) |
| 0.1 | 6.9 | GO:0060170 | ciliary membrane(GO:0060170) |
| 0.1 | 1.3 | GO:0016327 | apicolateral plasma membrane(GO:0016327) |
| 0.1 | 0.5 | GO:1905202 | 3-methylcrotonyl-CoA carboxylase complex, mitochondrial(GO:0002169) methylcrotonoyl-CoA carboxylase complex(GO:1905202) |
| 0.1 | 1.8 | GO:0005605 | basal lamina(GO:0005605) |
| 0.1 | 0.9 | GO:0005641 | nuclear envelope lumen(GO:0005641) |
| 0.1 | 0.7 | GO:0046581 | intercellular canaliculus(GO:0046581) |
| 0.1 | 0.4 | GO:0030485 | smooth muscle contractile fiber(GO:0030485) |
| 0.1 | 1.8 | GO:0031306 | intrinsic component of mitochondrial outer membrane(GO:0031306) |
| 0.1 | 1.1 | GO:0000815 | ESCRT III complex(GO:0000815) |
| 0.1 | 0.3 | GO:0000172 | ribonuclease MRP complex(GO:0000172) |
| 0.1 | 3.0 | GO:0001533 | cornified envelope(GO:0001533) |
| 0.1 | 0.4 | GO:1903439 | calcitonin family receptor complex(GO:1903439) amylin receptor complex(GO:1903440) |
| 0.1 | 0.4 | GO:0034673 | inhibin-betaglycan-ActRII complex(GO:0034673) |
| 0.1 | 36.5 | GO:0005759 | mitochondrial matrix(GO:0005759) |
| 0.1 | 1.7 | GO:1902711 | GABA-A receptor complex(GO:1902711) |
| 0.1 | 0.7 | GO:0034385 | very-low-density lipoprotein particle(GO:0034361) triglyceride-rich lipoprotein particle(GO:0034385) |
| 0.1 | 0.8 | GO:0044455 | mitochondrial membrane part(GO:0044455) |
| 0.1 | 0.3 | GO:0034706 | sodium channel complex(GO:0034706) |
| 0.0 | 0.5 | GO:0005577 | fibrinogen complex(GO:0005577) |
| 0.0 | 1.9 | GO:0002080 | acrosomal membrane(GO:0002080) |
| 0.0 | 1.8 | GO:0005614 | interstitial matrix(GO:0005614) |
| 0.0 | 1.5 | GO:0035869 | ciliary transition zone(GO:0035869) |
| 0.0 | 0.8 | GO:0014731 | spectrin-associated cytoskeleton(GO:0014731) |
| 0.0 | 0.7 | GO:0031209 | SCAR complex(GO:0031209) |
| 0.0 | 1.0 | GO:0031674 | I band(GO:0031674) |
| 0.0 | 0.2 | GO:0032937 | SREBP-SCAP-Insig complex(GO:0032937) |
| 0.0 | 1.6 | GO:0030315 | T-tubule(GO:0030315) |
| 0.0 | 0.3 | GO:0048787 | presynaptic active zone membrane(GO:0048787) |
| 0.0 | 0.8 | GO:0030123 | AP-3 adaptor complex(GO:0030123) |
| 0.0 | 14.7 | GO:0016323 | basolateral plasma membrane(GO:0016323) |
| 0.0 | 1.5 | GO:0032585 | multivesicular body membrane(GO:0032585) |
| 0.0 | 0.8 | GO:0005751 | mitochondrial respiratory chain complex IV(GO:0005751) |
| 0.0 | 0.8 | GO:0098651 | basement membrane collagen trimer(GO:0098651) |
| 0.0 | 1.1 | GO:0031235 | intrinsic component of the cytoplasmic side of the plasma membrane(GO:0031235) |
| 0.0 | 0.2 | GO:0044307 | dendritic branch(GO:0044307) |
| 0.0 | 7.8 | GO:0005923 | bicellular tight junction(GO:0005923) |
| 0.0 | 0.3 | GO:0031417 | NatC complex(GO:0031417) |
| 0.0 | 0.2 | GO:0099634 | postsynaptic specialization membrane(GO:0099634) |
| 0.0 | 2.6 | GO:0099738 | cell cortex region(GO:0099738) |
| 0.0 | 2.2 | GO:0045271 | mitochondrial respiratory chain complex I(GO:0005747) NADH dehydrogenase complex(GO:0030964) respiratory chain complex I(GO:0045271) |
| 0.0 | 1.5 | GO:0070469 | respiratory chain(GO:0070469) |
| 0.0 | 1.2 | GO:0071141 | SMAD protein complex(GO:0071141) |
| 0.0 | 1.1 | GO:0005640 | nuclear outer membrane(GO:0005640) |
| 0.0 | 0.4 | GO:0030688 | preribosome, small subunit precursor(GO:0030688) |
| 0.0 | 0.4 | GO:0061574 | ASAP complex(GO:0061574) |
| 0.0 | 0.3 | GO:0008282 | ATP-sensitive potassium channel complex(GO:0008282) |
| 0.0 | 0.1 | GO:0071817 | MMXD complex(GO:0071817) |
| 0.0 | 3.1 | GO:0005881 | cytoplasmic microtubule(GO:0005881) |
| 0.0 | 1.2 | GO:0005719 | nuclear euchromatin(GO:0005719) |
| 0.0 | 0.6 | GO:0033162 | melanosome membrane(GO:0033162) chitosome(GO:0045009) |
| 0.0 | 1.7 | GO:0000421 | autophagosome membrane(GO:0000421) |
| 0.0 | 0.2 | GO:0032279 | asymmetric synapse(GO:0032279) |
| 0.0 | 1.6 | GO:0000159 | protein phosphatase type 2A complex(GO:0000159) |
| 0.0 | 2.8 | GO:0030672 | synaptic vesicle membrane(GO:0030672) exocytic vesicle membrane(GO:0099501) |
| 0.0 | 0.4 | GO:0000322 | storage vacuole(GO:0000322) |
| 0.0 | 0.7 | GO:0036020 | endolysosome membrane(GO:0036020) |
| 0.0 | 0.9 | GO:0005892 | acetylcholine-gated channel complex(GO:0005892) |
| 0.0 | 4.0 | GO:0005796 | Golgi lumen(GO:0005796) |
| 0.0 | 0.7 | GO:0001527 | microfibril(GO:0001527) fibril(GO:0043205) |
| 0.0 | 0.2 | GO:0033165 | interphotoreceptor matrix(GO:0033165) |
| 0.0 | 0.2 | GO:0034388 | Pwp2p-containing subcomplex of 90S preribosome(GO:0034388) |
| 0.0 | 0.2 | GO:0070852 | cell body fiber(GO:0070852) |
| 0.0 | 0.2 | GO:0019907 | cyclin-dependent protein kinase activating kinase holoenzyme complex(GO:0019907) |
| 0.0 | 0.3 | GO:0044300 | cerebellar mossy fiber(GO:0044300) |
| 0.0 | 0.2 | GO:0005827 | polar microtubule(GO:0005827) |
| 0.0 | 0.8 | GO:0035098 | ESC/E(Z) complex(GO:0035098) |
| 0.0 | 2.8 | GO:0044449 | contractile fiber part(GO:0044449) |
| 0.0 | 0.3 | GO:0035253 | ciliary rootlet(GO:0035253) |
| 0.0 | 0.1 | GO:0045293 | MIS complex(GO:0036396) mRNA editing complex(GO:0045293) |
| 0.0 | 1.6 | GO:0019005 | SCF ubiquitin ligase complex(GO:0019005) |
| 0.0 | 0.2 | GO:0097504 | Gemini of coiled bodies(GO:0097504) |
| 0.0 | 3.2 | GO:0043209 | myelin sheath(GO:0043209) |
| 0.0 | 1.3 | GO:0016235 | aggresome(GO:0016235) |
| 0.0 | 0.3 | GO:0070938 | contractile ring(GO:0070938) |
| 0.0 | 0.8 | GO:0030687 | preribosome, large subunit precursor(GO:0030687) |
| 0.0 | 8.1 | GO:0045177 | apical part of cell(GO:0045177) |
| 0.0 | 0.1 | GO:0043527 | tRNA methyltransferase complex(GO:0043527) |
| 0.0 | 0.2 | GO:0005851 | eukaryotic translation initiation factor 2B complex(GO:0005851) |
| 0.0 | 0.2 | GO:0097225 | sperm midpiece(GO:0097225) |
| 0.0 | 6.7 | GO:0005743 | mitochondrial inner membrane(GO:0005743) |
| 0.0 | 1.4 | GO:0016528 | sarcoplasm(GO:0016528) |
| 0.0 | 0.1 | GO:0000811 | GINS complex(GO:0000811) |
| 0.0 | 0.7 | GO:0031970 | organelle envelope lumen(GO:0031970) |
| 0.0 | 1.9 | GO:0001669 | acrosomal vesicle(GO:0001669) |
| 0.0 | 0.1 | GO:0016013 | syntrophin complex(GO:0016013) |
| 0.0 | 3.1 | GO:0031968 | mitochondrial outer membrane(GO:0005741) organelle outer membrane(GO:0031968) |
| 0.0 | 2.0 | GO:0008076 | voltage-gated potassium channel complex(GO:0008076) |
| 0.0 | 1.1 | GO:0031903 | peroxisomal membrane(GO:0005778) microbody membrane(GO:0031903) |
| 0.0 | 0.4 | GO:0016281 | eukaryotic translation initiation factor 4F complex(GO:0016281) |
| 0.0 | 0.1 | GO:0097524 | sperm plasma membrane(GO:0097524) |
| 0.0 | 0.2 | GO:0017119 | Golgi transport complex(GO:0017119) |
| 0.0 | 1.0 | GO:0097610 | cleavage furrow(GO:0032154) cell surface furrow(GO:0097610) |
| 0.0 | 0.3 | GO:0000813 | ESCRT I complex(GO:0000813) |
| 0.0 | 0.1 | GO:0036021 | endolysosome lumen(GO:0036021) |
| 0.0 | 0.2 | GO:0070776 | H3 histone acetyltransferase complex(GO:0070775) MOZ/MORF histone acetyltransferase complex(GO:0070776) |
| 0.0 | 0.1 | GO:0005879 | axonemal microtubule(GO:0005879) |
| 0.0 | 0.1 | GO:0042765 | GPI-anchor transamidase complex(GO:0042765) |
| 0.0 | 0.2 | GO:0034045 | pre-autophagosomal structure membrane(GO:0034045) |
| 0.0 | 0.2 | GO:0031931 | TORC1 complex(GO:0031931) |
| 0.0 | 0.1 | GO:0042589 | zymogen granule membrane(GO:0042589) |
| 0.0 | 1.2 | GO:0008021 | synaptic vesicle(GO:0008021) |
| 0.0 | 1.3 | GO:0042734 | presynaptic membrane(GO:0042734) |
| 0.0 | 0.1 | GO:0005958 | DNA-dependent protein kinase-DNA ligase 4 complex(GO:0005958) |
| 0.0 | 0.3 | GO:0016580 | Sin3 complex(GO:0016580) |
| 0.0 | 0.2 | GO:0036513 | Derlin-1 retrotranslocation complex(GO:0036513) |
| 0.0 | 0.8 | GO:0005871 | kinesin complex(GO:0005871) |
| 0.0 | 0.7 | GO:0055038 | recycling endosome membrane(GO:0055038) |
| 0.0 | 0.1 | GO:0030681 | nucleolar ribonuclease P complex(GO:0005655) ribonuclease P complex(GO:0030677) multimeric ribonuclease P complex(GO:0030681) |
| 0.0 | 6.2 | GO:0031012 | extracellular matrix(GO:0031012) |
| 0.0 | 0.9 | GO:0005811 | lipid particle(GO:0005811) |
| 0.0 | 0.1 | GO:0097452 | GAIT complex(GO:0097452) |
| 0.0 | 0.3 | GO:0005868 | cytoplasmic dynein complex(GO:0005868) |
Gene overrepresentation in molecular function category:
| Log-likelihood per target | Total log-likelihood | Term | Description |
|---|---|---|---|
| 1.8 | 5.3 | GO:0004421 | hydroxymethylglutaryl-CoA synthase activity(GO:0004421) |
| 1.4 | 4.2 | GO:0001596 | angiotensin type I receptor activity(GO:0001596) |
| 1.3 | 5.3 | GO:0099609 | microtubule lateral binding(GO:0099609) |
| 1.1 | 3.2 | GO:0047635 | L-alanine:2-oxoglutarate aminotransferase activity(GO:0004021) alanine-oxo-acid transaminase activity(GO:0047635) |
| 1.1 | 5.3 | GO:0052839 | inositol 5-diphosphate pentakisphosphate 5-kinase activity(GO:0052836) inositol diphosphate tetrakisphosphate kinase activity(GO:0052839) |
| 0.8 | 7.7 | GO:0005332 | gamma-aminobutyric acid:sodium symporter activity(GO:0005332) |
| 0.8 | 2.3 | GO:0004998 | transferrin receptor activity(GO:0004998) |
| 0.7 | 2.1 | GO:0036505 | prosaposin receptor activity(GO:0036505) |
| 0.7 | 2.8 | GO:0032440 | 2-alkenal reductase [NAD(P)] activity(GO:0032440) |
| 0.7 | 2.8 | GO:0008336 | gamma-butyrobetaine dioxygenase activity(GO:0008336) |
| 0.7 | 2.8 | GO:0061609 | fructose-1-phosphate aldolase activity(GO:0061609) |
| 0.7 | 2.0 | GO:0080023 | 3R-hydroxyacyl-CoA dehydratase activity(GO:0080023) |
| 0.6 | 1.9 | GO:0016497 | substance K receptor activity(GO:0016497) |
| 0.6 | 1.8 | GO:0036327 | VEGF-A-activated receptor activity(GO:0036326) VEGF-B-activated receptor activity(GO:0036327) placental growth factor-activated receptor activity(GO:0036332) |
| 0.6 | 3.6 | GO:0050051 | alkane 1-monooxygenase activity(GO:0018685) leukotriene-B4 20-monooxygenase activity(GO:0050051) |
| 0.6 | 6.4 | GO:0008131 | primary amine oxidase activity(GO:0008131) |
| 0.6 | 2.3 | GO:0035248 | alpha-1,4-N-acetylgalactosaminyltransferase activity(GO:0035248) |
| 0.6 | 1.7 | GO:0015403 | thiamine uptake transmembrane transporter activity(GO:0015403) |
| 0.6 | 2.3 | GO:0102007 | lactonohydrolase activity(GO:0046573) acyl-L-homoserine-lactone lactonohydrolase activity(GO:0102007) |
| 0.6 | 2.8 | GO:0086062 | voltage-gated sodium channel activity involved in Purkinje myocyte action potential(GO:0086062) |
| 0.6 | 1.7 | GO:0015265 | urea channel activity(GO:0015265) |
| 0.6 | 3.3 | GO:0060230 | lipoprotein lipase activator activity(GO:0060230) |
| 0.5 | 2.1 | GO:0004419 | hydroxymethylglutaryl-CoA lyase activity(GO:0004419) |
| 0.5 | 1.6 | GO:0035379 | carbon dioxide transmembrane transporter activity(GO:0035379) |
| 0.5 | 1.6 | GO:0070538 | oleic acid binding(GO:0070538) |
| 0.5 | 2.6 | GO:0004991 | parathyroid hormone receptor activity(GO:0004991) |
| 0.5 | 1.5 | GO:0031737 | CX3C chemokine receptor binding(GO:0031737) |
| 0.5 | 2.4 | GO:0070653 | high-density lipoprotein particle receptor binding(GO:0070653) |
| 0.5 | 1.9 | GO:0015141 | succinate transmembrane transporter activity(GO:0015141) |
| 0.4 | 3.6 | GO:0015168 | glycerol transmembrane transporter activity(GO:0015168) |
| 0.4 | 1.3 | GO:2001069 | glycogen binding(GO:2001069) |
| 0.4 | 1.3 | GO:0008746 | NAD(P)+ transhydrogenase activity(GO:0008746) oxidoreductase activity, acting on NAD(P)H, NAD(P) as acceptor(GO:0016652) |
| 0.4 | 2.6 | GO:0016901 | glycerol-3-phosphate dehydrogenase activity(GO:0004368) oxidoreductase activity, acting on the CH-OH group of donors, quinone or similar compound as acceptor(GO:0016901) |
| 0.4 | 1.3 | GO:0060175 | brain-derived neurotrophic factor-activated receptor activity(GO:0060175) |
| 0.4 | 1.3 | GO:0005055 | laminin receptor activity(GO:0005055) |
| 0.4 | 4.6 | GO:0004897 | ciliary neurotrophic factor receptor activity(GO:0004897) |
| 0.4 | 1.6 | GO:0008431 | vitamin E binding(GO:0008431) |
| 0.4 | 1.6 | GO:0008260 | 3-oxoacid CoA-transferase activity(GO:0008260) |
| 0.4 | 1.2 | GO:0045550 | geranylgeranyl reductase activity(GO:0045550) |
| 0.4 | 4.0 | GO:0050682 | AF-2 domain binding(GO:0050682) |
| 0.4 | 1.5 | GO:0004001 | adenosine kinase activity(GO:0004001) |
| 0.4 | 2.2 | GO:0008453 | alanine-glyoxylate transaminase activity(GO:0008453) |
| 0.4 | 3.3 | GO:0086075 | gap junction channel activity involved in cardiac conduction electrical coupling(GO:0086075) |
| 0.4 | 1.8 | GO:0032795 | heterotrimeric G-protein binding(GO:0032795) |
| 0.3 | 4.2 | GO:0005243 | gap junction channel activity(GO:0005243) |
| 0.3 | 2.1 | GO:0004740 | pyruvate dehydrogenase (acetyl-transferring) kinase activity(GO:0004740) |
| 0.3 | 1.7 | GO:0004775 | succinate-CoA ligase (ADP-forming) activity(GO:0004775) |
| 0.3 | 4.1 | GO:0000099 | sulfur amino acid transmembrane transporter activity(GO:0000099) |
| 0.3 | 1.4 | GO:0008798 | beta-aspartyl-peptidase activity(GO:0008798) |
| 0.3 | 4.4 | GO:0038132 | neuregulin binding(GO:0038132) |
| 0.3 | 1.4 | GO:0051538 | 3 iron, 4 sulfur cluster binding(GO:0051538) |
| 0.3 | 2.7 | GO:0004111 | creatine kinase activity(GO:0004111) |
| 0.3 | 1.3 | GO:0070320 | inward rectifier potassium channel inhibitor activity(GO:0070320) |
| 0.3 | 1.0 | GO:0003826 | alpha-ketoacid dehydrogenase activity(GO:0003826) 3-methyl-2-oxobutanoate dehydrogenase (2-methylpropanoyl-transferring) activity(GO:0003863) |
| 0.3 | 1.9 | GO:0030172 | troponin C binding(GO:0030172) |
| 0.3 | 1.2 | GO:0008665 | 2'-phosphotransferase activity(GO:0008665) |
| 0.3 | 2.7 | GO:0008597 | calcium-dependent protein serine/threonine phosphatase regulator activity(GO:0008597) |
| 0.3 | 1.8 | GO:0015307 | drug:proton antiporter activity(GO:0015307) |
| 0.3 | 3.9 | GO:0050692 | DBD domain binding(GO:0050692) |
| 0.3 | 2.7 | GO:0070891 | lipoteichoic acid binding(GO:0070891) |
| 0.3 | 0.9 | GO:0070362 | mitochondrial light strand promoter anti-sense binding(GO:0070361) mitochondrial heavy strand promoter anti-sense binding(GO:0070362) mitochondrial heavy strand promoter sense binding(GO:0070364) |
| 0.3 | 1.1 | GO:0004382 | guanosine-diphosphatase activity(GO:0004382) |
| 0.3 | 1.4 | GO:0003990 | acetylcholinesterase activity(GO:0003990) |
| 0.3 | 1.4 | GO:0004347 | glucose-6-phosphate isomerase activity(GO:0004347) |
| 0.3 | 1.9 | GO:0086089 | voltage-gated potassium channel activity involved in atrial cardiac muscle cell action potential repolarization(GO:0086089) |
| 0.3 | 1.9 | GO:0004471 | malate dehydrogenase (decarboxylating) (NAD+) activity(GO:0004471) malate dehydrogenase (decarboxylating) (NADP+) activity(GO:0004473) |
| 0.3 | 1.9 | GO:0016713 | oxidoreductase activity, acting on paired donors, with incorporation or reduction of molecular oxygen, reduced iron-sulfur protein as one donor, and incorporation of one atom of oxygen(GO:0016713) |
| 0.3 | 1.6 | GO:0048101 | calcium- and calmodulin-regulated 3',5'-cyclic-GMP phosphodiesterase activity(GO:0048101) |
| 0.3 | 0.8 | GO:0038100 | nodal binding(GO:0038100) |
| 0.3 | 4.7 | GO:0015245 | fatty acid transporter activity(GO:0015245) |
| 0.3 | 2.1 | GO:1904288 | BAT3 complex binding(GO:1904288) |
| 0.3 | 1.3 | GO:0050501 | hyaluronan synthase activity(GO:0050501) |
| 0.3 | 1.0 | GO:0042134 | rRNA primary transcript binding(GO:0042134) |
| 0.3 | 1.3 | GO:0016647 | oxidoreductase activity, acting on the CH-NH group of donors, oxygen as acceptor(GO:0016647) |
| 0.2 | 1.5 | GO:0008113 | peptide-methionine (S)-S-oxide reductase activity(GO:0008113) |
| 0.2 | 1.5 | GO:0004647 | phosphoserine phosphatase activity(GO:0004647) |
| 0.2 | 1.2 | GO:0043183 | vascular endothelial growth factor receptor 1 binding(GO:0043183) |
| 0.2 | 1.7 | GO:0051021 | GDP-dissociation inhibitor binding(GO:0051021) Rho GDP-dissociation inhibitor binding(GO:0051022) |
| 0.2 | 4.8 | GO:0005391 | sodium:potassium-exchanging ATPase activity(GO:0005391) |
| 0.2 | 1.1 | GO:0086006 | voltage-gated sodium channel activity involved in cardiac muscle cell action potential(GO:0086006) |
| 0.2 | 6.0 | GO:0008191 | metalloendopeptidase inhibitor activity(GO:0008191) |
| 0.2 | 1.1 | GO:0047066 | phospholipid-hydroperoxide glutathione peroxidase activity(GO:0047066) |
| 0.2 | 1.7 | GO:0051373 | FATZ binding(GO:0051373) |
| 0.2 | 9.7 | GO:0001972 | retinoic acid binding(GO:0001972) |
| 0.2 | 2.6 | GO:0047498 | calcium-dependent phospholipase A2 activity(GO:0047498) |
| 0.2 | 5.9 | GO:0030898 | actin-dependent ATPase activity(GO:0030898) |
| 0.2 | 0.6 | GO:0003860 | 3-hydroxyisobutyryl-CoA hydrolase activity(GO:0003860) |
| 0.2 | 0.6 | GO:0005308 | creatine transmembrane transporter activity(GO:0005308) |
| 0.2 | 1.2 | GO:0004522 | ribonuclease A activity(GO:0004522) |
| 0.2 | 0.8 | GO:0004937 | alpha1-adrenergic receptor activity(GO:0004937) |
| 0.2 | 0.8 | GO:0004782 | sulfinoalanine decarboxylase activity(GO:0004782) |
| 0.2 | 1.8 | GO:0004022 | alcohol dehydrogenase (NAD) activity(GO:0004022) |
| 0.2 | 0.6 | GO:0003941 | L-serine ammonia-lyase activity(GO:0003941) |
| 0.2 | 1.2 | GO:0005298 | proline:sodium symporter activity(GO:0005298) |
| 0.2 | 0.8 | GO:0003865 | 3-oxo-5-alpha-steroid 4-dehydrogenase activity(GO:0003865) steroid dehydrogenase activity, acting on the CH-CH group of donors(GO:0033765) cholestenone 5-alpha-reductase activity(GO:0047751) |
| 0.2 | 1.6 | GO:0016416 | carnitine O-palmitoyltransferase activity(GO:0004095) O-palmitoyltransferase activity(GO:0016416) |
| 0.2 | 0.4 | GO:0008948 | oxaloacetate decarboxylase activity(GO:0008948) |
| 0.2 | 2.0 | GO:0016812 | hydrolase activity, acting on carbon-nitrogen (but not peptide) bonds, in cyclic amides(GO:0016812) |
| 0.2 | 2.0 | GO:0043184 | vascular endothelial growth factor receptor 2 binding(GO:0043184) |
| 0.2 | 0.6 | GO:0052856 | NADHX epimerase activity(GO:0052856) NADPHX epimerase activity(GO:0052857) |
| 0.2 | 1.2 | GO:1902122 | chenodeoxycholic acid binding(GO:1902122) |
| 0.2 | 0.9 | GO:0044736 | acid-sensing ion channel activity(GO:0044736) |
| 0.2 | 1.7 | GO:0004305 | ethanolamine kinase activity(GO:0004305) |
| 0.2 | 0.7 | GO:0005172 | vascular endothelial growth factor receptor binding(GO:0005172) |
| 0.2 | 2.7 | GO:0019841 | retinol binding(GO:0019841) |
| 0.2 | 3.6 | GO:0019911 | structural constituent of myelin sheath(GO:0019911) |
| 0.2 | 1.1 | GO:0034186 | apolipoprotein A-I binding(GO:0034186) |
| 0.2 | 3.0 | GO:0022851 | GABA-gated chloride ion channel activity(GO:0022851) |
| 0.2 | 1.1 | GO:0004792 | thiosulfate sulfurtransferase activity(GO:0004792) |
| 0.2 | 1.1 | GO:0005497 | androgen binding(GO:0005497) |
| 0.2 | 0.7 | GO:0034189 | very-low-density lipoprotein particle binding(GO:0034189) |
| 0.2 | 0.9 | GO:0035529 | NADH pyrophosphatase activity(GO:0035529) |
| 0.2 | 0.5 | GO:0030156 | benzodiazepine receptor binding(GO:0030156) |
| 0.2 | 1.7 | GO:0015250 | water channel activity(GO:0015250) |
| 0.2 | 0.7 | GO:0050567 | glutaminyl-tRNA synthase (glutamine-hydrolyzing) activity(GO:0050567) |
| 0.2 | 6.7 | GO:0051371 | muscle alpha-actinin binding(GO:0051371) |
| 0.2 | 0.7 | GO:0003858 | 3-hydroxybutyrate dehydrogenase activity(GO:0003858) |
| 0.2 | 0.5 | GO:0005199 | structural constituent of cell wall(GO:0005199) |
| 0.2 | 0.7 | GO:0004773 | steryl-sulfatase activity(GO:0004773) |
| 0.2 | 1.1 | GO:0016936 | galactoside binding(GO:0016936) |
| 0.2 | 1.3 | GO:0004614 | phosphoglucomutase activity(GO:0004614) |
| 0.2 | 0.2 | GO:0097604 | temperature-gated cation channel activity(GO:0097604) |
| 0.2 | 0.6 | GO:0000035 | acyl binding(GO:0000035) |
| 0.2 | 3.2 | GO:0004017 | adenylate kinase activity(GO:0004017) |
| 0.2 | 0.9 | GO:0004505 | phenylalanine 4-monooxygenase activity(GO:0004505) |
| 0.2 | 1.5 | GO:0042835 | BRE binding(GO:0042835) |
| 0.2 | 0.9 | GO:0031750 | D3 dopamine receptor binding(GO:0031750) |
| 0.2 | 0.9 | GO:0005017 | platelet-derived growth factor-activated receptor activity(GO:0005017) |
| 0.1 | 1.5 | GO:0015349 | thyroid hormone transmembrane transporter activity(GO:0015349) |
| 0.1 | 0.7 | GO:0050421 | oxidoreductase activity, acting on other nitrogenous compounds as donors, cytochrome as acceptor(GO:0016662) nitrite reductase (NO-forming) activity(GO:0050421) carbon monoxide binding(GO:0070025) nitrite reductase activity(GO:0098809) |
| 0.1 | 3.4 | GO:0086080 | protein binding involved in heterotypic cell-cell adhesion(GO:0086080) |
| 0.1 | 3.8 | GO:0005520 | insulin-like growth factor binding(GO:0005520) |
| 0.1 | 3.5 | GO:0031702 | type 1 angiotensin receptor binding(GO:0031702) |
| 0.1 | 4.5 | GO:0004653 | polypeptide N-acetylgalactosaminyltransferase activity(GO:0004653) |
| 0.1 | 2.2 | GO:0000774 | adenyl-nucleotide exchange factor activity(GO:0000774) |
| 0.1 | 0.4 | GO:0031626 | beta-endorphin binding(GO:0031626) |
| 0.1 | 1.1 | GO:0004359 | glutaminase activity(GO:0004359) |
| 0.1 | 0.7 | GO:0042015 | interleukin-20 binding(GO:0042015) |
| 0.1 | 0.7 | GO:0052798 | beta-galactoside alpha-2,3-sialyltransferase activity(GO:0052798) |
| 0.1 | 1.2 | GO:0004332 | fructose-bisphosphate aldolase activity(GO:0004332) |
| 0.1 | 2.2 | GO:0031821 | G-protein coupled serotonin receptor binding(GO:0031821) |
| 0.1 | 0.9 | GO:0004768 | stearoyl-CoA 9-desaturase activity(GO:0004768) acyl-CoA desaturase activity(GO:0016215) |
| 0.1 | 1.6 | GO:0001758 | retinal dehydrogenase activity(GO:0001758) |
| 0.1 | 0.5 | GO:0001601 | peptide YY receptor activity(GO:0001601) |
| 0.1 | 0.4 | GO:0090555 | phosphatidylethanolamine-translocating ATPase activity(GO:0090555) |
| 0.1 | 0.6 | GO:0000026 | alpha-1,2-mannosyltransferase activity(GO:0000026) |
| 0.1 | 1.3 | GO:0004687 | myosin light chain kinase activity(GO:0004687) |
| 0.1 | 0.5 | GO:0004117 | calmodulin-dependent cyclic-nucleotide phosphodiesterase activity(GO:0004117) |
| 0.1 | 1.8 | GO:0015501 | glutamate:sodium symporter activity(GO:0015501) |
| 0.1 | 4.8 | GO:0005104 | fibroblast growth factor receptor binding(GO:0005104) |
| 0.1 | 1.0 | GO:0004656 | procollagen-proline 4-dioxygenase activity(GO:0004656) |
| 0.1 | 1.2 | GO:0046923 | ER retention sequence binding(GO:0046923) |
| 0.1 | 1.9 | GO:0015232 | heme transporter activity(GO:0015232) |
| 0.1 | 5.3 | GO:0008093 | cytoskeletal adaptor activity(GO:0008093) |
| 0.1 | 2.4 | GO:0017034 | Rap guanyl-nucleotide exchange factor activity(GO:0017034) |
| 0.1 | 0.5 | GO:0008426 | protein kinase C inhibitor activity(GO:0008426) |
| 0.1 | 0.4 | GO:0000773 | phosphatidyl-N-methylethanolamine N-methyltransferase activity(GO:0000773) phosphatidylethanolamine N-methyltransferase activity(GO:0004608) phosphatidyl-N-dimethylethanolamine N-methyltransferase activity(GO:0080101) |
| 0.1 | 0.7 | GO:0042954 | lipoprotein transporter activity(GO:0042954) |
| 0.1 | 1.4 | GO:0004634 | phosphopyruvate hydratase activity(GO:0004634) |
| 0.1 | 2.1 | GO:0038062 | protein tyrosine kinase collagen receptor activity(GO:0038062) |
| 0.1 | 0.8 | GO:0004301 | epoxide hydrolase activity(GO:0004301) |
| 0.1 | 1.3 | GO:0035242 | protein-arginine omega-N asymmetric methyltransferase activity(GO:0035242) |
| 0.1 | 1.4 | GO:0098960 | postsynaptic neurotransmitter receptor activity(GO:0098960) |
| 0.1 | 0.9 | GO:0004468 | lysine N-acetyltransferase activity, acting on acetyl phosphate as donor(GO:0004468) |
| 0.1 | 0.6 | GO:0036042 | long-chain fatty acyl-CoA binding(GO:0036042) |
| 0.1 | 0.6 | GO:0031728 | CCR3 chemokine receptor binding(GO:0031728) |
| 0.1 | 0.2 | GO:0048403 | brain-derived neurotrophic factor binding(GO:0048403) |
| 0.1 | 0.5 | GO:0019912 | cyclin-dependent protein kinase activating kinase activity(GO:0019912) |
| 0.1 | 0.7 | GO:0052848 | endopolyphosphatase activity(GO:0000298) diphosphoinositol-polyphosphate diphosphatase activity(GO:0008486) bis(5'-adenosyl)-hexaphosphatase activity(GO:0034431) bis(5'-adenosyl)-pentaphosphatase activity(GO:0034432) inositol diphosphate tetrakisphosphate diphosphatase activity(GO:0052840) inositol bisdiphosphate tetrakisphosphate diphosphatase activity(GO:0052841) inositol diphosphate pentakisphosphate diphosphatase activity(GO:0052842) inositol-1-diphosphate-2,3,4,5,6-pentakisphosphate diphosphatase activity(GO:0052843) inositol-3-diphosphate-1,2,4,5,6-pentakisphosphate diphosphatase activity(GO:0052844) inositol-5-diphosphate-1,2,3,4,6-pentakisphosphate diphosphatase activity(GO:0052845) inositol-1,5-bisdiphosphate-2,3,4,6-tetrakisphosphate 1-diphosphatase activity(GO:0052846) inositol-1,5-bisdiphosphate-2,3,4,6-tetrakisphosphate 5-diphosphatase activity(GO:0052847) inositol-3,5-bisdiphosphate-2,3,4,6-tetrakisphosphate 5-diphosphatase activity(GO:0052848) |
| 0.1 | 1.8 | GO:1904264 | ubiquitin protein ligase activity involved in ERAD pathway(GO:1904264) |
| 0.1 | 0.2 | GO:0044020 | histone methyltransferase activity (H4-R3 specific)(GO:0044020) |
| 0.1 | 0.4 | GO:0004948 | calcitonin receptor activity(GO:0004948) |
| 0.1 | 2.0 | GO:0070324 | thyroid hormone binding(GO:0070324) |
| 0.1 | 0.6 | GO:0016941 | natriuretic peptide receptor activity(GO:0016941) |
| 0.1 | 0.6 | GO:0060228 | phosphatidylcholine-sterol O-acyltransferase activator activity(GO:0060228) |
| 0.1 | 2.1 | GO:0008430 | selenium binding(GO:0008430) |
| 0.1 | 0.8 | GO:0004046 | aminoacylase activity(GO:0004046) |
| 0.1 | 0.4 | GO:0061628 | H3K27me3 modified histone binding(GO:0061628) |
| 0.1 | 0.5 | GO:0070905 | serine binding(GO:0070905) |
| 0.1 | 2.6 | GO:0000900 | translation repressor activity, nucleic acid binding(GO:0000900) |
| 0.1 | 0.6 | GO:0004551 | nucleotide diphosphatase activity(GO:0004551) |
| 0.1 | 0.3 | GO:0015633 | zinc transporting ATPase activity(GO:0015633) |
| 0.1 | 0.6 | GO:0004833 | tryptophan 2,3-dioxygenase activity(GO:0004833) |
| 0.1 | 0.3 | GO:1990254 | keratin filament binding(GO:1990254) |
| 0.1 | 2.8 | GO:0008483 | transaminase activity(GO:0008483) |
| 0.1 | 2.5 | GO:0042813 | Wnt-activated receptor activity(GO:0042813) |
| 0.1 | 0.6 | GO:0015111 | iodide transmembrane transporter activity(GO:0015111) |
| 0.1 | 0.1 | GO:0034617 | tetrahydrobiopterin binding(GO:0034617) |
| 0.1 | 0.5 | GO:0015154 | sucrose:proton symporter activity(GO:0008506) sucrose transmembrane transporter activity(GO:0008515) disaccharide transmembrane transporter activity(GO:0015154) oligosaccharide transmembrane transporter activity(GO:0015157) |
| 0.1 | 2.3 | GO:0030247 | pattern binding(GO:0001871) polysaccharide binding(GO:0030247) |
| 0.1 | 1.4 | GO:0035374 | chondroitin sulfate binding(GO:0035374) |
| 0.1 | 0.7 | GO:0000064 | L-ornithine transmembrane transporter activity(GO:0000064) |
| 0.1 | 0.9 | GO:0070740 | tubulin-glutamic acid ligase activity(GO:0070740) |
| 0.1 | 0.6 | GO:0031705 | bombesin receptor binding(GO:0031705) |
| 0.1 | 0.3 | GO:0009384 | UDP-N-acetylglucosamine 2-epimerase activity(GO:0008761) N-acylmannosamine kinase activity(GO:0009384) |
| 0.1 | 0.4 | GO:1903135 | cupric ion binding(GO:1903135) |
| 0.1 | 0.3 | GO:0005093 | Rab GDP-dissociation inhibitor activity(GO:0005093) |
| 0.1 | 1.4 | GO:1901612 | cardiolipin binding(GO:1901612) |
| 0.1 | 0.6 | GO:0050145 | nucleoside phosphate kinase activity(GO:0050145) |
| 0.1 | 1.6 | GO:0015271 | outward rectifier potassium channel activity(GO:0015271) |
| 0.1 | 0.3 | GO:0050698 | proteoglycan sulfotransferase activity(GO:0050698) |
| 0.1 | 0.6 | GO:0005534 | galactose binding(GO:0005534) |
| 0.1 | 1.4 | GO:0030548 | acetylcholine receptor regulator activity(GO:0030548) neurotransmitter receptor regulator activity(GO:0099602) |
| 0.1 | 0.5 | GO:0004706 | JUN kinase kinase kinase activity(GO:0004706) |
| 0.1 | 3.2 | GO:0005388 | calcium-transporting ATPase activity(GO:0005388) |
| 0.1 | 1.2 | GO:0046870 | cadmium ion binding(GO:0046870) |
| 0.1 | 2.9 | GO:0071949 | FAD binding(GO:0071949) |
| 0.1 | 0.8 | GO:0008503 | benzodiazepine receptor activity(GO:0008503) |
| 0.1 | 0.5 | GO:0102008 | cytosolic dipeptidase activity(GO:0102008) |
| 0.1 | 0.4 | GO:0004994 | somatostatin receptor activity(GO:0004994) |
| 0.1 | 1.7 | GO:0070492 | oligosaccharide binding(GO:0070492) |
| 0.1 | 6.1 | GO:0017080 | sodium channel regulator activity(GO:0017080) |
| 0.1 | 0.8 | GO:0030160 | GKAP/Homer scaffold activity(GO:0030160) |
| 0.1 | 0.5 | GO:0000179 | rRNA (adenine-N6,N6-)-dimethyltransferase activity(GO:0000179) |
| 0.1 | 2.0 | GO:0001056 | RNA polymerase III activity(GO:0001056) |
| 0.1 | 0.3 | GO:0003947 | (N-acetylneuraminyl)-galactosylglucosylceramide N-acetylgalactosaminyltransferase activity(GO:0003947) |
| 0.1 | 1.8 | GO:0008179 | adenylate cyclase binding(GO:0008179) |
| 0.1 | 0.5 | GO:0003883 | CTP synthase activity(GO:0003883) |
| 0.1 | 3.2 | GO:0015269 | calcium-activated potassium channel activity(GO:0015269) |
| 0.1 | 0.4 | GO:0070576 | vitamin D 24-hydroxylase activity(GO:0070576) |
| 0.1 | 1.9 | GO:0015101 | organic cation transmembrane transporter activity(GO:0015101) |
| 0.1 | 0.5 | GO:0051425 | PTB domain binding(GO:0051425) |
| 0.1 | 0.4 | GO:0015183 | L-aspartate transmembrane transporter activity(GO:0015183) |
| 0.1 | 0.1 | GO:0033265 | choline binding(GO:0033265) |
| 0.1 | 0.2 | GO:0031783 | corticotropin hormone receptor binding(GO:0031780) type 5 melanocortin receptor binding(GO:0031783) |
| 0.1 | 1.5 | GO:0070628 | proteasome binding(GO:0070628) |
| 0.1 | 0.4 | GO:0008332 | low voltage-gated calcium channel activity(GO:0008332) |
| 0.1 | 0.7 | GO:0016670 | oxidoreductase activity, acting on a sulfur group of donors, oxygen as acceptor(GO:0016670) |
| 0.1 | 0.3 | GO:0004306 | ethanolamine-phosphate cytidylyltransferase activity(GO:0004306) |
| 0.1 | 0.6 | GO:0032184 | SUMO polymer binding(GO:0032184) |
| 0.1 | 0.5 | GO:0004045 | aminoacyl-tRNA hydrolase activity(GO:0004045) |
| 0.1 | 0.3 | GO:0004487 | methylenetetrahydrofolate dehydrogenase (NAD+) activity(GO:0004487) |
| 0.1 | 0.3 | GO:0035939 | microsatellite binding(GO:0035939) |
| 0.1 | 1.0 | GO:0045504 | dynein heavy chain binding(GO:0045504) |
| 0.1 | 0.3 | GO:0003839 | gamma-glutamylcyclotransferase activity(GO:0003839) |
| 0.1 | 0.9 | GO:0086056 | voltage-gated calcium channel activity involved in AV node cell action potential(GO:0086056) |
| 0.1 | 0.2 | GO:0052815 | medium-chain acyl-CoA hydrolase activity(GO:0052815) long-chain acyl-CoA hydrolase activity(GO:0052816) |
| 0.1 | 0.3 | GO:0032564 | adenyl deoxyribonucleotide binding(GO:0032558) dATP binding(GO:0032564) |
| 0.1 | 0.3 | GO:0004102 | choline O-acetyltransferase activity(GO:0004102) |
| 0.1 | 0.3 | GO:0004464 | leukotriene-C4 synthase activity(GO:0004464) |
| 0.1 | 0.3 | GO:0045322 | unmethylated CpG binding(GO:0045322) |
| 0.1 | 0.6 | GO:0008158 | hedgehog receptor activity(GO:0008158) |
| 0.1 | 3.1 | GO:0043539 | protein serine/threonine kinase activator activity(GO:0043539) |
| 0.1 | 1.1 | GO:0016421 | CoA carboxylase activity(GO:0016421) |
| 0.1 | 0.4 | GO:1990050 | phosphatidic acid transporter activity(GO:1990050) |
| 0.1 | 1.2 | GO:0030618 | transforming growth factor beta receptor, pathway-specific cytoplasmic mediator activity(GO:0030618) |
| 0.1 | 0.1 | GO:0038064 | collagen receptor activity(GO:0038064) |
| 0.1 | 0.2 | GO:0000247 | C-8 sterol isomerase activity(GO:0000247) |
| 0.1 | 0.7 | GO:0004445 | inositol-polyphosphate 5-phosphatase activity(GO:0004445) |
| 0.1 | 0.2 | GO:1902379 | receptor tyrosine kinase-like orphan receptor binding(GO:0005115) chemoattractant activity involved in axon guidance(GO:1902379) |
| 0.1 | 0.3 | GO:0050220 | prostaglandin-E synthase activity(GO:0050220) |
| 0.1 | 0.8 | GO:0004300 | enoyl-CoA hydratase activity(GO:0004300) |
| 0.1 | 0.2 | GO:0043682 | copper-exporting ATPase activity(GO:0004008) copper-transporting ATPase activity(GO:0043682) |
| 0.1 | 0.9 | GO:0070700 | BMP receptor binding(GO:0070700) |
| 0.1 | 0.6 | GO:0003910 | DNA ligase (ATP) activity(GO:0003910) |
| 0.1 | 1.0 | GO:0071933 | Arp2/3 complex binding(GO:0071933) |
| 0.1 | 1.5 | GO:0008242 | omega peptidase activity(GO:0008242) |
| 0.1 | 0.3 | GO:0008281 | sulfonylurea receptor activity(GO:0008281) |
| 0.1 | 0.3 | GO:0004466 | long-chain-acyl-CoA dehydrogenase activity(GO:0004466) |
| 0.1 | 0.2 | GO:0001588 | dopamine neurotransmitter receptor activity, coupled via Gs(GO:0001588) |
| 0.1 | 0.3 | GO:0018479 | benzaldehyde dehydrogenase (NAD+) activity(GO:0018479) |
| 0.1 | 0.3 | GO:0004983 | neuropeptide Y receptor activity(GO:0004983) |
| 0.1 | 0.2 | GO:0015056 | corticotrophin-releasing factor receptor activity(GO:0015056) |
| 0.1 | 0.4 | GO:0070736 | protein-glycine ligase activity, initiating(GO:0070736) |
| 0.1 | 1.0 | GO:0019864 | IgG binding(GO:0019864) |
| 0.1 | 1.1 | GO:0008253 | 5'-nucleotidase activity(GO:0008253) |
| 0.1 | 1.7 | GO:0051787 | misfolded protein binding(GO:0051787) |
| 0.1 | 0.9 | GO:0003996 | acyl-CoA ligase activity(GO:0003996) |
| 0.1 | 0.3 | GO:0005127 | ciliary neurotrophic factor receptor binding(GO:0005127) |
| 0.1 | 0.2 | GO:0071885 | N-terminal protein N-methyltransferase activity(GO:0071885) |
| 0.1 | 0.5 | GO:0071553 | uridine nucleotide receptor activity(GO:0015065) G-protein coupled pyrimidinergic nucleotide receptor activity(GO:0071553) |
| 0.1 | 0.3 | GO:0043237 | laminin-1 binding(GO:0043237) |
| 0.1 | 0.8 | GO:0005007 | fibroblast growth factor-activated receptor activity(GO:0005007) |
| 0.1 | 0.9 | GO:0030306 | ADP-ribosylation factor binding(GO:0030306) |
| 0.1 | 0.7 | GO:0004972 | NMDA glutamate receptor activity(GO:0004972) |
| 0.1 | 0.8 | GO:0017127 | cholesterol transporter activity(GO:0017127) |
| 0.1 | 0.6 | GO:0051378 | amine binding(GO:0043176) serotonin binding(GO:0051378) |
| 0.1 | 4.2 | GO:0019894 | kinesin binding(GO:0019894) |
| 0.1 | 0.2 | GO:1904047 | S-adenosyl-L-methionine binding(GO:1904047) |
| 0.1 | 0.2 | GO:0016309 | 1-phosphatidylinositol-5-phosphate 4-kinase activity(GO:0016309) |
| 0.0 | 0.6 | GO:0016832 | aldehyde-lyase activity(GO:0016832) |
| 0.0 | 0.5 | GO:0001665 | alpha-N-acetylgalactosaminide alpha-2,6-sialyltransferase activity(GO:0001665) |
| 0.0 | 1.0 | GO:0015377 | cation:chloride symporter activity(GO:0015377) |
| 0.0 | 1.4 | GO:0017049 | GTP-Rho binding(GO:0017049) |
| 0.0 | 0.2 | GO:0000702 | oxidized base lesion DNA N-glycosylase activity(GO:0000702) |
| 0.0 | 0.9 | GO:0000062 | fatty-acyl-CoA binding(GO:0000062) |
| 0.0 | 1.2 | GO:0045499 | chemorepellent activity(GO:0045499) |
| 0.0 | 0.5 | GO:0008046 | axon guidance receptor activity(GO:0008046) |
| 0.0 | 0.1 | GO:0034875 | oxidoreductase activity, acting on CH or CH2 groups, quinone or similar compound as acceptor(GO:0033695) caffeine oxidase activity(GO:0034875) |
| 0.0 | 1.9 | GO:0004181 | metallocarboxypeptidase activity(GO:0004181) |
| 0.0 | 0.1 | GO:0070984 | SET domain binding(GO:0070984) |
| 0.0 | 0.2 | GO:0004963 | follicle-stimulating hormone receptor activity(GO:0004963) |
| 0.0 | 2.9 | GO:0008137 | NADH dehydrogenase (ubiquinone) activity(GO:0008137) NADH dehydrogenase (quinone) activity(GO:0050136) |
| 0.0 | 0.2 | GO:0004461 | lactose synthase activity(GO:0004461) |
| 0.0 | 0.4 | GO:0004996 | thyroid-stimulating hormone receptor activity(GO:0004996) |
| 0.0 | 0.2 | GO:0004105 | choline-phosphate cytidylyltransferase activity(GO:0004105) |
| 0.0 | 0.2 | GO:0035515 | oxidative RNA demethylase activity(GO:0035515) |
| 0.0 | 0.2 | GO:0004977 | melanocortin receptor activity(GO:0004977) |
| 0.0 | 0.5 | GO:0016846 | carbon-sulfur lyase activity(GO:0016846) |
| 0.0 | 0.1 | GO:0030943 | mitochondrion targeting sequence binding(GO:0030943) |
| 0.0 | 2.1 | GO:0051010 | microtubule plus-end binding(GO:0051010) |
| 0.0 | 0.9 | GO:0010314 | phosphatidylinositol-5-phosphate binding(GO:0010314) |
| 0.0 | 0.9 | GO:1990459 | transferrin receptor binding(GO:1990459) |
| 0.0 | 4.6 | GO:0008307 | structural constituent of muscle(GO:0008307) |
| 0.0 | 0.8 | GO:0036312 | phosphatidylinositol 3-kinase regulatory subunit binding(GO:0036312) |
| 0.0 | 1.2 | GO:0016709 | oxidoreductase activity, acting on paired donors, with incorporation or reduction of molecular oxygen, NAD(P)H as one donor, and incorporation of one atom of oxygen(GO:0016709) |
| 0.0 | 0.5 | GO:0005347 | ATP transmembrane transporter activity(GO:0005347) ADP transmembrane transporter activity(GO:0015217) |
| 0.0 | 0.3 | GO:0004692 | cGMP-dependent protein kinase activity(GO:0004692) |
| 0.0 | 2.9 | GO:0004693 | cyclin-dependent protein serine/threonine kinase activity(GO:0004693) |
| 0.0 | 5.6 | GO:0005201 | extracellular matrix structural constituent(GO:0005201) |
| 0.0 | 0.7 | GO:1900750 | glutathione binding(GO:0043295) oligopeptide binding(GO:1900750) |
| 0.0 | 0.5 | GO:0017147 | Wnt-protein binding(GO:0017147) |
| 0.0 | 1.5 | GO:0005545 | 1-phosphatidylinositol binding(GO:0005545) |
| 0.0 | 0.4 | GO:0034711 | inhibin binding(GO:0034711) |
| 0.0 | 0.3 | GO:0005157 | macrophage colony-stimulating factor receptor binding(GO:0005157) |
| 0.0 | 1.1 | GO:0033130 | acetylcholine receptor binding(GO:0033130) |
| 0.0 | 0.7 | GO:0005227 | calcium activated cation channel activity(GO:0005227) |
| 0.0 | 0.4 | GO:0016015 | morphogen activity(GO:0016015) |
| 0.0 | 8.0 | GO:0005200 | structural constituent of cytoskeleton(GO:0005200) |
| 0.0 | 0.7 | GO:0046965 | retinoid X receptor binding(GO:0046965) |
| 0.0 | 1.2 | GO:0001087 | transcription factor activity, sequence-specific DNA binding, RNA polymerase recruiting(GO:0001011) transcription factor activity, TFIIB-class binding(GO:0001087) |
| 0.0 | 1.1 | GO:0005527 | macrolide binding(GO:0005527) FK506 binding(GO:0005528) |
| 0.0 | 1.8 | GO:0005158 | insulin receptor binding(GO:0005158) |
| 0.0 | 0.7 | GO:0004089 | carbonate dehydratase activity(GO:0004089) |
| 0.0 | 0.2 | GO:1902444 | riboflavin binding(GO:1902444) |
| 0.0 | 0.8 | GO:0016638 | oxidoreductase activity, acting on the CH-NH2 group of donors(GO:0016638) |
| 0.0 | 0.2 | GO:0031402 | sodium ion binding(GO:0031402) |
| 0.0 | 0.9 | GO:0022842 | leak channel activity(GO:0022840) narrow pore channel activity(GO:0022842) |
| 0.0 | 0.1 | GO:0008309 | double-stranded DNA exodeoxyribonuclease activity(GO:0008309) |
| 0.0 | 0.2 | GO:0004348 | glucosylceramidase activity(GO:0004348) |
| 0.0 | 0.3 | GO:0043813 | phosphatidylinositol-3,5-bisphosphate 5-phosphatase activity(GO:0043813) |
| 0.0 | 0.5 | GO:0031404 | chloride ion binding(GO:0031404) |
| 0.0 | 0.8 | GO:0004033 | aldo-keto reductase (NADP) activity(GO:0004033) |
| 0.0 | 3.9 | GO:0030276 | clathrin binding(GO:0030276) |
| 0.0 | 0.8 | GO:0005247 | voltage-gated chloride channel activity(GO:0005247) |
| 0.0 | 1.0 | GO:0008499 | UDP-galactose:beta-N-acetylglucosamine beta-1,3-galactosyltransferase activity(GO:0008499) |
| 0.0 | 0.1 | GO:0004739 | pyruvate dehydrogenase (acetyl-transferring) activity(GO:0004739) |
| 0.0 | 1.7 | GO:0016831 | carboxy-lyase activity(GO:0016831) |
| 0.0 | 1.1 | GO:0017046 | peptide hormone binding(GO:0017046) |
| 0.0 | 3.0 | GO:0004879 | RNA polymerase II transcription factor activity, ligand-activated sequence-specific DNA binding(GO:0004879) transcription factor activity, direct ligand regulated sequence-specific DNA binding(GO:0098531) |
| 0.0 | 1.2 | GO:0008188 | neuropeptide receptor activity(GO:0008188) |
| 0.0 | 2.6 | GO:0004714 | transmembrane receptor protein tyrosine kinase activity(GO:0004714) |
| 0.0 | 0.4 | GO:0004526 | ribonuclease P activity(GO:0004526) |
| 0.0 | 0.1 | GO:0052810 | 1-phosphatidylinositol-5-kinase activity(GO:0052810) |
| 0.0 | 0.9 | GO:0022848 | acetylcholine-gated cation channel activity(GO:0022848) |
| 0.0 | 0.3 | GO:0003857 | 3-hydroxyacyl-CoA dehydrogenase activity(GO:0003857) |
| 0.0 | 0.1 | GO:0008174 | mRNA methyltransferase activity(GO:0008174) |
| 0.0 | 0.2 | GO:0015450 | P-P-bond-hydrolysis-driven protein transmembrane transporter activity(GO:0015450) |
| 0.0 | 1.0 | GO:0016876 | aminoacyl-tRNA ligase activity(GO:0004812) ligase activity, forming carbon-oxygen bonds(GO:0016875) ligase activity, forming aminoacyl-tRNA and related compounds(GO:0016876) |
| 0.0 | 0.6 | GO:0051393 | alpha-actinin binding(GO:0051393) |
| 0.0 | 0.5 | GO:0042043 | neurexin family protein binding(GO:0042043) |
| 0.0 | 0.7 | GO:0016854 | racemase and epimerase activity(GO:0016854) |
| 0.0 | 0.4 | GO:0031957 | very long-chain fatty acid-CoA ligase activity(GO:0031957) |
| 0.0 | 0.1 | GO:0008422 | beta-glucosidase activity(GO:0008422) |
| 0.0 | 0.3 | GO:0008109 | N-acetyllactosaminide beta-1,6-N-acetylglucosaminyltransferase activity(GO:0008109) |
| 0.0 | 0.1 | GO:0008502 | melatonin receptor activity(GO:0008502) |
| 0.0 | 3.5 | GO:0098811 | transcriptional activator activity, RNA polymerase II transcription factor binding(GO:0001190) transcriptional repressor activity, RNA polymerase II activating transcription factor binding(GO:0098811) |
| 0.0 | 0.1 | GO:0048763 | calcium-induced calcium release activity(GO:0048763) |
| 0.0 | 0.4 | GO:0004303 | estradiol 17-beta-dehydrogenase activity(GO:0004303) |
| 0.0 | 0.3 | GO:0042301 | phosphate ion binding(GO:0042301) |
| 0.0 | 0.1 | GO:0072345 | NAADP-sensitive calcium-release channel activity(GO:0072345) |
| 0.0 | 2.0 | GO:0004864 | protein phosphatase inhibitor activity(GO:0004864) |
| 0.0 | 0.4 | GO:0019531 | oxalate transmembrane transporter activity(GO:0019531) |
| 0.0 | 0.4 | GO:0048156 | tau protein binding(GO:0048156) |
| 0.0 | 0.2 | GO:0097001 | ceramide binding(GO:0097001) |
| 0.0 | 0.1 | GO:0004572 | mannosyl-oligosaccharide 1,3-1,6-alpha-mannosidase activity(GO:0004572) |
| 0.0 | 0.2 | GO:0001733 | galactosylceramide sulfotransferase activity(GO:0001733) galactose 3-O-sulfotransferase activity(GO:0050694) |
| 0.0 | 0.4 | GO:0004602 | glutathione peroxidase activity(GO:0004602) |
| 0.0 | 0.9 | GO:0008066 | glutamate receptor activity(GO:0008066) |
| 0.0 | 0.6 | GO:0008574 | ATP-dependent microtubule motor activity, plus-end-directed(GO:0008574) |
| 0.0 | 0.1 | GO:0005173 | stem cell factor receptor binding(GO:0005173) |
| 0.0 | 0.3 | GO:0004459 | L-lactate dehydrogenase activity(GO:0004459) |
| 0.0 | 0.1 | GO:0005166 | neurotrophin p75 receptor binding(GO:0005166) |
| 0.0 | 0.4 | GO:0015386 | potassium:proton antiporter activity(GO:0015386) |
| 0.0 | 0.7 | GO:0008527 | taste receptor activity(GO:0008527) |
| 0.0 | 0.6 | GO:0005212 | structural constituent of eye lens(GO:0005212) |
| 0.0 | 2.8 | GO:0051117 | ATPase binding(GO:0051117) |
| 0.0 | 0.6 | GO:0005326 | neurotransmitter transporter activity(GO:0005326) |
| 0.0 | 1.0 | GO:0005246 | calcium channel regulator activity(GO:0005246) |
| 0.0 | 0.2 | GO:0000155 | phosphorelay sensor kinase activity(GO:0000155) |
| 0.0 | 0.8 | GO:0015002 | cytochrome-c oxidase activity(GO:0004129) heme-copper terminal oxidase activity(GO:0015002) oxidoreductase activity, acting on a heme group of donors, oxygen as acceptor(GO:0016676) |
| 0.0 | 0.2 | GO:0008508 | bile acid:sodium symporter activity(GO:0008508) |
| 0.0 | 0.2 | GO:0010484 | H3 histone acetyltransferase activity(GO:0010484) |
| 0.0 | 1.0 | GO:0097110 | scaffold protein binding(GO:0097110) |
| 0.0 | 0.6 | GO:0051537 | 2 iron, 2 sulfur cluster binding(GO:0051537) |
| 0.0 | 3.1 | GO:0005262 | calcium channel activity(GO:0005262) |
| 0.0 | 0.3 | GO:0005132 | type I interferon receptor binding(GO:0005132) |
| 0.0 | 0.3 | GO:0048018 | receptor agonist activity(GO:0048018) |
| 0.0 | 0.4 | GO:0047617 | acyl-CoA hydrolase activity(GO:0047617) |
| 0.0 | 0.2 | GO:0004985 | opioid receptor activity(GO:0004985) |
| 0.0 | 2.4 | GO:0051087 | chaperone binding(GO:0051087) |
| 0.0 | 0.1 | GO:0004161 | dimethylallyltranstransferase activity(GO:0004161) geranyltranstransferase activity(GO:0004337) |
| 0.0 | 0.2 | GO:0043533 | inositol 1,3,4,5 tetrakisphosphate binding(GO:0043533) |
| 0.0 | 1.1 | GO:0004385 | guanylate kinase activity(GO:0004385) |
| 0.0 | 0.3 | GO:0008020 | G-protein coupled photoreceptor activity(GO:0008020) |
| 0.0 | 0.4 | GO:0004791 | thioredoxin-disulfide reductase activity(GO:0004791) |
| 0.0 | 0.6 | GO:0045294 | alpha-catenin binding(GO:0045294) |
| 0.0 | 0.4 | GO:0031698 | beta-2 adrenergic receptor binding(GO:0031698) corticotropin-releasing hormone receptor 1 binding(GO:0051430) |
| 0.0 | 0.1 | GO:0004719 | protein-L-isoaspartate (D-aspartate) O-methyltransferase activity(GO:0004719) |
| 0.0 | 0.4 | GO:0017070 | U6 snRNA binding(GO:0017070) |
| 0.0 | 0.1 | GO:0042165 | neurotransmitter binding(GO:0042165) |
| 0.0 | 0.2 | GO:0001025 | RNA polymerase III transcription factor binding(GO:0001025) |
| 0.0 | 0.5 | GO:0008200 | ion channel inhibitor activity(GO:0008200) |
| 0.0 | 0.2 | GO:0004727 | prenylated protein tyrosine phosphatase activity(GO:0004727) |
| 0.0 | 0.4 | GO:0004890 | GABA-A receptor activity(GO:0004890) |
| 0.0 | 0.1 | GO:0016907 | G-protein coupled acetylcholine receptor activity(GO:0016907) |
| 0.0 | 0.1 | GO:1990699 | palmitoleyl hydrolase activity(GO:1990699) |
| 0.0 | 0.3 | GO:0005225 | volume-sensitive anion channel activity(GO:0005225) |
| 0.0 | 0.1 | GO:0045505 | dynein intermediate chain binding(GO:0045505) |
| 0.0 | 0.3 | GO:0047372 | acylglycerol lipase activity(GO:0047372) |
| 0.0 | 0.1 | GO:0042799 | histone methyltransferase activity (H4-K20 specific)(GO:0042799) |
| 0.0 | 0.3 | GO:0031005 | filamin binding(GO:0031005) |
| 0.0 | 0.1 | GO:0004982 | N-formyl peptide receptor activity(GO:0004982) |
| 0.0 | 0.8 | GO:0015078 | hydrogen ion transmembrane transporter activity(GO:0015078) |
| 0.0 | 1.3 | GO:0003777 | microtubule motor activity(GO:0003777) |
| 0.0 | 0.1 | GO:0003923 | GPI-anchor transamidase activity(GO:0003923) |
| 0.0 | 1.0 | GO:0005549 | odorant binding(GO:0005549) |
| 0.0 | 0.7 | GO:0050660 | flavin adenine dinucleotide binding(GO:0050660) |
| 0.0 | 0.1 | GO:0043139 | 5'-3' DNA helicase activity(GO:0043139) |
| 0.0 | 0.6 | GO:0005452 | inorganic anion exchanger activity(GO:0005452) |
| 0.0 | 0.1 | GO:0071987 | WD40-repeat domain binding(GO:0071987) |
| 0.0 | 0.4 | GO:0097200 | cysteine-type endopeptidase activity involved in execution phase of apoptosis(GO:0097200) |
| 0.0 | 0.1 | GO:0004844 | uracil DNA N-glycosylase activity(GO:0004844) deaminated base DNA N-glycosylase activity(GO:0097506) |
| 0.0 | 0.1 | GO:0008048 | calcium sensitive guanylate cyclase activator activity(GO:0008048) |
| 0.0 | 0.0 | GO:0016714 | oxidoreductase activity, acting on paired donors, with incorporation or reduction of molecular oxygen, reduced pteridine as one donor, and incorporation of one atom of oxygen(GO:0016714) |
| 0.0 | 0.3 | GO:0016175 | superoxide-generating NADPH oxidase activity(GO:0016175) |
| 0.0 | 1.6 | GO:0005267 | potassium channel activity(GO:0005267) |
| 0.0 | 0.6 | GO:0071837 | HMG box domain binding(GO:0071837) |
| 0.0 | 0.1 | GO:0097109 | neuroligin family protein binding(GO:0097109) |
| 0.0 | 2.2 | GO:0004222 | metalloendopeptidase activity(GO:0004222) |
| 0.0 | 0.1 | GO:0004935 | adrenergic receptor activity(GO:0004935) |
| 0.0 | 0.2 | GO:0043522 | leucine zipper domain binding(GO:0043522) |
| 0.0 | 0.1 | GO:0071532 | ankyrin repeat binding(GO:0071532) |
| 0.0 | 0.6 | GO:0008139 | nuclear localization sequence binding(GO:0008139) |
| 0.0 | 0.3 | GO:0016881 | acid-amino acid ligase activity(GO:0016881) |
| 0.0 | 0.2 | GO:0016018 | cyclosporin A binding(GO:0016018) |
| 0.0 | 0.2 | GO:0008199 | ferric iron binding(GO:0008199) |
| 0.0 | 0.3 | GO:0001968 | fibronectin binding(GO:0001968) |
| 0.0 | 3.2 | GO:0004984 | olfactory receptor activity(GO:0004984) |
| 0.0 | 0.2 | GO:0043236 | laminin binding(GO:0043236) |
| 0.0 | 0.2 | GO:0008656 | cysteine-type endopeptidase activator activity involved in apoptotic process(GO:0008656) |
| 0.0 | 1.4 | GO:0005179 | hormone activity(GO:0005179) |
| 0.0 | 0.1 | GO:0004137 | deoxycytidine kinase activity(GO:0004137) thymidine kinase activity(GO:0004797) |
| 0.0 | 0.1 | GO:0004969 | histamine receptor activity(GO:0004969) |
Gene overrepresentation in curated gene sets: canonical pathways category:
| Log-likelihood per target | Total log-likelihood | Term | Description |
|---|---|---|---|
| 0.2 | 5.1 | PID INTEGRIN4 PATHWAY | Alpha6 beta4 integrin-ligand interactions |
| 0.2 | 3.8 | PID VEGF VEGFR PATHWAY | VEGF and VEGFR signaling network |
| 0.2 | 4.9 | PID P38 GAMMA DELTA PATHWAY | Signaling mediated by p38-gamma and p38-delta |
| 0.1 | 10.0 | PID AVB3 OPN PATHWAY | Osteopontin-mediated events |
| 0.1 | 0.6 | PID AR NONGENOMIC PATHWAY | Nongenotropic Androgen signaling |
| 0.1 | 2.5 | PID ALK2 PATHWAY | ALK2 signaling events |
| 0.1 | 3.3 | PID ALK1 PATHWAY | ALK1 signaling events |
| 0.1 | 4.1 | PID S1P S1P2 PATHWAY | S1P2 pathway |
| 0.1 | 1.7 | PID INTEGRIN5 PATHWAY | Beta5 beta6 beta7 and beta8 integrin cell surface interactions |
| 0.1 | 4.1 | PID P38 MKK3 6PATHWAY | p38 MAPK signaling pathway |
| 0.1 | 9.0 | PID HNF3B PATHWAY | FOXA2 and FOXA3 transcription factor networks |
| 0.1 | 1.8 | PID NETRIN PATHWAY | Netrin-mediated signaling events |
| 0.1 | 0.8 | PID SYNDECAN 2 PATHWAY | Syndecan-2-mediated signaling events |
| 0.1 | 0.9 | PID ARF6 DOWNSTREAM PATHWAY | Arf6 downstream pathway |
| 0.1 | 6.8 | PID A6B1 A6B4 INTEGRIN PATHWAY | a6b1 and a6b4 Integrin signaling |
| 0.1 | 6.5 | SIG REGULATION OF THE ACTIN CYTOSKELETON BY RHO GTPASES | Genes related to regulation of the actin cytoskeleton |
| 0.1 | 5.0 | PID RXR VDR PATHWAY | RXR and RAR heterodimerization with other nuclear receptor |
| 0.1 | 1.1 | PID PDGFRA PATHWAY | PDGFR-alpha signaling pathway |
| 0.1 | 0.2 | SA CASPASE CASCADE | Apoptosis is mediated by caspases, cysteine proteases arranged in a proteolytic cascade. |
| 0.1 | 4.2 | PID EPHB FWD PATHWAY | EPHB forward signaling |
| 0.1 | 1.2 | ST PHOSPHOINOSITIDE 3 KINASE PATHWAY | PI3K Pathway |
| 0.1 | 3.3 | PID NCADHERIN PATHWAY | N-cadherin signaling events |
| 0.1 | 1.0 | ST INTERFERON GAMMA PATHWAY | Interferon gamma pathway. |
| 0.1 | 1.7 | PID RET PATHWAY | Signaling events regulated by Ret tyrosine kinase |
| 0.1 | 1.9 | PID PRL SIGNALING EVENTS PATHWAY | Signaling events mediated by PRL |
| 0.1 | 0.7 | PID TCPTP PATHWAY | Signaling events mediated by TCPTP |
| 0.1 | 1.3 | PID INSULIN PATHWAY | Insulin Pathway |
| 0.0 | 0.9 | PID EPHA FWDPATHWAY | EPHA forward signaling |
| 0.0 | 5.1 | PID TRKR PATHWAY | Neurotrophic factor-mediated Trk receptor signaling |
| 0.0 | 2.3 | ST ADRENERGIC | Adrenergic Pathway |
| 0.0 | 3.3 | PID ARF6 TRAFFICKING PATHWAY | Arf6 trafficking events |
| 0.0 | 1.1 | PID INTEGRIN3 PATHWAY | Beta3 integrin cell surface interactions |
| 0.0 | 1.8 | PID AP1 PATHWAY | AP-1 transcription factor network |
| 0.0 | 2.3 | NABA BASEMENT MEMBRANES | Genes encoding structural components of basement membranes |
| 0.0 | 2.4 | NABA PROTEOGLYCANS | Genes encoding proteoglycans |
| 0.0 | 2.4 | PID DELTA NP63 PATHWAY | Validated transcriptional targets of deltaNp63 isoforms |
| 0.0 | 1.1 | PID HEDGEHOG 2PATHWAY | Signaling events mediated by the Hedgehog family |
| 0.0 | 9.7 | NABA ECM GLYCOPROTEINS | Genes encoding structural ECM glycoproteins |
| 0.0 | 1.3 | PID HDAC CLASSIII PATHWAY | Signaling events mediated by HDAC Class III |
| 0.0 | 2.0 | PID MTOR 4PATHWAY | mTOR signaling pathway |
| 0.0 | 2.0 | ST FAS SIGNALING PATHWAY | Fas Signaling Pathway |
| 0.0 | 0.5 | PID ERBB2 ERBB3 PATHWAY | ErbB2/ErbB3 signaling events |
| 0.0 | 1.1 | PID CONE PATHWAY | Visual signal transduction: Cones |
| 0.0 | 3.1 | PID CASPASE PATHWAY | Caspase cascade in apoptosis |
| 0.0 | 0.9 | PID INSULIN GLUCOSE PATHWAY | Insulin-mediated glucose transport |
| 0.0 | 0.3 | PID TOLL ENDOGENOUS PATHWAY | Endogenous TLR signaling |
| 0.0 | 0.8 | PID LIS1 PATHWAY | Lissencephaly gene (LIS1) in neuronal migration and development |
| 0.0 | 0.4 | PID IL23 PATHWAY | IL23-mediated signaling events |
| 0.0 | 1.2 | NABA COLLAGENS | Genes encoding collagen proteins |
| 0.0 | 0.7 | ST GA13 PATHWAY | G alpha 13 Pathway |
| 0.0 | 0.3 | PID S1P S1P3 PATHWAY | S1P3 pathway |
| 0.0 | 0.8 | PID ERBB NETWORK PATHWAY | ErbB receptor signaling network |
| 0.0 | 0.6 | PID TGFBR PATHWAY | TGF-beta receptor signaling |
| 0.0 | 1.2 | PID FGF PATHWAY | FGF signaling pathway |
| 0.0 | 0.8 | PID ECADHERIN NASCENT AJ PATHWAY | E-cadherin signaling in the nascent adherens junction |
| 0.0 | 0.5 | PID INTEGRIN A9B1 PATHWAY | Alpha9 beta1 integrin signaling events |
| 0.0 | 0.3 | PID HIF1A PATHWAY | Hypoxic and oxygen homeostasis regulation of HIF-1-alpha |
| 0.0 | 0.5 | PID AJDISS 2PATHWAY | Posttranslational regulation of adherens junction stability and dissassembly |
| 0.0 | 2.2 | PID MYC REPRESS PATHWAY | Validated targets of C-MYC transcriptional repression |
| 0.0 | 0.1 | PID P38 ALPHA BETA PATHWAY | Regulation of p38-alpha and p38-beta |
| 0.0 | 0.2 | PID ANGIOPOIETIN RECEPTOR PATHWAY | Angiopoietin receptor Tie2-mediated signaling |
| 0.0 | 0.1 | PID SYNDECAN 1 PATHWAY | Syndecan-1-mediated signaling events |
| 0.0 | 0.1 | ST GA12 PATHWAY | G alpha 12 Pathway |
| 0.0 | 0.6 | PID BMP PATHWAY | BMP receptor signaling |
Gene overrepresentation in curated gene sets: REACTOME pathways category:
| Log-likelihood per target | Total log-likelihood | Term | Description |
|---|---|---|---|
| 0.4 | 6.9 | REACTOME PASSIVE TRANSPORT BY AQUAPORINS | Genes involved in Passive Transport by Aquaporins |
| 0.2 | 6.9 | REACTOME GAP JUNCTION ASSEMBLY | Genes involved in Gap junction assembly |
| 0.2 | 9.1 | REACTOME NA CL DEPENDENT NEUROTRANSMITTER TRANSPORTERS | Genes involved in Na+/Cl- dependent neurotransmitter transporters |
| 0.2 | 4.7 | REACTOME SIGNALING BY FGFR3 MUTANTS | Genes involved in Signaling by FGFR3 mutants |
| 0.2 | 7.4 | REACTOME AMINO ACID SYNTHESIS AND INTERCONVERSION TRANSAMINATION | Genes involved in Amino acid synthesis and interconversion (transamination) |
| 0.2 | 5.7 | REACTOME CHYLOMICRON MEDIATED LIPID TRANSPORT | Genes involved in Chylomicron-mediated lipid transport |
| 0.2 | 6.6 | REACTOME REGULATION OF INSULIN LIKE GROWTH FACTOR IGF ACTIVITY BY INSULIN LIKE GROWTH FACTOR BINDING PROTEINS IGFBPS | Genes involved in Regulation of Insulin-like Growth Factor (IGF) Activity by Insulin-like Growth Factor Binding Proteins (IGFBPs) |
| 0.2 | 3.0 | REACTOME CREATION OF C4 AND C2 ACTIVATORS | Genes involved in Creation of C4 and C2 activators |
| 0.1 | 3.1 | REACTOME VEGF LIGAND RECEPTOR INTERACTIONS | Genes involved in VEGF ligand-receptor interactions |
| 0.1 | 2.1 | REACTOME SYNTHESIS OF BILE ACIDS AND BILE SALTS VIA 24 HYDROXYCHOLESTEROL | Genes involved in Synthesis of bile acids and bile salts via 24-hydroxycholesterol |
| 0.1 | 6.0 | REACTOME CASPASE MEDIATED CLEAVAGE OF CYTOSKELETAL PROTEINS | Genes involved in Caspase-mediated cleavage of cytoskeletal proteins |
| 0.1 | 5.9 | REACTOME SYNTHESIS OF PA | Genes involved in Synthesis of PA |
| 0.1 | 1.5 | REACTOME GLUTAMATE NEUROTRANSMITTER RELEASE CYCLE | Genes involved in Glutamate Neurotransmitter Release Cycle |
| 0.1 | 2.5 | REACTOME MITOCHONDRIAL FATTY ACID BETA OXIDATION | Genes involved in Mitochondrial Fatty Acid Beta-Oxidation |
| 0.1 | 2.2 | REACTOME SYNTHESIS OF PC | Genes involved in Synthesis of PC |
| 0.1 | 8.8 | REACTOME ION TRANSPORT BY P TYPE ATPASES | Genes involved in Ion transport by P-type ATPases |
| 0.1 | 0.5 | REACTOME HEMOSTASIS | Genes involved in Hemostasis |
| 0.1 | 2.2 | REACTOME ROLE OF DCC IN REGULATING APOPTOSIS | Genes involved in Role of DCC in regulating apoptosis |
| 0.1 | 1.9 | REACTOME AMINE COMPOUND SLC TRANSPORTERS | Genes involved in Amine compound SLC transporters |
| 0.1 | 3.6 | REACTOME CITRIC ACID CYCLE TCA CYCLE | Genes involved in Citric acid cycle (TCA cycle) |
| 0.1 | 2.2 | REACTOME REGULATION OF PYRUVATE DEHYDROGENASE PDH COMPLEX | Genes involved in Regulation of pyruvate dehydrogenase (PDH) complex |
| 0.1 | 3.4 | REACTOME GLUCURONIDATION | Genes involved in Glucuronidation |
| 0.1 | 2.9 | REACTOME CLASS C 3 METABOTROPIC GLUTAMATE PHEROMONE RECEPTORS | Genes involved in Class C/3 (Metabotropic glutamate/pheromone receptors) |
| 0.1 | 6.2 | REACTOME INTERACTION BETWEEN L1 AND ANKYRINS | Genes involved in Interaction between L1 and Ankyrins |
| 0.1 | 2.4 | REACTOME BILE SALT AND ORGANIC ANION SLC TRANSPORTERS | Genes involved in Bile salt and organic anion SLC transporters |
| 0.1 | 3.0 | REACTOME NOREPINEPHRINE NEUROTRANSMITTER RELEASE CYCLE | Genes involved in Norepinephrine Neurotransmitter Release Cycle |
| 0.1 | 1.7 | REACTOME ANDROGEN BIOSYNTHESIS | Genes involved in Androgen biosynthesis |
| 0.1 | 1.5 | REACTOME DIGESTION OF DIETARY CARBOHYDRATE | Genes involved in Digestion of dietary carbohydrate |
| 0.1 | 1.7 | REACTOME PYRUVATE METABOLISM AND CITRIC ACID TCA CYCLE | Genes involved in Pyruvate metabolism and Citric Acid (TCA) cycle |
| 0.1 | 1.3 | REACTOME TRYPTOPHAN CATABOLISM | Genes involved in Tryptophan catabolism |
| 0.1 | 0.5 | REACTOME DESTABILIZATION OF MRNA BY AUF1 HNRNP D0 | Genes involved in Destabilization of mRNA by AUF1 (hnRNP D0) |
| 0.1 | 0.4 | REACTOME DOPAMINE NEUROTRANSMITTER RELEASE CYCLE | Genes involved in Dopamine Neurotransmitter Release Cycle |
| 0.1 | 4.2 | REACTOME GABA A RECEPTOR ACTIVATION | Genes involved in GABA A receptor activation |
| 0.1 | 6.9 | REACTOME GLUCONEOGENESIS | Genes involved in Gluconeogenesis |
| 0.1 | 12.6 | REACTOME NUCLEAR RECEPTOR TRANSCRIPTION PATHWAY | Genes involved in Nuclear Receptor transcription pathway |
| 0.1 | 2.7 | REACTOME BRANCHED CHAIN AMINO ACID CATABOLISM | Genes involved in Branched-chain amino acid catabolism |
| 0.1 | 4.6 | REACTOME ADHERENS JUNCTIONS INTERACTIONS | Genes involved in Adherens junctions interactions |
| 0.1 | 2.4 | REACTOME SULFUR AMINO ACID METABOLISM | Genes involved in Sulfur amino acid metabolism |
| 0.1 | 5.2 | REACTOME AMINO ACID TRANSPORT ACROSS THE PLASMA MEMBRANE | Genes involved in Amino acid transport across the plasma membrane |
| 0.1 | 1.7 | REACTOME HDL MEDIATED LIPID TRANSPORT | Genes involved in HDL-mediated lipid transport |
| 0.1 | 5.4 | REACTOME CYTOCHROME P450 ARRANGED BY SUBSTRATE TYPE | Genes involved in Cytochrome P450 - arranged by substrate type |
| 0.1 | 1.9 | REACTOME DSCAM INTERACTIONS | Genes involved in DSCAM interactions |
| 0.1 | 1.3 | REACTOME BASIGIN INTERACTIONS | Genes involved in Basigin interactions |
| 0.1 | 2.1 | REACTOME SYNTHESIS OF PE | Genes involved in Synthesis of PE |
| 0.1 | 4.1 | REACTOME GLUTATHIONE CONJUGATION | Genes involved in Glutathione conjugation |
| 0.1 | 2.1 | REACTOME APOPTOTIC CLEAVAGE OF CELL ADHESION PROTEINS | Genes involved in Apoptotic cleavage of cell adhesion proteins |
| 0.1 | 4.5 | REACTOME SEMA4D IN SEMAPHORIN SIGNALING | Genes involved in Sema4D in semaphorin signaling |
| 0.1 | 1.9 | REACTOME INHIBITION OF VOLTAGE GATED CA2 CHANNELS VIA GBETA GAMMA SUBUNITS | Genes involved in Inhibition of voltage gated Ca2+ channels via Gbeta/gamma subunits |
| 0.1 | 3.1 | REACTOME SYNTHESIS AND INTERCONVERSION OF NUCLEOTIDE DI AND TRIPHOSPHATES | Genes involved in Synthesis and interconversion of nucleotide di- and triphosphates |
| 0.1 | 3.0 | REACTOME P130CAS LINKAGE TO MAPK SIGNALING FOR INTEGRINS | Genes involved in p130Cas linkage to MAPK signaling for integrins |
| 0.1 | 3.6 | REACTOME TIGHT JUNCTION INTERACTIONS | Genes involved in Tight junction interactions |
| 0.1 | 2.0 | REACTOME RNA POL III CHAIN ELONGATION | Genes involved in RNA Polymerase III Chain Elongation |
| 0.1 | 2.3 | REACTOME CS DS DEGRADATION | Genes involved in CS/DS degradation |
| 0.1 | 0.8 | REACTOME GLYCOPROTEIN HORMONES | Genes involved in Glycoprotein hormones |
| 0.1 | 2.2 | REACTOME PHASE1 FUNCTIONALIZATION OF COMPOUNDS | Genes involved in Phase 1 - Functionalization of compounds |
| 0.1 | 0.3 | REACTOME INFLUENZA VIRAL RNA TRANSCRIPTION AND REPLICATION | Genes involved in Influenza Viral RNA Transcription and Replication |
| 0.1 | 0.3 | REACTOME G PROTEIN ACTIVATION | Genes involved in G-protein activation |
| 0.1 | 1.1 | REACTOME SPRY REGULATION OF FGF SIGNALING | Genes involved in Spry regulation of FGF signaling |
| 0.1 | 1.0 | REACTOME RECEPTOR LIGAND BINDING INITIATES THE SECOND PROTEOLYTIC CLEAVAGE OF NOTCH RECEPTOR | Genes involved in Receptor-ligand binding initiates the second proteolytic cleavage of Notch receptor |
| 0.1 | 3.6 | REACTOME SMOOTH MUSCLE CONTRACTION | Genes involved in Smooth Muscle Contraction |
| 0.1 | 2.1 | REACTOME NUCLEOTIDE LIKE PURINERGIC RECEPTORS | Genes involved in Nucleotide-like (purinergic) receptors |
| 0.1 | 1.0 | REACTOME NRIF SIGNALS CELL DEATH FROM THE NUCLEUS | Genes involved in NRIF signals cell death from the nucleus |
| 0.1 | 0.9 | REACTOME TETRAHYDROBIOPTERIN BH4 SYNTHESIS RECYCLING SALVAGE AND REGULATION | Genes involved in Tetrahydrobiopterin (BH4) synthesis, recycling, salvage and regulation |
| 0.1 | 1.7 | REACTOME AMINO ACID AND OLIGOPEPTIDE SLC TRANSPORTERS | Genes involved in Amino acid and oligopeptide SLC transporters |
| 0.1 | 1.1 | REACTOME PYRIMIDINE CATABOLISM | Genes involved in Pyrimidine catabolism |
| 0.1 | 1.2 | REACTOME TRANSPORT OF ORGANIC ANIONS | Genes involved in Transport of organic anions |
| 0.1 | 11.0 | REACTOME PPARA ACTIVATES GENE EXPRESSION | Genes involved in PPARA Activates Gene Expression |
| 0.1 | 1.5 | REACTOME ACTIVATION OF RAC | Genes involved in Activation of Rac |
| 0.1 | 5.1 | REACTOME ACTIVATION OF CHAPERONE GENES BY XBP1S | Genes involved in Activation of Chaperone Genes by XBP1(S) |
| 0.1 | 1.3 | REACTOME SIGNAL ATTENUATION | Genes involved in Signal attenuation |
| 0.1 | 1.9 | REACTOME RAS ACTIVATION UOPN CA2 INFUX THROUGH NMDA RECEPTOR | Genes involved in Ras activation uopn Ca2+ infux through NMDA receptor |
| 0.1 | 1.9 | REACTOME ENDOSOMAL SORTING COMPLEX REQUIRED FOR TRANSPORT ESCRT | Genes involved in Endosomal Sorting Complex Required For Transport (ESCRT) |
| 0.1 | 2.0 | REACTOME POST CHAPERONIN TUBULIN FOLDING PATHWAY | Genes involved in Post-chaperonin tubulin folding pathway |
| 0.0 | 3.7 | REACTOME VOLTAGE GATED POTASSIUM CHANNELS | Genes involved in Voltage gated Potassium channels |
| 0.0 | 8.8 | REACTOME METABOLISM OF AMINO ACIDS AND DERIVATIVES | Genes involved in Metabolism of amino acids and derivatives |
| 0.0 | 1.8 | REACTOME ADP SIGNALLING THROUGH P2RY12 | Genes involved in ADP signalling through P2Y purinoceptor 12 |
| 0.0 | 0.7 | REACTOME OXYGEN DEPENDENT PROLINE HYDROXYLATION OF HYPOXIA INDUCIBLE FACTOR ALPHA | Genes involved in Oxygen-dependent Proline Hydroxylation of Hypoxia-inducible Factor Alpha |
| 0.0 | 2.0 | REACTOME TRAFFICKING OF GLUR2 CONTAINING AMPA RECEPTORS | Genes involved in Trafficking of GluR2-containing AMPA receptors |
| 0.0 | 2.4 | REACTOME STRIATED MUSCLE CONTRACTION | Genes involved in Striated Muscle Contraction |
| 0.0 | 1.0 | REACTOME ABCA TRANSPORTERS IN LIPID HOMEOSTASIS | Genes involved in ABCA transporters in lipid homeostasis |
| 0.0 | 0.7 | REACTOME TRAFFICKING AND PROCESSING OF ENDOSOMAL TLR | Genes involved in Trafficking and processing of endosomal TLR |
| 0.0 | 0.7 | REACTOME REVERSIBLE HYDRATION OF CARBON DIOXIDE | Genes involved in Reversible Hydration of Carbon Dioxide |
| 0.0 | 1.0 | REACTOME MITOCHONDRIAL TRNA AMINOACYLATION | Genes involved in Mitochondrial tRNA aminoacylation |
| 0.0 | 0.6 | REACTOME INWARDLY RECTIFYING K CHANNELS | Genes involved in Inwardly rectifying K+ channels |
| 0.0 | 1.7 | REACTOME KINESINS | Genes involved in Kinesins |
| 0.0 | 3.1 | REACTOME METABOLISM OF VITAMINS AND COFACTORS | Genes involved in Metabolism of vitamins and cofactors |
| 0.0 | 0.7 | REACTOME AQUAPORIN MEDIATED TRANSPORT | Genes involved in Aquaporin-mediated transport |
| 0.0 | 0.5 | REACTOME SEROTONIN RECEPTORS | Genes involved in Serotonin receptors |
| 0.0 | 0.8 | REACTOME GAP JUNCTION TRAFFICKING | Genes involved in Gap junction trafficking |
| 0.0 | 0.2 | REACTOME G ALPHA Z SIGNALLING EVENTS | Genes involved in G alpha (z) signalling events |
| 0.0 | 0.7 | REACTOME SIGNALING BY HIPPO | Genes involved in Signaling by Hippo |
| 0.0 | 1.2 | REACTOME SHC1 EVENTS IN ERBB4 SIGNALING | Genes involved in SHC1 events in ERBB4 signaling |
| 0.0 | 1.2 | REACTOME FORMATION OF INCISION COMPLEX IN GG NER | Genes involved in Formation of incision complex in GG-NER |
| 0.0 | 2.5 | REACTOME RESPIRATORY ELECTRON TRANSPORT | Genes involved in Respiratory electron transport |
| 0.0 | 0.6 | REACTOME PRESYNAPTIC NICOTINIC ACETYLCHOLINE RECEPTORS | Genes involved in Presynaptic nicotinic acetylcholine receptors |
| 0.0 | 1.1 | REACTOME AMYLOIDS | Genes involved in Amyloids |
| 0.0 | 1.0 | REACTOME AMINE LIGAND BINDING RECEPTORS | Genes involved in Amine ligand-binding receptors |
| 0.0 | 0.8 | REACTOME TRANSPORT OF VITAMINS NUCLEOSIDES AND RELATED MOLECULES | Genes involved in Transport of vitamins, nucleosides, and related molecules |
| 0.0 | 1.2 | REACTOME NCAM1 INTERACTIONS | Genes involved in NCAM1 interactions |
| 0.0 | 0.3 | REACTOME RNA POL III TRANSCRIPTION TERMINATION | Genes involved in RNA Polymerase III Transcription Termination |
| 0.0 | 0.1 | REACTOME REGULATION OF KIT SIGNALING | Genes involved in Regulation of KIT signaling |
| 0.0 | 0.8 | REACTOME SIGNALING BY NODAL | Genes involved in Signaling by NODAL |
| 0.0 | 0.8 | REACTOME ACTIVATED AMPK STIMULATES FATTY ACID OXIDATION IN MUSCLE | Genes involved in Activated AMPK stimulates fatty-acid oxidation in muscle |
| 0.0 | 0.6 | REACTOME HORMONE SENSITIVE LIPASE HSL MEDIATED TRIACYLGLYCEROL HYDROLYSIS | Genes involved in Hormone-sensitive lipase (HSL)-mediated triacylglycerol hydrolysis |
| 0.0 | 0.2 | REACTOME STEROID HORMONES | Genes involved in Steroid hormones |
| 0.0 | 2.3 | REACTOME COLLAGEN FORMATION | Genes involved in Collagen formation |
| 0.0 | 0.5 | REACTOME INHIBITION OF INSULIN SECRETION BY ADRENALINE NORADRENALINE | Genes involved in Inhibition of Insulin Secretion by Adrenaline/Noradrenaline |
| 0.0 | 0.4 | REACTOME PROSTACYCLIN SIGNALLING THROUGH PROSTACYCLIN RECEPTOR | Genes involved in Prostacyclin signalling through prostacyclin receptor |
| 0.0 | 1.0 | REACTOME CGMP EFFECTS | Genes involved in cGMP effects |
| 0.0 | 0.9 | REACTOME INCRETIN SYNTHESIS SECRETION AND INACTIVATION | Genes involved in Incretin Synthesis, Secretion, and Inactivation |
| 0.0 | 1.9 | REACTOME CLASS B 2 SECRETIN FAMILY RECEPTORS | Genes involved in Class B/2 (Secretin family receptors) |
| 0.0 | 0.9 | REACTOME NUCLEAR SIGNALING BY ERBB4 | Genes involved in Nuclear signaling by ERBB4 |
| 0.0 | 0.4 | REACTOME MTORC1 MEDIATED SIGNALLING | Genes involved in mTORC1-mediated signalling |
| 0.0 | 0.2 | REACTOME HORMONE LIGAND BINDING RECEPTORS | Genes involved in Hormone ligand-binding receptors |
| 0.0 | 0.4 | REACTOME INTRINSIC PATHWAY | Genes involved in Intrinsic Pathway |
| 0.0 | 0.3 | REACTOME THE ACTIVATION OF ARYLSULFATASES | Genes involved in The activation of arylsulfatases |
| 0.0 | 0.2 | REACTOME SYNTHESIS OF BILE ACIDS AND BILE SALTS VIA 7ALPHA HYDROXYCHOLESTEROL | Genes involved in Synthesis of bile acids and bile salts via 7alpha-hydroxycholesterol |
| 0.0 | 3.8 | REACTOME PEPTIDE LIGAND BINDING RECEPTORS | Genes involved in Peptide ligand-binding receptors |
| 0.0 | 0.6 | REACTOME KERATAN SULFATE BIOSYNTHESIS | Genes involved in Keratan sulfate biosynthesis |
| 0.0 | 1.2 | REACTOME L1CAM INTERACTIONS | Genes involved in L1CAM interactions |
| 0.0 | 0.1 | REACTOME FGFR2C LIGAND BINDING AND ACTIVATION | Genes involved in FGFR2c ligand binding and activation |
| 0.0 | 0.5 | REACTOME BETA DEFENSINS | Genes involved in Beta defensins |
| 0.0 | 0.4 | REACTOME TIE2 SIGNALING | Genes involved in Tie2 Signaling |
| 0.0 | 1.0 | REACTOME O LINKED GLYCOSYLATION OF MUCINS | Genes involved in O-linked glycosylation of mucins |
| 0.0 | 0.6 | REACTOME REGULATION OF GLUCOKINASE BY GLUCOKINASE REGULATORY PROTEIN | Genes involved in Regulation of Glucokinase by Glucokinase Regulatory Protein |
| 0.0 | 0.1 | REACTOME THE ROLE OF NEF IN HIV1 REPLICATION AND DISEASE PATHOGENESIS | Genes involved in The role of Nef in HIV-1 replication and disease pathogenesis |
| 0.0 | 0.3 | REACTOME PTM GAMMA CARBOXYLATION HYPUSINE FORMATION AND ARYLSULFATASE ACTIVATION | Genes involved in PTM: gamma carboxylation, hypusine formation and arylsulfatase activation |
| 0.0 | 0.4 | REACTOME POTASSIUM CHANNELS | Genes involved in Potassium Channels |
| 0.0 | 0.2 | REACTOME SYNTHESIS OF PIPS AT THE LATE ENDOSOME MEMBRANE | Genes involved in Synthesis of PIPs at the late endosome membrane |
| 0.0 | 2.9 | REACTOME OLFACTORY SIGNALING PATHWAY | Genes involved in Olfactory Signaling Pathway |