Project
Illumina Body Map 2 (GSE30611)
Navigation
Downloads
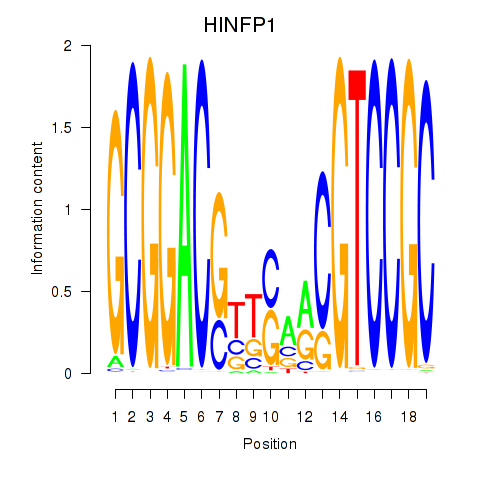
Results for HINFP1
Z-value: 0.45
Motif logo
Transcription factors associated with HINFP1
| Gene Symbol | Gene ID | Gene Info |
|---|
Activity profile of HINFP1 motif
Sorted Z-values of HINFP1 motif
| Promoter | Log-likelihood | Transcript | Gene | Gene Info |
|---|---|---|---|---|
| chr6_-_56843638 | 1.27 |
ENST00000421834.6
ENST00000370788.6 |
DST
|
dystonin |
| chr15_-_58065734 | 1.21 |
ENST00000347587.7
|
ALDH1A2
|
aldehyde dehydrogenase 1 family member A2 |
| chr1_-_42456006 | 1.18 |
ENST00000372565.8
|
ZMYND12
|
zinc finger MYND-type containing 12 |
| chr15_-_58065703 | 1.13 |
ENST00000249750.9
|
ALDH1A2
|
aldehyde dehydrogenase 1 family member A2 |
| chr15_-_58065870 | 1.08 |
ENST00000537372.5
|
ALDH1A2
|
aldehyde dehydrogenase 1 family member A2 |
| chr22_-_24593038 | 1.05 |
ENST00000318753.13
|
LRRC75B
|
leucine rich repeat containing 75B |
| chr9_-_109498251 | 1.04 |
ENST00000374541.4
ENST00000262539.7 |
PTPN3
|
protein tyrosine phosphatase non-receptor type 3 |
| chrX_-_126552801 | 0.86 |
ENST00000371126.3
|
DCAF12L1
|
DDB1 and CUL4 associated factor 12 like 1 |
| chr6_-_56843153 | 0.84 |
ENST00000361203.7
ENST00000523817.1 |
DST
|
dystonin |
| chr10_+_110644306 | 0.84 |
ENST00000369519.4
|
RBM20
|
RNA binding motif protein 20 |
| chr16_+_560388 | 0.75 |
ENST00000409413.4
|
PRR35
|
proline rich 35 |
| chr1_+_209938169 | 0.73 |
ENST00000367019.5
ENST00000537238.5 ENST00000637265.1 |
SYT14
|
synaptotagmin 14 |
| chr1_-_62319425 | 0.64 |
ENST00000371153.9
|
KANK4
|
KN motif and ankyrin repeat domains 4 |
| chr12_+_19129689 | 0.59 |
ENST00000429027.7
ENST00000540972.5 |
PLEKHA5
|
pleckstrin homology domain containing A5 |
| chr1_-_62319264 | 0.53 |
ENST00000354381.3
|
KANK4
|
KN motif and ankyrin repeat domains 4 |
| chr12_+_19129779 | 0.52 |
ENST00000539256.5
ENST00000299275.10 ENST00000538714.5 |
PLEKHA5
|
pleckstrin homology domain containing A5 |
| chr1_+_222713310 | 0.46 |
ENST00000537020.5
ENST00000539697.5 |
BROX
|
BRO1 domain and CAAX motif containing |
| chr5_+_155013755 | 0.43 |
ENST00000435029.6
|
KIF4B
|
kinesin family member 4B |
| chr1_+_209938207 | 0.40 |
ENST00000472886.5
|
SYT14
|
synaptotagmin 14 |
| chr1_+_222713352 | 0.39 |
ENST00000426638.1
|
BROX
|
BRO1 domain and CAAX motif containing |
| chr5_+_77086682 | 0.38 |
ENST00000643365.1
ENST00000645183.1 ENST00000645374.1 ENST00000647364.1 ENST00000643848.1 ENST00000643603.1 ENST00000645459.1 ENST00000643269.1 ENST00000503969.6 ENST00000646262.1 |
ZBED3-AS1
ENSG00000284762.1
|
ZBED3 antisense RNA 1 phosphodiesterase 8B |
| chr7_+_100483919 | 0.35 |
ENST00000300179.7
|
NYAP1
|
neuronal tyrosine phosphorylated phosphoinositide-3-kinase adaptor 1 |
| chr4_-_121072519 | 0.34 |
ENST00000379692.9
|
NDNF
|
neuron derived neurotrophic factor |
| chr6_-_168319762 | 0.32 |
ENST00000366795.4
|
DACT2
|
dishevelled binding antagonist of beta catenin 2 |
| chr15_+_84981981 | 0.31 |
ENST00000339708.9
|
PDE8A
|
phosphodiesterase 8A |
| chr6_-_168319691 | 0.31 |
ENST00000610183.1
ENST00000607983.1 |
DACT2
|
dishevelled binding antagonist of beta catenin 2 |
| chr16_+_2475051 | 0.30 |
ENST00000567020.6
ENST00000646147.1 |
TBC1D24
|
TBC1 domain family member 24 |
| chr1_+_147928420 | 0.29 |
ENST00000314163.12
ENST00000468618.6 |
GPR89B
|
G protein-coupled receptor 89B |
| chr9_-_98796494 | 0.27 |
ENST00000353234.5
|
ANKS6
|
ankyrin repeat and sterile alpha motif domain containing 6 |
| chr18_+_11981488 | 0.25 |
ENST00000269159.8
|
IMPA2
|
inositol monophosphatase 2 |
| chr2_-_70995336 | 0.25 |
ENST00000606025.5
|
ENSG00000258881.6
|
novel protein |
| chr19_-_5680488 | 0.23 |
ENST00000587589.1
ENST00000309324.9 |
MICOS13
|
mitochondrial contact site and cristae organizing system subunit 13 |
| chr2_-_233854566 | 0.23 |
ENST00000432087.5
ENST00000441687.5 ENST00000414924.5 |
HJURP
|
Holliday junction recognition protein |
| chr1_+_42767241 | 0.22 |
ENST00000372525.7
|
C1orf50
|
chromosome 1 open reading frame 50 |
| chr10_+_119818699 | 0.21 |
ENST00000650409.1
|
INPP5F
|
inositol polyphosphate-5-phosphatase F |
| chr3_+_138608700 | 0.19 |
ENST00000360570.7
|
FAIM
|
Fas apoptotic inhibitory molecule |
| chr2_-_233854506 | 0.18 |
ENST00000411486.7
|
HJURP
|
Holliday junction recognition protein |
| chr15_+_84981834 | 0.18 |
ENST00000394553.6
|
PDE8A
|
phosphodiesterase 8A |
| chr19_+_1524068 | 0.16 |
ENST00000642079.2
ENST00000454744.7 ENST00000588430.3 |
PLK5
|
polo like kinase 5 (inactive) |
| chr18_+_12308232 | 0.12 |
ENST00000590103.5
ENST00000591909.5 ENST00000586653.5 ENST00000317702.10 ENST00000592683.5 ENST00000590967.5 ENST00000591208.1 ENST00000591463.1 |
TUBB6
|
tubulin beta 6 class V |
| chr18_+_11981548 | 0.11 |
ENST00000588927.5
|
IMPA2
|
inositol monophosphatase 2 |
| chr10_+_119818680 | 0.09 |
ENST00000631485.1
|
INPP5F
|
inositol polyphosphate-5-phosphatase F |
| chr10_+_48306698 | 0.07 |
ENST00000374179.8
|
MAPK8
|
mitogen-activated protein kinase 8 |
| chr17_+_4498866 | 0.06 |
ENST00000329078.8
|
SPNS2
|
sphingolipid transporter 2 |
| chr14_+_44897268 | 0.06 |
ENST00000325192.8
ENST00000557112.1 |
C14orf28
|
chromosome 14 open reading frame 28 |
| chr10_-_931624 | 0.05 |
ENST00000406525.6
|
LARP4B
|
La ribonucleoprotein 4B |
| chr14_+_73237493 | 0.04 |
ENST00000340738.9
ENST00000644200.2 |
PAPLN
|
papilin, proteoglycan like sulfated glycoprotein |
| chr4_-_2041903 | 0.02 |
ENST00000455762.5
|
NELFA
|
negative elongation factor complex member A |
| chr7_-_32495238 | 0.02 |
ENST00000409952.3
ENST00000409909.7 |
LSM5
|
LSM5 homolog, U6 small nuclear RNA and mRNA degradation associated |
| chr10_+_48306639 | 0.01 |
ENST00000395611.7
ENST00000432379.5 ENST00000374189.5 |
MAPK8
|
mitogen-activated protein kinase 8 |
| chr5_-_176630364 | 0.00 |
ENST00000310112.7
|
SNCB
|
synuclein beta |
Network of associatons between targets according to the STRING database.

Gene Ontology Analysis
Gene overrepresentation in biological process category:
| Log-likelihood per target | Total log-likelihood | Term | Description |
|---|---|---|---|
| 0.4 | 3.4 | GO:0042904 | 9-cis-retinoic acid biosynthetic process(GO:0042904) 9-cis-retinoic acid metabolic process(GO:0042905) |
| 0.1 | 0.5 | GO:0072061 | inner medullary collecting duct development(GO:0072061) negative regulation of nodal signaling pathway(GO:1900108) |
| 0.1 | 1.0 | GO:0051045 | negative regulation of membrane protein ectodomain proteolysis(GO:0051045) |
| 0.1 | 2.1 | GO:0008090 | retrograde axonal transport(GO:0008090) |
| 0.0 | 0.4 | GO:0006021 | inositol biosynthetic process(GO:0006021) |
| 0.0 | 0.2 | GO:0002357 | defense response to tumor cell(GO:0002357) |
| 0.0 | 0.2 | GO:0031161 | phosphatidylinositol catabolic process(GO:0031161) |
| 0.0 | 0.1 | GO:1902595 | regulation of DNA replication origin binding(GO:1902595) |
| 0.0 | 0.4 | GO:0051256 | mitotic spindle midzone assembly(GO:0051256) |
| 0.0 | 0.3 | GO:0061042 | vascular wound healing(GO:0061042) |
| 0.0 | 0.1 | GO:0048073 | regulation of eye pigmentation(GO:0048073) |
| 0.0 | 1.1 | GO:0048791 | calcium ion-regulated exocytosis of neurotransmitter(GO:0048791) |
| 0.0 | 0.8 | GO:0033120 | positive regulation of RNA splicing(GO:0033120) |
Gene overrepresentation in cellular component category:
| Log-likelihood per target | Total log-likelihood | Term | Description |
|---|---|---|---|
| 0.2 | 2.1 | GO:0031673 | H zone(GO:0031673) |
Gene overrepresentation in molecular function category:
| Log-likelihood per target | Total log-likelihood | Term | Description |
|---|---|---|---|
| 0.2 | 3.4 | GO:0001758 | retinal dehydrogenase activity(GO:0001758) |
| 0.1 | 1.1 | GO:0010314 | phosphatidylinositol-5-phosphate binding(GO:0010314) |
| 0.0 | 2.1 | GO:0051010 | microtubule plus-end binding(GO:0051010) |
| 0.0 | 0.5 | GO:0052833 | inositol monophosphate 1-phosphatase activity(GO:0008934) inositol monophosphate 3-phosphatase activity(GO:0052832) inositol monophosphate 4-phosphatase activity(GO:0052833) inositol monophosphate phosphatase activity(GO:0052834) |
| 0.0 | 0.5 | GO:0070097 | delta-catenin binding(GO:0070097) |
| 0.0 | 0.1 | GO:0035033 | histone deacetylase regulator activity(GO:0035033) |
| 0.0 | 1.0 | GO:0001784 | phosphotyrosine binding(GO:0001784) |
| 0.0 | 0.4 | GO:0008574 | ATP-dependent microtubule motor activity, plus-end-directed(GO:0008574) |
Gene overrepresentation in curated gene sets: canonical pathways category:
| Log-likelihood per target | Total log-likelihood | Term | Description |
|---|---|---|---|
| 0.0 | 2.1 | PID TAP63 PATHWAY | Validated transcriptional targets of TAp63 isoforms |
Gene overrepresentation in curated gene sets: REACTOME pathways category:
| Log-likelihood per target | Total log-likelihood | Term | Description |
|---|---|---|---|
| 0.0 | 0.4 | REACTOME DEPOSITION OF NEW CENPA CONTAINING NUCLEOSOMES AT THE CENTROMERE | Genes involved in Deposition of New CENPA-containing Nucleosomes at the Centromere |