Project
Illumina Body Map 2 (GSE30611)
Navigation
Downloads
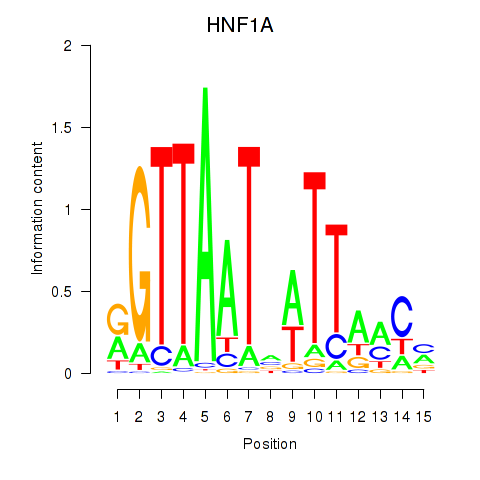
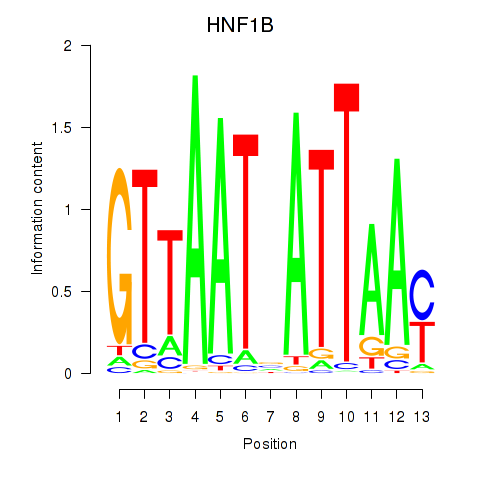
Results for HNF1A_HNF1B
Z-value: 8.65
Motif logo
Transcription factors associated with HNF1A_HNF1B
| Gene Symbol | Gene ID | Gene Info |
|---|---|---|
|
HNF1A
|
ENSG00000135100.19 | HNF1 homeobox A |
|
HNF1B
|
ENSG00000275410.6 | HNF1 homeobox B |
Activity-expression correlation:
| Gene | Promoter | Pearson corr. coef. | P-value | Plot |
|---|---|---|---|---|
| HNF1A | hg38_v1_chr12_+_120978686_120978749 | 0.94 | 1.3e-15 | Click! |
| HNF1B | hg38_v1_chr17_-_37745018_37745069 | 0.65 | 5.4e-05 | Click! |
Activity profile of HNF1A_HNF1B motif
Sorted Z-values of HNF1A_HNF1B motif
| Promoter | Log-likelihood | Transcript | Gene | Gene Info |
|---|---|---|---|---|
| chr4_-_71784046 | 136.59 |
ENST00000513476.5
ENST00000273951.13 |
GC
|
GC vitamin D binding protein |
| chr4_+_154563003 | 112.31 |
ENST00000302068.9
ENST00000509493.1 |
FGB
|
fibrinogen beta chain |
| chr17_-_66229380 | 110.67 |
ENST00000205948.11
|
APOH
|
apolipoprotein H |
| chr4_-_154590735 | 107.00 |
ENST00000403106.8
ENST00000622532.1 ENST00000651975.1 |
FGA
|
fibrinogen alpha chain |
| chr4_+_73481737 | 101.92 |
ENST00000226355.5
|
AFM
|
afamin |
| chr1_-_159714581 | 94.78 |
ENST00000255030.9
ENST00000437342.1 ENST00000368112.5 ENST00000368111.5 ENST00000368110.1 |
CRP
|
C-reactive protein |
| chr16_-_20576277 | 81.81 |
ENST00000566384.5
ENST00000565232.5 ENST00000567001.5 ENST00000565322.5 ENST00000569344.5 ENST00000329697.10 ENST00000568882.1 |
ACSM2B
|
acyl-CoA synthetase medium chain family member 2B |
| chr6_+_160702238 | 79.77 |
ENST00000366924.6
ENST00000308192.14 ENST00000418964.1 |
PLG
|
plasminogen |
| chr19_-_35812838 | 79.19 |
ENST00000653904.2
|
PRODH2
|
proline dehydrogenase 2 |
| chr2_+_233760265 | 72.42 |
ENST00000305208.10
ENST00000360418.4 |
UGT1A1
|
UDP glucuronosyltransferase family 1 member A1 |
| chr14_-_57493827 | 70.72 |
ENST00000526336.1
ENST00000216445.8 |
CCDC198
|
coiled-coil domain containing 198 |
| chr2_+_233692881 | 68.57 |
ENST00000305139.11
|
UGT1A6
|
UDP glucuronosyltransferase family 1 member A6 |
| chr16_+_20451461 | 68.16 |
ENST00000574251.5
ENST00000573854.6 |
ACSM2A
|
acyl-CoA synthetase medium chain family member 2A |
| chr16_+_20451563 | 62.10 |
ENST00000417235.6
ENST00000219054.10 |
ACSM2A
|
acyl-CoA synthetase medium chain family member 2A |
| chr1_+_207104226 | 60.33 |
ENST00000367070.8
|
C4BPA
|
complement component 4 binding protein alpha |
| chr14_-_57493742 | 60.16 |
ENST00000534126.5
ENST00000422976.6 |
CCDC198
|
coiled-coil domain containing 198 |
| chr2_+_233617626 | 59.97 |
ENST00000373450.5
|
UGT1A8
|
UDP glucuronosyltransferase family 1 member A8 |
| chr4_+_73404255 | 59.48 |
ENST00000621628.4
ENST00000621085.4 ENST00000415165.6 ENST00000295897.9 ENST00000503124.5 ENST00000509063.5 ENST00000401494.7 |
ALB
|
albumin |
| chr20_+_44401222 | 57.78 |
ENST00000316099.9
|
HNF4A
|
hepatocyte nuclear factor 4 alpha |
| chr4_+_186266183 | 57.63 |
ENST00000403665.7
ENST00000492972.6 ENST00000264692.8 |
F11
|
coagulation factor XI |
| chr2_+_233729042 | 54.49 |
ENST00000482026.6
|
UGT1A3
|
UDP glucuronosyltransferase family 1 member A3 |
| chr16_+_20451596 | 53.35 |
ENST00000575690.5
ENST00000571894.1 |
ACSM2A
|
acyl-CoA synthetase medium chain family member 2A |
| chr1_-_204213943 | 51.86 |
ENST00000308302.4
|
GOLT1A
|
golgi transport 1A |
| chr14_-_94388589 | 51.18 |
ENST00000402629.1
ENST00000556091.1 ENST00000393087.9 ENST00000554720.1 |
SERPINA1
|
serpin family A member 1 |
| chrX_-_106038721 | 50.73 |
ENST00000372563.2
|
SERPINA7
|
serpin family A member 7 |
| chr1_+_207104287 | 50.72 |
ENST00000421786.5
|
C4BPA
|
complement component 4 binding protein alpha |
| chr20_-_7940444 | 47.69 |
ENST00000378789.4
|
HAO1
|
hydroxyacid oxidase 1 |
| chr14_-_94293071 | 47.04 |
ENST00000554723.5
|
SERPINA10
|
serpin family A member 10 |
| chr14_-_94293024 | 46.79 |
ENST00000393096.5
|
SERPINA10
|
serpin family A member 10 |
| chr20_+_43558968 | 46.33 |
ENST00000647834.1
ENST00000373100.7 ENST00000648083.1 ENST00000648530.1 |
SGK2
|
serum/glucocorticoid regulated kinase 2 |
| chr9_-_121050264 | 45.97 |
ENST00000223642.3
|
C5
|
complement C5 |
| chr10_+_99782628 | 45.93 |
ENST00000648689.1
ENST00000647814.1 |
ABCC2
|
ATP binding cassette subfamily C member 2 |
| chr20_+_44401269 | 45.86 |
ENST00000443598.6
ENST00000415691.2 |
HNF4A
|
hepatocyte nuclear factor 4 alpha |
| chr2_-_88128049 | 44.33 |
ENST00000393750.3
ENST00000295834.8 |
FABP1
|
fatty acid binding protein 1 |
| chr10_+_113553039 | 43.31 |
ENST00000351270.4
|
HABP2
|
hyaluronan binding protein 2 |
| chr5_+_177086867 | 42.85 |
ENST00000503708.5
ENST00000393648.6 ENST00000514472.1 ENST00000502906.5 ENST00000292408.9 ENST00000510911.5 |
FGFR4
|
fibroblast growth factor receptor 4 |
| chr8_-_17895487 | 42.67 |
ENST00000427924.5
ENST00000381841.4 |
FGL1
|
fibrinogen like 1 |
| chr14_-_94293260 | 41.37 |
ENST00000261994.9
|
SERPINA10
|
serpin family A member 10 |
| chrX_-_15664798 | 40.98 |
ENST00000380342.4
|
CLTRN
|
collectrin, amino acid transport regulator |
| chr2_+_87748087 | 40.51 |
ENST00000359481.9
|
PLGLB2
|
plasminogen like B2 |
| chr4_-_109801978 | 40.41 |
ENST00000510800.1
ENST00000512148.5 ENST00000394634.7 ENST00000394635.8 ENST00000645635.1 |
CFI
ENSG00000285330.1
|
complement factor I novel protein |
| chr20_+_44355692 | 39.60 |
ENST00000316673.8
ENST00000609795.5 ENST00000457232.5 ENST00000609262.5 |
HNF4A
|
hepatocyte nuclear factor 4 alpha |
| chr3_+_186666003 | 39.39 |
ENST00000232003.5
|
HRG
|
histidine rich glycoprotein |
| chr15_+_58431985 | 39.10 |
ENST00000433326.2
ENST00000299022.10 |
LIPC
|
lipase C, hepatic type |
| chr17_+_4788926 | 37.76 |
ENST00000331264.8
|
GLTPD2
|
glycolipid transfer protein domain containing 2 |
| chr10_+_133527355 | 37.66 |
ENST00000252945.8
ENST00000421586.5 ENST00000418356.1 |
CYP2E1
|
cytochrome P450 family 2 subfamily E member 1 |
| chr17_+_42900791 | 36.93 |
ENST00000592383.5
ENST00000253801.7 ENST00000585489.1 |
G6PC1
|
glucose-6-phosphatase catalytic subunit 1 |
| chr5_+_176549323 | 36.16 |
ENST00000261944.9
|
CDHR2
|
cadherin related family member 2 |
| chr16_+_20451532 | 34.32 |
ENST00000576361.5
|
ACSM2A
|
acyl-CoA synthetase medium chain family member 2A |
| chr2_-_87021844 | 33.88 |
ENST00000355705.4
ENST00000409310.6 |
PLGLB1
|
plasminogen like B1 |
| chr16_+_20764036 | 32.91 |
ENST00000440284.6
|
ACSM3
|
acyl-CoA synthetase medium chain family member 3 |
| chr2_+_27496830 | 31.62 |
ENST00000264717.7
|
GCKR
|
glucokinase regulator |
| chr1_-_197067234 | 31.40 |
ENST00000367412.2
|
F13B
|
coagulation factor XIII B chain |
| chr1_+_62597510 | 30.35 |
ENST00000371129.4
|
ANGPTL3
|
angiopoietin like 3 |
| chr16_+_20763990 | 30.32 |
ENST00000289416.10
|
ACSM3
|
acyl-CoA synthetase medium chain family member 3 |
| chr7_-_50565381 | 30.01 |
ENST00000444124.7
|
DDC
|
dopa decarboxylase |
| chr4_-_68951763 | 29.95 |
ENST00000251566.9
|
UGT2A3
|
UDP glucuronosyltransferase family 2 member A3 |
| chr10_+_97584314 | 29.26 |
ENST00000370647.8
|
HOGA1
|
4-hydroxy-2-oxoglutarate aldolase 1 |
| chr2_+_233718734 | 29.25 |
ENST00000373409.8
|
UGT1A4
|
UDP glucuronosyltransferase family 1 member A4 |
| chr19_+_11239602 | 29.25 |
ENST00000252453.12
|
ANGPTL8
|
angiopoietin like 8 |
| chr11_-_117824734 | 27.84 |
ENST00000292079.7
|
FXYD2
|
FXYD domain containing ion transport regulator 2 |
| chr12_+_100473708 | 27.37 |
ENST00000548884.5
ENST00000392986.8 |
NR1H4
|
nuclear receptor subfamily 1 group H member 4 |
| chr2_+_233712905 | 27.09 |
ENST00000373414.4
|
UGT1A5
|
UDP glucuronosyltransferase family 1 member A5 |
| chr20_+_44401397 | 26.90 |
ENST00000682427.1
ENST00000681977.1 ENST00000684136.1 ENST00000684046.1 ENST00000684476.1 ENST00000619550.5 ENST00000682169.1 |
HNF4A
|
hepatocyte nuclear factor 4 alpha |
| chr17_+_1742836 | 26.69 |
ENST00000324015.7
ENST00000450523.6 ENST00000453723.5 ENST00000453066.6 ENST00000382061.5 |
SERPINF2
|
serpin family F member 2 |
| chr4_+_3441960 | 25.91 |
ENST00000382774.8
ENST00000511533.1 |
HGFAC
|
HGF activator |
| chr7_+_45888479 | 25.74 |
ENST00000275525.8
ENST00000468955.1 |
IGFBP1
|
insulin like growth factor binding protein 1 |
| chr6_-_160664270 | 25.40 |
ENST00000316300.10
|
LPA
|
lipoprotein(a) |
| chr4_+_99574812 | 25.27 |
ENST00000422897.6
ENST00000265517.10 |
MTTP
|
microsomal triglyceride transfer protein |
| chr6_-_25874212 | 25.05 |
ENST00000361703.10
ENST00000397060.8 |
SLC17A3
|
solute carrier family 17 member 3 |
| chr16_-_69351778 | 24.91 |
ENST00000288025.4
|
TMED6
|
transmembrane p24 trafficking protein 6 |
| chr6_+_31655888 | 24.66 |
ENST00000375916.4
|
APOM
|
apolipoprotein M |
| chr6_-_25930611 | 24.64 |
ENST00000360488.7
|
SLC17A2
|
solute carrier family 17 member 2 |
| chr6_-_25930678 | 24.61 |
ENST00000377850.8
|
SLC17A2
|
solute carrier family 17 member 2 |
| chr14_+_94561435 | 23.70 |
ENST00000557004.6
ENST00000555095.5 ENST00000298841.5 ENST00000554220.5 ENST00000553780.5 |
SERPINA4
SERPINA5
|
serpin family A member 4 serpin family A member 5 |
| chr1_-_19815270 | 23.51 |
ENST00000375121.4
|
RNF186
|
ring finger protein 186 |
| chr12_+_100473951 | 23.46 |
ENST00000648861.1
ENST00000546380.1 |
NR1H4
|
nuclear receptor subfamily 1 group H member 4 |
| chr1_+_56854764 | 22.17 |
ENST00000361249.4
|
C8A
|
complement C8 alpha chain |
| chr14_-_64942720 | 21.97 |
ENST00000557049.1
ENST00000389614.6 |
GPX2
|
glutathione peroxidase 2 |
| chr14_+_20688756 | 21.96 |
ENST00000397990.5
ENST00000555597.1 |
ANG
RNASE4
|
angiogenin ribonuclease A family member 4 |
| chr21_-_46155567 | 21.77 |
ENST00000291670.9
ENST00000397748.5 ENST00000397743.1 ENST00000397746.8 |
FTCD
|
formimidoyltransferase cyclodeaminase |
| chr16_+_21233672 | 21.19 |
ENST00000311620.7
|
ANKS4B
|
ankyrin repeat and sterile alpha motif domain containing 4B |
| chr6_+_25754699 | 21.13 |
ENST00000439485.6
ENST00000377905.9 |
SLC17A4
|
solute carrier family 17 member 4 |
| chr11_+_46719193 | 20.98 |
ENST00000311907.10
ENST00000530231.5 ENST00000442468.1 |
F2
|
coagulation factor II, thrombin |
| chr1_+_55039511 | 20.93 |
ENST00000302118.5
|
PCSK9
|
proprotein convertase subtilisin/kexin type 9 |
| chr14_-_64942783 | 20.28 |
ENST00000612794.1
|
GPX2
|
glutathione peroxidase 2 |
| chr7_-_44541262 | 20.20 |
ENST00000289547.8
ENST00000546276.5 ENST00000423141.1 |
NPC1L1
|
NPC1 like intracellular cholesterol transporter 1 |
| chr7_+_45888360 | 20.10 |
ENST00000457280.5
|
IGFBP1
|
insulin like growth factor binding protein 1 |
| chr15_+_48206286 | 19.86 |
ENST00000396577.7
ENST00000380993.8 |
SLC12A1
|
solute carrier family 12 member 1 |
| chr1_+_207088825 | 19.83 |
ENST00000367078.8
|
C4BPB
|
complement component 4 binding protein beta |
| chr1_+_119368773 | 19.33 |
ENST00000457318.5
ENST00000622548.4 ENST00000325945.4 |
HAO2
|
hydroxyacid oxidase 2 |
| chr12_+_100473916 | 18.70 |
ENST00000549996.5
|
NR1H4
|
nuclear receptor subfamily 1 group H member 4 |
| chr6_-_116060859 | 18.60 |
ENST00000606080.2
|
FRK
|
fyn related Src family tyrosine kinase |
| chr14_+_39233908 | 18.18 |
ENST00000280082.4
|
MIA2
|
MIA SH3 domain ER export factor 2 |
| chr20_+_43559060 | 17.67 |
ENST00000485914.2
|
SGK2
|
serum/glucocorticoid regulated kinase 2 |
| chr4_-_68670648 | 17.54 |
ENST00000338206.6
|
UGT2B15
|
UDP glucuronosyltransferase family 2 member B15 |
| chr12_+_100503352 | 17.44 |
ENST00000551379.5
ENST00000188403.7 |
NR1H4
|
nuclear receptor subfamily 1 group H member 4 |
| chr1_+_207089233 | 17.08 |
ENST00000243611.9
ENST00000367076.7 |
C4BPB
|
complement component 4 binding protein beta |
| chr1_+_18480930 | 16.86 |
ENST00000400664.3
|
KLHDC7A
|
kelch domain containing 7A |
| chr6_-_52087569 | 16.82 |
ENST00000340994.4
ENST00000371117.8 |
PKHD1
|
PKHD1 ciliary IPT domain containing fibrocystin/polyductin |
| chr9_-_114099275 | 16.65 |
ENST00000468460.2
ENST00000640217.2 |
KIF12
|
kinesin family member 12 |
| chr12_+_21131187 | 16.58 |
ENST00000256958.3
|
SLCO1B1
|
solute carrier organic anion transporter family member 1B1 |
| chr6_+_54308429 | 16.53 |
ENST00000259782.9
ENST00000370864.3 |
TINAG
|
tubulointerstitial nephritis antigen |
| chr7_-_44541318 | 16.09 |
ENST00000381160.8
|
NPC1L1
|
NPC1 like intracellular cholesterol transporter 1 |
| chr6_-_52763473 | 16.01 |
ENST00000493422.3
|
GSTA2
|
glutathione S-transferase alpha 2 |
| chr11_+_114296347 | 15.86 |
ENST00000299964.4
|
NNMT
|
nicotinamide N-methyltransferase |
| chr10_-_50885656 | 15.25 |
ENST00000374001.6
ENST00000395489.6 ENST00000282641.6 ENST00000395495.5 ENST00000373995.7 ENST00000414883.1 |
A1CF
|
APOBEC1 complementation factor |
| chr1_+_207089283 | 15.16 |
ENST00000391923.1
|
C4BPB
|
complement component 4 binding protein beta |
| chr16_-_66918876 | 14.80 |
ENST00000570262.5
ENST00000299752.9 ENST00000394055.7 |
CDH16
|
cadherin 16 |
| chr4_+_168092530 | 14.62 |
ENST00000359299.8
|
ANXA10
|
annexin A10 |
| chr16_-_66918839 | 14.61 |
ENST00000565235.2
ENST00000568632.5 ENST00000565796.5 |
CDH16
|
cadherin 16 |
| chr5_-_139383284 | 14.25 |
ENST00000353963.7
ENST00000348729.8 |
SLC23A1
|
solute carrier family 23 member 1 |
| chr11_+_64555684 | 14.23 |
ENST00000377585.7
|
SLC22A11
|
solute carrier family 22 member 11 |
| chr12_+_20810698 | 13.48 |
ENST00000540853.5
ENST00000381545.8 |
SLCO1B3
|
solute carrier organic anion transporter family member 1B3 |
| chr17_+_75646235 | 13.43 |
ENST00000556126.2
ENST00000579469.2 |
SMIM6
|
small integral membrane protein 6 |
| chr9_-_114099057 | 13.41 |
ENST00000374118.8
|
KIF12
|
kinesin family member 12 |
| chr15_+_58138368 | 12.98 |
ENST00000219919.9
ENST00000536493.1 |
AQP9
|
aquaporin 9 |
| chr17_-_352784 | 12.94 |
ENST00000577079.5
ENST00000331302.12 ENST00000618002.4 ENST00000536489.6 |
RPH3AL
|
rabphilin 3A like (without C2 domains) |
| chr4_+_39406917 | 12.70 |
ENST00000257408.5
|
KLB
|
klotho beta |
| chr10_+_97584347 | 11.56 |
ENST00000370649.3
ENST00000370646.9 |
ENSG00000249967.1
HOGA1
|
novel protein 4-hydroxy-2-oxoglutarate aldolase 1 |
| chr7_-_27180013 | 11.28 |
ENST00000470747.4
|
ENSG00000257184.3
|
HOXA10-HOXA9 readthrough |
| chr4_-_99352730 | 11.22 |
ENST00000510055.5
ENST00000515683.6 ENST00000511397.3 |
ADH1C
|
alcohol dehydrogenase 1C (class I), gamma polypeptide |
| chr11_+_64555924 | 11.08 |
ENST00000301891.9
|
SLC22A11
|
solute carrier family 22 member 11 |
| chr11_-_26722051 | 10.93 |
ENST00000396005.8
|
SLC5A12
|
solute carrier family 5 member 12 |
| chr12_+_100503416 | 10.86 |
ENST00000551184.1
|
NR1H4
|
nuclear receptor subfamily 1 group H member 4 |
| chr12_+_100473875 | 10.20 |
ENST00000649582.1
|
NR1H4
|
nuclear receptor subfamily 1 group H member 4 |
| chr11_+_64591214 | 10.06 |
ENST00000377574.6
ENST00000473690.5 |
SLC22A12
|
solute carrier family 22 member 12 |
| chr16_+_82035267 | 10.03 |
ENST00000566213.1
|
HSD17B2
|
hydroxysteroid 17-beta dehydrogenase 2 |
| chr7_-_150323489 | 10.00 |
ENST00000683684.1
ENST00000478393.5 |
ACTR3C
|
actin related protein 3C |
| chr11_-_26723361 | 9.94 |
ENST00000533617.5
|
SLC5A12
|
solute carrier family 5 member 12 |
| chr4_-_99290975 | 9.87 |
ENST00000209668.3
|
ADH1A
|
alcohol dehydrogenase 1A (class I), alpha polypeptide |
| chr1_+_162381703 | 9.76 |
ENST00000458626.4
|
C1orf226
|
chromosome 1 open reading frame 226 |
| chr3_-_74521140 | 9.73 |
ENST00000263665.6
|
CNTN3
|
contactin 3 |
| chr16_+_82034978 | 9.70 |
ENST00000563491.5
|
HSD17B2
|
hydroxysteroid 17-beta dehydrogenase 2 |
| chr7_-_155809072 | 9.51 |
ENST00000430104.5
|
SHH
|
sonic hedgehog signaling molecule |
| chr6_+_54307856 | 9.44 |
ENST00000370869.7
|
TINAG
|
tubulointerstitial nephritis antigen |
| chr10_-_50885619 | 9.28 |
ENST00000373997.8
|
A1CF
|
APOBEC1 complementation factor |
| chr15_+_58138169 | 9.09 |
ENST00000558772.5
|
AQP9
|
aquaporin 9 |
| chr19_+_6464229 | 8.88 |
ENST00000600229.6
ENST00000356762.7 |
CRB3
|
crumbs cell polarity complex component 3 |
| chr16_-_87936529 | 8.76 |
ENST00000649794.3
ENST00000649158.1 ENST00000648177.1 |
CA5A
|
carbonic anhydrase 5A |
| chr2_+_132416795 | 8.44 |
ENST00000329321.4
|
GPR39
|
G protein-coupled receptor 39 |
| chr8_-_123737378 | 8.25 |
ENST00000419625.6
ENST00000262219.10 |
ANXA13
|
annexin A13 |
| chr4_-_993430 | 8.24 |
ENST00000361661.6
ENST00000622731.4 |
SLC26A1
|
solute carrier family 26 member 1 |
| chr2_-_99301195 | 8.01 |
ENST00000308528.9
|
LYG1
|
lysozyme g1 |
| chr14_+_39233884 | 7.93 |
ENST00000553728.1
|
MIA2
|
MIA SH3 domain ER export factor 2 |
| chr11_+_126327863 | 7.91 |
ENST00000648516.1
|
DCPS
|
decapping enzyme, scavenger |
| chr11_+_560956 | 7.77 |
ENST00000397582.7
ENST00000397583.8 |
RASSF7
|
Ras association domain family member 7 |
| chr17_+_70075215 | 7.71 |
ENST00000283936.5
ENST00000615244.4 ENST00000392671.6 |
KCNJ16
|
potassium inwardly rectifying channel subfamily J member 16 |
| chr10_-_70888546 | 7.67 |
ENST00000299299.4
|
PCBD1
|
pterin-4 alpha-carbinolamine dehydratase 1 |
| chr22_-_23973183 | 7.19 |
ENST00000428792.1
|
DDT
|
D-dopachrome tautomerase |
| chr16_+_20899852 | 7.07 |
ENST00000568663.5
|
LYRM1
|
LYR motif containing 1 |
| chr2_+_37950432 | 6.88 |
ENST00000407257.5
ENST00000417700.6 ENST00000234195.7 ENST00000442857.5 |
RMDN2
|
regulator of microtubule dynamics 2 |
| chr7_-_150323725 | 6.75 |
ENST00000477871.1
|
ACTR3C
|
actin related protein 3C |
| chr3_-_142963663 | 6.74 |
ENST00000340634.6
|
PAQR9
|
progestin and adipoQ receptor family member 9 |
| chr4_-_993376 | 6.73 |
ENST00000398520.6
ENST00000398516.3 |
SLC26A1
|
solute carrier family 26 member 1 |
| chr4_-_1173168 | 6.62 |
ENST00000514490.5
ENST00000431380.5 ENST00000503765.5 |
SPON2
|
spondin 2 |
| chr17_+_70075317 | 6.45 |
ENST00000589377.1
|
KCNJ16
|
potassium inwardly rectifying channel subfamily J member 16 |
| chr2_-_162074182 | 6.33 |
ENST00000360534.8
|
DPP4
|
dipeptidyl peptidase 4 |
| chr22_-_38110675 | 6.20 |
ENST00000381669.8
|
BAIAP2L2
|
BAR/IMD domain containing adaptor protein 2 like 2 |
| chr17_+_28473635 | 6.20 |
ENST00000314669.10
ENST00000545060.2 |
SLC13A2
|
solute carrier family 13 member 2 |
| chr2_-_162074394 | 6.16 |
ENST00000676810.1
|
DPP4
|
dipeptidyl peptidase 4 |
| chr11_+_64591250 | 6.09 |
ENST00000336464.7
|
SLC22A12
|
solute carrier family 22 member 12 |
| chr21_+_38256698 | 6.00 |
ENST00000613499.4
ENST00000612702.4 ENST00000398925.5 ENST00000398928.5 ENST00000328656.8 ENST00000443341.5 |
KCNJ15
|
potassium inwardly rectifying channel subfamily J member 15 |
| chr6_+_131250375 | 5.96 |
ENST00000474850.2
|
AKAP7
|
A-kinase anchoring protein 7 |
| chr7_-_27180230 | 5.66 |
ENST00000396344.4
|
HOXA10
|
homeobox A10 |
| chr13_+_95433593 | 5.14 |
ENST00000376873.7
|
CLDN10
|
claudin 10 |
| chrX_-_124963768 | 5.07 |
ENST00000371130.7
ENST00000422452.2 |
TENM1
|
teneurin transmembrane protein 1 |
| chr11_-_26721999 | 5.03 |
ENST00000280467.10
|
SLC5A12
|
solute carrier family 5 member 12 |
| chr19_+_6464491 | 5.02 |
ENST00000308243.7
|
CRB3
|
crumbs cell polarity complex component 3 |
| chr7_-_123199960 | 4.90 |
ENST00000194130.7
|
SLC13A1
|
solute carrier family 13 member 1 |
| chr12_+_18242955 | 4.85 |
ENST00000676171.1
|
PIK3C2G
|
phosphatidylinositol-4-phosphate 3-kinase catalytic subunit type 2 gamma |
| chr17_+_28473278 | 4.78 |
ENST00000444914.7
|
SLC13A2
|
solute carrier family 13 member 2 |
| chr5_+_177087412 | 4.62 |
ENST00000513166.1
|
FGFR4
|
fibroblast growth factor receptor 4 |
| chr5_+_132369691 | 4.58 |
ENST00000245407.8
|
SLC22A5
|
solute carrier family 22 member 5 |
| chr2_-_96505345 | 4.58 |
ENST00000310865.7
ENST00000451794.6 |
NEURL3
|
neuralized E3 ubiquitin protein ligase 3 |
| chr16_+_89630263 | 4.45 |
ENST00000261615.5
|
DPEP1
|
dipeptidase 1 |
| chr21_+_38256984 | 4.42 |
ENST00000398938.7
|
KCNJ15
|
potassium inwardly rectifying channel subfamily J member 15 |
| chrX_+_134237047 | 4.38 |
ENST00000370809.4
ENST00000517294.5 |
CCDC160
|
coiled-coil domain containing 160 |
| chr6_-_154430495 | 4.38 |
ENST00000424998.3
|
CNKSR3
|
CNKSR family member 3 |
| chr1_-_153613095 | 4.16 |
ENST00000368706.9
|
S100A16
|
S100 calcium binding protein A16 |
| chr19_+_49513154 | 4.14 |
ENST00000426395.7
ENST00000600273.5 ENST00000599988.5 |
FCGRT
|
Fc fragment of IgG receptor and transporter |
| chr2_+_181985846 | 4.06 |
ENST00000682840.1
ENST00000409137.7 ENST00000280295.7 |
PPP1R1C
|
protein phosphatase 1 regulatory inhibitor subunit 1C |
| chr4_-_22443110 | 3.93 |
ENST00000508133.5
|
ADGRA3
|
adhesion G protein-coupled receptor A3 |
| chr5_+_73813518 | 3.88 |
ENST00000296799.8
|
ARHGEF28
|
Rho guanine nucleotide exchange factor 28 |
| chr16_-_55875358 | 3.84 |
ENST00000319165.13
ENST00000290567.14 |
CES5A
|
carboxylesterase 5A |
| chr22_+_44702186 | 3.63 |
ENST00000336985.11
ENST00000403696.5 ENST00000457960.5 ENST00000361473.9 |
PRR5
PRR5-ARHGAP8
|
proline rich 5 PRR5-ARHGAP8 readthrough |
| chr7_-_128910676 | 3.56 |
ENST00000620378.1
ENST00000610776.4 ENST00000613019.4 |
KCP
|
kielin cysteine rich BMP regulator |
| chr22_+_32043253 | 3.56 |
ENST00000266088.9
|
SLC5A1
|
solute carrier family 5 member 1 |
| chr17_-_28406160 | 3.55 |
ENST00000618626.1
ENST00000612814.5 |
SLC46A1
|
solute carrier family 46 member 1 |
| chr4_-_99352754 | 3.43 |
ENST00000639454.1
|
ADH1B
|
alcohol dehydrogenase 1B (class I), beta polypeptide |
| chr6_+_63521738 | 3.42 |
ENST00000648894.1
ENST00000639568.2 |
PTP4A1
|
protein tyrosine phosphatase 4A1 |
| chr12_-_8540873 | 3.38 |
ENST00000545274.5
ENST00000446457.6 ENST00000299663.8 |
CLEC4E
|
C-type lectin domain family 4 member E |
| chr3_-_157503339 | 3.36 |
ENST00000392833.6
|
VEPH1
|
ventricular zone expressed PH domain containing 1 |
| chr14_+_24120956 | 3.32 |
ENST00000558325.2
|
ENSG00000259371.2
|
novel protein |
| chr2_-_162074050 | 3.28 |
ENST00000676768.1
|
DPP4
|
dipeptidyl peptidase 4 |
| chr3_-_157503574 | 2.98 |
ENST00000494677.5
ENST00000468233.5 |
VEPH1
|
ventricular zone expressed PH domain containing 1 |
| chr16_+_67518415 | 2.96 |
ENST00000562116.1
|
RIPOR1
|
RHO family interacting cell polarization regulator 1 |
| chr3_-_157503375 | 2.89 |
ENST00000362010.7
|
VEPH1
|
ventricular zone expressed PH domain containing 1 |
| chr7_-_122304738 | 2.86 |
ENST00000442488.7
|
FEZF1
|
FEZ family zinc finger 1 |
| chr3_+_188212641 | 2.71 |
ENST00000420410.5
|
LPP
|
LIM domain containing preferred translocation partner in lipoma |
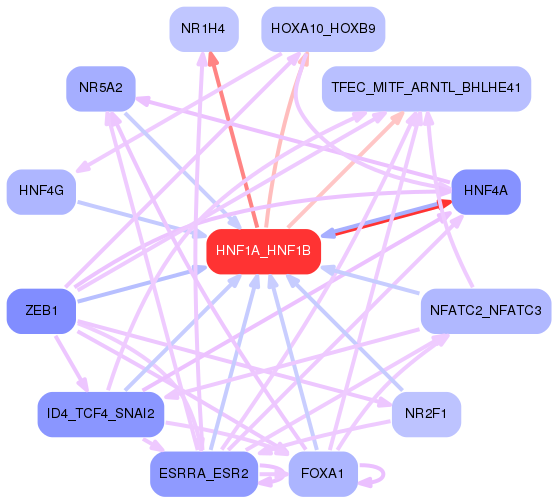
Network of associatons between targets according to the STRING database.

First level regulatory network of HNF1A_HNF1B
Gene Ontology Analysis
Gene overrepresentation in biological process category:
| Log-likelihood per target | Total log-likelihood | Term | Description |
|---|---|---|---|
| 34.4 | 137.4 | GO:0051919 | positive regulation of fibrinolysis(GO:0051919) |
| 26.0 | 311.8 | GO:0052697 | flavonoid glucuronidation(GO:0052696) xenobiotic glucuronidation(GO:0052697) |
| 22.5 | 135.2 | GO:0008218 | bioluminescence(GO:0008218) |
| 19.8 | 59.5 | GO:0019836 | hemolysis by symbiont of host erythrocytes(GO:0019836) hemolysis in other organism(GO:0044179) hemolysis in other organism involved in symbiotic interaction(GO:0052331) |
| 19.8 | 217.9 | GO:0036112 | medium-chain fatty-acyl-CoA metabolic process(GO:0036112) |
| 19.8 | 79.2 | GO:0010133 | proline catabolic process to glutamate(GO:0010133) |
| 18.1 | 163.1 | GO:0045959 | regulation of complement activation, classical pathway(GO:0030450) negative regulation of complement activation, classical pathway(GO:0045959) |
| 18.0 | 108.0 | GO:0038185 | nitrogen catabolite regulation of transcription from RNA polymerase II promoter(GO:0001079) nitrogen catabolite activation of transcription from RNA polymerase II promoter(GO:0001080) regulation of urea metabolic process(GO:0034255) intracellular bile acid receptor signaling pathway(GO:0038185) interleukin-17 secretion(GO:0072615) nitrogen catabolite regulation of transcription(GO:0090293) nitrogen catabolite activation of transcription(GO:0090294) regulation of nitrogen cycle metabolic process(GO:1903314) positive regulation of glutamate metabolic process(GO:2000213) regulation of ammonia assimilation cycle(GO:2001248) positive regulation of ammonia assimilation cycle(GO:2001250) |
| 16.8 | 50.4 | GO:0016999 | antibiotic metabolic process(GO:0016999) |
| 16.5 | 197.7 | GO:0051918 | negative regulation of fibrinolysis(GO:0051918) |
| 16.1 | 225.9 | GO:0043152 | induction of bacterial agglutination(GO:0043152) |
| 14.2 | 170.1 | GO:2000189 | positive regulation of cholesterol homeostasis(GO:2000189) |
| 13.6 | 40.8 | GO:0019470 | 4-hydroxyproline catabolic process(GO:0019470) |
| 12.1 | 36.2 | GO:0090675 | intermicrovillar adhesion(GO:0090675) |
| 10.0 | 30.0 | GO:0052314 | phytoalexin metabolic process(GO:0052314) |
| 7.7 | 46.0 | GO:0010760 | negative regulation of macrophage chemotaxis(GO:0010760) |
| 7.5 | 37.7 | GO:0010193 | response to ozone(GO:0010193) |
| 7.1 | 21.2 | GO:1904106 | protein localization to microvillus(GO:1904106) |
| 7.0 | 20.9 | GO:2000646 | positive regulation of receptor catabolic process(GO:2000646) |
| 6.8 | 47.5 | GO:1903412 | response to bile acid(GO:1903412) |
| 6.6 | 52.9 | GO:0009441 | glycolate metabolic process(GO:0009441) |
| 6.2 | 24.7 | GO:0034444 | regulation of plasma lipoprotein particle oxidation(GO:0034444) negative regulation of plasma lipoprotein particle oxidation(GO:0034445) |
| 5.9 | 94.8 | GO:0008228 | opsonization(GO:0008228) |
| 4.9 | 68.7 | GO:0015747 | urate transport(GO:0015747) |
| 4.8 | 67.3 | GO:0070327 | thyroid hormone transport(GO:0070327) |
| 4.7 | 14.2 | GO:0070904 | L-ascorbic acid transport(GO:0015882) transepithelial L-ascorbic acid transport(GO:0070904) |
| 4.4 | 22.1 | GO:0015722 | canalicular bile acid transport(GO:0015722) |
| 4.0 | 47.8 | GO:0052695 | cellular glucuronidation(GO:0052695) |
| 4.0 | 135.5 | GO:0042359 | vitamin D metabolic process(GO:0042359) |
| 4.0 | 23.7 | GO:0061107 | seminal vesicle development(GO:0061107) |
| 3.8 | 30.3 | GO:0055091 | phospholipid homeostasis(GO:0055091) |
| 3.6 | 25.3 | GO:0034378 | chylomicron assembly(GO:0034378) |
| 3.6 | 14.4 | GO:0090080 | positive regulation of MAPKKK cascade by fibroblast growth factor receptor signaling pathway(GO:0090080) |
| 3.5 | 31.6 | GO:0033132 | negative regulation of glucokinase activity(GO:0033132) negative regulation of hexokinase activity(GO:1903300) |
| 3.2 | 9.5 | GO:0016539 | intein-mediated protein splicing(GO:0016539) protein splicing(GO:0030908) right lung development(GO:0060458) primary prostatic bud elongation(GO:0060516) epithelial-mesenchymal signaling involved in prostate gland development(GO:0060738) positive regulation of mesenchymal cell proliferation involved in ureter development(GO:2000729) |
| 3.1 | 22.0 | GO:0006651 | diacylglycerol biosynthetic process(GO:0006651) |
| 3.1 | 21.8 | GO:0043606 | histidine catabolic process to glutamate and formamide(GO:0019556) histidine catabolic process to glutamate and formate(GO:0019557) formamide metabolic process(GO:0043606) |
| 2.8 | 64.5 | GO:0034374 | low-density lipoprotein particle remodeling(GO:0034374) |
| 2.6 | 7.9 | GO:0036245 | cellular response to menadione(GO:0036245) |
| 2.5 | 44.3 | GO:0032000 | positive regulation of fatty acid beta-oxidation(GO:0032000) |
| 2.4 | 71.6 | GO:0035435 | phosphate ion transmembrane transport(GO:0035435) |
| 2.0 | 24.5 | GO:0016554 | cytidine to uridine editing(GO:0016554) |
| 1.6 | 15.8 | GO:0036343 | negative regulation of extracellular matrix disassembly(GO:0010716) psychomotor behavior(GO:0036343) |
| 1.6 | 106.5 | GO:0051180 | vitamin transport(GO:0051180) |
| 1.5 | 27.8 | GO:1990573 | potassium ion import across plasma membrane(GO:1990573) |
| 1.5 | 4.6 | GO:0060730 | regulation of intestinal epithelial structure maintenance(GO:0060730) |
| 1.5 | 15.0 | GO:0034036 | purine ribonucleoside bisphosphate biosynthetic process(GO:0034036) 3'-phosphoadenosine 5'-phosphosulfate biosynthetic process(GO:0050428) |
| 1.5 | 29.2 | GO:0050746 | regulation of lipoprotein metabolic process(GO:0050746) |
| 1.5 | 36.3 | GO:0030299 | intestinal cholesterol absorption(GO:0030299) intestinal lipid absorption(GO:0098856) |
| 1.4 | 22.2 | GO:0006957 | complement activation, alternative pathway(GO:0006957) |
| 1.3 | 45.8 | GO:0043567 | regulation of insulin-like growth factor receptor signaling pathway(GO:0043567) |
| 1.2 | 16.0 | GO:1901687 | glutathione derivative metabolic process(GO:1901685) glutathione derivative biosynthetic process(GO:1901687) |
| 1.2 | 24.5 | GO:0006069 | ethanol oxidation(GO:0006069) |
| 1.1 | 19.7 | GO:0006703 | estrogen biosynthetic process(GO:0006703) |
| 1.1 | 18.0 | GO:0035873 | lactate transport(GO:0015727) lactate transmembrane transport(GO:0035873) |
| 0.9 | 8.0 | GO:0000270 | peptidoglycan metabolic process(GO:0000270) peptidoglycan catabolic process(GO:0009253) |
| 0.9 | 7.7 | GO:0006729 | tetrahydrobiopterin biosynthetic process(GO:0006729) tetrahydrobiopterin metabolic process(GO:0046146) |
| 0.8 | 63.2 | GO:0042632 | cholesterol homeostasis(GO:0042632) sterol homeostasis(GO:0055092) |
| 0.7 | 15.9 | GO:0034356 | NAD biosynthesis via nicotinamide riboside salvage pathway(GO:0034356) |
| 0.6 | 51.2 | GO:0006953 | acute-phase response(GO:0006953) |
| 0.6 | 15.3 | GO:0043252 | sodium-independent organic anion transport(GO:0043252) |
| 0.5 | 81.8 | GO:0006805 | xenobiotic metabolic process(GO:0006805) |
| 0.5 | 4.1 | GO:0021797 | forebrain anterior/posterior pattern specification(GO:0021797) |
| 0.5 | 3.6 | GO:0001951 | intestinal D-glucose absorption(GO:0001951) |
| 0.5 | 27.2 | GO:0010107 | potassium ion import(GO:0010107) |
| 0.4 | 42.2 | GO:1990748 | cellular oxidant detoxification(GO:0098869) cellular detoxification(GO:1990748) |
| 0.3 | 4.9 | GO:1902358 | sulfate transmembrane transport(GO:1902358) |
| 0.3 | 1.6 | GO:0036233 | glycine import(GO:0036233) |
| 0.3 | 19.4 | GO:0034314 | Arp2/3 complex-mediated actin nucleation(GO:0034314) |
| 0.3 | 56.1 | GO:0032411 | positive regulation of transporter activity(GO:0032411) |
| 0.3 | 39.0 | GO:0030449 | regulation of complement activation(GO:0030449) |
| 0.2 | 16.8 | GO:0010824 | regulation of centrosome duplication(GO:0010824) |
| 0.2 | 10.2 | GO:0016339 | calcium-dependent cell-cell adhesion via plasma membrane cell adhesion molecules(GO:0016339) |
| 0.2 | 6.2 | GO:2000251 | positive regulation of actin cytoskeleton reorganization(GO:2000251) |
| 0.2 | 1.6 | GO:0000066 | mitochondrial ornithine transport(GO:0000066) |
| 0.2 | 1.1 | GO:0038161 | prolactin signaling pathway(GO:0038161) |
| 0.2 | 3.6 | GO:0038203 | TORC2 signaling(GO:0038203) |
| 0.2 | 1.9 | GO:2000002 | negative regulation of DNA damage checkpoint(GO:2000002) |
| 0.1 | 7.2 | GO:0042438 | melanin biosynthetic process(GO:0042438) |
| 0.1 | 1.2 | GO:0006686 | sphingomyelin biosynthetic process(GO:0006686) |
| 0.1 | 5.7 | GO:0060065 | uterus development(GO:0060065) |
| 0.1 | 5.1 | GO:0016338 | calcium-independent cell-cell adhesion via plasma membrane cell-adhesion molecules(GO:0016338) |
| 0.1 | 20.0 | GO:0009062 | fatty acid catabolic process(GO:0009062) |
| 0.1 | 13.9 | GO:0070830 | bicellular tight junction assembly(GO:0070830) |
| 0.1 | 8.8 | GO:0006730 | one-carbon metabolic process(GO:0006730) |
| 0.1 | 6.0 | GO:0010738 | regulation of protein kinase A signaling(GO:0010738) |
| 0.1 | 17.8 | GO:0038083 | peptidyl-tyrosine autophosphorylation(GO:0038083) |
| 0.1 | 1.5 | GO:2001106 | regulation of Rho guanyl-nucleotide exchange factor activity(GO:2001106) |
| 0.1 | 5.1 | GO:0006359 | regulation of transcription from RNA polymerase III promoter(GO:0006359) |
| 0.1 | 19.9 | GO:1902476 | chloride transmembrane transport(GO:1902476) |
| 0.1 | 1.4 | GO:0015866 | ADP transport(GO:0015866) |
| 0.1 | 3.0 | GO:0051683 | establishment of Golgi localization(GO:0051683) |
| 0.1 | 5.4 | GO:1900087 | positive regulation of G1/S transition of mitotic cell cycle(GO:1900087) |
| 0.1 | 4.8 | GO:0039694 | viral RNA genome replication(GO:0039694) RNA replication(GO:0039703) |
| 0.1 | 8.9 | GO:0006501 | C-terminal protein lipidation(GO:0006501) |
| 0.1 | 0.7 | GO:0036444 | calcium ion transmembrane import into mitochondrion(GO:0036444) |
| 0.1 | 26.4 | GO:0007018 | microtubule-based movement(GO:0007018) |
| 0.1 | 9.1 | GO:0017158 | regulation of calcium ion-dependent exocytosis(GO:0017158) |
| 0.0 | 7.8 | GO:0070507 | regulation of microtubule cytoskeleton organization(GO:0070507) |
| 0.0 | 3.9 | GO:0048013 | ephrin receptor signaling pathway(GO:0048013) |
| 0.0 | 3.4 | GO:0002292 | T cell differentiation involved in immune response(GO:0002292) |
| 0.0 | 0.8 | GO:0050832 | defense response to fungus(GO:0050832) |
| 0.0 | 3.4 | GO:0035335 | peptidyl-tyrosine dephosphorylation(GO:0035335) |
| 0.0 | 2.4 | GO:0034605 | cellular response to heat(GO:0034605) |
Gene overrepresentation in cellular component category:
| Log-likelihood per target | Total log-likelihood | Term | Description |
|---|---|---|---|
| 22.2 | 288.7 | GO:0005577 | fibrinogen complex(GO:0005577) |
| 14.4 | 100.7 | GO:0031232 | extrinsic component of external side of plasma membrane(GO:0031232) |
| 7.6 | 68.1 | GO:0005579 | membrane attack complex(GO:0005579) |
| 6.2 | 24.7 | GO:0034365 | discoidal high-density lipoprotein particle(GO:0034365) |
| 6.1 | 24.5 | GO:0030895 | apolipoprotein B mRNA editing enzyme complex(GO:0030895) |
| 6.1 | 134.4 | GO:0031089 | platelet dense granule lumen(GO:0031089) |
| 6.0 | 36.2 | GO:0089717 | spanning component of plasma membrane(GO:0044214) spanning component of membrane(GO:0089717) |
| 3.9 | 61.7 | GO:0046581 | intercellular canaliculus(GO:0046581) |
| 3.8 | 72.4 | GO:0034663 | endoplasmic reticulum chaperone complex(GO:0034663) |
| 3.1 | 22.0 | GO:0032311 | angiogenin-PRI complex(GO:0032311) |
| 2.4 | 21.8 | GO:0097425 | smooth endoplasmic reticulum membrane(GO:0030868) smooth endoplasmic reticulum part(GO:0097425) |
| 2.3 | 108.0 | GO:0005719 | nuclear euchromatin(GO:0005719) |
| 2.2 | 44.3 | GO:0045179 | apical cortex(GO:0045179) |
| 1.8 | 463.0 | GO:0072562 | blood microparticle(GO:0072562) |
| 1.3 | 39.1 | GO:0034364 | high-density lipoprotein particle(GO:0034364) |
| 1.1 | 27.8 | GO:0005890 | sodium:potassium-exchanging ATPase complex(GO:0005890) |
| 0.9 | 26.1 | GO:0070971 | endoplasmic reticulum exit site(GO:0070971) |
| 0.9 | 67.0 | GO:0031907 | peroxisomal matrix(GO:0005782) microbody lumen(GO:0031907) |
| 0.9 | 25.4 | GO:1990777 | plasma lipoprotein particle(GO:0034358) lipoprotein particle(GO:1990777) |
| 0.9 | 90.4 | GO:0031526 | brush border membrane(GO:0031526) |
| 0.8 | 19.4 | GO:0005885 | Arp2/3 protein complex(GO:0005885) |
| 0.7 | 16.8 | GO:0031362 | anchored component of external side of plasma membrane(GO:0031362) |
| 0.5 | 404.1 | GO:0005759 | mitochondrial matrix(GO:0005759) |
| 0.5 | 5.2 | GO:0035867 | alphav-beta3 integrin-IGF-1-IGF1R complex(GO:0035867) |
| 0.5 | 51.2 | GO:0030134 | ER to Golgi transport vesicle(GO:0030134) |
| 0.4 | 185.7 | GO:0005788 | endoplasmic reticulum lumen(GO:0005788) |
| 0.4 | 52.1 | GO:0044217 | other organism(GO:0044215) other organism cell(GO:0044216) other organism part(GO:0044217) |
| 0.3 | 6.2 | GO:0071439 | clathrin complex(GO:0071439) |
| 0.2 | 26.8 | GO:0005871 | kinesin complex(GO:0005871) |
| 0.2 | 14.2 | GO:0009925 | basal plasma membrane(GO:0009925) |
| 0.2 | 18.6 | GO:0035580 | specific granule lumen(GO:0035580) |
| 0.2 | 329.2 | GO:0005789 | endoplasmic reticulum membrane(GO:0005789) |
| 0.2 | 4.4 | GO:0031528 | microvillus membrane(GO:0031528) |
| 0.2 | 21.3 | GO:0005604 | basement membrane(GO:0005604) |
| 0.2 | 67.1 | GO:0030133 | transport vesicle(GO:0030133) |
| 0.2 | 41.4 | GO:0016323 | basolateral plasma membrane(GO:0016323) |
| 0.2 | 77.2 | GO:0005743 | mitochondrial inner membrane(GO:0005743) |
| 0.2 | 16.9 | GO:0031463 | Cul3-RING ubiquitin ligase complex(GO:0031463) |
| 0.2 | 70.1 | GO:0016324 | apical plasma membrane(GO:0016324) |
| 0.1 | 261.3 | GO:0005615 | extracellular space(GO:0005615) |
| 0.1 | 3.6 | GO:0031932 | TORC2 complex(GO:0031932) |
| 0.1 | 1.9 | GO:0000445 | THO complex(GO:0000347) THO complex part of transcription export complex(GO:0000445) |
| 0.1 | 8.9 | GO:0031225 | anchored component of membrane(GO:0031225) |
| 0.0 | 40.4 | GO:0000139 | Golgi membrane(GO:0000139) |
| 0.0 | 6.6 | GO:0005578 | proteinaceous extracellular matrix(GO:0005578) |
| 0.0 | 7.9 | GO:0000932 | cytoplasmic mRNA processing body(GO:0000932) |
| 0.0 | 1.1 | GO:0031904 | endosome lumen(GO:0031904) |
| 0.0 | 5.7 | GO:0005667 | transcription factor complex(GO:0005667) |
| 0.0 | 124.3 | GO:0005576 | extracellular region(GO:0005576) |
| 0.0 | 3.9 | GO:0009897 | external side of plasma membrane(GO:0009897) |
| 0.0 | 5.1 | GO:0005923 | bicellular tight junction(GO:0005923) |
| 0.0 | 5.1 | GO:0016363 | nuclear matrix(GO:0016363) |
| 0.0 | 160.5 | GO:0005654 | nucleoplasm(GO:0005654) |
| 0.0 | 3.9 | GO:0000922 | spindle pole(GO:0000922) |
| 0.0 | 14.6 | GO:0005739 | mitochondrion(GO:0005739) |
| 0.0 | 18.3 | GO:0005887 | integral component of plasma membrane(GO:0005887) |
Gene overrepresentation in molecular function category:
| Log-likelihood per target | Total log-likelihood | Term | Description |
|---|---|---|---|
| 34.1 | 136.6 | GO:1902271 | D3 vitamins binding(GO:1902271) |
| 26.6 | 79.8 | GO:1904854 | proteasome core complex binding(GO:1904854) |
| 25.5 | 101.9 | GO:0008431 | vitamin E binding(GO:0008431) |
| 24.2 | 363.0 | GO:0004321 | fatty-acyl-CoA synthase activity(GO:0004321) |
| 23.7 | 94.8 | GO:0033265 | choline binding(GO:0033265) |
| 22.3 | 67.0 | GO:0052853 | (S)-2-hydroxy-acid oxidase activity(GO:0003973) very-long-chain-(S)-2-hydroxy-acid oxidase activity(GO:0052852) long-chain-(S)-2-hydroxy-long-chain-acid oxidase activity(GO:0052853) medium-chain-(S)-2-hydroxy-acid oxidase activity(GO:0052854) |
| 18.4 | 110.7 | GO:0060230 | lipoprotein lipase activator activity(GO:0060230) |
| 18.0 | 108.0 | GO:1902122 | chenodeoxycholic acid binding(GO:1902122) |
| 7.9 | 31.6 | GO:0070095 | fructose-6-phosphate binding(GO:0070095) |
| 6.9 | 325.9 | GO:0001972 | retinoic acid binding(GO:0001972) |
| 6.6 | 19.9 | GO:0008511 | sodium:potassium:chloride symporter activity(GO:0008511) |
| 6.3 | 44.3 | GO:0005324 | long-chain fatty acid transporter activity(GO:0005324) |
| 5.8 | 40.8 | GO:0016833 | oxo-acid-lyase activity(GO:0016833) |
| 5.2 | 20.9 | GO:0034189 | very-low-density lipoprotein particle binding(GO:0034189) |
| 4.8 | 96.6 | GO:0005436 | sodium:phosphate symporter activity(GO:0005436) |
| 4.7 | 14.2 | GO:0008520 | L-ascorbate:sodium symporter activity(GO:0008520) L-ascorbic acid transporter activity(GO:0015229) sodium-dependent L-ascorbate transmembrane transporter activity(GO:0070890) |
| 4.4 | 22.1 | GO:0005350 | pyrimidine nucleobase transmembrane transporter activity(GO:0005350) |
| 3.9 | 19.7 | GO:0047006 | 17-alpha,20-alpha-dihydroxypregn-4-en-3-one dehydrogenase activity(GO:0047006) |
| 3.7 | 22.0 | GO:0004522 | ribonuclease A activity(GO:0004522) |
| 3.5 | 45.8 | GO:0031995 | insulin-like growth factor II binding(GO:0031995) |
| 3.2 | 219.1 | GO:0005504 | fatty acid binding(GO:0005504) |
| 3.2 | 47.5 | GO:0005007 | fibroblast growth factor-activated receptor activity(GO:0005007) |
| 3.1 | 21.8 | GO:0016841 | ammonia-lyase activity(GO:0016841) |
| 3.0 | 41.5 | GO:1901702 | urate transmembrane transporter activity(GO:0015143) salt transmembrane transporter activity(GO:1901702) |
| 2.7 | 24.5 | GO:0004024 | alcohol dehydrogenase activity, zinc-dependent(GO:0004024) |
| 2.6 | 64.5 | GO:0034185 | apolipoprotein binding(GO:0034185) |
| 2.4 | 7.2 | GO:0033981 | D-dopachrome decarboxylase activity(GO:0033981) |
| 2.4 | 14.4 | GO:0008422 | beta-glucosidase activity(GO:0008422) |
| 2.3 | 79.2 | GO:0071949 | FAD binding(GO:0071949) |
| 2.2 | 11.0 | GO:0017153 | sodium:dicarboxylate symporter activity(GO:0017153) |
| 2.2 | 45.9 | GO:0043225 | anion transmembrane-transporting ATPase activity(GO:0043225) |
| 1.9 | 64.0 | GO:0017081 | chloride channel regulator activity(GO:0017081) |
| 1.9 | 303.2 | GO:0004867 | serine-type endopeptidase inhibitor activity(GO:0004867) |
| 1.8 | 37.7 | GO:0008391 | arachidonic acid monooxygenase activity(GO:0008391) arachidonic acid epoxygenase activity(GO:0008392) |
| 1.7 | 57.4 | GO:0015020 | glucuronosyltransferase activity(GO:0015020) |
| 1.7 | 16.6 | GO:0015349 | thyroid hormone transmembrane transporter activity(GO:0015349) |
| 1.6 | 57.6 | GO:0070008 | serine-type exopeptidase activity(GO:0070008) |
| 1.4 | 30.4 | GO:0004859 | phospholipase inhibitor activity(GO:0004859) |
| 1.3 | 27.8 | GO:0005391 | sodium:potassium-exchanging ATPase activity(GO:0005391) |
| 1.3 | 21.0 | GO:0070053 | thrombospondin receptor activity(GO:0070053) |
| 1.3 | 7.7 | GO:0004505 | phenylalanine 4-monooxygenase activity(GO:0004505) |
| 1.2 | 42.2 | GO:0004602 | glutathione peroxidase activity(GO:0004602) |
| 1.2 | 18.0 | GO:0015129 | lactate transmembrane transporter activity(GO:0015129) |
| 1.1 | 36.3 | GO:0031489 | myosin V binding(GO:0031489) |
| 1.1 | 27.3 | GO:0015467 | G-protein activated inward rectifier potassium channel activity(GO:0015467) |
| 1.1 | 9.5 | GO:0043237 | laminin-1 binding(GO:0043237) |
| 1.0 | 19.9 | GO:0008271 | secondary active sulfate transmembrane transporter activity(GO:0008271) |
| 0.9 | 12.9 | GO:0030274 | LIM domain binding(GO:0030274) |
| 0.9 | 26.0 | GO:0001871 | pattern binding(GO:0001871) polysaccharide binding(GO:0030247) |
| 0.8 | 46.0 | GO:0008009 | chemokine activity(GO:0008009) |
| 0.8 | 17.5 | GO:0015347 | sodium-independent organic anion transmembrane transporter activity(GO:0015347) |
| 0.7 | 112.3 | GO:0051087 | chaperone binding(GO:0051087) |
| 0.7 | 20.2 | GO:0008239 | dipeptidyl-peptidase activity(GO:0008239) |
| 0.6 | 22.2 | GO:0001848 | complement binding(GO:0001848) |
| 0.6 | 7.9 | GO:0000340 | RNA 7-methylguanosine cap binding(GO:0000340) |
| 0.6 | 38.9 | GO:0005044 | scavenger receptor activity(GO:0005044) |
| 0.6 | 4.6 | GO:0015226 | amino-acid betaine transmembrane transporter activity(GO:0015199) carnitine transmembrane transporter activity(GO:0015226) |
| 0.5 | 3.5 | GO:0015350 | methotrexate transporter activity(GO:0015350) |
| 0.4 | 8.0 | GO:0003796 | lysozyme activity(GO:0003796) |
| 0.4 | 8.8 | GO:0004089 | carbonate dehydratase activity(GO:0004089) |
| 0.4 | 16.0 | GO:0004364 | glutathione transferase activity(GO:0004364) |
| 0.4 | 30.0 | GO:0016831 | carboxy-lyase activity(GO:0016831) |
| 0.4 | 1.6 | GO:0015375 | glycine:sodium symporter activity(GO:0015375) |
| 0.3 | 4.8 | GO:0035005 | 1-phosphatidylinositol-4-phosphate 3-kinase activity(GO:0035005) |
| 0.3 | 5.4 | GO:0004865 | protein serine/threonine phosphatase inhibitor activity(GO:0004865) |
| 0.3 | 1.1 | GO:0004925 | prolactin receptor activity(GO:0004925) |
| 0.3 | 24.7 | GO:0016209 | antioxidant activity(GO:0016209) |
| 0.2 | 74.0 | GO:0004252 | serine-type endopeptidase activity(GO:0004252) |
| 0.2 | 22.9 | GO:0005544 | calcium-dependent phospholipid binding(GO:0005544) |
| 0.2 | 21.7 | GO:0005548 | phospholipid transporter activity(GO:0005548) |
| 0.2 | 1.2 | GO:0033188 | sphingomyelin synthase activity(GO:0033188) ceramide cholinephosphotransferase activity(GO:0047493) |
| 0.2 | 1.6 | GO:0000064 | L-ornithine transmembrane transporter activity(GO:0000064) |
| 0.2 | 26.8 | GO:0003777 | microtubule motor activity(GO:0003777) |
| 0.2 | 6.6 | GO:0001530 | lipopolysaccharide binding(GO:0001530) |
| 0.2 | 18.6 | GO:0004715 | non-membrane spanning protein tyrosine kinase activity(GO:0004715) |
| 0.2 | 70.1 | GO:0030674 | protein binding, bridging(GO:0030674) |
| 0.2 | 24.5 | GO:0003727 | single-stranded RNA binding(GO:0003727) |
| 0.1 | 6.0 | GO:0034237 | protein kinase A regulatory subunit binding(GO:0034237) |
| 0.1 | 1.0 | GO:0031419 | cobalamin binding(GO:0031419) |
| 0.1 | 5.2 | GO:0005158 | insulin receptor binding(GO:0005158) |
| 0.1 | 1.4 | GO:0015217 | ATP transmembrane transporter activity(GO:0005347) ADP transmembrane transporter activity(GO:0015217) |
| 0.1 | 13.4 | GO:0008170 | N-methyltransferase activity(GO:0008170) |
| 0.1 | 8.5 | GO:0005179 | hormone activity(GO:0005179) |
| 0.1 | 6.7 | GO:0003707 | steroid hormone receptor activity(GO:0003707) |
| 0.1 | 11.9 | GO:0017124 | SH3 domain binding(GO:0017124) |
| 0.1 | 3.0 | GO:0071889 | 14-3-3 protein binding(GO:0071889) |
| 0.0 | 3.9 | GO:0017112 | Rab guanyl-nucleotide exchange factor activity(GO:0017112) |
| 0.0 | 3.4 | GO:0008138 | protein tyrosine/serine/threonine phosphatase activity(GO:0008138) |
| 0.0 | 20.5 | GO:0050839 | cell adhesion molecule binding(GO:0050839) |
| 0.0 | 0.7 | GO:0008195 | phosphatidate phosphatase activity(GO:0008195) |
| 0.0 | 63.2 | GO:0003723 | RNA binding(GO:0003723) |
| 0.0 | 2.1 | GO:0052689 | carboxylic ester hydrolase activity(GO:0052689) |
Gene overrepresentation in curated gene sets: canonical pathways category:
| Log-likelihood per target | Total log-likelihood | Term | Description |
|---|---|---|---|
| 3.4 | 220.6 | PID INTEGRIN2 PATHWAY | Beta2 integrin cell surface interactions |
| 3.1 | 283.0 | PID HNF3B PATHWAY | FOXA2 and FOXA3 transcription factor networks |
| 1.5 | 105.2 | PID AMB2 NEUTROPHILS PATHWAY | amb2 Integrin signaling |
| 1.4 | 103.4 | PID CD40 PATHWAY | CD40/CD40L signaling |
| 1.2 | 97.5 | PID RXR VDR PATHWAY | RXR and RAR heterodimerization with other nuclear receptor |
| 1.2 | 112.8 | PID HNF3A PATHWAY | FOXA1 transcription factor network |
| 1.0 | 89.3 | PID IL6 7 PATHWAY | IL6-mediated signaling events |
| 0.9 | 348.9 | NABA ECM REGULATORS | Genes encoding enzymes and their regulators involved in the remodeling of the extracellular matrix |
| 0.6 | 60.2 | PID FGF PATHWAY | FGF signaling pathway |
| 0.5 | 13.1 | PID INTEGRIN A9B1 PATHWAY | Alpha9 beta1 integrin signaling events |
| 0.4 | 42.2 | PID DELTA NP63 PATHWAY | Validated transcriptional targets of deltaNp63 isoforms |
| 0.3 | 33.6 | PID AVB3 INTEGRIN PATHWAY | Integrins in angiogenesis |
| 0.2 | 53.2 | NABA ECM GLYCOPROTEINS | Genes encoding structural ECM glycoproteins |
| 0.1 | 3.4 | PID PRL SIGNALING EVENTS PATHWAY | Signaling events mediated by PRL |
| 0.1 | 5.7 | PID HDAC CLASSIII PATHWAY | Signaling events mediated by HDAC Class III |
| 0.1 | 4.8 | ST DIFFERENTIATION PATHWAY IN PC12 CELLS | Differentiation Pathway in PC12 Cells; this is a specific case of PAC1 Receptor Pathway. |
| 0.0 | 5.0 | PID E2F PATHWAY | E2F transcription factor network |
| 0.0 | 3.6 | PID MTOR 4PATHWAY | mTOR signaling pathway |
| 0.0 | 7.2 | NABA ECM AFFILIATED | Genes encoding proteins affiliated structurally or functionally to extracellular matrix proteins |
| 0.0 | 1.1 | PID PTP1B PATHWAY | Signaling events mediated by PTP1B |
| 0.0 | 2.4 | PID CMYB PATHWAY | C-MYB transcription factor network |
Gene overrepresentation in curated gene sets: REACTOME pathways category:
| Log-likelihood per target | Total log-likelihood | Term | Description |
|---|---|---|---|
| 14.3 | 271.7 | REACTOME COMMON PATHWAY | Genes involved in Common Pathway |
| 10.8 | 312.1 | REACTOME GLUCURONIDATION | Genes involved in Glucuronidation |
| 7.8 | 203.5 | REACTOME REGULATION OF COMPLEMENT CASCADE | Genes involved in Regulation of Complement cascade |
| 6.8 | 162.9 | REACTOME COMPLEMENT CASCADE | Genes involved in Complement cascade |
| 4.9 | 87.8 | REACTOME RECYCLING OF BILE ACIDS AND SALTS | Genes involved in Recycling of bile acids and salts |
| 4.5 | 125.6 | REACTOME REGULATION OF INSULIN LIKE GROWTH FACTOR IGF ACTIVITY BY INSULIN LIKE GROWTH FACTOR BINDING PROTEINS IGFBPS | Genes involved in Regulation of Insulin-like Growth Factor (IGF) Activity by Insulin-like Growth Factor Binding Proteins (IGFBPs) |
| 3.0 | 170.1 | REACTOME REGULATION OF GENE EXPRESSION IN BETA CELLS | Genes involved in Regulation of gene expression in beta cells |
| 3.0 | 136.6 | REACTOME STEROID HORMONES | Genes involved in Steroid hormones |
| 2.6 | 64.4 | REACTOME CHYLOMICRON MEDIATED LIPID TRANSPORT | Genes involved in Chylomicron-mediated lipid transport |
| 2.3 | 47.5 | REACTOME FGFR4 LIGAND BINDING AND ACTIVATION | Genes involved in FGFR4 ligand binding and activation |
| 2.2 | 57.6 | REACTOME INTRINSIC PATHWAY | Genes involved in Intrinsic Pathway |
| 2.1 | 37.7 | REACTOME XENOBIOTICS | Genes involved in Xenobiotics |
| 1.7 | 46.0 | REACTOME ORGANIC CATION ANION ZWITTERION TRANSPORT | Genes involved in Organic cation/anion/zwitterion transport |
| 1.6 | 25.4 | REACTOME LIPOPROTEIN METABOLISM | Genes involved in Lipoprotein metabolism |
| 1.4 | 24.5 | REACTOME ETHANOL OXIDATION | Genes involved in Ethanol oxidation |
| 1.3 | 22.1 | REACTOME PASSIVE TRANSPORT BY AQUAPORINS | Genes involved in Passive Transport by Aquaporins |
| 1.3 | 30.0 | REACTOME AMINE DERIVED HORMONES | Genes involved in Amine-derived hormones |
| 1.1 | 113.7 | REACTOME PHASE II CONJUGATION | Genes involved in Phase II conjugation |
| 0.9 | 45.9 | REACTOME ABC FAMILY PROTEINS MEDIATED TRANSPORT | Genes involved in ABC-family proteins mediated transport |
| 0.8 | 14.4 | REACTOME FGFR LIGAND BINDING AND ACTIVATION | Genes involved in FGFR ligand binding and activation |
| 0.8 | 15.8 | REACTOME SYNTHESIS SECRETION AND INACTIVATION OF GIP | Genes involved in Synthesis, Secretion, and Inactivation of Glucose-dependent Insulinotropic Polypeptide (GIP) |
| 0.7 | 31.6 | REACTOME REGULATION OF GLUCOKINASE BY GLUCOKINASE REGULATORY PROTEIN | Genes involved in Regulation of Glucokinase by Glucokinase Regulatory Protein |
| 0.7 | 111.6 | REACTOME RESPONSE TO ELEVATED PLATELET CYTOSOLIC CA2 | Genes involved in Response to elevated platelet cytosolic Ca2+ |
| 0.6 | 7.9 | REACTOME MRNA DECAY BY 3 TO 5 EXORIBONUCLEASE | Genes involved in mRNA Decay by 3' to 5' Exoribonuclease |
| 0.5 | 27.3 | REACTOME INHIBITION OF VOLTAGE GATED CA2 CHANNELS VIA GBETA GAMMA SUBUNITS | Genes involved in Inhibition of voltage gated Ca2+ channels via Gbeta/gamma subunits |
| 0.5 | 8.8 | REACTOME REVERSIBLE HYDRATION OF CARBON DIOXIDE | Genes involved in Reversible Hydration of Carbon Dioxide |
| 0.4 | 27.8 | REACTOME ION TRANSPORT BY P TYPE ATPASES | Genes involved in Ion transport by P-type ATPases |
| 0.4 | 19.0 | REACTOME TIGHT JUNCTION INTERACTIONS | Genes involved in Tight junction interactions |
| 0.4 | 8.0 | REACTOME BILE SALT AND ORGANIC ANION SLC TRANSPORTERS | Genes involved in Bile salt and organic anion SLC transporters |
| 0.2 | 67.7 | REACTOME METABOLISM OF AMINO ACIDS AND DERIVATIVES | Genes involved in Metabolism of amino acids and derivatives |
| 0.2 | 17.8 | REACTOME METABOLISM OF VITAMINS AND COFACTORS | Genes involved in Metabolism of vitamins and cofactors |
| 0.2 | 33.8 | REACTOME PPARA ACTIVATES GENE EXPRESSION | Genes involved in PPARA Activates Gene Expression |
| 0.2 | 4.8 | REACTOME SYNTHESIS OF PIPS AT THE GOLGI MEMBRANE | Genes involved in Synthesis of PIPs at the Golgi membrane |
| 0.1 | 24.5 | REACTOME MRNA PROCESSING | Genes involved in mRNA Processing |
| 0.1 | 21.0 | REACTOME TRANSPORT OF INORGANIC CATIONS ANIONS AND AMINO ACIDS OLIGOPEPTIDES | Genes involved in Transport of inorganic cations/anions and amino acids/oligopeptides |
| 0.1 | 1.6 | REACTOME NA CL DEPENDENT NEUROTRANSMITTER TRANSPORTERS | Genes involved in Na+/Cl- dependent neurotransmitter transporters |
| 0.0 | 3.6 | REACTOME TRANSPORT OF GLUCOSE AND OTHER SUGARS BILE SALTS AND ORGANIC ACIDS METAL IONS AND AMINE COMPOUNDS | Genes involved in Transport of glucose and other sugars, bile salts and organic acids, metal ions and amine compounds |
| 0.0 | 1.1 | REACTOME PROLACTIN RECEPTOR SIGNALING | Genes involved in Prolactin receptor signaling |
| 0.0 | 0.7 | REACTOME SYNTHESIS OF PE | Genes involved in Synthesis of PE |
| 0.0 | 1.2 | REACTOME SPHINGOLIPID DE NOVO BIOSYNTHESIS | Genes involved in Sphingolipid de novo biosynthesis |
| 0.0 | 2.2 | REACTOME G ALPHA S SIGNALLING EVENTS | Genes involved in G alpha (s) signalling events |