Project
Illumina Body Map 2 (GSE30611)
Navigation
Downloads
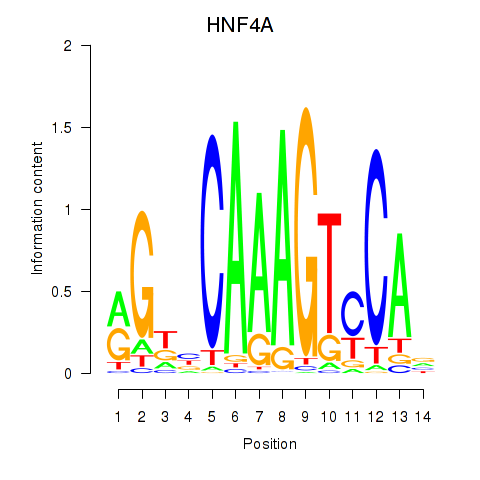
Results for HNF4A
Z-value: 3.95
Motif logo
Transcription factors associated with HNF4A
| Gene Symbol | Gene ID | Gene Info |
|---|---|---|
|
HNF4A
|
ENSG00000101076.18 | hepatocyte nuclear factor 4 alpha |
Activity-expression correlation:
| Gene | Promoter | Pearson corr. coef. | P-value | Plot |
|---|---|---|---|---|
| HNF4A | hg38_v1_chr20_+_44401269_44401301 | 0.93 | 1.2e-14 | Click! |
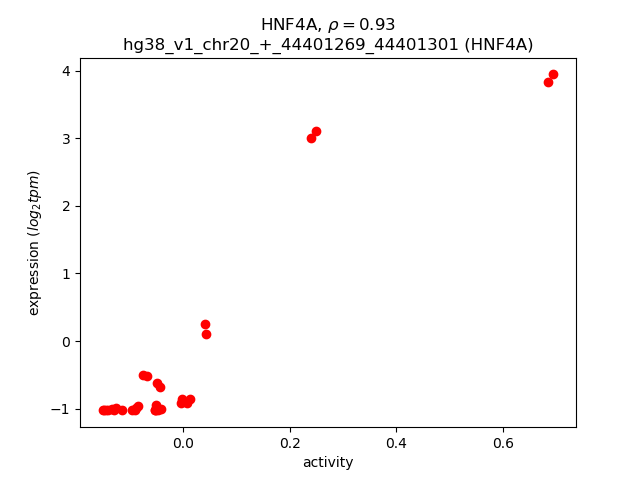
Activity profile of HNF4A motif
Sorted Z-values of HNF4A motif
| Promoter | Log-likelihood | Transcript | Gene | Gene Info |
|---|---|---|---|---|
| chr9_-_101442403 | 32.54 |
ENST00000648758.1
|
ALDOB
|
aldolase, fructose-bisphosphate B |
| chr10_+_94938649 | 29.04 |
ENST00000461906.1
ENST00000260682.8 |
CYP2C9
|
cytochrome P450 family 2 subfamily C member 9 |
| chr10_-_95069489 | 27.90 |
ENST00000371270.6
ENST00000535898.5 ENST00000623108.3 |
CYP2C8
|
cytochrome P450 family 2 subfamily C member 8 |
| chr9_+_136945234 | 26.11 |
ENST00000371634.7
|
C8G
|
complement C8 gamma chain |
| chr20_+_57561103 | 25.98 |
ENST00000319441.6
|
PCK1
|
phosphoenolpyruvate carboxykinase 1 |
| chr3_-_42875871 | 25.79 |
ENST00000316161.6
ENST00000437102.1 |
CYP8B1
|
cytochrome P450 family 8 subfamily B member 1 |
| chr17_+_42900791 | 25.13 |
ENST00000592383.5
ENST00000253801.7 ENST00000585489.1 |
G6PC1
|
glucose-6-phosphatase catalytic subunit 1 |
| chr10_-_127892930 | 24.97 |
ENST00000368671.4
|
CLRN3
|
clarin 3 |
| chr9_-_101442372 | 24.62 |
ENST00000648423.1
|
ALDOB
|
aldolase, fructose-bisphosphate B |
| chr17_+_29043124 | 24.15 |
ENST00000323372.9
|
PIPOX
|
pipecolic acid and sarcosine oxidase |
| chr17_+_4771878 | 23.63 |
ENST00000270560.4
|
TM4SF5
|
transmembrane 4 L six family member 5 |
| chr6_+_31946086 | 23.37 |
ENST00000425368.7
|
CFB
|
complement factor B |
| chr1_-_161223559 | 23.09 |
ENST00000469730.2
ENST00000463273.5 ENST00000464492.5 ENST00000367990.7 ENST00000470459.6 ENST00000463812.1 ENST00000468465.5 |
APOA2
|
apolipoprotein A2 |
| chr3_-_120682215 | 22.47 |
ENST00000283871.10
|
HGD
|
homogentisate 1,2-dioxygenase |
| chr5_-_35047935 | 22.46 |
ENST00000510428.1
ENST00000231420.11 |
AGXT2
|
alanine--glyoxylate aminotransferase 2 |
| chr19_+_44946043 | 21.81 |
ENST00000252490.7
ENST00000591597.5 |
APOC2
|
apolipoprotein C2 |
| chr19_+_44946009 | 21.44 |
ENST00000592257.5
|
APOC2
|
apolipoprotein C2 |
| chr17_-_7179348 | 21.37 |
ENST00000573083.1
ENST00000574388.5 ENST00000269299.8 |
ASGR1
|
asialoglycoprotein receptor 1 |
| chr11_-_116823293 | 20.66 |
ENST00000357780.5
|
APOA4
|
apolipoprotein A4 |
| chr12_+_55681711 | 20.19 |
ENST00000394252.4
|
METTL7B
|
methyltransferase like 7B |
| chr1_-_145707345 | 19.68 |
ENST00000417171.6
|
PDZK1
|
PDZ domain containing 1 |
| chr17_-_7179544 | 19.27 |
ENST00000619926.4
|
ASGR1
|
asialoglycoprotein receptor 1 |
| chr12_+_55681647 | 18.94 |
ENST00000614691.1
|
METTL7B
|
methyltransferase like 7B |
| chr1_-_145707387 | 18.85 |
ENST00000451928.6
|
PDZK1
|
PDZ domain containing 1 |
| chr3_-_120682113 | 18.84 |
ENST00000476082.2
|
HGD
|
homogentisate 1,2-dioxygenase |
| chr1_-_15585015 | 18.74 |
ENST00000375826.4
|
AGMAT
|
agmatinase |
| chr3_-_194351290 | 18.50 |
ENST00000429275.1
ENST00000323830.4 |
CPN2
|
carboxypeptidase N subunit 2 |
| chr20_-_7940444 | 18.11 |
ENST00000378789.4
|
HAO1
|
hydroxyacid oxidase 1 |
| chr6_+_43298254 | 17.94 |
ENST00000372585.10
ENST00000449231.5 ENST00000372589.7 |
SLC22A7
|
solute carrier family 22 member 7 |
| chr10_+_94683722 | 17.70 |
ENST00000285979.11
|
CYP2C18
|
cytochrome P450 family 2 subfamily C member 18 |
| chr10_+_94762673 | 17.68 |
ENST00000480405.2
ENST00000371321.9 |
CYP2C19
|
cytochrome P450 family 2 subfamily C member 19 |
| chr6_+_130827398 | 17.23 |
ENST00000541421.2
|
SMLR1
|
small leucine rich protein 1 |
| chr6_+_31982057 | 17.08 |
ENST00000428956.7
ENST00000498271.1 |
C4A
|
complement C4A (Rodgers blood group) |
| chr6_+_32014795 | 16.46 |
ENST00000435363.7
ENST00000425700.3 |
C4B
|
complement C4B (Chido blood group) |
| chr10_+_94683771 | 15.82 |
ENST00000339022.6
|
CYP2C18
|
cytochrome P450 family 2 subfamily C member 18 |
| chr1_-_161223408 | 15.63 |
ENST00000491350.1
|
APOA2
|
apolipoprotein A2 |
| chr19_-_38812936 | 15.50 |
ENST00000307751.9
ENST00000594209.1 |
LGALS4
|
galectin 4 |
| chr1_-_146021724 | 15.09 |
ENST00000475797.1
ENST00000497365.5 ENST00000336751.11 ENST00000634927.1 ENST00000421822.2 |
HJV
|
hemojuvelin BMP co-receptor |
| chr1_-_177969907 | 14.76 |
ENST00000308284.10
|
SEC16B
|
SEC16 homolog B, endoplasmic reticulum export factor |
| chr19_-_58511981 | 14.38 |
ENST00000263093.7
ENST00000601355.1 |
SLC27A5
|
solute carrier family 27 member 5 |
| chr16_-_16223467 | 14.37 |
ENST00000575728.1
ENST00000574094.6 ENST00000205557.12 |
ABCC6
|
ATP binding cassette subfamily C member 6 |
| chr13_+_113105782 | 14.21 |
ENST00000541084.5
ENST00000346342.8 ENST00000375581.3 |
F7
|
coagulation factor VII |
| chr17_-_37745018 | 14.21 |
ENST00000613727.4
ENST00000614313.4 ENST00000617811.5 ENST00000621123.4 |
HNF1B
|
HNF1 homeobox B |
| chr16_+_8674605 | 13.51 |
ENST00000268251.13
|
ABAT
|
4-aminobutyrate aminotransferase |
| chr3_+_46497970 | 12.93 |
ENST00000296142.4
|
RTP3
|
receptor transporter protein 3 |
| chr17_+_1742836 | 12.92 |
ENST00000324015.7
ENST00000450523.6 ENST00000453723.5 ENST00000453066.6 ENST00000382061.5 |
SERPINF2
|
serpin family F member 2 |
| chr3_+_119782094 | 12.76 |
ENST00000393716.8
|
NR1I2
|
nuclear receptor subfamily 1 group I member 2 |
| chr2_+_44275491 | 12.66 |
ENST00000410056.7
ENST00000409741.5 ENST00000409229.7 |
SLC3A1
|
solute carrier family 3 member 1 |
| chr1_-_161238085 | 12.44 |
ENST00000512372.5
ENST00000437437.6 ENST00000412844.6 ENST00000428574.6 ENST00000442691.6 ENST00000505005.5 ENST00000508740.5 ENST00000367981.7 ENST00000502985.5 ENST00000504010.5 ENST00000508387.5 ENST00000511676.5 ENST00000511748.5 ENST00000511944.5 ENST00000515621.5 ENST00000367984.8 ENST00000367985.7 |
NR1I3
|
nuclear receptor subfamily 1 group I member 3 |
| chr1_-_155301423 | 12.18 |
ENST00000342741.6
|
PKLR
|
pyruvate kinase L/R |
| chr19_-_14062028 | 11.98 |
ENST00000669674.2
|
PALM3
|
paralemmin 3 |
| chr9_-_133739920 | 11.87 |
ENST00000371872.8
ENST00000298628.6 |
SARDH
|
sarcosine dehydrogenase |
| chr7_+_45888479 | 11.77 |
ENST00000275525.8
ENST00000468955.1 |
IGFBP1
|
insulin like growth factor binding protein 1 |
| chr2_+_44275457 | 11.73 |
ENST00000611973.4
ENST00000409387.5 |
SLC3A1
|
solute carrier family 3 member 1 |
| chr1_+_196888014 | 11.35 |
ENST00000367416.6
ENST00000608469.6 ENST00000251424.8 ENST00000367418.2 |
CFHR4
|
complement factor H related 4 |
| chr12_+_57454674 | 11.13 |
ENST00000547970.1
|
INHBE
|
inhibin subunit beta E |
| chr6_+_30163541 | 10.97 |
ENST00000376694.9
|
TRIM15
|
tripartite motif containing 15 |
| chr12_+_108880085 | 10.85 |
ENST00000228476.8
ENST00000547768.5 |
DAO
|
D-amino acid oxidase |
| chr19_-_35812838 | 10.68 |
ENST00000653904.2
|
PRODH2
|
proline dehydrogenase 2 |
| chr1_-_155300979 | 10.68 |
ENST00000392414.7
|
PKLR
|
pyruvate kinase L/R |
| chr22_-_42130800 | 10.63 |
ENST00000645361.2
ENST00000359033.4 |
CYP2D6
|
cytochrome P450 family 2 subfamily D member 6 |
| chr2_-_27890348 | 10.38 |
ENST00000302188.8
|
RBKS
|
ribokinase |
| chr19_+_15641280 | 9.61 |
ENST00000585846.1
|
CYP4F3
|
cytochrome P450 family 4 subfamily F member 3 |
| chrX_+_38352573 | 9.57 |
ENST00000039007.5
|
OTC
|
ornithine transcarbamylase |
| chr16_+_29679132 | 9.49 |
ENST00000395384.9
ENST00000562473.1 |
QPRT
|
quinolinate phosphoribosyltransferase |
| chr2_-_21043941 | 9.49 |
ENST00000399256.4
|
APOB
|
apolipoprotein B |
| chr11_+_63369779 | 9.35 |
ENST00000279178.4
|
SLC22A9
|
solute carrier family 22 member 9 |
| chr7_+_45888360 | 9.20 |
ENST00000457280.5
|
IGFBP1
|
insulin like growth factor binding protein 1 |
| chr19_+_44613558 | 9.04 |
ENST00000402988.6
|
IGSF23
|
immunoglobulin superfamily member 23 |
| chr12_+_120978686 | 9.00 |
ENST00000541395.5
ENST00000544413.2 |
HNF1A
|
HNF1 homeobox A |
| chr19_+_7595830 | 8.96 |
ENST00000160298.9
ENST00000446248.4 |
CAMSAP3
|
calmodulin regulated spectrin associated protein family member 3 |
| chr2_-_31414694 | 8.62 |
ENST00000379416.4
|
XDH
|
xanthine dehydrogenase |
| chr5_-_42811884 | 8.59 |
ENST00000514985.6
ENST00000511224.5 ENST00000507920.5 ENST00000510965.1 |
SELENOP
|
selenoprotein P |
| chr7_-_15561986 | 8.52 |
ENST00000342526.8
|
AGMO
|
alkylglycerol monooxygenase |
| chr17_+_4788926 | 8.35 |
ENST00000331264.8
|
GLTPD2
|
glycolipid transfer protein domain containing 2 |
| chr6_+_43298326 | 8.22 |
ENST00000372574.7
|
SLC22A7
|
solute carrier family 22 member 7 |
| chr1_-_161238196 | 8.07 |
ENST00000367983.9
ENST00000506209.5 ENST00000367980.6 ENST00000628566.2 |
NR1I3
|
nuclear receptor subfamily 1 group I member 3 |
| chr6_+_30163188 | 8.00 |
ENST00000619857.4
|
TRIM15
|
tripartite motif containing 15 |
| chr4_-_87322845 | 7.89 |
ENST00000328546.5
ENST00000302219.10 |
HSD17B13
|
hydroxysteroid 17-beta dehydrogenase 13 |
| chr19_+_41088450 | 7.88 |
ENST00000330436.4
|
CYP2A13
|
cytochrome P450 family 2 subfamily A member 13 |
| chr7_-_87475839 | 7.57 |
ENST00000359206.8
|
ABCB4
|
ATP binding cassette subfamily B member 4 |
| chr12_+_120978537 | 7.46 |
ENST00000257555.11
ENST00000400024.6 |
HNF1A
|
HNF1 homeobox A |
| chr1_-_201399525 | 7.41 |
ENST00000367313.4
|
LAD1
|
ladinin 1 |
| chr5_+_90899183 | 7.32 |
ENST00000640815.1
|
ADGRV1
|
adhesion G protein-coupled receptor V1 |
| chr14_+_102922639 | 7.24 |
ENST00000299155.10
|
AMN
|
amnion associated transmembrane protein |
| chr11_+_27055215 | 7.24 |
ENST00000525090.1
|
BBOX1
|
gamma-butyrobetaine hydroxylase 1 |
| chr3_+_46877705 | 6.73 |
ENST00000449590.6
|
PTH1R
|
parathyroid hormone 1 receptor |
| chr1_-_197067234 | 6.71 |
ENST00000367412.2
|
F13B
|
coagulation factor XIII B chain |
| chr2_-_42792558 | 6.71 |
ENST00000431905.1
ENST00000294973.11 |
HAAO
|
3-hydroxyanthranilate 3,4-dioxygenase |
| chr7_-_87475647 | 6.50 |
ENST00000649586.2
ENST00000265723.8 |
ABCB4
|
ATP binding cassette subfamily B member 4 |
| chr1_-_177970213 | 6.49 |
ENST00000464631.6
|
SEC16B
|
SEC16 homolog B, endoplasmic reticulum export factor |
| chr1_-_161238223 | 6.39 |
ENST00000515452.1
|
NR1I3
|
nuclear receptor subfamily 1 group I member 3 |
| chr16_+_8674584 | 6.29 |
ENST00000564714.5
|
ABAT
|
4-aminobutyrate aminotransferase |
| chr1_+_6448022 | 6.26 |
ENST00000416731.5
ENST00000461727.6 |
ESPN
|
espin |
| chr3_-_187291680 | 6.17 |
ENST00000425937.1
ENST00000337774.10 ENST00000296280.11 |
MASP1
|
mannan binding lectin serine peptidase 1 |
| chr1_+_94418375 | 6.03 |
ENST00000370214.9
|
ABCD3
|
ATP binding cassette subfamily D member 3 |
| chr17_+_28744034 | 5.99 |
ENST00000444415.7
ENST00000262396.10 |
TRAF4
|
TNF receptor associated factor 4 |
| chr11_-_63229652 | 5.72 |
ENST00000306494.10
|
SLC22A25
|
solute carrier family 22 member 25 |
| chr5_+_177384430 | 5.64 |
ENST00000512593.5
ENST00000324417.6 |
SLC34A1
|
solute carrier family 34 member 1 |
| chr1_+_94418435 | 5.57 |
ENST00000647998.2
|
ABCD3
|
ATP binding cassette subfamily D member 3 |
| chr11_-_66718817 | 5.49 |
ENST00000617502.5
|
SPTBN2
|
spectrin beta, non-erythrocytic 2 |
| chr17_-_46818680 | 5.41 |
ENST00000225512.6
|
WNT3
|
Wnt family member 3 |
| chr3_-_53844617 | 5.37 |
ENST00000481668.5
ENST00000467802.1 |
CHDH
|
choline dehydrogenase |
| chr16_-_87936529 | 5.37 |
ENST00000649794.3
ENST00000649158.1 ENST00000648177.1 |
CA5A
|
carbonic anhydrase 5A |
| chr17_+_79730937 | 5.30 |
ENST00000328313.10
|
ENPP7
|
ectonucleotide pyrophosphatase/phosphodiesterase 7 |
| chr2_-_46462 | 5.20 |
ENST00000327669.5
|
FAM110C
|
family with sequence similarity 110 member C |
| chr13_+_113122791 | 5.15 |
ENST00000375559.8
ENST00000409306.5 ENST00000375551.7 |
F10
|
coagulation factor X |
| chr2_+_44275473 | 5.12 |
ENST00000260649.11
|
SLC3A1
|
solute carrier family 3 member 1 |
| chr1_+_78045956 | 5.09 |
ENST00000370759.4
|
GIPC2
|
GIPC PDZ domain containing family member 2 |
| chr19_+_10086305 | 4.98 |
ENST00000253110.16
ENST00000591813.5 |
SHFL
|
shiftless antiviral inhibitor of ribosomal frameshifting |
| chr16_+_21233672 | 4.95 |
ENST00000311620.7
|
ANKS4B
|
ankyrin repeat and sterile alpha motif domain containing 4B |
| chr1_-_161238163 | 4.92 |
ENST00000367982.8
|
NR1I3
|
nuclear receptor subfamily 1 group I member 3 |
| chr1_-_23800402 | 4.91 |
ENST00000374497.7
ENST00000425913.5 |
GALE
|
UDP-galactose-4-epimerase |
| chr10_+_100347225 | 4.84 |
ENST00000370355.3
|
SCD
|
stearoyl-CoA desaturase |
| chr3_-_187291882 | 4.81 |
ENST00000392470.6
ENST00000169293.10 ENST00000439271.1 ENST00000392472.6 ENST00000392475.2 |
MASP1
|
mannan binding lectin serine peptidase 1 |
| chr22_+_24607658 | 4.76 |
ENST00000451366.5
ENST00000428855.5 |
GGT1
|
gamma-glutamyltransferase 1 |
| chr1_-_23800745 | 4.69 |
ENST00000617979.5
ENST00000418277.5 |
GALE
|
UDP-galactose-4-epimerase |
| chr2_+_119679154 | 4.60 |
ENST00000401466.5
ENST00000424086.5 |
TMEM177
|
transmembrane protein 177 |
| chr4_-_10021490 | 4.57 |
ENST00000264784.8
|
SLC2A9
|
solute carrier family 2 member 9 |
| chr14_+_39267055 | 4.52 |
ENST00000396158.6
ENST00000280083.7 ENST00000341502.9 |
MIA2
|
MIA SH3 domain ER export factor 2 |
| chr8_-_81695045 | 4.49 |
ENST00000518568.3
|
SLC10A5
|
solute carrier family 10 member 5 |
| chr11_+_75159780 | 4.20 |
ENST00000525845.5
ENST00000534186.5 ENST00000428359.6 |
SLCO2B1
|
solute carrier organic anion transporter family member 2B1 |
| chr1_+_94418467 | 4.18 |
ENST00000315713.5
|
ABCD3
|
ATP binding cassette subfamily D member 3 |
| chr1_+_200027702 | 4.17 |
ENST00000367362.8
|
NR5A2
|
nuclear receptor subfamily 5 group A member 2 |
| chr3_-_124934735 | 4.17 |
ENST00000478191.1
ENST00000616727.4 |
MUC13
|
mucin 13, cell surface associated |
| chr2_+_119679184 | 4.15 |
ENST00000445518.1
ENST00000272521.7 ENST00000409951.1 |
TMEM177
|
transmembrane protein 177 |
| chr1_-_201399906 | 4.01 |
ENST00000631576.1
|
LAD1
|
ladinin 1 |
| chr1_-_155300933 | 3.87 |
ENST00000434082.3
|
PKLR
|
pyruvate kinase L/R |
| chr2_+_218270392 | 3.85 |
ENST00000248451.7
ENST00000273077.9 |
PNKD
|
PNKD metallo-beta-lactamase domain containing |
| chr20_+_38033719 | 3.50 |
ENST00000373433.9
|
RPRD1B
|
regulation of nuclear pre-mRNA domain containing 1B |
| chr19_+_10086787 | 3.49 |
ENST00000590378.5
ENST00000397881.7 |
SHFL
|
shiftless antiviral inhibitor of ribosomal frameshifting |
| chrX_+_118974608 | 3.45 |
ENST00000304778.11
ENST00000371628.8 |
LONRF3
|
LON peptidase N-terminal domain and ring finger 3 |
| chr17_-_49709014 | 3.41 |
ENST00000511657.1
|
SLC35B1
|
solute carrier family 35 member B1 |
| chr14_+_38207893 | 3.37 |
ENST00000267377.3
|
SSTR1
|
somatostatin receptor 1 |
| chrX_-_43882411 | 3.28 |
ENST00000378069.5
|
MAOB
|
monoamine oxidase B |
| chr1_+_241532121 | 3.18 |
ENST00000366558.7
|
KMO
|
kynurenine 3-monooxygenase |
| chr1_+_200027605 | 3.15 |
ENST00000236914.7
|
NR5A2
|
nuclear receptor subfamily 5 group A member 2 |
| chr11_+_119185469 | 3.10 |
ENST00000525131.5
ENST00000355547.10 ENST00000531114.5 ENST00000322712.4 |
PDZD3
|
PDZ domain containing 3 |
| chr17_-_17591658 | 3.02 |
ENST00000435340.6
ENST00000255389.10 ENST00000395781.6 |
PEMT
|
phosphatidylethanolamine N-methyltransferase |
| chr22_+_24607638 | 3.00 |
ENST00000432867.5
|
GGT1
|
gamma-glutamyltransferase 1 |
| chr1_+_6447331 | 2.98 |
ENST00000632803.1
ENST00000632593.1 |
ESPN
|
espin |
| chr9_-_113303271 | 2.93 |
ENST00000297894.5
ENST00000489339.2 |
RNF183
|
ring finger protein 183 |
| chr12_-_7018465 | 2.92 |
ENST00000261407.9
|
LPCAT3
|
lysophosphatidylcholine acyltransferase 3 |
| chr22_+_24607602 | 2.89 |
ENST00000447416.5
|
GGT1
|
gamma-glutamyltransferase 1 |
| chr1_+_241532370 | 2.88 |
ENST00000366559.9
ENST00000366557.8 |
KMO
|
kynurenine 3-monooxygenase |
| chr16_-_57480366 | 2.78 |
ENST00000562008.5
ENST00000567214.5 |
DOK4
|
docking protein 4 |
| chr5_+_73173186 | 2.72 |
ENST00000296776.6
|
TMEM174
|
transmembrane protein 174 |
| chr1_-_43285559 | 2.70 |
ENST00000523677.6
|
C1orf210
|
chromosome 1 open reading frame 210 |
| chr14_-_22976812 | 2.55 |
ENST00000553592.5
|
AJUBA
|
ajuba LIM protein |
| chr17_-_2711633 | 2.50 |
ENST00000435359.5
|
CLUH
|
clustered mitochondria homolog |
| chr15_-_40828699 | 2.44 |
ENST00000299174.10
ENST00000427255.2 |
PPP1R14D
|
protein phosphatase 1 regulatory inhibitor subunit 14D |
| chr11_-_63768641 | 2.42 |
ENST00000546282.3
|
C11orf95
|
chromosome 11 open reading frame 95 |
| chr19_-_35852495 | 2.38 |
ENST00000378910.10
|
NPHS1
|
NPHS1 adhesion molecule, nephrin |
| chr7_+_100949525 | 2.15 |
ENST00000379458.9
ENST00000483366.5 |
MUC3A
|
mucin 3A, cell surface associated |
| chr7_-_47581631 | 2.08 |
ENST00000434451.1
|
TNS3
|
tensin 3 |
| chr7_-_126533850 | 1.98 |
ENST00000444921.3
|
GRM8
|
glutamate metabotropic receptor 8 |
| chr13_+_75760431 | 1.87 |
ENST00000321797.12
|
LMO7
|
LIM domain 7 |
| chr1_-_43285606 | 1.86 |
ENST00000423420.1
|
C1orf210
|
chromosome 1 open reading frame 210 |
| chr13_+_75760659 | 1.78 |
ENST00000526202.5
ENST00000465261.6 |
LMO7
|
LIM domain 7 |
| chr17_-_3636239 | 1.77 |
ENST00000225519.5
|
SHPK
|
sedoheptulokinase |
| chr22_+_37024137 | 1.73 |
ENST00000628507.1
|
MPST
|
mercaptopyruvate sulfurtransferase |
| chr1_+_112674722 | 1.65 |
ENST00000357443.2
|
MOV10
|
Mov10 RISC complex RNA helicase |
| chr8_+_95024977 | 1.58 |
ENST00000396124.9
|
NDUFAF6
|
NADH:ubiquinone oxidoreductase complex assembly factor 6 |
| chr1_+_112674416 | 1.57 |
ENST00000413052.6
ENST00000369645.5 |
MOV10
|
Mov10 RISC complex RNA helicase |
| chr2_-_158456702 | 1.55 |
ENST00000409889.1
ENST00000283233.10 |
CCDC148
|
coiled-coil domain containing 148 |
| chr17_-_2711736 | 1.53 |
ENST00000651024.2
ENST00000576885.5 ENST00000574426.7 |
CLUH
|
clustered mitochondria homolog |
| chr12_+_53103479 | 1.49 |
ENST00000301466.8
ENST00000551896.5 |
SOAT2
|
sterol O-acyltransferase 2 |
| chr9_-_68540879 | 1.48 |
ENST00000377311.4
|
TMEM252
|
transmembrane protein 252 |
| chr20_+_59300547 | 1.43 |
ENST00000644821.1
|
EDN3
|
endothelin 3 |
| chr2_-_62506136 | 1.42 |
ENST00000335390.6
|
TMEM17
|
transmembrane protein 17 |
| chr15_+_21651844 | 1.40 |
ENST00000623441.1
|
OR4N4C
|
olfactory receptor family 4 subfamily N member 4C |
| chr19_-_48364034 | 1.36 |
ENST00000435956.7
|
TMEM143
|
transmembrane protein 143 |
| chr5_-_16508990 | 1.34 |
ENST00000399793.6
|
RETREG1
|
reticulophagy regulator 1 |
| chr19_-_48363914 | 1.32 |
ENST00000377431.6
ENST00000293261.8 |
TMEM143
|
transmembrane protein 143 |
| chr1_+_112674649 | 1.31 |
ENST00000369644.5
|
MOV10
|
Mov10 RISC complex RNA helicase |
| chr13_-_52011337 | 1.24 |
ENST00000400366.6
ENST00000400370.8 ENST00000634844.1 ENST00000673772.1 ENST00000418097.7 ENST00000242839.10 ENST00000344297.9 ENST00000448424.7 |
ATP7B
|
ATPase copper transporting beta |
| chr15_+_22094522 | 1.22 |
ENST00000328795.5
|
OR4N4
|
olfactory receptor family 4 subfamily N member 4 |
| chr6_+_30914329 | 1.11 |
ENST00000541562.6
|
VARS2
|
valyl-tRNA synthetase 2, mitochondrial |
| chr15_+_100602519 | 1.09 |
ENST00000332783.12
ENST00000558747.5 ENST00000343276.4 |
ASB7
|
ankyrin repeat and SOCS box containing 7 |
| chr5_-_16508788 | 1.03 |
ENST00000682142.1
|
RETREG1
|
reticulophagy regulator 1 |
| chr19_+_35138993 | 1.01 |
ENST00000612146.4
ENST00000589209.5 |
FXYD1
|
FXYD domain containing ion transport regulator 1 |
| chr19_+_751104 | 1.00 |
ENST00000215582.8
|
MISP
|
mitotic spindle positioning |
| chr14_-_22976793 | 0.98 |
ENST00000553911.1
|
AJUBA
|
ajuba LIM protein |
| chr8_-_78804928 | 0.96 |
ENST00000520269.5
|
IL7
|
interleukin 7 |
| chr7_-_78771108 | 0.89 |
ENST00000626691.2
|
MAGI2
|
membrane associated guanylate kinase, WW and PDZ domain containing 2 |
| chr11_-_65614195 | 0.89 |
ENST00000309100.8
ENST00000529839.1 ENST00000526293.1 |
MAP3K11
|
mitogen-activated protein kinase kinase kinase 11 |
| chr19_+_35371290 | 0.88 |
ENST00000597214.1
|
GPR42
|
G protein-coupled receptor 42 |
| chr6_+_79631322 | 0.87 |
ENST00000369838.6
|
SH3BGRL2
|
SH3 domain binding glutamate rich protein like 2 |
| chr19_+_4639505 | 0.81 |
ENST00000327473.9
|
TNFAIP8L1
|
TNF alpha induced protein 8 like 1 |
| chr7_-_78771058 | 0.79 |
ENST00000628781.1
|
MAGI2
|
membrane associated guanylate kinase, WW and PDZ domain containing 2 |
| chr16_+_83998252 | 0.78 |
ENST00000564166.1
|
NECAB2
|
N-terminal EF-hand calcium binding protein 2 |
| chr20_+_59300703 | 0.76 |
ENST00000395654.3
|
EDN3
|
endothelin 3 |
| chr7_-_78770859 | 0.74 |
ENST00000636717.1
|
MAGI2
|
membrane associated guanylate kinase, WW and PDZ domain containing 2 |
| chr6_+_30914205 | 0.74 |
ENST00000672801.1
ENST00000321897.9 ENST00000625423.2 ENST00000676266.1 ENST00000428017.5 |
VARS2
|
valyl-tRNA synthetase 2, mitochondrial |
| chr8_+_11982251 | 0.74 |
ENST00000382208.3
|
DEFB135
|
defensin beta 135 |
| chr1_+_44808482 | 0.73 |
ENST00000450269.5
ENST00000409335.6 |
BTBD19
|
BTB domain containing 19 |
| chr8_+_103819244 | 0.71 |
ENST00000262231.14
ENST00000507740.5 ENST00000408894.6 |
RIMS2
|
regulating synaptic membrane exocytosis 2 |
| chr16_+_66844914 | 0.68 |
ENST00000394069.3
|
CA7
|
carbonic anhydrase 7 |
| chr20_-_3663399 | 0.67 |
ENST00000290417.7
ENST00000319242.8 |
GFRA4
|
GDNF family receptor alpha 4 |
| chr1_+_20633450 | 0.63 |
ENST00000321556.5
|
PINK1
|
PTEN induced kinase 1 |
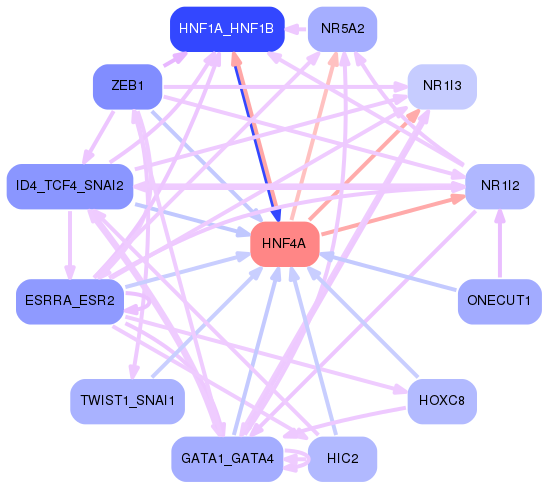
Network of associatons between targets according to the STRING database.

First level regulatory network of HNF4A
Gene Ontology Analysis
Gene overrepresentation in biological process category:
| Log-likelihood per target | Total log-likelihood | Term | Description |
|---|---|---|---|
| 10.8 | 43.2 | GO:0010902 | positive regulation of very-low-density lipoprotein particle remodeling(GO:0010902) |
| 10.2 | 30.7 | GO:0035565 | regulation of pronephros size(GO:0035565) |
| 9.7 | 38.7 | GO:2000910 | negative regulation of cholesterol import(GO:0060621) negative regulation of sterol import(GO:2000910) |
| 8.7 | 26.0 | GO:0061402 | positive regulation of transcription from RNA polymerase II promoter in response to acidic pH(GO:0061402) |
| 8.2 | 57.4 | GO:0016098 | monoterpenoid metabolic process(GO:0016098) |
| 6.3 | 19.0 | GO:1901253 | negative regulation of intracellular transport of viral material(GO:1901253) |
| 5.7 | 57.2 | GO:0006001 | fructose catabolic process(GO:0006001) fructose catabolic process to hydroxyacetone phosphate and glyceraldehyde-3-phosphate(GO:0061624) |
| 5.6 | 22.5 | GO:0009436 | glyoxylate catabolic process(GO:0009436) |
| 5.6 | 27.9 | GO:0002933 | lipid hydroxylation(GO:0002933) |
| 5.2 | 20.7 | GO:0034445 | regulation of plasma lipoprotein particle oxidation(GO:0034444) negative regulation of plasma lipoprotein particle oxidation(GO:0034445) |
| 4.8 | 9.6 | GO:0036101 | leukotriene catabolic process(GO:0036100) leukotriene B4 catabolic process(GO:0036101) leukotriene B4 metabolic process(GO:0036102) icosanoid catabolic process(GO:1901523) fatty acid derivative catabolic process(GO:1901569) |
| 4.7 | 14.1 | GO:2001025 | response to cyclosporin A(GO:1905237) positive regulation of response to drug(GO:2001025) |
| 4.3 | 21.5 | GO:0006562 | proline catabolic process(GO:0006562) |
| 4.1 | 41.3 | GO:0006572 | tyrosine catabolic process(GO:0006572) |
| 4.0 | 24.2 | GO:0019477 | L-lysine catabolic process to acetyl-CoA(GO:0019474) L-lysine catabolic process(GO:0019477) L-lysine metabolic process(GO:0046440) |
| 4.0 | 11.9 | GO:1901052 | sarcosine metabolic process(GO:1901052) sarcosine catabolic process(GO:1901053) |
| 3.9 | 15.8 | GO:0015910 | peroxisomal long-chain fatty acid import(GO:0015910) |
| 3.5 | 10.4 | GO:0019303 | D-ribose catabolic process(GO:0019303) |
| 3.3 | 29.5 | GO:0015811 | L-cystine transport(GO:0015811) |
| 3.2 | 9.6 | GO:0097272 | ammonia homeostasis(GO:0097272) |
| 3.2 | 22.3 | GO:0046874 | quinolinate metabolic process(GO:0046874) |
| 3.1 | 18.7 | GO:1901162 | primary amino compound biosynthetic process(GO:1901162) |
| 3.0 | 26.7 | GO:0042866 | pyruvate biosynthetic process(GO:0042866) |
| 2.9 | 8.6 | GO:0046110 | xanthine metabolic process(GO:0046110) |
| 2.8 | 14.2 | GO:1905225 | response to thyrotropin-releasing hormone(GO:1905225) |
| 2.8 | 19.8 | GO:1904450 | negative regulation of gamma-aminobutyric acid secretion(GO:0014053) aspartate secretion(GO:0061528) regulation of aspartate secretion(GO:1904448) positive regulation of aspartate secretion(GO:1904450) |
| 2.7 | 23.9 | GO:0006642 | triglyceride mobilization(GO:0006642) |
| 2.5 | 49.5 | GO:0006957 | complement activation, alternative pathway(GO:0006957) |
| 2.4 | 33.5 | GO:2000427 | positive regulation of apoptotic cell clearance(GO:2000427) |
| 2.3 | 18.1 | GO:0009441 | glycolate metabolic process(GO:0009441) |
| 2.2 | 41.4 | GO:0019373 | epoxygenase P450 pathway(GO:0019373) |
| 2.1 | 12.8 | GO:0042738 | exogenous drug catabolic process(GO:0042738) |
| 1.9 | 5.6 | GO:0097187 | dentinogenesis(GO:0097187) regulation of sodium-dependent phosphate transport(GO:2000118) |
| 1.8 | 12.9 | GO:0010757 | negative regulation of plasminogen activation(GO:0010757) |
| 1.7 | 5.0 | GO:1904106 | protein localization to microvillus(GO:1904106) |
| 1.4 | 5.4 | GO:0060061 | Spemann organizer formation(GO:0060061) |
| 1.3 | 5.4 | GO:0019285 | glycine betaine biosynthetic process from choline(GO:0019285) glycine betaine metabolic process(GO:0031455) glycine betaine biosynthetic process(GO:0031456) |
| 1.3 | 3.8 | GO:0019243 | methylglyoxal catabolic process to D-lactate via S-lactoyl-glutathione(GO:0019243) methylglyoxal catabolic process(GO:0051596) methylglyoxal catabolic process to lactate(GO:0061727) |
| 1.3 | 21.3 | GO:0070863 | positive regulation of protein exit from endoplasmic reticulum(GO:0070863) |
| 1.2 | 8.5 | GO:0046485 | ether lipid metabolic process(GO:0046485) |
| 1.2 | 12.0 | GO:0008063 | Toll signaling pathway(GO:0008063) |
| 1.1 | 15.1 | GO:0015747 | urate transport(GO:0015747) |
| 1.0 | 38.5 | GO:0015879 | carnitine transport(GO:0015879) |
| 0.9 | 7.3 | GO:0061113 | pancreas morphogenesis(GO:0061113) |
| 0.9 | 9.0 | GO:0045218 | zonula adherens maintenance(GO:0045218) |
| 0.9 | 3.4 | GO:0015785 | UDP-galactose transport(GO:0015785) UDP-galactose transmembrane transport(GO:0072334) |
| 0.8 | 30.4 | GO:0043252 | sodium-independent organic anion transport(GO:0043252) |
| 0.8 | 3.3 | GO:0045964 | positive regulation of catecholamine metabolic process(GO:0045915) positive regulation of dopamine metabolic process(GO:0045964) |
| 0.8 | 10.7 | GO:0019344 | cysteine biosynthetic process(GO:0019344) |
| 0.7 | 3.4 | GO:0038169 | somatostatin receptor signaling pathway(GO:0038169) somatostatin signaling pathway(GO:0038170) |
| 0.6 | 0.6 | GO:0036482 | neuron intrinsic apoptotic signaling pathway in response to hydrogen peroxide(GO:0036482) positive regulation of mitochondrial electron transport, NADH to ubiquinone(GO:1902958) regulation of hydrogen peroxide-induced neuron intrinsic apoptotic signaling pathway(GO:1903383) negative regulation of hydrogen peroxide-induced neuron intrinsic apoptotic signaling pathway(GO:1903384) |
| 0.6 | 1.9 | GO:0006438 | valyl-tRNA aminoacylation(GO:0006438) |
| 0.6 | 8.6 | GO:0001887 | selenium compound metabolic process(GO:0001887) |
| 0.6 | 11.0 | GO:0001867 | complement activation, lectin pathway(GO:0001867) |
| 0.6 | 1.8 | GO:0035963 | cellular response to interleukin-13(GO:0035963) |
| 0.6 | 5.2 | GO:0007598 | blood coagulation, extrinsic pathway(GO:0007598) |
| 0.6 | 19.0 | GO:0043567 | regulation of insulin-like growth factor receptor signaling pathway(GO:0043567) |
| 0.6 | 7.2 | GO:0006578 | amino-acid betaine biosynthetic process(GO:0006578) carnitine biosynthetic process(GO:0045329) |
| 0.5 | 9.6 | GO:0019388 | galactose catabolic process(GO:0019388) |
| 0.5 | 9.2 | GO:0030046 | parallel actin filament bundle assembly(GO:0030046) |
| 0.4 | 26.0 | GO:0006699 | bile acid biosynthetic process(GO:0006699) |
| 0.4 | 3.5 | GO:0070940 | dephosphorylation of RNA polymerase II C-terminal domain(GO:0070940) |
| 0.4 | 3.4 | GO:0061709 | reticulophagy(GO:0061709) |
| 0.4 | 40.6 | GO:0018279 | protein N-linked glycosylation via asparagine(GO:0018279) |
| 0.4 | 1.2 | GO:0060003 | copper ion export(GO:0060003) |
| 0.4 | 4.5 | GO:0035279 | mRNA cleavage involved in gene silencing by miRNA(GO:0035279) mRNA cleavage involved in gene silencing(GO:0098795) |
| 0.4 | 5.3 | GO:0006685 | sphingomyelin catabolic process(GO:0006685) |
| 0.3 | 1.7 | GO:0019346 | homoserine metabolic process(GO:0009092) cyanate metabolic process(GO:0009439) cyanate catabolic process(GO:0009440) transsulfuration(GO:0019346) |
| 0.3 | 3.0 | GO:0050747 | positive regulation of lipoprotein metabolic process(GO:0050747) |
| 0.3 | 1.3 | GO:0032849 | positive regulation of cellular pH reduction(GO:0032849) |
| 0.3 | 4.6 | GO:0046415 | urate metabolic process(GO:0046415) |
| 0.3 | 12.9 | GO:0001580 | detection of chemical stimulus involved in sensory perception of bitter taste(GO:0001580) |
| 0.3 | 6.0 | GO:0090073 | positive regulation of protein homodimerization activity(GO:0090073) |
| 0.2 | 29.9 | GO:0030449 | regulation of complement activation(GO:0030449) |
| 0.2 | 3.5 | GO:0035331 | negative regulation of hippo signaling(GO:0035331) |
| 0.2 | 6.7 | GO:0060732 | positive regulation of inositol phosphate biosynthetic process(GO:0060732) |
| 0.2 | 29.4 | GO:0030521 | androgen receptor signaling pathway(GO:0030521) |
| 0.2 | 2.0 | GO:0007168 | receptor guanylyl cyclase signaling pathway(GO:0007168) |
| 0.2 | 4.2 | GO:0030277 | maintenance of gastrointestinal epithelium(GO:0030277) |
| 0.2 | 0.8 | GO:1904021 | negative regulation of G-protein coupled receptor internalization(GO:1904021) |
| 0.1 | 4.5 | GO:0015721 | bile acid and bile salt transport(GO:0015721) |
| 0.1 | 0.9 | GO:0015798 | myo-inositol transport(GO:0015798) |
| 0.1 | 2.3 | GO:0048312 | intracellular distribution of mitochondria(GO:0048312) |
| 0.1 | 3.5 | GO:0072015 | glomerular visceral epithelial cell development(GO:0072015) |
| 0.1 | 0.8 | GO:0010732 | protein glutathionylation(GO:0010731) regulation of protein glutathionylation(GO:0010732) negative regulation of protein glutathionylation(GO:0010734) |
| 0.1 | 0.5 | GO:0061386 | closure of optic fissure(GO:0061386) |
| 0.1 | 1.1 | GO:0048014 | Tie signaling pathway(GO:0048014) |
| 0.1 | 1.8 | GO:0015889 | cobalamin transport(GO:0015889) |
| 0.1 | 3.1 | GO:0034389 | lipid particle organization(GO:0034389) |
| 0.1 | 2.0 | GO:0007196 | adenylate cyclase-inhibiting G-protein coupled glutamate receptor signaling pathway(GO:0007196) |
| 0.1 | 0.3 | GO:0036323 | vascular endothelial growth factor receptor-1 signaling pathway(GO:0036323) |
| 0.1 | 5.4 | GO:0006730 | one-carbon metabolic process(GO:0006730) |
| 0.1 | 0.6 | GO:0035610 | protein side chain deglutamylation(GO:0035610) |
| 0.1 | 0.7 | GO:0010961 | cellular magnesium ion homeostasis(GO:0010961) |
| 0.1 | 2.9 | GO:0036152 | phosphatidylserine acyl-chain remodeling(GO:0036150) phosphatidylethanolamine acyl-chain remodeling(GO:0036152) |
| 0.1 | 4.8 | GO:0046949 | fatty-acyl-CoA biosynthetic process(GO:0046949) |
| 0.1 | 1.5 | GO:0034379 | very-low-density lipoprotein particle assembly(GO:0034379) |
| 0.1 | 0.9 | GO:0007256 | activation of JNKK activity(GO:0007256) |
| 0.1 | 4.9 | GO:0010862 | positive regulation of pathway-restricted SMAD protein phosphorylation(GO:0010862) |
| 0.1 | 5.5 | GO:0051693 | actin filament capping(GO:0051693) |
| 0.1 | 0.7 | GO:0061669 | spontaneous neurotransmitter secretion(GO:0061669) spontaneous synaptic transmission(GO:0098814) |
| 0.1 | 0.2 | GO:1902683 | regulation of receptor localization to synapse(GO:1902683) |
| 0.0 | 0.2 | GO:1900533 | medium-chain fatty-acyl-CoA catabolic process(GO:0036114) long-chain fatty-acyl-CoA catabolic process(GO:0036116) palmitic acid metabolic process(GO:1900533) palmitic acid biosynthetic process(GO:1900535) |
| 0.0 | 0.2 | GO:1903028 | regulation of opsonization(GO:1903027) positive regulation of opsonization(GO:1903028) |
| 0.0 | 0.4 | GO:0043570 | maintenance of DNA repeat elements(GO:0043570) |
| 0.0 | 5.2 | GO:0051897 | positive regulation of protein kinase B signaling(GO:0051897) |
| 0.0 | 2.1 | GO:0048286 | lung alveolus development(GO:0048286) |
| 0.0 | 0.3 | GO:0003190 | atrioventricular valve formation(GO:0003190) |
| 0.0 | 3.5 | GO:0032436 | positive regulation of proteasomal ubiquitin-dependent protein catabolic process(GO:0032436) |
| 0.0 | 11.6 | GO:0032259 | methylation(GO:0032259) |
| 0.0 | 1.0 | GO:0002360 | T cell lineage commitment(GO:0002360) |
| 0.0 | 13.4 | GO:0042493 | response to drug(GO:0042493) |
| 0.0 | 0.6 | GO:0044458 | motile cilium assembly(GO:0044458) |
| 0.0 | 0.6 | GO:0032467 | positive regulation of cytokinesis(GO:0032467) |
| 0.0 | 0.3 | GO:0016024 | CDP-diacylglycerol biosynthetic process(GO:0016024) |
Gene overrepresentation in cellular component category:
| Log-likelihood per target | Total log-likelihood | Term | Description |
|---|---|---|---|
| 6.6 | 52.7 | GO:0034363 | intermediate-density lipoprotein particle(GO:0034363) |
| 2.9 | 26.1 | GO:0005579 | membrane attack complex(GO:0005579) |
| 2.8 | 19.8 | GO:0032144 | 4-aminobutyrate transaminase complex(GO:0032144) |
| 2.8 | 59.4 | GO:0042627 | chylomicron(GO:0042627) |
| 1.1 | 57.2 | GO:0034451 | centriolar satellite(GO:0034451) |
| 1.0 | 12.9 | GO:0005577 | fibrinogen complex(GO:0005577) |
| 0.9 | 69.0 | GO:0031907 | peroxisomal matrix(GO:0005782) microbody lumen(GO:0031907) |
| 0.9 | 14.1 | GO:0046581 | intercellular canaliculus(GO:0046581) |
| 0.9 | 38.5 | GO:0031528 | microvillus membrane(GO:0031528) |
| 0.4 | 44.9 | GO:0031526 | brush border membrane(GO:0031526) |
| 0.4 | 8.6 | GO:0031089 | platelet dense granule lumen(GO:0031089) |
| 0.4 | 9.2 | GO:0032426 | stereocilium tip(GO:0032426) |
| 0.4 | 8.6 | GO:0016529 | sarcoplasmic reticulum(GO:0016529) |
| 0.4 | 9.0 | GO:0005915 | zonula adherens(GO:0005915) |
| 0.3 | 5.4 | GO:1990909 | Wnt signalosome(GO:1990909) |
| 0.3 | 75.5 | GO:0072562 | blood microparticle(GO:0072562) |
| 0.2 | 5.5 | GO:0008091 | spectrin(GO:0008091) |
| 0.2 | 15.4 | GO:0009925 | basal plasma membrane(GO:0009925) |
| 0.2 | 3.5 | GO:0036057 | filtration diaphragm(GO:0036056) slit diaphragm(GO:0036057) |
| 0.2 | 24.1 | GO:0005796 | Golgi lumen(GO:0005796) |
| 0.2 | 4.5 | GO:0070971 | endoplasmic reticulum exit site(GO:0070971) |
| 0.1 | 203.1 | GO:0005789 | endoplasmic reticulum membrane(GO:0005789) |
| 0.1 | 32.8 | GO:0016323 | basolateral plasma membrane(GO:0016323) |
| 0.1 | 0.4 | GO:0032302 | MutSbeta complex(GO:0032302) |
| 0.1 | 11.4 | GO:0005604 | basement membrane(GO:0005604) |
| 0.1 | 1.4 | GO:0036038 | MKS complex(GO:0036038) |
| 0.1 | 0.6 | GO:0097413 | Lewy body(GO:0097413) |
| 0.1 | 39.0 | GO:0005759 | mitochondrial matrix(GO:0005759) |
| 0.1 | 4.3 | GO:0005902 | microvillus(GO:0005902) |
| 0.0 | 0.8 | GO:0005890 | sodium:potassium-exchanging ATPase complex(GO:0005890) |
| 0.0 | 9.1 | GO:0043296 | apical junction complex(GO:0043296) |
| 0.0 | 3.1 | GO:0005811 | lipid particle(GO:0005811) |
| 0.0 | 2.5 | GO:0016591 | DNA-directed RNA polymerase II, holoenzyme(GO:0016591) |
| 0.0 | 0.6 | GO:0030057 | desmosome(GO:0030057) |
| 0.0 | 7.3 | GO:0090575 | RNA polymerase II transcription factor complex(GO:0090575) |
| 0.0 | 9.5 | GO:0005788 | endoplasmic reticulum lumen(GO:0005788) |
| 0.0 | 12.3 | GO:0005743 | mitochondrial inner membrane(GO:0005743) |
| 0.0 | 9.1 | GO:0005667 | transcription factor complex(GO:0005667) |
| 0.0 | 134.0 | GO:0005576 | extracellular region(GO:0005576) |
| 0.0 | 2.2 | GO:0042734 | presynaptic membrane(GO:0042734) |
| 0.0 | 2.2 | GO:0045111 | intermediate filament cytoskeleton(GO:0045111) |
Gene overrepresentation in molecular function category:
| Log-likelihood per target | Total log-likelihood | Term | Description |
|---|---|---|---|
| 14.3 | 57.2 | GO:0061609 | fructose-1-phosphate aldolase activity(GO:0061609) |
| 13.8 | 41.3 | GO:0004411 | homogentisate 1,2-dioxygenase activity(GO:0004411) |
| 11.4 | 56.9 | GO:0034875 | oxidoreductase activity, acting on CH or CH2 groups, quinone or similar compound as acceptor(GO:0033695) caffeine oxidase activity(GO:0034875) |
| 8.7 | 26.0 | GO:0004613 | phosphoenolpyruvate carboxykinase activity(GO:0004611) phosphoenolpyruvate carboxykinase (GTP) activity(GO:0004613) |
| 7.7 | 38.7 | GO:0070653 | high-density lipoprotein particle receptor binding(GO:0070653) |
| 7.2 | 43.2 | GO:0060230 | lipoprotein lipase activator activity(GO:0060230) |
| 6.0 | 18.1 | GO:0052852 | (S)-2-hydroxy-acid oxidase activity(GO:0003973) very-long-chain-(S)-2-hydroxy-acid oxidase activity(GO:0052852) long-chain-(S)-2-hydroxy-long-chain-acid oxidase activity(GO:0052853) medium-chain-(S)-2-hydroxy-acid oxidase activity(GO:0052854) |
| 5.3 | 31.8 | GO:0004882 | androgen receptor activity(GO:0004882) |
| 5.1 | 40.6 | GO:0004873 | asialoglycoprotein receptor activity(GO:0004873) |
| 4.8 | 24.2 | GO:0016647 | oxidoreductase activity, acting on the CH-NH group of donors, oxygen as acceptor(GO:0016647) |
| 4.8 | 38.5 | GO:0005124 | scavenger receptor binding(GO:0005124) |
| 4.0 | 11.9 | GO:0008480 | sarcosine dehydrogenase activity(GO:0008480) |
| 3.8 | 26.7 | GO:0004743 | pyruvate kinase activity(GO:0004743) |
| 3.7 | 22.5 | GO:0008453 | alanine-glyoxylate transaminase activity(GO:0008453) |
| 3.4 | 20.7 | GO:0060228 | phosphatidylcholine-sterol O-acyltransferase activator activity(GO:0060228) |
| 3.3 | 59.1 | GO:0008392 | arachidonic acid monooxygenase activity(GO:0008391) arachidonic acid epoxygenase activity(GO:0008392) |
| 3.3 | 29.5 | GO:0015184 | L-cystine transmembrane transporter activity(GO:0015184) |
| 3.2 | 9.6 | GO:0052871 | tocopherol omega-hydroxylase activity(GO:0052870) alpha-tocopherol omega-hydroxylase activity(GO:0052871) 20-hydroxy-leukotriene B4 omega oxidase activity(GO:0097258) 20-aldehyde-leukotriene B4 20-monooxygenase activity(GO:0097259) |
| 2.8 | 19.8 | GO:0003867 | 4-aminobutyrate transaminase activity(GO:0003867) succinate-semialdehyde dehydrogenase binding(GO:0032145) (S)-3-amino-2-methylpropionate transaminase activity(GO:0047298) |
| 2.4 | 9.6 | GO:0003974 | UDP-N-acetylglucosamine 4-epimerase activity(GO:0003974) UDP-glucose 4-epimerase activity(GO:0003978) |
| 2.3 | 15.8 | GO:0005324 | long-chain fatty acid transporter activity(GO:0005324) |
| 2.2 | 15.5 | GO:0016936 | galactoside binding(GO:0016936) |
| 2.2 | 83.0 | GO:0001848 | complement binding(GO:0001848) |
| 2.0 | 14.1 | GO:0090554 | phosphatidylcholine-translocating ATPase activity(GO:0090554) |
| 2.0 | 23.7 | GO:0015245 | fatty acid transporter activity(GO:0015245) |
| 1.8 | 7.2 | GO:0008336 | gamma-butyrobetaine dioxygenase activity(GO:0008336) |
| 1.6 | 12.9 | GO:0031849 | olfactory receptor binding(GO:0031849) |
| 1.6 | 9.5 | GO:0035473 | lipase binding(GO:0035473) |
| 1.5 | 4.6 | GO:0015143 | urate transmembrane transporter activity(GO:0015143) salt transmembrane transporter activity(GO:1901702) |
| 1.5 | 36.4 | GO:0008395 | steroid hydroxylase activity(GO:0008395) |
| 1.5 | 21.0 | GO:0031995 | insulin-like growth factor II binding(GO:0031995) |
| 1.4 | 8.6 | GO:0043546 | molybdopterin cofactor binding(GO:0043546) |
| 1.3 | 6.7 | GO:0004991 | parathyroid hormone receptor activity(GO:0004991) |
| 1.3 | 3.8 | GO:0004416 | hydroxyacylglutathione hydrolase activity(GO:0004416) |
| 1.2 | 9.5 | GO:0004514 | nicotinate-nucleotide diphosphorylase (carboxylating) activity(GO:0004514) |
| 1.1 | 18.7 | GO:0016813 | hydrolase activity, acting on carbon-nitrogen (but not peptide) bonds, in linear amidines(GO:0016813) |
| 1.0 | 3.0 | GO:0004608 | phosphatidyl-N-methylethanolamine N-methyltransferase activity(GO:0000773) phosphatidylethanolamine N-methyltransferase activity(GO:0004608) phosphatidyl-N-dimethylethanolamine N-methyltransferase activity(GO:0080101) |
| 0.9 | 36.1 | GO:0015347 | sodium-independent organic anion transmembrane transporter activity(GO:0015347) |
| 0.9 | 8.5 | GO:0016714 | oxidoreductase activity, acting on paired donors, with incorporation or reduction of molecular oxygen, reduced pteridine as one donor, and incorporation of one atom of oxygen(GO:0016714) |
| 0.9 | 3.4 | GO:0005459 | UDP-galactose transmembrane transporter activity(GO:0005459) |
| 0.8 | 27.6 | GO:0071949 | FAD binding(GO:0071949) |
| 0.7 | 4.8 | GO:0016215 | stearoyl-CoA 9-desaturase activity(GO:0004768) acyl-CoA desaturase activity(GO:0016215) |
| 0.7 | 14.4 | GO:0043225 | anion transmembrane-transporting ATPase activity(GO:0043225) |
| 0.7 | 3.4 | GO:0004994 | somatostatin receptor activity(GO:0004994) |
| 0.6 | 4.5 | GO:0008508 | bile acid:sodium symporter activity(GO:0008508) |
| 0.6 | 1.9 | GO:0004832 | valine-tRNA ligase activity(GO:0004832) |
| 0.6 | 10.7 | GO:0036374 | glutathione hydrolase activity(GO:0036374) |
| 0.6 | 8.6 | GO:0008430 | selenium binding(GO:0008430) |
| 0.5 | 9.6 | GO:0042301 | phosphate ion binding(GO:0042301) |
| 0.5 | 19.1 | GO:0004181 | metallocarboxypeptidase activity(GO:0004181) |
| 0.4 | 5.3 | GO:0004767 | sphingomyelin phosphodiesterase activity(GO:0004767) |
| 0.4 | 1.7 | GO:0016784 | 3-mercaptopyruvate sulfurtransferase activity(GO:0016784) |
| 0.4 | 1.2 | GO:0004008 | copper-exporting ATPase activity(GO:0004008) copper-transporting ATPase activity(GO:0043682) |
| 0.4 | 1.5 | GO:0034736 | sterol O-acyltransferase activity(GO:0004772) cholesterol O-acyltransferase activity(GO:0034736) |
| 0.3 | 6.6 | GO:0004089 | carbonate dehydratase activity(GO:0004089) |
| 0.3 | 1.0 | GO:0005139 | interleukin-7 receptor binding(GO:0005139) |
| 0.3 | 6.0 | GO:0031996 | thioesterase binding(GO:0031996) |
| 0.3 | 3.3 | GO:0008131 | primary amine oxidase activity(GO:0008131) |
| 0.3 | 3.8 | GO:0015321 | sodium-dependent phosphate transmembrane transporter activity(GO:0015321) |
| 0.3 | 3.1 | GO:0030249 | guanylate cyclase regulator activity(GO:0030249) |
| 0.2 | 10.4 | GO:0019200 | carbohydrate kinase activity(GO:0019200) |
| 0.2 | 0.8 | GO:0031687 | A2A adenosine receptor binding(GO:0031687) |
| 0.2 | 2.9 | GO:0047144 | 2-acylglycerol-3-phosphate O-acyltransferase activity(GO:0047144) |
| 0.1 | 20.1 | GO:0004879 | RNA polymerase II transcription factor activity, ligand-activated sequence-specific DNA binding(GO:0004879) transcription factor activity, direct ligand regulated sequence-specific DNA binding(GO:0098531) |
| 0.1 | 0.9 | GO:0004706 | JUN kinase kinase kinase activity(GO:0004706) |
| 0.1 | 0.7 | GO:0031708 | endothelin B receptor binding(GO:0031708) |
| 0.1 | 3.5 | GO:0045294 | alpha-catenin binding(GO:0045294) |
| 0.1 | 5.4 | GO:0005109 | frizzled binding(GO:0005109) |
| 0.1 | 9.0 | GO:0030507 | spectrin binding(GO:0030507) |
| 0.1 | 33.6 | GO:0008168 | methyltransferase activity(GO:0008168) |
| 0.1 | 0.6 | GO:0030197 | extracellular matrix constituent, lubricant activity(GO:0030197) |
| 0.1 | 1.2 | GO:0070699 | type II activin receptor binding(GO:0070699) |
| 0.1 | 0.3 | GO:0036326 | VEGF-A-activated receptor activity(GO:0036326) VEGF-B-activated receptor activity(GO:0036327) placental growth factor-activated receptor activity(GO:0036332) |
| 0.1 | 10.0 | GO:0048306 | calcium-dependent protein binding(GO:0048306) |
| 0.1 | 0.4 | GO:0000406 | double-strand/single-strand DNA junction binding(GO:0000406) dinucleotide repeat insertion binding(GO:0032181) |
| 0.1 | 12.9 | GO:0004867 | serine-type endopeptidase inhibitor activity(GO:0004867) |
| 0.1 | 3.1 | GO:0016702 | oxidoreductase activity, acting on single donors with incorporation of molecular oxygen, incorporation of two atoms of oxygen(GO:0016702) |
| 0.1 | 11.0 | GO:0005179 | hormone activity(GO:0005179) |
| 0.1 | 14.2 | GO:0003705 | transcription factor activity, RNA polymerase II distal enhancer sequence-specific binding(GO:0003705) |
| 0.1 | 11.4 | GO:0005319 | lipid transporter activity(GO:0005319) |
| 0.1 | 0.7 | GO:0016167 | glial cell-derived neurotrophic factor receptor activity(GO:0016167) |
| 0.1 | 2.5 | GO:0000993 | RNA polymerase II core binding(GO:0000993) |
| 0.1 | 3.5 | GO:0031624 | ubiquitin conjugating enzyme binding(GO:0031624) |
| 0.1 | 0.9 | GO:0015166 | polyol transmembrane transporter activity(GO:0015166) |
| 0.1 | 0.6 | GO:0055131 | C3HC4-type RING finger domain binding(GO:0055131) |
| 0.1 | 5.4 | GO:0050660 | flavin adenine dinucleotide binding(GO:0050660) |
| 0.1 | 19.4 | GO:0004252 | serine-type endopeptidase activity(GO:0004252) |
| 0.1 | 0.2 | GO:0052815 | medium-chain acyl-CoA hydrolase activity(GO:0052815) long-chain acyl-CoA hydrolase activity(GO:0052816) |
| 0.0 | 2.8 | GO:0005158 | insulin receptor binding(GO:0005158) |
| 0.0 | 0.5 | GO:0030976 | thiamine pyrophosphate binding(GO:0030976) |
| 0.0 | 0.2 | GO:0005105 | type 1 fibroblast growth factor receptor binding(GO:0005105) |
| 0.0 | 2.0 | GO:0008066 | glutamate receptor activity(GO:0008066) |
| 0.0 | 0.9 | GO:0004745 | retinol dehydrogenase activity(GO:0004745) |
| 0.0 | 0.2 | GO:0036042 | long-chain fatty acyl-CoA binding(GO:0036042) |
| 0.0 | 0.5 | GO:0072542 | protein phosphatase activator activity(GO:0072542) |
| 0.0 | 0.1 | GO:0004146 | dihydrofolate reductase activity(GO:0004146) |
| 0.0 | 9.1 | GO:0001077 | transcriptional activator activity, RNA polymerase II core promoter proximal region sequence-specific binding(GO:0001077) |
| 0.0 | 1.5 | GO:0017022 | myosin binding(GO:0017022) |
Gene overrepresentation in curated gene sets: canonical pathways category:
| Log-likelihood per target | Total log-likelihood | Term | Description |
|---|---|---|---|
| 1.8 | 161.5 | PID HNF3B PATHWAY | FOXA2 and FOXA3 transcription factor networks |
| 0.8 | 23.4 | ST G ALPHA S PATHWAY | G alpha s Pathway |
| 0.4 | 37.9 | PID HNF3A PATHWAY | FOXA1 transcription factor network |
| 0.2 | 31.8 | PID REG GR PATHWAY | Glucocorticoid receptor regulatory network |
| 0.2 | 61.6 | NABA ECM REGULATORS | Genes encoding enzymes and their regulators involved in the remodeling of the extracellular matrix |
| 0.2 | 2.8 | PID RET PATHWAY | Signaling events regulated by Ret tyrosine kinase |
| 0.1 | 5.4 | PID WNT SIGNALING PATHWAY | Wnt signaling network |
| 0.1 | 16.6 | NABA ECM AFFILIATED | Genes encoding proteins affiliated structurally or functionally to extracellular matrix proteins |
| 0.0 | 3.3 | PID ALPHA SYNUCLEIN PATHWAY | Alpha-synuclein signaling |
| 0.0 | 2.4 | PID NEPHRIN NEPH1 PATHWAY | Nephrin/Neph1 signaling in the kidney podocyte |
| 0.0 | 3.1 | PID TAP63 PATHWAY | Validated transcriptional targets of TAp63 isoforms |
| 0.0 | 0.9 | PID CONE PATHWAY | Visual signal transduction: Cones |
| 0.0 | 0.9 | PID IFNG PATHWAY | IFN-gamma pathway |
| 0.0 | 0.3 | PID VEGF VEGFR PATHWAY | VEGF and VEGFR signaling network |
| 0.0 | 1.1 | PID ANGIOPOIETIN RECEPTOR PATHWAY | Angiopoietin receptor Tie2-mediated signaling |
Gene overrepresentation in curated gene sets: REACTOME pathways category:
| Log-likelihood per target | Total log-likelihood | Term | Description |
|---|---|---|---|
| 7.0 | 126.7 | REACTOME XENOBIOTICS | Genes involved in Xenobiotics |
| 3.7 | 91.5 | REACTOME CHYLOMICRON MEDIATED LIPID TRANSPORT | Genes involved in Chylomicron-mediated lipid transport |
| 2.7 | 40.2 | REACTOME SYNTHESIS OF BILE ACIDS AND BILE SALTS VIA 24 HYDROXYCHOLESTEROL | Genes involved in Synthesis of bile acids and bile salts via 24-hydroxycholesterol |
| 2.1 | 51.4 | REACTOME INITIAL TRIGGERING OF COMPLEMENT | Genes involved in Initial triggering of complement |
| 1.4 | 26.0 | REACTOME ABACAVIR TRANSPORT AND METABOLISM | Genes involved in Abacavir transport and metabolism |
| 1.2 | 22.5 | REACTOME PYRIMIDINE CATABOLISM | Genes involved in Pyrimidine catabolism |
| 1.2 | 83.9 | REACTOME GLYCOLYSIS | Genes involved in Glycolysis |
| 1.1 | 26.2 | REACTOME ORGANIC CATION ANION ZWITTERION TRANSPORT | Genes involved in Organic cation/anion/zwitterion transport |
| 1.0 | 19.4 | REACTOME GAMMA CARBOXYLATION TRANSPORT AND AMINO TERMINAL CLEAVAGE OF PROTEINS | Genes involved in Gamma-carboxylation, transport, and amino-terminal cleavage of proteins |
| 0.9 | 26.1 | REACTOME COMPLEMENT CASCADE | Genes involved in Complement cascade |
| 0.9 | 12.8 | REACTOME TRYPTOPHAN CATABOLISM | Genes involved in Tryptophan catabolism |
| 0.9 | 18.7 | REACTOME METABOLISM OF POLYAMINES | Genes involved in Metabolism of polyamines |
| 0.9 | 8.6 | REACTOME PURINE CATABOLISM | Genes involved in Purine catabolism |
| 0.9 | 11.1 | REACTOME GLYCOPROTEIN HORMONES | Genes involved in Glycoprotein hormones |
| 0.7 | 21.0 | REACTOME REGULATION OF INSULIN LIKE GROWTH FACTOR IGF ACTIVITY BY INSULIN LIKE GROWTH FACTOR BINDING PROTEINS IGFBPS | Genes involved in Regulation of Insulin-like Growth Factor (IGF) Activity by Insulin-like Growth Factor Binding Proteins (IGFBPs) |
| 0.6 | 6.7 | REACTOME COMMON PATHWAY | Genes involved in Common Pathway |
| 0.6 | 15.8 | REACTOME ABCA TRANSPORTERS IN LIPID HOMEOSTASIS | Genes involved in ABCA transporters in lipid homeostasis |
| 0.5 | 14.4 | REACTOME ABC FAMILY PROTEINS MEDIATED TRANSPORT | Genes involved in ABC-family proteins mediated transport |
| 0.5 | 38.0 | REACTOME REGULATION OF BETA CELL DEVELOPMENT | Genes involved in Regulation of beta-cell development |
| 0.4 | 19.8 | REACTOME GABA SYNTHESIS RELEASE REUPTAKE AND DEGRADATION | Genes involved in GABA synthesis, release, reuptake and degradation |
| 0.4 | 29.5 | REACTOME AMINO ACID TRANSPORT ACROSS THE PLASMA MEMBRANE | Genes involved in Amino acid transport across the plasma membrane |
| 0.4 | 6.6 | REACTOME REVERSIBLE HYDRATION OF CARBON DIOXIDE | Genes involved in Reversible Hydration of Carbon Dioxide |
| 0.3 | 44.6 | REACTOME NUCLEAR RECEPTOR TRANSCRIPTION PATHWAY | Genes involved in Nuclear Receptor transcription pathway |
| 0.3 | 77.3 | REACTOME METABOLISM OF AMINO ACIDS AND DERIVATIVES | Genes involved in Metabolism of amino acids and derivatives |
| 0.3 | 10.7 | REACTOME GLUTATHIONE CONJUGATION | Genes involved in Glutathione conjugation |
| 0.2 | 8.8 | REACTOME CYTOCHROME P450 ARRANGED BY SUBSTRATE TYPE | Genes involved in Cytochrome P450 - arranged by substrate type |
| 0.2 | 4.2 | REACTOME TRANSPORT OF ORGANIC ANIONS | Genes involved in Transport of organic anions |
| 0.2 | 4.6 | REACTOME FACILITATIVE NA INDEPENDENT GLUCOSE TRANSPORTERS | Genes involved in Facilitative Na+-independent glucose transporters |
| 0.2 | 2.9 | REACTOME ACYL CHAIN REMODELLING OF PS | Genes involved in Acyl chain remodelling of PS |
| 0.1 | 4.5 | REACTOME PRE NOTCH TRANSCRIPTION AND TRANSLATION | Genes involved in Pre-NOTCH Transcription and Translation |
| 0.1 | 1.8 | REACTOME HDL MEDIATED LIPID TRANSPORT | Genes involved in HDL-mediated lipid transport |
| 0.1 | 3.3 | REACTOME PHASE1 FUNCTIONALIZATION OF COMPOUNDS | Genes involved in Phase 1 - Functionalization of compounds |
| 0.1 | 9.6 | REACTOME METABOLISM OF VITAMINS AND COFACTORS | Genes involved in Metabolism of vitamins and cofactors |
| 0.1 | 3.5 | REACTOME NEPHRIN INTERACTIONS | Genes involved in Nephrin interactions |
| 0.1 | 5.5 | REACTOME INTERACTION BETWEEN L1 AND ANKYRINS | Genes involved in Interaction between L1 and Ankyrins |
| 0.1 | 12.1 | REACTOME CLASS B 2 SECRETIN FAMILY RECEPTORS | Genes involved in Class B/2 (Secretin family receptors) |
| 0.1 | 3.0 | REACTOME SYNTHESIS OF PC | Genes involved in Synthesis of PC |
| 0.1 | 2.0 | REACTOME CLASS C 3 METABOTROPIC GLUTAMATE PHEROMONE RECEPTORS | Genes involved in Class C/3 (Metabotropic glutamate/pheromone receptors) |
| 0.1 | 1.9 | REACTOME MITOCHONDRIAL TRNA AMINOACYLATION | Genes involved in Mitochondrial tRNA aminoacylation |
| 0.1 | 13.6 | REACTOME PPARA ACTIVATES GENE EXPRESSION | Genes involved in PPARA Activates Gene Expression |
| 0.1 | 5.3 | REACTOME GLYCOSPHINGOLIPID METABOLISM | Genes involved in Glycosphingolipid metabolism |
| 0.1 | 2.6 | REACTOME TERMINATION OF O GLYCAN BIOSYNTHESIS | Genes involved in Termination of O-glycan biosynthesis |
| 0.0 | 1.0 | REACTOME IL 7 SIGNALING | Genes involved in Interleukin-7 signaling |
| 0.0 | 3.8 | REACTOME TRANSPORT OF INORGANIC CATIONS ANIONS AND AMINO ACIDS OLIGOPEPTIDES | Genes involved in Transport of inorganic cations/anions and amino acids/oligopeptides |
| 0.0 | 6.8 | REACTOME METABOLISM OF CARBOHYDRATES | Genes involved in Metabolism of carbohydrates |
| 0.0 | 0.7 | REACTOME BETA DEFENSINS | Genes involved in Beta defensins |
| 0.0 | 1.2 | REACTOME ION TRANSPORT BY P TYPE ATPASES | Genes involved in Ion transport by P-type ATPases |
| 0.0 | 0.3 | REACTOME VEGF LIGAND RECEPTOR INTERACTIONS | Genes involved in VEGF ligand-receptor interactions |
| 0.0 | 1.8 | REACTOME RESPONSE TO ELEVATED PLATELET CYTOSOLIC CA2 | Genes involved in Response to elevated platelet cytosolic Ca2+ |
| 0.0 | 0.2 | REACTOME SYNTHESIS OF BILE ACIDS AND BILE SALTS VIA 7ALPHA HYDROXYCHOLESTEROL | Genes involved in Synthesis of bile acids and bile salts via 7alpha-hydroxycholesterol |