Project
Illumina Body Map 2 (GSE30611)
Navigation
Downloads
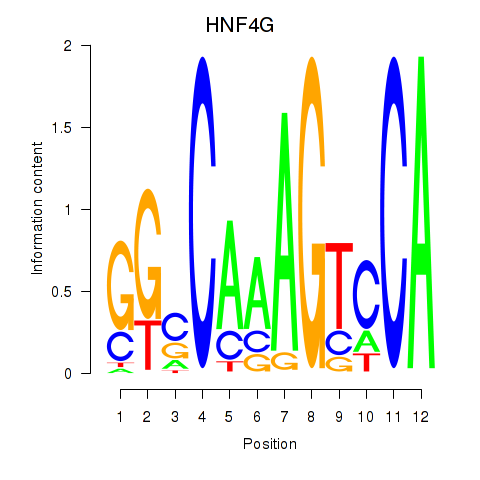
Results for HNF4G
Z-value: 1.73
Motif logo
Transcription factors associated with HNF4G
| Gene Symbol | Gene ID | Gene Info |
|---|---|---|
|
HNF4G
|
ENSG00000164749.13 | hepatocyte nuclear factor 4 gamma |
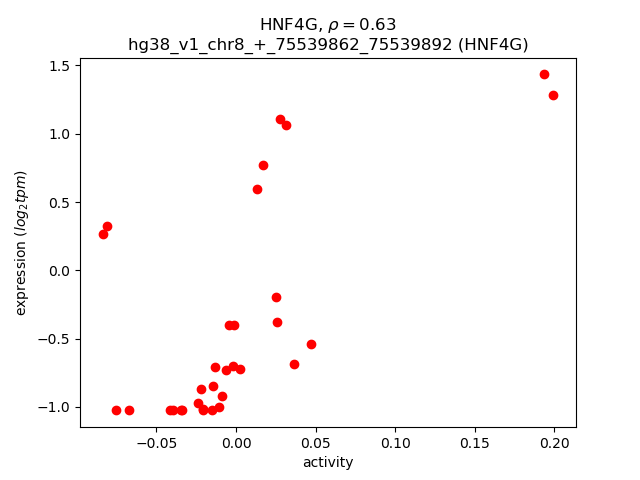
Activity-expression correlation:
| Gene | Promoter | Pearson corr. coef. | P-value | Plot |
|---|---|---|---|---|
| HNF4G | hg38_v1_chr8_+_75539862_75539892 | 0.63 | 1.0e-04 | Click! |
Activity profile of HNF4G motif
Sorted Z-values of HNF4G motif
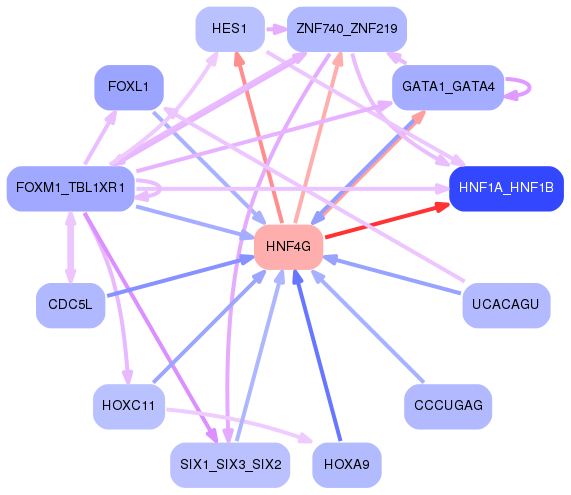
Network of associatons between targets according to the STRING database.

First level regulatory network of HNF4G
Gene Ontology Analysis
Gene overrepresentation in biological process category:
| Log-likelihood per target | Total log-likelihood | Term | Description |
|---|---|---|---|
| 3.8 | 11.5 | GO:0046271 | phenylpropanoid catabolic process(GO:0046271) |
| 2.8 | 11.1 | GO:0010902 | positive regulation of very-low-density lipoprotein particle remodeling(GO:0010902) |
| 2.7 | 13.7 | GO:0009439 | cyanate metabolic process(GO:0009439) cyanate catabolic process(GO:0009440) |
| 2.7 | 26.5 | GO:0007598 | blood coagulation, extrinsic pathway(GO:0007598) |
| 2.6 | 7.9 | GO:0035565 | regulation of pronephros size(GO:0035565) |
| 2.4 | 7.1 | GO:0002415 | immunoglobulin transcytosis in epithelial cells mediated by polymeric immunoglobulin receptor(GO:0002415) |
| 2.2 | 6.5 | GO:0001794 | type IIa hypersensitivity(GO:0001794) regulation of type IIa hypersensitivity(GO:0001796) type II hypersensitivity(GO:0002445) regulation of type II hypersensitivity(GO:0002892) |
| 2.2 | 6.5 | GO:2001025 | response to cyclosporin A(GO:1905237) positive regulation of response to drug(GO:2001025) |
| 1.7 | 10.1 | GO:0098707 | ferrous iron import into cell(GO:0097460) ferrous iron import across plasma membrane(GO:0098707) |
| 1.6 | 9.5 | GO:0019474 | L-lysine catabolic process to acetyl-CoA(GO:0019474) L-lysine catabolic process(GO:0019477) L-lysine metabolic process(GO:0046440) |
| 1.6 | 4.7 | GO:0046416 | D-amino acid metabolic process(GO:0046416) |
| 1.5 | 9.3 | GO:0010897 | negative regulation of triglyceride catabolic process(GO:0010897) |
| 1.5 | 6.1 | GO:0034444 | regulation of plasma lipoprotein particle oxidation(GO:0034444) negative regulation of plasma lipoprotein particle oxidation(GO:0034445) |
| 1.5 | 5.9 | GO:0043091 | L-arginine import(GO:0043091) arginine import(GO:0090467) |
| 1.3 | 5.1 | GO:1903629 | regulation of calcium-dependent ATPase activity(GO:1903610) negative regulation of calcium-dependent ATPase activity(GO:1903611) regulation of dUTP diphosphatase activity(GO:1903627) positive regulation of dUTP diphosphatase activity(GO:1903629) negative regulation of aminoacyl-tRNA ligase activity(GO:1903631) regulation of leucine-tRNA ligase activity(GO:1903633) negative regulation of leucine-tRNA ligase activity(GO:1903634) |
| 1.3 | 6.3 | GO:0009698 | phenylpropanoid metabolic process(GO:0009698) coumarin metabolic process(GO:0009804) |
| 1.2 | 3.5 | GO:0032824 | negative regulation of natural killer cell differentiation(GO:0032824) negative regulation of natural killer cell differentiation involved in immune response(GO:0032827) |
| 1.1 | 24.0 | GO:0019373 | epoxygenase P450 pathway(GO:0019373) |
| 1.1 | 3.3 | GO:1901053 | sarcosine metabolic process(GO:1901052) sarcosine catabolic process(GO:1901053) |
| 1.1 | 4.3 | GO:0043006 | activation of phospholipase A2 activity by calcium-mediated signaling(GO:0043006) |
| 1.0 | 5.1 | GO:0032571 | response to vitamin K(GO:0032571) |
| 1.0 | 3.0 | GO:0090675 | intermicrovillar adhesion(GO:0090675) |
| 0.9 | 6.1 | GO:0046874 | quinolinate metabolic process(GO:0046874) |
| 0.9 | 3.5 | GO:0019074 | viral genome packaging(GO:0019072) viral RNA genome packaging(GO:0019074) |
| 0.8 | 6.6 | GO:0038172 | interleukin-33-mediated signaling pathway(GO:0038172) |
| 0.7 | 2.2 | GO:1904106 | protein localization to microvillus(GO:1904106) |
| 0.7 | 2.2 | GO:0019364 | NADP catabolic process(GO:0006742) pyridine nucleotide catabolic process(GO:0019364) |
| 0.7 | 2.1 | GO:0035674 | tricarboxylic acid transmembrane transport(GO:0035674) |
| 0.7 | 2.1 | GO:0046110 | xanthine metabolic process(GO:0046110) |
| 0.7 | 2.8 | GO:0015910 | peroxisomal long-chain fatty acid import(GO:0015910) |
| 0.7 | 13.3 | GO:0006957 | complement activation, alternative pathway(GO:0006957) |
| 0.7 | 2.6 | GO:0043335 | protein unfolding(GO:0043335) |
| 0.6 | 4.3 | GO:0019557 | histidine catabolic process to glutamate and formamide(GO:0019556) histidine catabolic process to glutamate and formate(GO:0019557) formamide metabolic process(GO:0043606) |
| 0.6 | 4.3 | GO:0006543 | glutamine catabolic process(GO:0006543) |
| 0.6 | 4.7 | GO:1902847 | regulation of neuronal signal transduction(GO:1902847) positive regulation of neurofibrillary tangle assembly(GO:1902998) |
| 0.5 | 6.0 | GO:0042866 | pyruvate biosynthetic process(GO:0042866) |
| 0.5 | 4.6 | GO:0015811 | L-cystine transport(GO:0015811) |
| 0.5 | 6.6 | GO:2001199 | negative regulation of dendritic cell differentiation(GO:2001199) |
| 0.5 | 1.5 | GO:1901253 | negative regulation of intracellular transport of viral material(GO:1901253) |
| 0.5 | 6.5 | GO:0006689 | ganglioside catabolic process(GO:0006689) |
| 0.5 | 3.0 | GO:1901162 | primary amino compound biosynthetic process(GO:1901162) |
| 0.5 | 1.9 | GO:0018153 | isopeptide cross-linking via N6-(L-isoglutamyl)-L-lysine(GO:0018153) isopeptide cross-linking(GO:0018262) |
| 0.5 | 1.4 | GO:0001579 | medium-chain fatty acid transport(GO:0001579) |
| 0.4 | 1.3 | GO:2000974 | auditory receptor cell fate determination(GO:0042668) negative regulation of auditory receptor cell differentiation(GO:0045608) negative regulation of pro-B cell differentiation(GO:2000974) |
| 0.4 | 2.9 | GO:0046485 | ether lipid metabolic process(GO:0046485) |
| 0.4 | 1.6 | GO:0006562 | proline catabolic process(GO:0006562) |
| 0.4 | 2.3 | GO:0038016 | insulin receptor internalization(GO:0038016) |
| 0.4 | 3.0 | GO:0032185 | septin cytoskeleton organization(GO:0032185) |
| 0.4 | 5.2 | GO:0015747 | urate transport(GO:0015747) |
| 0.4 | 1.1 | GO:0034034 | coenzyme A catabolic process(GO:0015938) nucleoside bisphosphate catabolic process(GO:0033869) ribonucleoside bisphosphate catabolic process(GO:0034031) purine nucleoside bisphosphate catabolic process(GO:0034034) |
| 0.4 | 3.2 | GO:0006531 | aspartate metabolic process(GO:0006531) |
| 0.3 | 1.4 | GO:0016062 | adaptation of rhodopsin mediated signaling(GO:0016062) light adaption(GO:0036367) |
| 0.3 | 5.8 | GO:0070863 | positive regulation of protein exit from endoplasmic reticulum(GO:0070863) |
| 0.3 | 0.7 | GO:0060061 | Spemann organizer formation(GO:0060061) |
| 0.3 | 2.5 | GO:0042738 | exogenous drug catabolic process(GO:0042738) |
| 0.3 | 2.4 | GO:0009441 | glycolate metabolic process(GO:0009441) |
| 0.3 | 0.9 | GO:0070676 | intralumenal vesicle formation(GO:0070676) |
| 0.3 | 0.9 | GO:0019287 | isopentenyl diphosphate biosynthetic process, mevalonate pathway(GO:0019287) |
| 0.3 | 2.5 | GO:0002159 | desmosome assembly(GO:0002159) |
| 0.3 | 2.2 | GO:0006741 | NADP biosynthetic process(GO:0006741) |
| 0.3 | 0.3 | GO:1903630 | regulation of aminoacyl-tRNA ligase activity(GO:1903630) |
| 0.3 | 9.5 | GO:0043252 | sodium-independent organic anion transport(GO:0043252) |
| 0.3 | 1.0 | GO:0009258 | 10-formyltetrahydrofolate catabolic process(GO:0009258) |
| 0.2 | 5.0 | GO:0071280 | cellular response to copper ion(GO:0071280) |
| 0.2 | 4.3 | GO:0019388 | galactose catabolic process(GO:0019388) |
| 0.2 | 0.9 | GO:0034224 | cellular response to zinc ion starvation(GO:0034224) |
| 0.2 | 0.9 | GO:0035054 | atrial septum secundum morphogenesis(GO:0003290) embryonic heart tube anterior/posterior pattern specification(GO:0035054) |
| 0.2 | 2.2 | GO:0045716 | positive regulation of low-density lipoprotein particle receptor biosynthetic process(GO:0045716) |
| 0.2 | 0.7 | GO:0038162 | erythropoietin-mediated signaling pathway(GO:0038162) |
| 0.2 | 1.3 | GO:1900220 | semaphorin-plexin signaling pathway involved in bone trabecula morphogenesis(GO:1900220) |
| 0.2 | 0.8 | GO:0035963 | cellular response to interleukin-13(GO:0035963) |
| 0.2 | 1.9 | GO:0060414 | aorta smooth muscle tissue morphogenesis(GO:0060414) |
| 0.2 | 3.8 | GO:0071372 | cellular response to follicle-stimulating hormone stimulus(GO:0071372) |
| 0.2 | 1.7 | GO:2000660 | negative regulation of interleukin-1-mediated signaling pathway(GO:2000660) |
| 0.2 | 2.6 | GO:0071492 | cellular response to UV-A(GO:0071492) |
| 0.2 | 1.6 | GO:0046465 | dolichyl diphosphate biosynthetic process(GO:0006489) dolichyl diphosphate metabolic process(GO:0046465) |
| 0.2 | 7.6 | GO:0015838 | amino-acid betaine transport(GO:0015838) |
| 0.2 | 6.7 | GO:0043567 | regulation of insulin-like growth factor receptor signaling pathway(GO:0043567) |
| 0.2 | 5.6 | GO:0048569 | post-embryonic organ development(GO:0048569) |
| 0.2 | 1.3 | GO:0060011 | Sertoli cell proliferation(GO:0060011) |
| 0.2 | 0.5 | GO:0046713 | borate transmembrane transport(GO:0035445) borate transport(GO:0046713) |
| 0.2 | 0.5 | GO:0060829 | regulation of canonical Wnt signaling pathway involved in neural plate anterior/posterior pattern formation(GO:0060827) negative regulation of canonical Wnt signaling pathway involved in neural plate anterior/posterior pattern formation(GO:0060829) |
| 0.2 | 4.3 | GO:0034975 | protein folding in endoplasmic reticulum(GO:0034975) |
| 0.2 | 1.0 | GO:0009730 | detection of carbohydrate stimulus(GO:0009730) detection of hexose stimulus(GO:0009732) detection of monosaccharide stimulus(GO:0034287) detection of glucose(GO:0051594) |
| 0.2 | 0.7 | GO:0018125 | peptidyl-cysteine methylation(GO:0018125) |
| 0.2 | 0.5 | GO:1901656 | glycoside transport(GO:1901656) |
| 0.2 | 0.5 | GO:0001188 | RNA polymerase I transcriptional preinitiation complex assembly(GO:0001188) RNA polymerase I transcriptional preinitiation complex assembly at the promoter for the nuclear large rRNA transcript(GO:0001189) |
| 0.2 | 3.3 | GO:0010623 | programmed cell death involved in cell development(GO:0010623) |
| 0.2 | 0.9 | GO:0060370 | susceptibility to T cell mediated cytotoxicity(GO:0060370) |
| 0.2 | 1.4 | GO:0006065 | UDP-glucuronate biosynthetic process(GO:0006065) |
| 0.1 | 1.3 | GO:0050747 | positive regulation of lipoprotein metabolic process(GO:0050747) |
| 0.1 | 1.6 | GO:1901529 | positive regulation of anion channel activity(GO:1901529) |
| 0.1 | 14.0 | GO:0018279 | protein N-linked glycosylation via asparagine(GO:0018279) |
| 0.1 | 0.6 | GO:0031049 | mesodermal-endodermal cell signaling(GO:0003131) programmed DNA elimination(GO:0031049) chromosome breakage(GO:0031052) histone H2A-S139 phosphorylation(GO:0035978) positive regulation of cellular response to X-ray(GO:2000685) |
| 0.1 | 8.7 | GO:0006699 | bile acid biosynthetic process(GO:0006699) |
| 0.1 | 3.5 | GO:0097264 | self proteolysis(GO:0097264) |
| 0.1 | 0.8 | GO:0030200 | heparan sulfate proteoglycan catabolic process(GO:0030200) |
| 0.1 | 1.9 | GO:0043152 | induction of bacterial agglutination(GO:0043152) |
| 0.1 | 3.9 | GO:0006646 | phosphatidylethanolamine biosynthetic process(GO:0006646) |
| 0.1 | 1.2 | GO:0006568 | tryptophan metabolic process(GO:0006568) |
| 0.1 | 0.5 | GO:1904588 | cellular response to glycoprotein(GO:1904588) cellular response to thyrotropin-releasing hormone(GO:1905229) |
| 0.1 | 1.0 | GO:0070127 | tRNA aminoacylation for mitochondrial protein translation(GO:0070127) |
| 0.1 | 10.0 | GO:0006953 | acute-phase response(GO:0006953) |
| 0.1 | 0.7 | GO:0060478 | acrosomal vesicle exocytosis(GO:0060478) |
| 0.1 | 0.5 | GO:0018874 | benzoate metabolic process(GO:0018874) |
| 0.1 | 0.8 | GO:0033216 | ferric iron import(GO:0033216) ferric iron import into cell(GO:0097461) ferric iron import across plasma membrane(GO:0098706) |
| 0.1 | 0.4 | GO:1903045 | neural crest cell migration involved in sympathetic nervous system development(GO:1903045) |
| 0.1 | 1.1 | GO:0006572 | tyrosine catabolic process(GO:0006572) |
| 0.1 | 3.7 | GO:0060716 | labyrinthine layer blood vessel development(GO:0060716) |
| 0.1 | 0.3 | GO:0014813 | skeletal muscle satellite cell commitment(GO:0014813) |
| 0.1 | 4.4 | GO:0005980 | glycogen catabolic process(GO:0005980) |
| 0.1 | 0.3 | GO:0061537 | glycine secretion(GO:0061536) glycine secretion, neurotransmission(GO:0061537) |
| 0.1 | 0.4 | GO:1903225 | negative regulation of endodermal cell differentiation(GO:1903225) |
| 0.1 | 0.3 | GO:0060309 | elastin catabolic process(GO:0060309) |
| 0.1 | 0.9 | GO:1903377 | negative regulation of oxidative stress-induced neuron intrinsic apoptotic signaling pathway(GO:1903377) |
| 0.1 | 0.6 | GO:0061760 | antifungal innate immune response(GO:0061760) |
| 0.1 | 2.9 | GO:0070886 | positive regulation of calcineurin-NFAT signaling cascade(GO:0070886) |
| 0.1 | 0.3 | GO:0003099 | positive regulation of the force of heart contraction by chemical signal(GO:0003099) |
| 0.1 | 1.8 | GO:0006069 | ethanol oxidation(GO:0006069) |
| 0.1 | 1.2 | GO:0001886 | endothelial cell morphogenesis(GO:0001886) |
| 0.1 | 1.6 | GO:0032780 | negative regulation of ATPase activity(GO:0032780) |
| 0.1 | 1.3 | GO:0035331 | negative regulation of hippo signaling(GO:0035331) |
| 0.1 | 0.3 | GO:0014028 | notochord formation(GO:0014028) |
| 0.1 | 1.1 | GO:0015986 | energy coupled proton transport, down electrochemical gradient(GO:0015985) ATP synthesis coupled proton transport(GO:0015986) |
| 0.1 | 0.4 | GO:0019254 | carnitine metabolic process, CoA-linked(GO:0019254) |
| 0.1 | 1.6 | GO:0031998 | regulation of fatty acid beta-oxidation(GO:0031998) |
| 0.1 | 0.6 | GO:0045650 | negative regulation of macrophage differentiation(GO:0045650) |
| 0.1 | 0.6 | GO:0032962 | positive regulation of inositol trisphosphate biosynthetic process(GO:0032962) |
| 0.1 | 0.6 | GO:0003415 | chondrocyte hypertrophy(GO:0003415) |
| 0.1 | 4.1 | GO:0006635 | fatty acid beta-oxidation(GO:0006635) |
| 0.1 | 0.7 | GO:0045218 | zonula adherens maintenance(GO:0045218) |
| 0.1 | 0.4 | GO:0000430 | regulation of transcription from RNA polymerase II promoter by glucose(GO:0000430) positive regulation of transcription from RNA polymerase II promoter by glucose(GO:0000432) |
| 0.1 | 0.6 | GO:0016198 | axon choice point recognition(GO:0016198) |
| 0.1 | 0.4 | GO:0033685 | negative regulation of luteinizing hormone secretion(GO:0033685) |
| 0.1 | 2.7 | GO:0016338 | calcium-independent cell-cell adhesion via plasma membrane cell-adhesion molecules(GO:0016338) |
| 0.1 | 0.2 | GO:1901420 | negative regulation of vitamin D receptor signaling pathway(GO:0070563) negative regulation of response to alcohol(GO:1901420) |
| 0.1 | 1.2 | GO:1901748 | leukotriene D4 metabolic process(GO:1901748) leukotriene D4 biosynthetic process(GO:1901750) |
| 0.1 | 0.2 | GO:2001287 | negative regulation of caveolin-mediated endocytosis(GO:2001287) |
| 0.1 | 1.6 | GO:0021692 | cerebellar Purkinje cell layer morphogenesis(GO:0021692) |
| 0.1 | 0.1 | GO:1902688 | regulation of NAD metabolic process(GO:1902688) |
| 0.1 | 0.1 | GO:0060214 | endocardium morphogenesis(GO:0003160) endocardium formation(GO:0060214) |
| 0.1 | 1.1 | GO:0006878 | cellular copper ion homeostasis(GO:0006878) |
| 0.1 | 0.8 | GO:2001288 | positive regulation of caveolin-mediated endocytosis(GO:2001288) |
| 0.1 | 0.5 | GO:0055129 | L-proline biosynthetic process(GO:0055129) |
| 0.1 | 0.4 | GO:0016139 | glycoside catabolic process(GO:0016139) |
| 0.1 | 0.2 | GO:0005999 | xylulose biosynthetic process(GO:0005999) |
| 0.1 | 0.4 | GO:0033353 | S-adenosylmethionine cycle(GO:0033353) |
| 0.1 | 3.7 | GO:0010862 | positive regulation of pathway-restricted SMAD protein phosphorylation(GO:0010862) |
| 0.1 | 1.3 | GO:0070544 | histone H3-K36 demethylation(GO:0070544) |
| 0.1 | 0.8 | GO:0033169 | histone H3-K9 demethylation(GO:0033169) |
| 0.0 | 0.3 | GO:0010757 | negative regulation of plasminogen activation(GO:0010757) |
| 0.0 | 0.7 | GO:0007023 | post-chaperonin tubulin folding pathway(GO:0007023) |
| 0.0 | 0.5 | GO:0002943 | tRNA dihydrouridine synthesis(GO:0002943) |
| 0.0 | 0.8 | GO:0019852 | L-ascorbic acid metabolic process(GO:0019852) |
| 0.0 | 0.4 | GO:0014816 | skeletal muscle satellite cell differentiation(GO:0014816) |
| 0.0 | 0.2 | GO:0018057 | peptidyl-lysine oxidation(GO:0018057) |
| 0.0 | 0.4 | GO:0007197 | adenylate cyclase-inhibiting G-protein coupled acetylcholine receptor signaling pathway(GO:0007197) |
| 0.0 | 2.0 | GO:0006362 | transcription elongation from RNA polymerase I promoter(GO:0006362) |
| 0.0 | 1.8 | GO:0050873 | brown fat cell differentiation(GO:0050873) |
| 0.0 | 0.8 | GO:0016254 | preassembly of GPI anchor in ER membrane(GO:0016254) |
| 0.0 | 0.9 | GO:0000028 | ribosomal small subunit assembly(GO:0000028) |
| 0.0 | 0.5 | GO:0051547 | regulation of keratinocyte migration(GO:0051547) |
| 0.0 | 0.1 | GO:0006751 | glutathione catabolic process(GO:0006751) |
| 0.0 | 0.5 | GO:0009414 | response to water deprivation(GO:0009414) |
| 0.0 | 0.7 | GO:0048846 | axon extension involved in axon guidance(GO:0048846) neuron projection extension involved in neuron projection guidance(GO:1902284) |
| 0.0 | 1.1 | GO:1904707 | positive regulation of vascular smooth muscle cell proliferation(GO:1904707) |
| 0.0 | 0.6 | GO:0038203 | TORC2 signaling(GO:0038203) |
| 0.0 | 0.4 | GO:0048312 | intracellular distribution of mitochondria(GO:0048312) |
| 0.0 | 0.1 | GO:0006447 | regulation of translational initiation by iron(GO:0006447) |
| 0.0 | 0.4 | GO:1905232 | cellular response to L-glutamate(GO:1905232) |
| 0.0 | 0.7 | GO:0030497 | fatty acid elongation(GO:0030497) |
| 0.0 | 0.2 | GO:0002725 | negative regulation of T cell cytokine production(GO:0002725) |
| 0.0 | 1.6 | GO:0021772 | olfactory bulb development(GO:0021772) |
| 0.0 | 0.8 | GO:0034389 | lipid particle organization(GO:0034389) |
| 0.0 | 1.0 | GO:0051560 | mitochondrial calcium ion homeostasis(GO:0051560) |
| 0.0 | 3.2 | GO:0006805 | xenobiotic metabolic process(GO:0006805) |
| 0.0 | 1.1 | GO:0050435 | beta-amyloid metabolic process(GO:0050435) |
| 0.0 | 3.3 | GO:0006637 | acyl-CoA metabolic process(GO:0006637) thioester metabolic process(GO:0035383) |
| 0.0 | 0.7 | GO:0015721 | bile acid and bile salt transport(GO:0015721) |
| 0.0 | 0.2 | GO:1900262 | regulation of DNA-directed DNA polymerase activity(GO:1900262) positive regulation of DNA-directed DNA polymerase activity(GO:1900264) |
| 0.0 | 2.8 | GO:0070125 | mitochondrial translational elongation(GO:0070125) |
| 0.0 | 1.3 | GO:0006730 | one-carbon metabolic process(GO:0006730) |
| 0.0 | 0.2 | GO:0051344 | negative regulation of cyclic-nucleotide phosphodiesterase activity(GO:0051344) |
| 0.0 | 3.6 | GO:0032411 | positive regulation of transporter activity(GO:0032411) |
| 0.0 | 3.1 | GO:0031338 | regulation of vesicle fusion(GO:0031338) |
| 0.0 | 2.2 | GO:0070830 | bicellular tight junction assembly(GO:0070830) |
| 0.0 | 0.4 | GO:0006071 | glycerol metabolic process(GO:0006071) |
| 0.0 | 0.1 | GO:0006529 | asparagine biosynthetic process(GO:0006529) |
| 0.0 | 1.3 | GO:0000413 | protein peptidyl-prolyl isomerization(GO:0000413) |
| 0.0 | 0.3 | GO:0048263 | determination of dorsal identity(GO:0048263) |
| 0.0 | 0.1 | GO:0070221 | sulfide oxidation(GO:0019418) sulfide oxidation, using sulfide:quinone oxidoreductase(GO:0070221) |
| 0.0 | 0.4 | GO:0006020 | inositol metabolic process(GO:0006020) |
| 0.0 | 0.2 | GO:0010002 | cardioblast differentiation(GO:0010002) |
| 0.0 | 0.4 | GO:0045899 | positive regulation of RNA polymerase II transcriptional preinitiation complex assembly(GO:0045899) |
| 0.0 | 0.6 | GO:1903963 | arachidonic acid secretion(GO:0050482) arachidonate transport(GO:1903963) |
| 0.0 | 0.7 | GO:0006783 | heme biosynthetic process(GO:0006783) |
| 0.0 | 0.2 | GO:0046959 | habituation(GO:0046959) |
| 0.0 | 0.4 | GO:0006123 | mitochondrial electron transport, cytochrome c to oxygen(GO:0006123) |
| 0.0 | 0.7 | GO:0010039 | response to iron ion(GO:0010039) |
| 0.0 | 0.4 | GO:0046069 | cGMP catabolic process(GO:0046069) |
| 0.0 | 0.2 | GO:0048311 | mitochondrion distribution(GO:0048311) |
| 0.0 | 0.4 | GO:0043517 | positive regulation of DNA damage response, signal transduction by p53 class mediator(GO:0043517) |
| 0.0 | 0.3 | GO:0043562 | cellular response to nitrogen starvation(GO:0006995) cellular response to nitrogen levels(GO:0043562) |
| 0.0 | 0.2 | GO:0030949 | positive regulation of vascular endothelial growth factor receptor signaling pathway(GO:0030949) |
| 0.0 | 0.9 | GO:0032007 | negative regulation of TOR signaling(GO:0032007) |
| 0.0 | 0.1 | GO:0033564 | anterior/posterior axon guidance(GO:0033564) |
| 0.0 | 0.3 | GO:0098719 | sodium ion import across plasma membrane(GO:0098719) sodium ion import into cell(GO:1990118) |
| 0.0 | 0.2 | GO:0031119 | tRNA pseudouridine synthesis(GO:0031119) |
| 0.0 | 0.4 | GO:0008053 | mitochondrial fusion(GO:0008053) |
| 0.0 | 0.2 | GO:0000712 | resolution of meiotic recombination intermediates(GO:0000712) |
| 0.0 | 1.1 | GO:0048207 | vesicle targeting, rough ER to cis-Golgi(GO:0048207) COPII vesicle coating(GO:0048208) |
| 0.0 | 1.1 | GO:0007588 | excretion(GO:0007588) |
| 0.0 | 0.7 | GO:0007274 | neuromuscular synaptic transmission(GO:0007274) |
| 0.0 | 0.1 | GO:0045196 | establishment or maintenance of neuroblast polarity(GO:0045196) establishment of neuroblast polarity(GO:0045200) |
| 0.0 | 1.2 | GO:0045071 | negative regulation of viral genome replication(GO:0045071) |
| 0.0 | 0.6 | GO:0007340 | acrosome reaction(GO:0007340) |
| 0.0 | 0.3 | GO:2000251 | positive regulation of actin cytoskeleton reorganization(GO:2000251) |
| 0.0 | 0.2 | GO:0003322 | pancreatic A cell development(GO:0003322) |
Gene overrepresentation in cellular component category:
| Log-likelihood per target | Total log-likelihood | Term | Description |
|---|---|---|---|
| 2.2 | 17.3 | GO:0034363 | intermediate-density lipoprotein particle(GO:0034363) |
| 1.4 | 4.3 | GO:0097489 | multivesicular body, internal vesicle lumen(GO:0097489) |
| 0.7 | 10.1 | GO:1990712 | HFE-transferrin receptor complex(GO:1990712) |
| 0.7 | 6.0 | GO:0005579 | membrane attack complex(GO:0005579) |
| 0.5 | 3.0 | GO:0089717 | spanning component of plasma membrane(GO:0044214) spanning component of membrane(GO:0089717) |
| 0.4 | 6.5 | GO:0046581 | intercellular canaliculus(GO:0046581) |
| 0.3 | 4.7 | GO:0034366 | spherical high-density lipoprotein particle(GO:0034366) |
| 0.3 | 6.1 | GO:0042627 | chylomicron(GO:0042627) |
| 0.3 | 5.9 | GO:0031089 | platelet dense granule lumen(GO:0031089) |
| 0.3 | 18.5 | GO:0005782 | peroxisomal matrix(GO:0005782) microbody lumen(GO:0031907) |
| 0.2 | 4.1 | GO:0044233 | ER-mitochondrion membrane contact site(GO:0044233) |
| 0.2 | 0.2 | GO:0071062 | alphav-beta3 integrin-vitronectin complex(GO:0071062) |
| 0.2 | 1.1 | GO:0031501 | mannosyltransferase complex(GO:0031501) |
| 0.2 | 1.3 | GO:0034673 | inhibin-betaglycan-ActRII complex(GO:0034673) |
| 0.2 | 7.3 | GO:0031528 | microvillus membrane(GO:0031528) |
| 0.2 | 0.7 | GO:0005602 | complement component C1 complex(GO:0005602) |
| 0.2 | 26.0 | GO:0005796 | Golgi lumen(GO:0005796) |
| 0.1 | 1.5 | GO:0005610 | laminin-5 complex(GO:0005610) |
| 0.1 | 2.5 | GO:0005736 | DNA-directed RNA polymerase I complex(GO:0005736) |
| 0.1 | 13.4 | GO:0033116 | endoplasmic reticulum-Golgi intermediate compartment membrane(GO:0033116) |
| 0.1 | 1.1 | GO:0042382 | paraspeckles(GO:0042382) |
| 0.1 | 0.4 | GO:0005588 | collagen type V trimer(GO:0005588) |
| 0.1 | 0.9 | GO:0000220 | vacuolar proton-transporting V-type ATPase, V0 domain(GO:0000220) |
| 0.1 | 1.3 | GO:0002116 | semaphorin receptor complex(GO:0002116) |
| 0.1 | 8.3 | GO:0031526 | brush border membrane(GO:0031526) |
| 0.1 | 0.8 | GO:0016012 | dystroglycan complex(GO:0016011) sarcoglycan complex(GO:0016012) |
| 0.1 | 3.2 | GO:0030057 | desmosome(GO:0030057) |
| 0.1 | 9.9 | GO:0043202 | lysosomal lumen(GO:0043202) |
| 0.1 | 7.2 | GO:0035580 | specific granule lumen(GO:0035580) |
| 0.1 | 0.7 | GO:0097197 | tetraspanin-enriched microdomain(GO:0097197) |
| 0.1 | 9.1 | GO:0005811 | lipid particle(GO:0005811) |
| 0.1 | 6.4 | GO:0055038 | recycling endosome membrane(GO:0055038) |
| 0.1 | 0.6 | GO:0035985 | senescence-associated heterochromatin focus(GO:0035985) |
| 0.1 | 0.2 | GO:0071821 | FANCM-MHF complex(GO:0071821) |
| 0.1 | 1.2 | GO:0008091 | spectrin(GO:0008091) |
| 0.1 | 1.4 | GO:0097038 | perinuclear endoplasmic reticulum(GO:0097038) |
| 0.0 | 5.4 | GO:0005881 | cytoplasmic microtubule(GO:0005881) |
| 0.0 | 0.3 | GO:0017101 | aminoacyl-tRNA synthetase multienzyme complex(GO:0017101) |
| 0.0 | 31.7 | GO:0005759 | mitochondrial matrix(GO:0005759) |
| 0.0 | 0.2 | GO:0044307 | dendritic branch(GO:0044307) |
| 0.0 | 0.4 | GO:0031595 | nuclear proteasome complex(GO:0031595) |
| 0.0 | 0.7 | GO:0005915 | zonula adherens(GO:0005915) |
| 0.0 | 3.8 | GO:0005903 | brush border(GO:0005903) |
| 0.0 | 4.8 | GO:0042579 | peroxisome(GO:0005777) microbody(GO:0042579) |
| 0.0 | 1.5 | GO:0005790 | smooth endoplasmic reticulum(GO:0005790) |
| 0.0 | 0.4 | GO:0016589 | NURF complex(GO:0016589) |
| 0.0 | 1.0 | GO:0000421 | autophagosome membrane(GO:0000421) |
| 0.0 | 4.2 | GO:0005604 | basement membrane(GO:0005604) |
| 0.0 | 1.7 | GO:0005581 | collagen trimer(GO:0005581) |
| 0.0 | 10.1 | GO:0005788 | endoplasmic reticulum lumen(GO:0005788) |
| 0.0 | 12.1 | GO:0016323 | basolateral plasma membrane(GO:0016323) |
| 0.0 | 38.0 | GO:0005789 | endoplasmic reticulum membrane(GO:0005789) |
| 0.0 | 1.7 | GO:0045334 | clathrin-coated endocytic vesicle(GO:0045334) |
| 0.0 | 0.8 | GO:0032281 | AMPA glutamate receptor complex(GO:0032281) |
| 0.0 | 4.9 | GO:0005923 | bicellular tight junction(GO:0005923) |
| 0.0 | 0.2 | GO:0005750 | mitochondrial respiratory chain complex III(GO:0005750) respiratory chain complex III(GO:0045275) |
| 0.0 | 0.4 | GO:0005751 | mitochondrial respiratory chain complex IV(GO:0005751) |
| 0.0 | 0.2 | GO:0005663 | DNA replication factor C complex(GO:0005663) |
| 0.0 | 0.3 | GO:0060091 | kinocilium(GO:0060091) |
| 0.0 | 0.4 | GO:0035577 | azurophil granule membrane(GO:0035577) |
| 0.0 | 0.1 | GO:0000308 | cytoplasmic cyclin-dependent protein kinase holoenzyme complex(GO:0000308) |
| 0.0 | 0.7 | GO:0032420 | stereocilium(GO:0032420) |
| 0.0 | 0.3 | GO:0036038 | MKS complex(GO:0036038) |
| 0.0 | 0.2 | GO:0008541 | proteasome regulatory particle, lid subcomplex(GO:0008541) |
| 0.0 | 0.5 | GO:0031092 | platelet alpha granule membrane(GO:0031092) |
| 0.0 | 1.4 | GO:0031594 | neuromuscular junction(GO:0031594) |
| 0.0 | 2.1 | GO:0030658 | transport vesicle membrane(GO:0030658) |
| 0.0 | 40.9 | GO:0070062 | extracellular exosome(GO:0070062) |
| 0.0 | 0.2 | GO:0042622 | photoreceptor outer segment membrane(GO:0042622) |
Gene overrepresentation in molecular function category:
| Log-likelihood per target | Total log-likelihood | Term | Description |
|---|---|---|---|
| 3.4 | 10.1 | GO:0004998 | transferrin receptor activity(GO:0004998) |
| 2.3 | 13.7 | GO:0004792 | thiosulfate sulfurtransferase activity(GO:0004792) |
| 1.9 | 11.1 | GO:0060230 | lipoprotein lipase activator activity(GO:0060230) |
| 1.7 | 35.9 | GO:0008391 | arachidonic acid monooxygenase activity(GO:0008391) arachidonic acid epoxygenase activity(GO:0008392) |
| 1.5 | 11.8 | GO:0004873 | asialoglycoprotein receptor activity(GO:0004873) |
| 1.3 | 5.1 | GO:0004341 | gluconolactonase activity(GO:0004341) |
| 1.3 | 3.8 | GO:0004421 | hydroxymethylglutaryl-CoA synthase activity(GO:0004421) |
| 1.2 | 6.1 | GO:0070653 | high-density lipoprotein particle receptor binding(GO:0070653) |
| 1.2 | 3.7 | GO:0000252 | C-3 sterol dehydrogenase (C-4 sterol decarboxylase) activity(GO:0000252) sterol-4-alpha-carboxylate 3-dehydrogenase (decarboxylating) activity(GO:0047012) |
| 1.2 | 6.0 | GO:0016647 | oxidoreductase activity, acting on the CH-NH group of donors, oxygen as acceptor(GO:0016647) |
| 1.2 | 8.1 | GO:0090554 | phosphatidylcholine-translocating ATPase activity(GO:0090554) |
| 1.1 | 3.3 | GO:0008480 | sarcosine dehydrogenase activity(GO:0008480) |
| 1.1 | 4.3 | GO:0003974 | UDP-N-acetylglucosamine 4-epimerase activity(GO:0003974) UDP-glucose 4-epimerase activity(GO:0003978) |
| 1.0 | 6.1 | GO:0060228 | phosphatidylcholine-sterol O-acyltransferase activator activity(GO:0060228) |
| 0.9 | 7.1 | GO:0005124 | scavenger receptor binding(GO:0005124) |
| 0.9 | 4.4 | GO:0008466 | glycogenin glucosyltransferase activity(GO:0008466) |
| 0.9 | 3.5 | GO:0008745 | N-acetylmuramoyl-L-alanine amidase activity(GO:0008745) |
| 0.9 | 6.0 | GO:0004743 | pyruvate kinase activity(GO:0004743) |
| 0.9 | 4.3 | GO:0005006 | epidermal growth factor-activated receptor activity(GO:0005006) |
| 0.8 | 6.6 | GO:0002114 | interleukin-33 receptor activity(GO:0002114) |
| 0.8 | 6.5 | GO:0052796 | exo-alpha-(2->3)-sialidase activity(GO:0052794) exo-alpha-(2->6)-sialidase activity(GO:0052795) exo-alpha-(2->8)-sialidase activity(GO:0052796) |
| 0.8 | 2.4 | GO:0003973 | (S)-2-hydroxy-acid oxidase activity(GO:0003973) very-long-chain-(S)-2-hydroxy-acid oxidase activity(GO:0052852) long-chain-(S)-2-hydroxy-long-chain-acid oxidase activity(GO:0052853) medium-chain-(S)-2-hydroxy-acid oxidase activity(GO:0052854) |
| 0.7 | 2.2 | GO:0003941 | L-serine ammonia-lyase activity(GO:0003941) |
| 0.6 | 1.7 | GO:0005150 | interleukin-1, Type I receptor binding(GO:0005150) |
| 0.5 | 14.2 | GO:0008395 | steroid hydroxylase activity(GO:0008395) |
| 0.5 | 4.3 | GO:0004359 | glutaminase activity(GO:0004359) |
| 0.5 | 7.4 | GO:0031995 | insulin-like growth factor II binding(GO:0031995) |
| 0.5 | 3.1 | GO:0035473 | lipase binding(GO:0035473) |
| 0.5 | 8.9 | GO:0016813 | hydrolase activity, acting on carbon-nitrogen (but not peptide) bonds, in linear amidines(GO:0016813) |
| 0.5 | 4.6 | GO:0015184 | L-cystine transmembrane transporter activity(GO:0015184) |
| 0.5 | 3.6 | GO:0036137 | kynurenine-oxoglutarate transaminase activity(GO:0016212) kynurenine aminotransferase activity(GO:0036137) |
| 0.5 | 3.3 | GO:0016936 | galactoside binding(GO:0016936) |
| 0.4 | 1.3 | GO:0004608 | phosphatidyl-N-methylethanolamine N-methyltransferase activity(GO:0000773) phosphatidylethanolamine N-methyltransferase activity(GO:0004608) phosphatidyl-N-dimethylethanolamine N-methyltransferase activity(GO:0080101) |
| 0.4 | 1.2 | GO:0016649 | electron-transferring-flavoprotein dehydrogenase activity(GO:0004174) oxidoreductase activity, acting on the CH-NH group of donors, quinone or similar compound as acceptor(GO:0016649) |
| 0.4 | 2.8 | GO:0005324 | long-chain fatty acid transporter activity(GO:0005324) |
| 0.4 | 1.1 | GO:0004584 | dolichyl-phosphate-mannose-glycolipid alpha-mannosyltransferase activity(GO:0004584) |
| 0.4 | 4.0 | GO:0004459 | L-lactate dehydrogenase activity(GO:0004459) |
| 0.4 | 4.2 | GO:0015245 | fatty acid transporter activity(GO:0015245) |
| 0.3 | 3.1 | GO:0004305 | ethanolamine kinase activity(GO:0004305) |
| 0.3 | 13.3 | GO:0001848 | complement binding(GO:0001848) |
| 0.3 | 2.1 | GO:0015142 | citrate transmembrane transporter activity(GO:0015137) tricarboxylic acid transmembrane transporter activity(GO:0015142) |
| 0.3 | 2.1 | GO:0043546 | molybdopterin cofactor binding(GO:0043546) |
| 0.3 | 2.3 | GO:0004301 | epoxide hydrolase activity(GO:0004301) |
| 0.3 | 2.6 | GO:0004514 | nicotinate-nucleotide diphosphorylase (carboxylating) activity(GO:0004514) |
| 0.3 | 2.5 | GO:0004468 | lysine N-acetyltransferase activity, acting on acetyl phosphate as donor(GO:0004468) |
| 0.3 | 2.9 | GO:0016714 | oxidoreductase activity, acting on paired donors, with incorporation or reduction of molecular oxygen, reduced pteridine as one donor, and incorporation of one atom of oxygen(GO:0016714) |
| 0.3 | 11.8 | GO:0015347 | sodium-independent organic anion transmembrane transporter activity(GO:0015347) |
| 0.3 | 2.3 | GO:0015235 | cobalamin transporter activity(GO:0015235) |
| 0.3 | 0.8 | GO:0080023 | 3R-hydroxyacyl-CoA dehydratase activity(GO:0080023) |
| 0.3 | 1.0 | GO:0016155 | formyltetrahydrofolate dehydrogenase activity(GO:0016155) |
| 0.2 | 3.5 | GO:0004075 | biotin carboxylase activity(GO:0004075) |
| 0.2 | 2.3 | GO:0004687 | myosin light chain kinase activity(GO:0004687) |
| 0.2 | 7.8 | GO:0071949 | FAD binding(GO:0071949) |
| 0.2 | 3.7 | GO:0016290 | palmitoyl-CoA hydrolase activity(GO:0016290) |
| 0.2 | 2.7 | GO:0038132 | neuregulin binding(GO:0038132) |
| 0.2 | 0.6 | GO:0000253 | 3-keto sterol reductase activity(GO:0000253) |
| 0.2 | 1.7 | GO:0005497 | androgen binding(GO:0005497) |
| 0.2 | 0.7 | GO:0019770 | IgG receptor activity(GO:0019770) |
| 0.2 | 0.7 | GO:0004306 | ethanolamine-phosphate cytidylyltransferase activity(GO:0004306) |
| 0.2 | 0.5 | GO:0046715 | borate transmembrane transporter activity(GO:0046715) |
| 0.2 | 3.3 | GO:0003995 | acyl-CoA dehydrogenase activity(GO:0003995) |
| 0.2 | 0.5 | GO:0042947 | glucoside transmembrane transporter activity(GO:0042947) |
| 0.2 | 1.9 | GO:0003810 | protein-glutamine gamma-glutamyltransferase activity(GO:0003810) |
| 0.2 | 0.8 | GO:0016971 | flavin-linked sulfhydryl oxidase activity(GO:0016971) |
| 0.2 | 2.0 | GO:0004300 | enoyl-CoA hydratase activity(GO:0004300) |
| 0.2 | 0.5 | GO:0016154 | thymidine phosphorylase activity(GO:0009032) pyrimidine-nucleoside phosphorylase activity(GO:0016154) |
| 0.1 | 0.6 | GO:0035501 | MH1 domain binding(GO:0035501) |
| 0.1 | 1.3 | GO:0098821 | BMP receptor activity(GO:0098821) |
| 0.1 | 4.1 | GO:0034185 | apolipoprotein binding(GO:0034185) |
| 0.1 | 0.4 | GO:0016497 | substance K receptor activity(GO:0016497) |
| 0.1 | 1.2 | GO:0004176 | ATP-dependent peptidase activity(GO:0004176) |
| 0.1 | 4.7 | GO:0051787 | misfolded protein binding(GO:0051787) |
| 0.1 | 3.6 | GO:0016864 | protein disulfide isomerase activity(GO:0003756) intramolecular oxidoreductase activity, transposing S-S bonds(GO:0016864) |
| 0.1 | 0.8 | GO:0052851 | cupric reductase activity(GO:0008823) ferric-chelate reductase (NADPH) activity(GO:0052851) |
| 0.1 | 3.8 | GO:0045294 | alpha-catenin binding(GO:0045294) |
| 0.1 | 2.5 | GO:0001054 | RNA polymerase I activity(GO:0001054) |
| 0.1 | 0.3 | GO:0031783 | corticotropin hormone receptor binding(GO:0031780) type 5 melanocortin receptor binding(GO:0031783) |
| 0.1 | 2.2 | GO:0016638 | oxidoreductase activity, acting on the CH-NH2 group of donors(GO:0016638) |
| 0.1 | 1.0 | GO:0047756 | chondroitin 4-sulfotransferase activity(GO:0047756) |
| 0.1 | 0.7 | GO:0008508 | bile acid:sodium symporter activity(GO:0008508) |
| 0.1 | 1.0 | GO:0008865 | glucokinase activity(GO:0004340) hexokinase activity(GO:0004396) fructokinase activity(GO:0008865) mannokinase activity(GO:0019158) |
| 0.1 | 1.2 | GO:0004969 | histamine receptor activity(GO:0004969) |
| 0.1 | 1.8 | GO:0004030 | aldehyde dehydrogenase [NAD(P)+] activity(GO:0004030) |
| 0.1 | 32.7 | GO:0004252 | serine-type endopeptidase activity(GO:0004252) |
| 0.1 | 3.5 | GO:0017081 | chloride channel regulator activity(GO:0017081) |
| 0.1 | 1.1 | GO:0015165 | pyrimidine nucleotide-sugar transmembrane transporter activity(GO:0015165) |
| 0.1 | 3.5 | GO:0008198 | ferrous iron binding(GO:0008198) |
| 0.1 | 0.7 | GO:0004645 | phosphorylase activity(GO:0004645) |
| 0.1 | 1.2 | GO:0052650 | NADP-retinol dehydrogenase activity(GO:0052650) |
| 0.1 | 0.8 | GO:0047617 | acyl-CoA hydrolase activity(GO:0047617) |
| 0.1 | 2.2 | GO:0070006 | metalloaminopeptidase activity(GO:0070006) |
| 0.1 | 0.4 | GO:0005173 | stem cell factor receptor binding(GO:0005173) |
| 0.1 | 2.4 | GO:0004033 | aldo-keto reductase (NADP) activity(GO:0004033) |
| 0.1 | 0.8 | GO:0016286 | small conductance calcium-activated potassium channel activity(GO:0016286) |
| 0.1 | 0.3 | GO:0002046 | opsin binding(GO:0002046) |
| 0.1 | 7.8 | GO:0019003 | GDP binding(GO:0019003) |
| 0.1 | 5.6 | GO:0016836 | hydro-lyase activity(GO:0016836) |
| 0.1 | 0.3 | GO:0015375 | glycine:sodium symporter activity(GO:0015375) |
| 0.1 | 2.2 | GO:0017049 | GTP-Rho binding(GO:0017049) |
| 0.1 | 2.4 | GO:0098641 | cadherin binding involved in cell-cell adhesion(GO:0098641) |
| 0.1 | 0.9 | GO:0070181 | small ribosomal subunit rRNA binding(GO:0070181) |
| 0.1 | 1.7 | GO:0030215 | semaphorin receptor binding(GO:0030215) |
| 0.1 | 1.2 | GO:0036374 | glutathione hydrolase activity(GO:0036374) |
| 0.1 | 0.5 | GO:0004996 | thyroid-stimulating hormone receptor activity(GO:0004996) |
| 0.1 | 0.9 | GO:0051525 | NFAT protein binding(GO:0051525) |
| 0.1 | 6.2 | GO:0005507 | copper ion binding(GO:0005507) |
| 0.1 | 0.1 | GO:0018685 | alkane 1-monooxygenase activity(GO:0018685) |
| 0.1 | 0.8 | GO:0032454 | histone demethylase activity (H3-K9 specific)(GO:0032454) |
| 0.1 | 2.3 | GO:0001530 | lipopolysaccharide binding(GO:0001530) |
| 0.1 | 0.8 | GO:0004128 | cytochrome-b5 reductase activity, acting on NAD(P)H(GO:0004128) |
| 0.1 | 0.4 | GO:0004144 | diacylglycerol O-acyltransferase activity(GO:0004144) |
| 0.1 | 1.1 | GO:0019215 | intermediate filament binding(GO:0019215) |
| 0.1 | 1.3 | GO:0051864 | histone demethylase activity (H3-K36 specific)(GO:0051864) |
| 0.1 | 0.3 | GO:0019828 | aspartic-type endopeptidase inhibitor activity(GO:0019828) |
| 0.1 | 2.2 | GO:0004181 | metallocarboxypeptidase activity(GO:0004181) |
| 0.1 | 8.2 | GO:0004867 | serine-type endopeptidase inhibitor activity(GO:0004867) |
| 0.0 | 0.2 | GO:0004441 | inositol-1,4-bisphosphate 1-phosphatase activity(GO:0004441) inositol-1,3,4-trisphosphate 1-phosphatase activity(GO:0052829) |
| 0.0 | 2.2 | GO:0003951 | NAD+ kinase activity(GO:0003951) |
| 0.0 | 0.6 | GO:0005005 | transmembrane-ephrin receptor activity(GO:0005005) |
| 0.0 | 0.5 | GO:0001665 | alpha-N-acetylgalactosaminide alpha-2,6-sialyltransferase activity(GO:0001665) |
| 0.0 | 0.5 | GO:0017150 | tRNA dihydrouridine synthase activity(GO:0017150) |
| 0.0 | 0.4 | GO:0033857 | diphosphoinositol-pentakisphosphate kinase activity(GO:0033857) |
| 0.0 | 0.4 | GO:0036402 | proteasome-activating ATPase activity(GO:0036402) |
| 0.0 | 0.4 | GO:0016907 | G-protein coupled acetylcholine receptor activity(GO:0016907) |
| 0.0 | 2.0 | GO:0004198 | calcium-dependent cysteine-type endopeptidase activity(GO:0004198) |
| 0.0 | 0.3 | GO:0047288 | monosialoganglioside sialyltransferase activity(GO:0047288) |
| 0.0 | 1.3 | GO:0005527 | macrolide binding(GO:0005527) FK506 binding(GO:0005528) |
| 0.0 | 0.5 | GO:0004118 | cGMP-stimulated cyclic-nucleotide phosphodiesterase activity(GO:0004118) |
| 0.0 | 3.2 | GO:0005160 | transforming growth factor beta receptor binding(GO:0005160) |
| 0.0 | 0.4 | GO:0016406 | carnitine O-acyltransferase activity(GO:0016406) |
| 0.0 | 3.3 | GO:0004520 | endodeoxyribonuclease activity(GO:0004520) |
| 0.0 | 0.1 | GO:0070224 | sulfide:quinone oxidoreductase activity(GO:0070224) |
| 0.0 | 0.5 | GO:0004321 | fatty-acyl-CoA synthase activity(GO:0004321) |
| 0.0 | 0.8 | GO:0019871 | sodium channel inhibitor activity(GO:0019871) |
| 0.0 | 1.0 | GO:0016875 | aminoacyl-tRNA ligase activity(GO:0004812) ligase activity, forming carbon-oxygen bonds(GO:0016875) ligase activity, forming aminoacyl-tRNA and related compounds(GO:0016876) |
| 0.0 | 1.1 | GO:0004602 | glutathione peroxidase activity(GO:0004602) |
| 0.0 | 1.2 | GO:0004435 | phosphatidylinositol phospholipase C activity(GO:0004435) |
| 0.0 | 2.8 | GO:0016879 | ligase activity, forming carbon-nitrogen bonds(GO:0016879) |
| 0.0 | 0.9 | GO:0044769 | ATPase activity, coupled to transmembrane movement of ions, rotational mechanism(GO:0044769) proton-transporting ATPase activity, rotational mechanism(GO:0046961) |
| 0.0 | 0.2 | GO:0016744 | transferase activity, transferring aldehyde or ketonic groups(GO:0016744) |
| 0.0 | 1.3 | GO:0005385 | zinc ion transmembrane transporter activity(GO:0005385) |
| 0.0 | 1.7 | GO:0046875 | ephrin receptor binding(GO:0046875) |
| 0.0 | 1.2 | GO:0005540 | hyaluronic acid binding(GO:0005540) |
| 0.0 | 0.2 | GO:0005166 | neurotrophin p75 receptor binding(GO:0005166) |
| 0.0 | 0.7 | GO:0008510 | sodium:bicarbonate symporter activity(GO:0008510) |
| 0.0 | 0.7 | GO:0048018 | receptor agonist activity(GO:0048018) |
| 0.0 | 1.0 | GO:0019198 | transmembrane receptor protein tyrosine phosphatase activity(GO:0005001) transmembrane receptor protein phosphatase activity(GO:0019198) |
| 0.0 | 0.6 | GO:0022848 | acetylcholine-gated cation channel activity(GO:0022848) |
| 0.0 | 0.1 | GO:0003839 | gamma-glutamylcyclotransferase activity(GO:0003839) |
| 0.0 | 0.1 | GO:0003854 | 3-beta-hydroxy-delta5-steroid dehydrogenase activity(GO:0003854) |
| 0.0 | 0.2 | GO:0043184 | vascular endothelial growth factor receptor 2 binding(GO:0043184) |
| 0.0 | 0.4 | GO:0048407 | platelet-derived growth factor binding(GO:0048407) |
| 0.0 | 0.2 | GO:0033170 | DNA clamp loader activity(GO:0003689) protein-DNA loading ATPase activity(GO:0033170) |
| 0.0 | 0.1 | GO:0030911 | TPR domain binding(GO:0030911) |
| 0.0 | 2.0 | GO:0008238 | exopeptidase activity(GO:0008238) |
| 0.0 | 0.5 | GO:0008483 | transaminase activity(GO:0008483) |
| 0.0 | 0.3 | GO:0015386 | potassium:proton antiporter activity(GO:0015386) |
| 0.0 | 0.1 | GO:0004694 | eukaryotic translation initiation factor 2alpha kinase activity(GO:0004694) |
| 0.0 | 0.2 | GO:0005132 | type I interferon receptor binding(GO:0005132) |
| 0.0 | 1.2 | GO:0030507 | spectrin binding(GO:0030507) |
| 0.0 | 0.9 | GO:0005158 | insulin receptor binding(GO:0005158) |
| 0.0 | 0.1 | GO:0004046 | aminoacylase activity(GO:0004046) |
| 0.0 | 0.2 | GO:0008503 | benzodiazepine receptor activity(GO:0008503) |
| 0.0 | 0.1 | GO:0004706 | JUN kinase kinase kinase activity(GO:0004706) |
| 0.0 | 0.4 | GO:0015002 | cytochrome-c oxidase activity(GO:0004129) heme-copper terminal oxidase activity(GO:0015002) oxidoreductase activity, acting on a heme group of donors(GO:0016675) oxidoreductase activity, acting on a heme group of donors, oxygen as acceptor(GO:0016676) |
| 0.0 | 0.6 | GO:0019707 | protein-cysteine S-palmitoyltransferase activity(GO:0019706) protein-cysteine S-acyltransferase activity(GO:0019707) |
| 0.0 | 0.2 | GO:0003993 | acid phosphatase activity(GO:0003993) |
| 0.0 | 0.3 | GO:0001871 | pattern binding(GO:0001871) polysaccharide binding(GO:0030247) |
| 0.0 | 0.2 | GO:0030297 | transmembrane receptor protein tyrosine kinase activator activity(GO:0030297) |
| 0.0 | 0.0 | GO:0016436 | rRNA (uridine-2'-O-)-methyltransferase activity(GO:0008650) rRNA (uridine) methyltransferase activity(GO:0016436) |
| 0.0 | 0.3 | GO:0005109 | frizzled binding(GO:0005109) |
| 0.0 | 0.4 | GO:0015248 | sterol transporter activity(GO:0015248) |
Gene overrepresentation in curated gene sets: canonical pathways category:
| Log-likelihood per target | Total log-likelihood | Term | Description |
|---|---|---|---|
| 0.3 | 23.7 | PID HNF3B PATHWAY | FOXA2 and FOXA3 transcription factor networks |
| 0.2 | 7.3 | ST G ALPHA S PATHWAY | G alpha s Pathway |
| 0.2 | 5.2 | PID ERB GENOMIC PATHWAY | Validated nuclear estrogen receptor beta network |
| 0.2 | 7.3 | PID ERBB NETWORK PATHWAY | ErbB receptor signaling network |
| 0.1 | 11.5 | PID HNF3A PATHWAY | FOXA1 transcription factor network |
| 0.1 | 8.2 | PID IL1 PATHWAY | IL1-mediated signaling events |
| 0.1 | 35.2 | NABA ECM REGULATORS | Genes encoding enzymes and their regulators involved in the remodeling of the extracellular matrix |
| 0.1 | 6.8 | PID ATF2 PATHWAY | ATF-2 transcription factor network |
| 0.1 | 0.9 | PID RET PATHWAY | Signaling events regulated by Ret tyrosine kinase |
| 0.1 | 1.5 | PID INTEGRIN4 PATHWAY | Alpha6 beta4 integrin-ligand interactions |
| 0.1 | 0.7 | PID ERBB2 ERBB3 PATHWAY | ErbB2/ErbB3 signaling events |
| 0.0 | 5.8 | PID HIF1 TFPATHWAY | HIF-1-alpha transcription factor network |
| 0.0 | 1.1 | PID CIRCADIAN PATHWAY | Circadian rhythm pathway |
| 0.0 | 2.1 | PID EPHA FWDPATHWAY | EPHA forward signaling |
| 0.0 | 1.5 | PID INTEGRIN2 PATHWAY | Beta2 integrin cell surface interactions |
| 0.0 | 0.2 | PID MET PATHWAY | Signaling events mediated by Hepatocyte Growth Factor Receptor (c-Met) |
| 0.0 | 1.0 | PID AR NONGENOMIC PATHWAY | Nongenotropic Androgen signaling |
| 0.0 | 2.7 | PID MYC REPRESS PATHWAY | Validated targets of C-MYC transcriptional repression |
| 0.0 | 0.7 | PID NECTIN PATHWAY | Nectin adhesion pathway |
| 0.0 | 5.5 | NABA ECM AFFILIATED | Genes encoding proteins affiliated structurally or functionally to extracellular matrix proteins |
| 0.0 | 1.2 | NABA PROTEOGLYCANS | Genes encoding proteoglycans |
| 0.0 | 0.6 | PID WNT SIGNALING PATHWAY | Wnt signaling network |
| 0.0 | 0.7 | PID ALK1 PATHWAY | ALK1 signaling events |
| 0.0 | 0.9 | PID HES HEY PATHWAY | Notch-mediated HES/HEY network |
Gene overrepresentation in curated gene sets: REACTOME pathways category:
| Log-likelihood per target | Total log-likelihood | Term | Description |
|---|---|---|---|
| 1.9 | 33.7 | REACTOME XENOBIOTICS | Genes involved in Xenobiotics |
| 1.3 | 26.5 | REACTOME GAMMA CARBOXYLATION TRANSPORT AND AMINO TERMINAL CLEAVAGE OF PROTEINS | Genes involved in Gamma-carboxylation, transport, and amino-terminal cleavage of proteins |
| 0.7 | 18.3 | REACTOME CHYLOMICRON MEDIATED LIPID TRANSPORT | Genes involved in Chylomicron-mediated lipid transport |
| 0.7 | 16.6 | REACTOME INITIAL TRIGGERING OF COMPLEMENT | Genes involved in Initial triggering of complement |
| 0.5 | 8.0 | REACTOME SYNTHESIS OF BILE ACIDS AND BILE SALTS VIA 24 HYDROXYCHOLESTEROL | Genes involved in Synthesis of bile acids and bile salts via 24-hydroxycholesterol |
| 0.5 | 7.1 | REACTOME TRYPTOPHAN CATABOLISM | Genes involved in Tryptophan catabolism |
| 0.5 | 5.1 | REACTOME COMMON PATHWAY | Genes involved in Common Pathway |
| 0.3 | 4.2 | REACTOME GLYCOPROTEIN HORMONES | Genes involved in Glycoprotein hormones |
| 0.3 | 7.4 | REACTOME REGULATION OF INSULIN LIKE GROWTH FACTOR IGF ACTIVITY BY INSULIN LIKE GROWTH FACTOR BINDING PROTEINS IGFBPS | Genes involved in Regulation of Insulin-like Growth Factor (IGF) Activity by Insulin-like Growth Factor Binding Proteins (IGFBPs) |
| 0.2 | 5.5 | REACTOME TRANSPORT OF ORGANIC ANIONS | Genes involved in Transport of organic anions |
| 0.2 | 4.0 | REACTOME CALNEXIN CALRETICULIN CYCLE | Genes involved in Calnexin/calreticulin cycle |
| 0.2 | 13.1 | REACTOME REGULATION OF GENE EXPRESSION IN BETA CELLS | Genes involved in Regulation of gene expression in beta cells |
| 0.2 | 6.0 | REACTOME COMPLEMENT CASCADE | Genes involved in Complement cascade |
| 0.2 | 4.1 | REACTOME MITOCHONDRIAL FATTY ACID BETA OXIDATION | Genes involved in Mitochondrial Fatty Acid Beta-Oxidation |
| 0.2 | 8.2 | REACTOME CHOLESTEROL BIOSYNTHESIS | Genes involved in Cholesterol biosynthesis |
| 0.2 | 3.9 | REACTOME SYNTHESIS OF PE | Genes involved in Synthesis of PE |
| 0.2 | 5.0 | REACTOME SULFUR AMINO ACID METABOLISM | Genes involved in Sulfur amino acid metabolism |
| 0.2 | 3.6 | REACTOME REGULATION OF BETA CELL DEVELOPMENT | Genes involved in Regulation of beta-cell development |
| 0.1 | 4.8 | REACTOME AMINO ACID SYNTHESIS AND INTERCONVERSION TRANSAMINATION | Genes involved in Amino acid synthesis and interconversion (transamination) |
| 0.1 | 3.0 | REACTOME METABOLISM OF POLYAMINES | Genes involved in Metabolism of polyamines |
| 0.1 | 3.9 | REACTOME ORGANIC CATION ANION ZWITTERION TRANSPORT | Genes involved in Organic cation/anion/zwitterion transport |
| 0.1 | 4.4 | REACTOME GLYCOGEN BREAKDOWN GLYCOGENOLYSIS | Genes involved in Glycogen breakdown (glycogenolysis) |
| 0.1 | 2.1 | REACTOME PURINE CATABOLISM | Genes involved in Purine catabolism |
| 0.1 | 24.2 | REACTOME METABOLISM OF AMINO ACIDS AND DERIVATIVES | Genes involved in Metabolism of amino acids and derivatives |
| 0.1 | 1.6 | REACTOME ABACAVIR TRANSPORT AND METABOLISM | Genes involved in Abacavir transport and metabolism |
| 0.1 | 5.4 | REACTOME TIGHT JUNCTION INTERACTIONS | Genes involved in Tight junction interactions |
| 0.1 | 3.1 | REACTOME SHC1 EVENTS IN EGFR SIGNALING | Genes involved in SHC1 events in EGFR signaling |
| 0.1 | 1.8 | REACTOME ETHANOL OXIDATION | Genes involved in Ethanol oxidation |
| 0.1 | 8.2 | REACTOME IL1 SIGNALING | Genes involved in Interleukin-1 signaling |
| 0.1 | 2.5 | REACTOME ABCA TRANSPORTERS IN LIPID HOMEOSTASIS | Genes involved in ABCA transporters in lipid homeostasis |
| 0.1 | 1.6 | REACTOME SYNTHESIS OF SUBSTRATES IN N GLYCAN BIOSYTHESIS | Genes involved in Synthesis of substrates in N-glycan biosythesis |
| 0.1 | 2.9 | REACTOME DOWNREGULATION OF ERBB2 ERBB3 SIGNALING | Genes involved in Downregulation of ERBB2:ERBB3 signaling |
| 0.1 | 3.1 | REACTOME PYRUVATE METABOLISM | Genes involved in Pyruvate metabolism |
| 0.1 | 6.3 | REACTOME GLYCOSPHINGOLIPID METABOLISM | Genes involved in Glycosphingolipid metabolism |
| 0.1 | 2.0 | REACTOME VIRAL MESSENGER RNA SYNTHESIS | Genes involved in Viral Messenger RNA Synthesis |
| 0.1 | 5.5 | REACTOME GLUCONEOGENESIS | Genes involved in Gluconeogenesis |
| 0.1 | 1.3 | REACTOME REVERSIBLE HYDRATION OF CARBON DIOXIDE | Genes involved in Reversible Hydration of Carbon Dioxide |
| 0.1 | 2.5 | REACTOME TRANSPORT OF VITAMINS NUCLEOSIDES AND RELATED MOLECULES | Genes involved in Transport of vitamins, nucleosides, and related molecules |
| 0.1 | 8.5 | REACTOME RESPONSE TO ELEVATED PLATELET CYTOSOLIC CA2 | Genes involved in Response to elevated platelet cytosolic Ca2+ |
| 0.1 | 4.1 | REACTOME AMINO ACID TRANSPORT ACROSS THE PLASMA MEMBRANE | Genes involved in Amino acid transport across the plasma membrane |
| 0.1 | 1.3 | REACTOME SYNTHESIS OF PC | Genes involved in Synthesis of PC |
| 0.0 | 0.5 | REACTOME HORMONE LIGAND BINDING RECEPTORS | Genes involved in Hormone ligand-binding receptors |
| 0.0 | 2.1 | REACTOME CYTOCHROME P450 ARRANGED BY SUBSTRATE TYPE | Genes involved in Cytochrome P450 - arranged by substrate type |
| 0.0 | 0.9 | REACTOME SYNTHESIS SECRETION AND INACTIVATION OF GIP | Genes involved in Synthesis, Secretion, and Inactivation of Glucose-dependent Insulinotropic Polypeptide (GIP) |
| 0.0 | 0.5 | REACTOME PYRIMIDINE CATABOLISM | Genes involved in Pyrimidine catabolism |
| 0.0 | 1.0 | REACTOME MITOCHONDRIAL TRNA AMINOACYLATION | Genes involved in Mitochondrial tRNA aminoacylation |
| 0.0 | 1.3 | REACTOME ZINC TRANSPORTERS | Genes involved in Zinc transporters |
| 0.0 | 6.3 | REACTOME PPARA ACTIVATES GENE EXPRESSION | Genes involved in PPARA Activates Gene Expression |
| 0.0 | 0.8 | REACTOME HS GAG DEGRADATION | Genes involved in HS-GAG degradation |
| 0.0 | 0.8 | REACTOME SYNTHESIS OF GLYCOSYLPHOSPHATIDYLINOSITOL GPI | Genes involved in Synthesis of glycosylphosphatidylinositol (GPI) |
| 0.0 | 1.0 | REACTOME SEMA4D INDUCED CELL MIGRATION AND GROWTH CONE COLLAPSE | Genes involved in Sema4D induced cell migration and growth-cone collapse |
| 0.0 | 0.3 | REACTOME CYTOSOLIC TRNA AMINOACYLATION | Genes involved in Cytosolic tRNA aminoacylation |
| 0.0 | 1.3 | REACTOME DCC MEDIATED ATTRACTIVE SIGNALING | Genes involved in DCC mediated attractive signaling |
| 0.0 | 1.7 | REACTOME MITOCHONDRIAL PROTEIN IMPORT | Genes involved in Mitochondrial Protein Import |
| 0.0 | 0.6 | REACTOME PRESYNAPTIC NICOTINIC ACETYLCHOLINE RECEPTORS | Genes involved in Presynaptic nicotinic acetylcholine receptors |
| 0.0 | 0.9 | REACTOME INSULIN RECEPTOR RECYCLING | Genes involved in Insulin receptor recycling |
| 0.0 | 0.4 | REACTOME DEVELOPMENTAL BIOLOGY | Genes involved in Developmental Biology |
| 0.0 | 0.4 | REACTOME SEMA3A PLEXIN REPULSION SIGNALING BY INHIBITING INTEGRIN ADHESION | Genes involved in SEMA3A-Plexin repulsion signaling by inhibiting Integrin adhesion |
| 0.0 | 1.0 | REACTOME CHONDROITIN SULFATE BIOSYNTHESIS | Genes involved in Chondroitin sulfate biosynthesis |
| 0.0 | 2.0 | REACTOME METABOLISM OF VITAMINS AND COFACTORS | Genes involved in Metabolism of vitamins and cofactors |
| 0.0 | 0.7 | REACTOME POST CHAPERONIN TUBULIN FOLDING PATHWAY | Genes involved in Post-chaperonin tubulin folding pathway |
| 0.0 | 1.1 | REACTOME INTERACTION BETWEEN L1 AND ANKYRINS | Genes involved in Interaction between L1 and Ankyrins |
| 0.0 | 1.1 | REACTOME CELL CELL JUNCTION ORGANIZATION | Genes involved in Cell-cell junction organization |
| 0.0 | 0.3 | REACTOME NA CL DEPENDENT NEUROTRANSMITTER TRANSPORTERS | Genes involved in Na+/Cl- dependent neurotransmitter transporters |
| 0.0 | 0.2 | REACTOME SIGNALLING TO P38 VIA RIT AND RIN | Genes involved in Signalling to p38 via RIT and RIN |
| 0.0 | 0.2 | REACTOME G PROTEIN ACTIVATION | Genes involved in G-protein activation |
| 0.0 | 0.3 | REACTOME ABC FAMILY PROTEINS MEDIATED TRANSPORT | Genes involved in ABC-family proteins mediated transport |
| 0.0 | 0.7 | REACTOME AMINE LIGAND BINDING RECEPTORS | Genes involved in Amine ligand-binding receptors |
| 0.0 | 0.4 | REACTOME PEROXISOMAL LIPID METABOLISM | Genes involved in Peroxisomal lipid metabolism |
| 0.0 | 0.4 | REACTOME SIGNALING BY HIPPO | Genes involved in Signaling by Hippo |
| 0.0 | 0.2 | REACTOME ELEVATION OF CYTOSOLIC CA2 LEVELS | Genes involved in Elevation of cytosolic Ca2+ levels |
| 0.0 | 1.2 | REACTOME IMMUNOREGULATORY INTERACTIONS BETWEEN A LYMPHOID AND A NON LYMPHOID CELL | Genes involved in Immunoregulatory interactions between a Lymphoid and a non-Lymphoid cell |
| 0.0 | 0.2 | REACTOME POL SWITCHING | Genes involved in Polymerase switching |