Project
Illumina Body Map 2 (GSE30611)
Navigation
Downloads
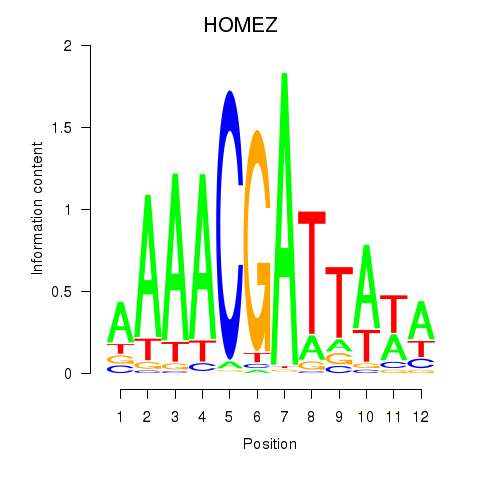
Results for HOMEZ
Z-value: 1.44
Motif logo
Transcription factors associated with HOMEZ
| Gene Symbol | Gene ID | Gene Info |
|---|---|---|
|
HOMEZ
|
ENSG00000215271.9 | homeobox and leucine zipper encoding |
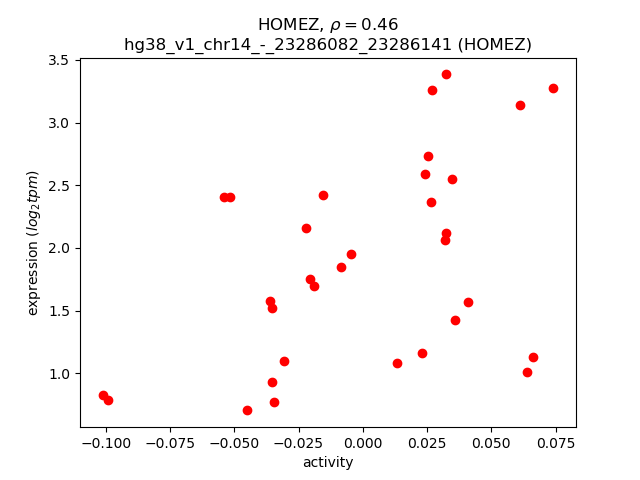
Activity-expression correlation:
| Gene | Promoter | Pearson corr. coef. | P-value | Plot |
|---|---|---|---|---|
| HOMEZ | hg38_v1_chr14_-_23286082_23286141 | 0.46 | 8.4e-03 | Click! |
Activity profile of HOMEZ motif
Sorted Z-values of HOMEZ motif
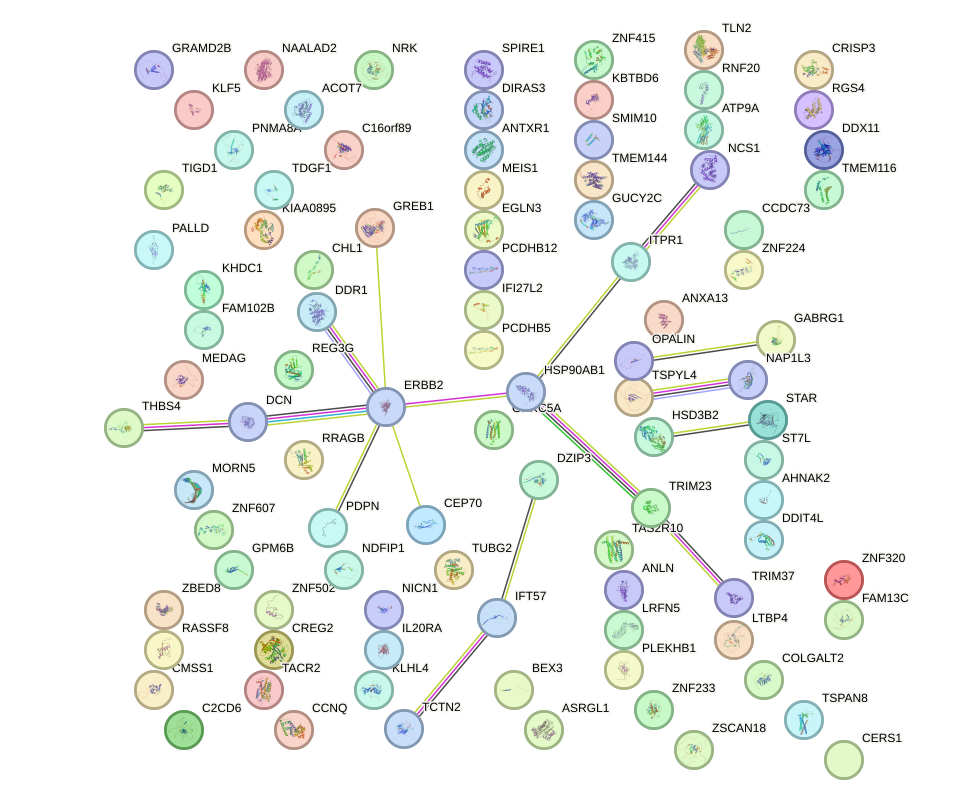
Network of associatons between targets according to the STRING database.
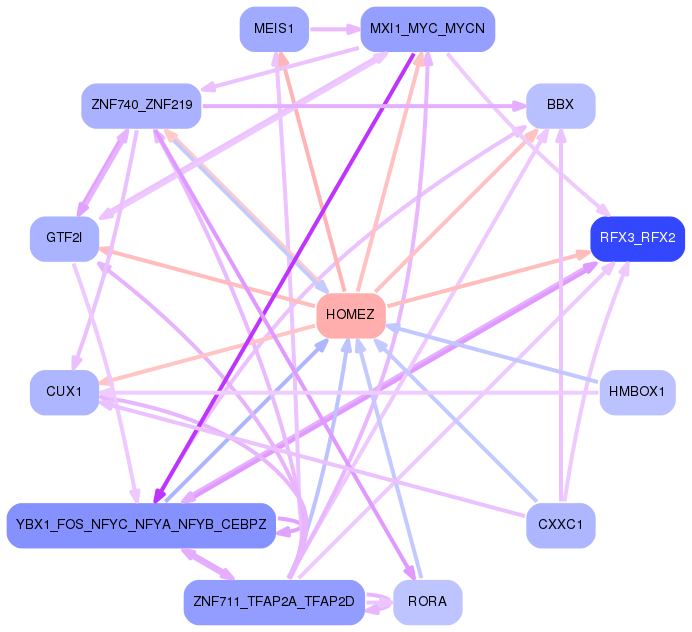
First level regulatory network of HOMEZ
Gene Ontology Analysis
Gene overrepresentation in biological process category:
| Log-likelihood per target | Total log-likelihood | Term | Description |
|---|---|---|---|
| 1.0 | 3.0 | GO:0060721 | spongiotrophoblast cell proliferation(GO:0060720) regulation of spongiotrophoblast cell proliferation(GO:0060721) cell proliferation involved in embryonic placenta development(GO:0060722) regulation of cell proliferation involved in embryonic placenta development(GO:0060723) |
| 1.0 | 2.9 | GO:0044278 | cell wall disruption in other organism(GO:0044278) |
| 0.9 | 3.5 | GO:0031106 | septin ring assembly(GO:0000921) septin ring organization(GO:0031106) |
| 0.8 | 3.9 | GO:0034334 | adherens junction maintenance(GO:0034334) |
| 0.7 | 2.2 | GO:1901389 | regulation of transforming growth factor beta activation(GO:1901388) negative regulation of transforming growth factor beta activation(GO:1901389) |
| 0.6 | 1.9 | GO:0018963 | phthalate metabolic process(GO:0018963) |
| 0.5 | 1.5 | GO:0036353 | histone H2A-K119 monoubiquitination(GO:0036353) |
| 0.5 | 3.3 | GO:2001166 | regulation of histone H2B ubiquitination(GO:2001166) positive regulation of histone H2B ubiquitination(GO:2001168) |
| 0.5 | 2.4 | GO:1901202 | negative regulation of extracellular matrix assembly(GO:1901202) |
| 0.4 | 1.3 | GO:0072720 | response to dithiothreitol(GO:0072720) |
| 0.4 | 1.3 | GO:0006481 | C-terminal protein methylation(GO:0006481) |
| 0.4 | 1.7 | GO:0036116 | medium-chain fatty-acyl-CoA catabolic process(GO:0036114) long-chain fatty-acyl-CoA catabolic process(GO:0036116) palmitic acid metabolic process(GO:1900533) palmitic acid biosynthetic process(GO:1900535) |
| 0.4 | 1.3 | GO:1990764 | regulation of myofibroblast contraction(GO:1904328) myofibroblast contraction(GO:1990764) |
| 0.4 | 4.3 | GO:0033088 | negative regulation of immature T cell proliferation in thymus(GO:0033088) |
| 0.4 | 1.9 | GO:0035106 | operant conditioning(GO:0035106) |
| 0.3 | 1.0 | GO:0051877 | pigment granule aggregation in cell center(GO:0051877) |
| 0.3 | 1.0 | GO:0097051 | establishment of protein localization to endoplasmic reticulum membrane(GO:0097051) |
| 0.3 | 6.4 | GO:0042340 | keratan sulfate catabolic process(GO:0042340) |
| 0.3 | 0.9 | GO:0006533 | aspartate catabolic process(GO:0006533) |
| 0.3 | 1.5 | GO:0071603 | endothelial cell-cell adhesion(GO:0071603) |
| 0.3 | 3.2 | GO:0050882 | voluntary musculoskeletal movement(GO:0050882) |
| 0.3 | 0.8 | GO:0034963 | box C/D snoRNA 3'-end processing(GO:0000494) box C/D snoRNA metabolic process(GO:0033967) box C/D snoRNA processing(GO:0034963) histone glutamine methylation(GO:1990258) |
| 0.3 | 5.1 | GO:0061302 | smooth muscle cell-matrix adhesion(GO:0061302) |
| 0.2 | 0.7 | GO:0006597 | spermine biosynthetic process(GO:0006597) |
| 0.2 | 0.7 | GO:0003064 | regulation of heart rate by hormone(GO:0003064) negative regulation of peptidyl-serine dephosphorylation(GO:1902309) |
| 0.2 | 2.6 | GO:2000324 | positive regulation of glucocorticoid receptor signaling pathway(GO:2000324) |
| 0.2 | 0.9 | GO:0072023 | thick ascending limb development(GO:0072023) metanephric thick ascending limb development(GO:0072233) |
| 0.2 | 0.7 | GO:0051083 | 'de novo' cotranslational protein folding(GO:0051083) |
| 0.2 | 0.7 | GO:0042144 | vacuole fusion, non-autophagic(GO:0042144) |
| 0.2 | 2.8 | GO:0032534 | regulation of microvillus assembly(GO:0032534) |
| 0.2 | 2.5 | GO:0018401 | peptidyl-proline hydroxylation to 4-hydroxy-L-proline(GO:0018401) |
| 0.2 | 0.7 | GO:0048496 | maintenance of organ identity(GO:0048496) |
| 0.2 | 0.5 | GO:0048213 | Golgi vesicle prefusion complex stabilization(GO:0048213) |
| 0.2 | 2.4 | GO:0051581 | negative regulation of neurotransmitter uptake(GO:0051581) regulation of serotonin uptake(GO:0051611) negative regulation of serotonin uptake(GO:0051612) |
| 0.2 | 0.5 | GO:0018312 | peptidyl-serine ADP-ribosylation(GO:0018312) |
| 0.2 | 0.7 | GO:0099543 | cytoskeletal matrix organization at active zone(GO:0048789) neurexin clustering involved in presynaptic membrane assembly(GO:0097115) retrograde trans-synaptic signaling by soluble gas(GO:0098923) retrograde trans-synaptic signaling by trans-synaptic protein complex(GO:0098942) trans-synaptic signaling by soluble gas(GO:0099543) |
| 0.2 | 0.7 | GO:0010520 | regulation of reciprocal meiotic recombination(GO:0010520) |
| 0.2 | 0.7 | GO:1902683 | regulation of receptor localization to synapse(GO:1902683) |
| 0.2 | 1.1 | GO:0048294 | negative regulation of isotype switching to IgE isotypes(GO:0048294) |
| 0.2 | 1.2 | GO:0044791 | modulation by host of viral release from host cell(GO:0044789) positive regulation by host of viral release from host cell(GO:0044791) |
| 0.2 | 1.3 | GO:0099590 | neurotransmitter receptor internalization(GO:0099590) |
| 0.2 | 0.7 | GO:2000639 | regulation of SREBP signaling pathway(GO:2000638) negative regulation of SREBP signaling pathway(GO:2000639) |
| 0.2 | 1.1 | GO:1900063 | regulation of peroxisome organization(GO:1900063) |
| 0.2 | 0.7 | GO:0000915 | assembly of actomyosin apparatus involved in cytokinesis(GO:0000912) actomyosin contractile ring assembly(GO:0000915) actomyosin contractile ring organization(GO:0044837) |
| 0.2 | 0.8 | GO:1902513 | regulation of organelle transport along microtubule(GO:1902513) |
| 0.2 | 0.5 | GO:0072312 | metanephric glomerular epithelium development(GO:0072244) metanephric glomerular visceral epithelial cell differentiation(GO:0072248) metanephric glomerular visceral epithelial cell development(GO:0072249) metanephric glomerular epithelial cell differentiation(GO:0072312) metanephric glomerular epithelial cell development(GO:0072313) |
| 0.2 | 0.6 | GO:1990167 | protein K6-linked deubiquitination(GO:0044313) protein K27-linked deubiquitination(GO:1990167) |
| 0.1 | 0.4 | GO:0051793 | medium-chain fatty acid catabolic process(GO:0051793) |
| 0.1 | 0.9 | GO:2000984 | regulation of ATP citrate synthase activity(GO:2000983) negative regulation of ATP citrate synthase activity(GO:2000984) |
| 0.1 | 0.6 | GO:0032474 | otolith morphogenesis(GO:0032474) |
| 0.1 | 1.4 | GO:0016560 | protein import into peroxisome matrix, docking(GO:0016560) |
| 0.1 | 1.4 | GO:0006528 | asparagine metabolic process(GO:0006528) |
| 0.1 | 0.7 | GO:1902626 | assembly of large subunit precursor of preribosome(GO:1902626) |
| 0.1 | 2.6 | GO:1900747 | negative regulation of vascular endothelial growth factor signaling pathway(GO:1900747) |
| 0.1 | 0.5 | GO:0040040 | thermosensory behavior(GO:0040040) |
| 0.1 | 0.7 | GO:0014886 | transition between slow and fast fiber(GO:0014886) |
| 0.1 | 3.9 | GO:0003334 | keratinocyte development(GO:0003334) |
| 0.1 | 0.8 | GO:0048254 | snoRNA localization(GO:0048254) |
| 0.1 | 0.7 | GO:0044240 | multicellular organism lipid catabolic process(GO:0044240) |
| 0.1 | 1.3 | GO:0070649 | formin-nucleated actin cable assembly(GO:0070649) |
| 0.1 | 0.8 | GO:0036518 | chemorepulsion of dopaminergic neuron axon(GO:0036518) |
| 0.1 | 1.1 | GO:1990253 | cellular response to leucine starvation(GO:1990253) |
| 0.1 | 0.6 | GO:0010286 | heat acclimation(GO:0010286) cellular heat acclimation(GO:0070370) |
| 0.1 | 0.8 | GO:0090063 | positive regulation of microtubule nucleation(GO:0090063) |
| 0.1 | 2.2 | GO:0001778 | plasma membrane repair(GO:0001778) |
| 0.1 | 2.7 | GO:0006995 | cellular response to nitrogen starvation(GO:0006995) cellular response to nitrogen levels(GO:0043562) |
| 0.1 | 7.4 | GO:0034219 | carbohydrate transmembrane transport(GO:0034219) |
| 0.1 | 0.9 | GO:0048165 | ovarian cumulus expansion(GO:0001550) fused antrum stage(GO:0048165) negative regulation of chondrocyte proliferation(GO:1902731) |
| 0.1 | 0.5 | GO:0030047 | actin modification(GO:0030047) |
| 0.1 | 1.0 | GO:0051026 | chiasma assembly(GO:0051026) |
| 0.1 | 0.8 | GO:2000676 | positive regulation of type B pancreatic cell apoptotic process(GO:2000676) |
| 0.1 | 0.3 | GO:0034471 | endonucleolytic cleavage to generate mature 5'-end of SSU-rRNA from (SSU-rRNA, 5.8S rRNA, LSU-rRNA)(GO:0000472) rRNA 5'-end processing(GO:0000967) ncRNA 5'-end processing(GO:0034471) |
| 0.1 | 0.6 | GO:0021691 | cerebellar Purkinje cell layer maturation(GO:0021691) |
| 0.1 | 1.7 | GO:0035721 | intraciliary retrograde transport(GO:0035721) |
| 0.1 | 0.3 | GO:0002184 | cytoplasmic translational termination(GO:0002184) |
| 0.1 | 2.0 | GO:0050812 | regulation of acyl-CoA biosynthetic process(GO:0050812) |
| 0.1 | 4.1 | GO:0006349 | regulation of gene expression by genetic imprinting(GO:0006349) |
| 0.1 | 0.8 | GO:0046600 | negative regulation of centriole replication(GO:0046600) |
| 0.1 | 0.3 | GO:2000395 | regulation of ubiquitin-dependent endocytosis(GO:2000395) positive regulation of ubiquitin-dependent endocytosis(GO:2000397) |
| 0.1 | 0.6 | GO:0033274 | response to vitamin B2(GO:0033274) heterochromatin maintenance(GO:0070829) |
| 0.1 | 0.3 | GO:0002949 | tRNA threonylcarbamoyladenosine modification(GO:0002949) |
| 0.1 | 0.7 | GO:0071109 | superior temporal gyrus development(GO:0071109) |
| 0.1 | 1.3 | GO:0031642 | negative regulation of myelination(GO:0031642) |
| 0.1 | 0.3 | GO:0033606 | B cell receptor transport within lipid bilayer(GO:0032595) B cell receptor transport into membrane raft(GO:0032597) protein transport out of membrane raft(GO:0032599) chemokine receptor transport out of membrane raft(GO:0032600) negative regulation of transforming growth factor beta3 production(GO:0032913) chemokine receptor transport within lipid bilayer(GO:0033606) |
| 0.1 | 0.5 | GO:2001034 | histone H3-K36 dimethylation(GO:0097676) positive regulation of double-strand break repair via nonhomologous end joining(GO:2001034) |
| 0.1 | 0.6 | GO:1900383 | regulation of synaptic plasticity by receptor localization to synapse(GO:1900383) |
| 0.1 | 3.8 | GO:0035735 | intraciliary transport involved in cilium morphogenesis(GO:0035735) |
| 0.1 | 0.5 | GO:0010793 | regulation of mRNA export from nucleus(GO:0010793) |
| 0.1 | 0.7 | GO:0031444 | slow-twitch skeletal muscle fiber contraction(GO:0031444) |
| 0.1 | 0.4 | GO:0006432 | phenylalanyl-tRNA aminoacylation(GO:0006432) |
| 0.1 | 1.6 | GO:0006705 | mineralocorticoid biosynthetic process(GO:0006705) mineralocorticoid metabolic process(GO:0008212) |
| 0.1 | 1.0 | GO:0015866 | ADP transport(GO:0015866) |
| 0.1 | 0.3 | GO:0001831 | trophectodermal cellular morphogenesis(GO:0001831) |
| 0.1 | 1.4 | GO:0007351 | tripartite regional subdivision(GO:0007351) anterior/posterior axis specification, embryo(GO:0008595) |
| 0.1 | 1.0 | GO:0007258 | JUN phosphorylation(GO:0007258) |
| 0.1 | 0.8 | GO:0070294 | renal sodium ion absorption(GO:0070294) |
| 0.1 | 0.5 | GO:0051012 | microtubule sliding(GO:0051012) |
| 0.1 | 0.4 | GO:0050925 | cerebral cortex tangential migration using cell-cell interactions(GO:0021823) postnatal olfactory bulb interneuron migration(GO:0021827) chemorepulsion involved in postnatal olfactory bulb interneuron migration(GO:0021836) negative regulation of negative chemotaxis(GO:0050925) |
| 0.1 | 0.5 | GO:0060087 | relaxation of vascular smooth muscle(GO:0060087) |
| 0.1 | 0.2 | GO:0003193 | pulmonary valve formation(GO:0003193) foramen ovale closure(GO:0035922) regulation of bundle of His cell action potential(GO:0098905) |
| 0.1 | 0.9 | GO:1903608 | protein localization to cytoplasmic stress granule(GO:1903608) |
| 0.1 | 1.5 | GO:1904262 | negative regulation of TORC1 signaling(GO:1904262) |
| 0.1 | 4.1 | GO:0045744 | negative regulation of G-protein coupled receptor protein signaling pathway(GO:0045744) |
| 0.1 | 2.0 | GO:0003351 | epithelial cilium movement(GO:0003351) |
| 0.1 | 0.9 | GO:0000338 | protein deneddylation(GO:0000338) |
| 0.1 | 0.3 | GO:0046391 | 5-phosphoribose 1-diphosphate biosynthetic process(GO:0006015) 5-phosphoribose 1-diphosphate metabolic process(GO:0046391) |
| 0.1 | 0.6 | GO:0032962 | positive regulation of inositol trisphosphate biosynthetic process(GO:0032962) |
| 0.1 | 0.2 | GO:1903182 | regulation of SUMO transferase activity(GO:1903182) positive regulation of SUMO transferase activity(GO:1903755) |
| 0.1 | 0.7 | GO:0042262 | DNA protection(GO:0042262) |
| 0.1 | 0.4 | GO:0030242 | pexophagy(GO:0030242) |
| 0.1 | 1.3 | GO:0042135 | neurotransmitter catabolic process(GO:0042135) |
| 0.1 | 3.2 | GO:0007214 | gamma-aminobutyric acid signaling pathway(GO:0007214) |
| 0.1 | 2.2 | GO:0071539 | protein localization to centrosome(GO:0071539) |
| 0.1 | 0.4 | GO:0051684 | maintenance of Golgi location(GO:0051684) |
| 0.1 | 0.2 | GO:0090235 | regulation of metaphase plate congression(GO:0090235) |
| 0.1 | 1.0 | GO:0045793 | positive regulation of cell size(GO:0045793) |
| 0.1 | 0.2 | GO:2000434 | regulation of protein neddylation(GO:2000434) negative regulation of protein neddylation(GO:2000435) |
| 0.1 | 0.5 | GO:1903421 | regulation of synaptic vesicle recycling(GO:1903421) |
| 0.1 | 1.6 | GO:0007016 | cytoskeletal anchoring at plasma membrane(GO:0007016) |
| 0.1 | 0.8 | GO:0051451 | myoblast migration(GO:0051451) |
| 0.1 | 0.2 | GO:0033386 | geranylgeranyl diphosphate metabolic process(GO:0033385) geranylgeranyl diphosphate biosynthetic process(GO:0033386) |
| 0.1 | 0.8 | GO:0006610 | ribosomal protein import into nucleus(GO:0006610) |
| 0.1 | 0.6 | GO:0060159 | regulation of dopamine receptor signaling pathway(GO:0060159) |
| 0.1 | 0.5 | GO:0035494 | SNARE complex disassembly(GO:0035494) |
| 0.1 | 7.0 | GO:0006334 | nucleosome assembly(GO:0006334) |
| 0.1 | 0.5 | GO:0042271 | susceptibility to natural killer cell mediated cytotoxicity(GO:0042271) |
| 0.1 | 1.9 | GO:0045332 | phospholipid translocation(GO:0045332) |
| 0.1 | 0.8 | GO:0006930 | substrate-dependent cell migration, cell extension(GO:0006930) |
| 0.0 | 2.4 | GO:0030252 | growth hormone secretion(GO:0030252) |
| 0.0 | 0.2 | GO:0006447 | regulation of translational initiation by iron(GO:0006447) |
| 0.0 | 0.3 | GO:1903936 | cellular response to sodium arsenite(GO:1903936) |
| 0.0 | 0.5 | GO:0015846 | polyamine transport(GO:0015846) |
| 0.0 | 1.0 | GO:0060044 | negative regulation of cardiac muscle cell proliferation(GO:0060044) |
| 0.0 | 0.3 | GO:1903750 | intrinsic apoptotic signaling pathway in response to hydrogen peroxide(GO:0036481) regulation of intrinsic apoptotic signaling pathway in response to hydrogen peroxide(GO:1903750) negative regulation of intrinsic apoptotic signaling pathway in response to hydrogen peroxide(GO:1903751) |
| 0.0 | 1.1 | GO:0007175 | negative regulation of epidermal growth factor-activated receptor activity(GO:0007175) |
| 0.0 | 0.2 | GO:0007113 | endomitotic cell cycle(GO:0007113) |
| 0.0 | 2.6 | GO:0035640 | exploration behavior(GO:0035640) |
| 0.0 | 0.3 | GO:0006982 | response to lipid hydroperoxide(GO:0006982) |
| 0.0 | 0.7 | GO:0090168 | Golgi reassembly(GO:0090168) |
| 0.0 | 1.0 | GO:1902083 | negative regulation of peptidyl-cysteine S-nitrosylation(GO:1902083) |
| 0.0 | 1.9 | GO:0016339 | calcium-dependent cell-cell adhesion via plasma membrane cell adhesion molecules(GO:0016339) |
| 0.0 | 0.4 | GO:0009253 | peptidoglycan metabolic process(GO:0000270) peptidoglycan catabolic process(GO:0009253) |
| 0.0 | 0.5 | GO:0070131 | positive regulation of mitochondrial translation(GO:0070131) |
| 0.0 | 0.3 | GO:0042264 | peptidyl-aspartic acid modification(GO:0018197) peptidyl-aspartic acid hydroxylation(GO:0042264) |
| 0.0 | 0.7 | GO:0042407 | cristae formation(GO:0042407) |
| 0.0 | 0.3 | GO:0060356 | leucine import(GO:0060356) |
| 0.0 | 0.4 | GO:0002084 | protein depalmitoylation(GO:0002084) |
| 0.0 | 1.1 | GO:0042744 | hydrogen peroxide catabolic process(GO:0042744) |
| 0.0 | 0.7 | GO:0046784 | viral mRNA export from host cell nucleus(GO:0046784) |
| 0.0 | 1.5 | GO:0007020 | microtubule nucleation(GO:0007020) |
| 0.0 | 0.4 | GO:0071787 | endoplasmic reticulum tubular network assembly(GO:0071787) |
| 0.0 | 0.8 | GO:0098719 | sodium ion import across plasma membrane(GO:0098719) sodium ion import into cell(GO:1990118) |
| 0.0 | 0.7 | GO:0045835 | negative regulation of meiotic nuclear division(GO:0045835) |
| 0.0 | 0.2 | GO:0009257 | 10-formyltetrahydrofolate biosynthetic process(GO:0009257) |
| 0.0 | 0.4 | GO:0097338 | response to clozapine(GO:0097338) |
| 0.0 | 3.0 | GO:0030195 | negative regulation of blood coagulation(GO:0030195) negative regulation of hemostasis(GO:1900047) |
| 0.0 | 0.1 | GO:1905229 | cellular response to glycoprotein(GO:1904588) cellular response to thyrotropin-releasing hormone(GO:1905229) |
| 0.0 | 0.2 | GO:0071475 | cellular hyperosmotic salinity response(GO:0071475) |
| 0.0 | 0.2 | GO:2000660 | negative regulation of interleukin-1-mediated signaling pathway(GO:2000660) |
| 0.0 | 0.0 | GO:0071033 | nuclear retention of pre-mRNA at the site of transcription(GO:0071033) |
| 0.0 | 0.5 | GO:0000055 | ribosomal large subunit export from nucleus(GO:0000055) |
| 0.0 | 0.7 | GO:0006089 | lactate metabolic process(GO:0006089) |
| 0.0 | 0.5 | GO:1900119 | positive regulation of execution phase of apoptosis(GO:1900119) |
| 0.0 | 0.5 | GO:0030388 | fructose 1,6-bisphosphate metabolic process(GO:0030388) |
| 0.0 | 0.1 | GO:1904980 | positive regulation of endosome organization(GO:1904980) |
| 0.0 | 0.1 | GO:0006542 | glutamine biosynthetic process(GO:0006542) |
| 0.0 | 0.7 | GO:0001675 | acrosome assembly(GO:0001675) |
| 0.0 | 1.3 | GO:0007413 | axonal fasciculation(GO:0007413) |
| 0.0 | 0.1 | GO:0001835 | blastocyst hatching(GO:0001835) hatching(GO:0035188) organism emergence from protective structure(GO:0071684) |
| 0.0 | 0.4 | GO:0061179 | negative regulation of insulin secretion involved in cellular response to glucose stimulus(GO:0061179) |
| 0.0 | 0.3 | GO:0019720 | Mo-molybdopterin cofactor biosynthetic process(GO:0006777) Mo-molybdopterin cofactor metabolic process(GO:0019720) |
| 0.0 | 0.2 | GO:0016255 | attachment of GPI anchor to protein(GO:0016255) |
| 0.0 | 1.2 | GO:0021522 | spinal cord motor neuron differentiation(GO:0021522) |
| 0.0 | 0.4 | GO:0035457 | cellular response to interferon-alpha(GO:0035457) |
| 0.0 | 0.1 | GO:1900127 | positive regulation of hyaluronan biosynthetic process(GO:1900127) |
| 0.0 | 0.4 | GO:0070389 | chaperone cofactor-dependent protein refolding(GO:0070389) |
| 0.0 | 1.0 | GO:0097120 | receptor localization to synapse(GO:0097120) |
| 0.0 | 0.3 | GO:0016998 | cell wall macromolecule catabolic process(GO:0016998) |
| 0.0 | 0.3 | GO:0070934 | CRD-mediated mRNA stabilization(GO:0070934) |
| 0.0 | 1.3 | GO:0045124 | regulation of bone resorption(GO:0045124) |
| 0.0 | 0.6 | GO:0016075 | rRNA catabolic process(GO:0016075) |
| 0.0 | 0.6 | GO:0044458 | motile cilium assembly(GO:0044458) |
| 0.0 | 0.7 | GO:0008210 | estrogen metabolic process(GO:0008210) |
| 0.0 | 0.3 | GO:0034982 | mitochondrial protein processing(GO:0034982) |
| 0.0 | 0.3 | GO:0086069 | bundle of His cell to Purkinje myocyte communication(GO:0086069) |
| 0.0 | 0.2 | GO:2000371 | regulation of DNA topoisomerase (ATP-hydrolyzing) activity(GO:2000371) positive regulation of DNA topoisomerase (ATP-hydrolyzing) activity(GO:2000373) |
| 0.0 | 0.5 | GO:0048387 | negative regulation of retinoic acid receptor signaling pathway(GO:0048387) |
| 0.0 | 0.5 | GO:0060736 | prostate gland growth(GO:0060736) |
| 0.0 | 0.5 | GO:0016254 | preassembly of GPI anchor in ER membrane(GO:0016254) |
| 0.0 | 0.9 | GO:0090383 | phagosome acidification(GO:0090383) |
| 0.0 | 0.7 | GO:0000732 | strand displacement(GO:0000732) |
| 0.0 | 0.2 | GO:0009249 | protein lipoylation(GO:0009249) |
| 0.0 | 0.2 | GO:0010994 | regulation of ubiquitin homeostasis(GO:0010993) free ubiquitin chain polymerization(GO:0010994) |
| 0.0 | 0.6 | GO:0042118 | endothelial cell activation(GO:0042118) |
| 0.0 | 0.1 | GO:1901098 | positive regulation of autophagosome maturation(GO:1901098) |
| 0.0 | 0.6 | GO:0008053 | mitochondrial fusion(GO:0008053) |
| 0.0 | 0.3 | GO:1902260 | negative regulation of delayed rectifier potassium channel activity(GO:1902260) |
| 0.0 | 0.3 | GO:0035020 | regulation of Rac protein signal transduction(GO:0035020) |
| 0.0 | 1.4 | GO:0036092 | phosphatidylinositol-3-phosphate biosynthetic process(GO:0036092) |
| 0.0 | 1.2 | GO:0000413 | protein peptidyl-prolyl isomerization(GO:0000413) |
| 0.0 | 3.2 | GO:0007156 | homophilic cell adhesion via plasma membrane adhesion molecules(GO:0007156) |
| 0.0 | 0.5 | GO:0007130 | synaptonemal complex assembly(GO:0007130) |
| 0.0 | 1.9 | GO:0006501 | C-terminal protein lipidation(GO:0006501) |
| 0.0 | 0.6 | GO:0031116 | positive regulation of microtubule polymerization(GO:0031116) |
| 0.0 | 1.1 | GO:0015949 | nucleobase-containing small molecule interconversion(GO:0015949) |
| 0.0 | 0.5 | GO:0007635 | chemosensory behavior(GO:0007635) |
| 0.0 | 0.3 | GO:0001542 | ovulation from ovarian follicle(GO:0001542) |
| 0.0 | 0.3 | GO:0046710 | GDP metabolic process(GO:0046710) |
| 0.0 | 0.3 | GO:0032026 | response to magnesium ion(GO:0032026) |
| 0.0 | 0.7 | GO:0070536 | protein K63-linked deubiquitination(GO:0070536) |
| 0.0 | 0.4 | GO:0090286 | cytoskeletal anchoring at nuclear membrane(GO:0090286) |
| 0.0 | 2.3 | GO:0043154 | negative regulation of cysteine-type endopeptidase activity involved in apoptotic process(GO:0043154) |
| 0.0 | 0.4 | GO:0007129 | synapsis(GO:0007129) |
| 0.0 | 0.2 | GO:0098789 | pre-mRNA cleavage required for polyadenylation(GO:0098789) |
| 0.0 | 0.1 | GO:0007619 | courtship behavior(GO:0007619) female courtship behavior(GO:0008050) |
| 0.0 | 0.3 | GO:0035589 | G-protein coupled purinergic nucleotide receptor signaling pathway(GO:0035589) |
| 0.0 | 0.1 | GO:0071044 | histone mRNA catabolic process(GO:0071044) |
| 0.0 | 0.3 | GO:0006054 | N-acetylneuraminate metabolic process(GO:0006054) |
| 0.0 | 0.2 | GO:0016973 | poly(A)+ mRNA export from nucleus(GO:0016973) |
| 0.0 | 0.6 | GO:0033119 | negative regulation of RNA splicing(GO:0033119) |
| 0.0 | 0.5 | GO:2000117 | negative regulation of cysteine-type endopeptidase activity(GO:2000117) |
| 0.0 | 0.2 | GO:0031848 | protection from non-homologous end joining at telomere(GO:0031848) |
| 0.0 | 0.1 | GO:0030916 | otic vesicle formation(GO:0030916) |
| 0.0 | 0.0 | GO:0010430 | fatty acid omega-oxidation(GO:0010430) |
| 0.0 | 0.1 | GO:0000720 | pyrimidine dimer repair by nucleotide-excision repair(GO:0000720) |
| 0.0 | 0.5 | GO:0051894 | positive regulation of focal adhesion assembly(GO:0051894) |
Gene overrepresentation in cellular component category:
| Log-likelihood per target | Total log-likelihood | Term | Description |
|---|---|---|---|
| 0.7 | 2.2 | GO:1990917 | sperm head plasma membrane(GO:1990913) ooplasm(GO:1990917) |
| 0.4 | 3.3 | GO:0033503 | HULC complex(GO:0033503) |
| 0.4 | 3.5 | GO:0005826 | actomyosin contractile ring(GO:0005826) |
| 0.3 | 1.4 | GO:0097229 | sperm end piece(GO:0097229) |
| 0.3 | 3.0 | GO:0000835 | ER ubiquitin ligase complex(GO:0000835) Hrd1p ubiquitin ligase complex(GO:0000836) |
| 0.3 | 3.2 | GO:0005955 | calcineurin complex(GO:0005955) |
| 0.2 | 0.9 | GO:0071920 | cleavage body(GO:0071920) |
| 0.2 | 2.6 | GO:0005589 | collagen type VI trimer(GO:0005589) collagen beaded filament(GO:0098647) |
| 0.2 | 1.5 | GO:1990130 | Iml1 complex(GO:1990130) |
| 0.2 | 1.1 | GO:1990131 | Gtr1-Gtr2 GTPase complex(GO:1990131) |
| 0.2 | 1.6 | GO:0097425 | smooth endoplasmic reticulum membrane(GO:0030868) smooth endoplasmic reticulum part(GO:0097425) |
| 0.2 | 1.9 | GO:0030061 | mitochondrial crista(GO:0030061) |
| 0.1 | 0.4 | GO:0098844 | postsynaptic endocytic zone membrane(GO:0098844) |
| 0.1 | 0.7 | GO:0032301 | MutSalpha complex(GO:0032301) MutSbeta complex(GO:0032302) |
| 0.1 | 2.1 | GO:0044292 | dendrite terminus(GO:0044292) |
| 0.1 | 1.0 | GO:0031428 | box C/D snoRNP complex(GO:0031428) |
| 0.1 | 0.4 | GO:0009328 | phenylalanine-tRNA ligase complex(GO:0009328) |
| 0.1 | 0.4 | GO:0034272 | phosphatidylinositol 3-kinase complex, class III, type I(GO:0034271) phosphatidylinositol 3-kinase complex, class III, type II(GO:0034272) |
| 0.1 | 1.4 | GO:0045254 | pyruvate dehydrogenase complex(GO:0045254) |
| 0.1 | 0.7 | GO:0061617 | MICOS complex(GO:0061617) |
| 0.1 | 0.3 | GO:0018444 | translation release factor complex(GO:0018444) |
| 0.1 | 4.0 | GO:0030686 | 90S preribosome(GO:0030686) |
| 0.1 | 1.3 | GO:0097197 | tetraspanin-enriched microdomain(GO:0097197) |
| 0.1 | 0.7 | GO:0097149 | centralspindlin complex(GO:0097149) |
| 0.1 | 2.5 | GO:0031045 | dense core granule(GO:0031045) |
| 0.1 | 0.7 | GO:1990452 | Parkin-FBXW7-Cul1 ubiquitin ligase complex(GO:1990452) |
| 0.1 | 0.7 | GO:0033263 | CORVET complex(GO:0033263) |
| 0.1 | 1.8 | GO:0030285 | integral component of synaptic vesicle membrane(GO:0030285) intrinsic component of synaptic vesicle membrane(GO:0098563) |
| 0.1 | 0.5 | GO:0000801 | central element(GO:0000801) |
| 0.1 | 1.9 | GO:0000242 | pericentriolar material(GO:0000242) |
| 0.1 | 0.8 | GO:0097442 | CA3 pyramidal cell dendrite(GO:0097442) |
| 0.1 | 1.0 | GO:0034464 | BBSome(GO:0034464) |
| 0.1 | 0.5 | GO:0000788 | nuclear nucleosome(GO:0000788) |
| 0.1 | 0.4 | GO:0030934 | anchoring collagen complex(GO:0030934) |
| 0.1 | 2.7 | GO:0034451 | centriolar satellite(GO:0034451) |
| 0.1 | 0.9 | GO:1990712 | HFE-transferrin receptor complex(GO:1990712) |
| 0.1 | 2.1 | GO:0035869 | ciliary transition zone(GO:0035869) |
| 0.1 | 1.0 | GO:0030008 | TRAPP complex(GO:0030008) |
| 0.1 | 2.8 | GO:0000421 | autophagosome membrane(GO:0000421) |
| 0.1 | 0.2 | GO:1990356 | sumoylated E2 ligase complex(GO:1990356) |
| 0.1 | 2.1 | GO:0035098 | ESC/E(Z) complex(GO:0035098) |
| 0.1 | 0.7 | GO:0033010 | paranodal junction(GO:0033010) |
| 0.1 | 8.2 | GO:0005796 | Golgi lumen(GO:0005796) |
| 0.1 | 1.5 | GO:0030992 | intraciliary transport particle B(GO:0030992) |
| 0.1 | 1.4 | GO:0043220 | Schmidt-Lanterman incisure(GO:0043220) |
| 0.1 | 0.8 | GO:0005869 | dynactin complex(GO:0005869) |
| 0.0 | 0.7 | GO:0000347 | THO complex(GO:0000347) THO complex part of transcription export complex(GO:0000445) |
| 0.0 | 0.6 | GO:0072546 | ER membrane protein complex(GO:0072546) |
| 0.0 | 0.5 | GO:0071986 | Ragulator complex(GO:0071986) |
| 0.0 | 0.3 | GO:0005947 | mitochondrial alpha-ketoglutarate dehydrogenase complex(GO:0005947) |
| 0.0 | 0.5 | GO:0000506 | glycosylphosphatidylinositol-N-acetylglucosaminyltransferase (GPI-GnT) complex(GO:0000506) |
| 0.0 | 1.7 | GO:0097542 | ciliary tip(GO:0097542) |
| 0.0 | 0.1 | GO:0071598 | neuronal ribonucleoprotein granule(GO:0071598) |
| 0.0 | 0.1 | GO:0048269 | methionine adenosyltransferase complex(GO:0048269) |
| 0.0 | 0.3 | GO:0000408 | EKC/KEOPS complex(GO:0000408) |
| 0.0 | 0.6 | GO:0005687 | U4 snRNP(GO:0005687) |
| 0.0 | 1.7 | GO:0031527 | filopodium membrane(GO:0031527) |
| 0.0 | 0.4 | GO:0030891 | VCB complex(GO:0030891) |
| 0.0 | 1.0 | GO:0005952 | cAMP-dependent protein kinase complex(GO:0005952) |
| 0.0 | 0.3 | GO:0044530 | supraspliceosomal complex(GO:0044530) |
| 0.0 | 0.5 | GO:0033018 | sarcoplasmic reticulum lumen(GO:0033018) |
| 0.0 | 3.9 | GO:0031463 | Cul3-RING ubiquitin ligase complex(GO:0031463) |
| 0.0 | 0.7 | GO:0032433 | filopodium tip(GO:0032433) |
| 0.0 | 0.2 | GO:0042765 | GPI-anchor transamidase complex(GO:0042765) |
| 0.0 | 0.2 | GO:0043564 | Ku70:Ku80 complex(GO:0043564) |
| 0.0 | 0.4 | GO:0036128 | CatSper complex(GO:0036128) |
| 0.0 | 0.7 | GO:0005861 | troponin complex(GO:0005861) |
| 0.0 | 0.3 | GO:0030915 | Smc5-Smc6 complex(GO:0030915) |
| 0.0 | 0.9 | GO:0036020 | endolysosome membrane(GO:0036020) |
| 0.0 | 0.2 | GO:0042272 | nuclear RNA export factor complex(GO:0042272) |
| 0.0 | 0.4 | GO:0044666 | MLL3/4 complex(GO:0044666) |
| 0.0 | 0.9 | GO:0016471 | vacuolar proton-transporting V-type ATPase complex(GO:0016471) |
| 0.0 | 1.3 | GO:0043034 | costamere(GO:0043034) |
| 0.0 | 0.2 | GO:1990726 | Lsm1-7-Pat1 complex(GO:1990726) |
| 0.0 | 0.3 | GO:0070552 | BRISC complex(GO:0070552) |
| 0.0 | 0.5 | GO:0034992 | microtubule organizing center attachment site(GO:0034992) LINC complex(GO:0034993) |
| 0.0 | 0.3 | GO:0000322 | storage vacuole(GO:0000322) |
| 0.0 | 0.6 | GO:0000177 | cytoplasmic exosome (RNase complex)(GO:0000177) |
| 0.0 | 0.5 | GO:0036056 | filtration diaphragm(GO:0036056) slit diaphragm(GO:0036057) |
| 0.0 | 0.4 | GO:0017119 | Golgi transport complex(GO:0017119) |
| 0.0 | 0.7 | GO:0000407 | pre-autophagosomal structure(GO:0000407) |
| 0.0 | 0.8 | GO:0031307 | integral component of mitochondrial outer membrane(GO:0031307) |
| 0.0 | 0.4 | GO:0043219 | lateral loop(GO:0043219) |
| 0.0 | 2.3 | GO:0031672 | A band(GO:0031672) |
| 0.0 | 2.0 | GO:0016529 | sarcoplasmic reticulum(GO:0016529) |
| 0.0 | 0.4 | GO:0033276 | transcription factor TFTC complex(GO:0033276) |
| 0.0 | 0.5 | GO:0031011 | Ino80 complex(GO:0031011) DNA helicase complex(GO:0033202) |
| 0.0 | 1.3 | GO:0032154 | cleavage furrow(GO:0032154) cell surface furrow(GO:0097610) |
| 0.0 | 1.1 | GO:0019005 | SCF ubiquitin ligase complex(GO:0019005) |
| 0.0 | 0.3 | GO:0000813 | ESCRT I complex(GO:0000813) |
| 0.0 | 3.3 | GO:0030018 | Z disc(GO:0030018) |
| 0.0 | 3.0 | GO:0043197 | dendritic spine(GO:0043197) |
| 0.0 | 0.7 | GO:0001772 | immunological synapse(GO:0001772) |
| 0.0 | 0.6 | GO:0044298 | neuronal cell body membrane(GO:0032809) cell body membrane(GO:0044298) |
| 0.0 | 1.0 | GO:0043198 | dendritic shaft(GO:0043198) |
| 0.0 | 0.3 | GO:0070937 | CRD-mediated mRNA stability complex(GO:0070937) |
| 0.0 | 0.3 | GO:0031362 | anchored component of external side of plasma membrane(GO:0031362) |
| 0.0 | 0.5 | GO:0031092 | platelet alpha granule membrane(GO:0031092) |
| 0.0 | 0.9 | GO:0048786 | presynaptic active zone(GO:0048786) |
| 0.0 | 0.8 | GO:0000795 | synaptonemal complex(GO:0000795) |
| 0.0 | 1.2 | GO:0044291 | cell-cell contact zone(GO:0044291) |
| 0.0 | 8.8 | GO:0043235 | receptor complex(GO:0043235) |
| 0.0 | 0.4 | GO:0005665 | DNA-directed RNA polymerase II, core complex(GO:0005665) |
| 0.0 | 7.3 | GO:0005578 | proteinaceous extracellular matrix(GO:0005578) |
| 0.0 | 0.4 | GO:0098827 | endoplasmic reticulum tubular network(GO:0071782) endoplasmic reticulum subcompartment(GO:0098827) |
| 0.0 | 0.4 | GO:0005942 | phosphatidylinositol 3-kinase complex(GO:0005942) |
| 0.0 | 0.3 | GO:0032391 | photoreceptor connecting cilium(GO:0032391) |
| 0.0 | 1.1 | GO:0022625 | cytosolic large ribosomal subunit(GO:0022625) |
| 0.0 | 1.0 | GO:0005881 | cytoplasmic microtubule(GO:0005881) |
Gene overrepresentation in molecular function category:
| Log-likelihood per target | Total log-likelihood | Term | Description |
|---|---|---|---|
| 0.7 | 2.2 | GO:0002135 | CTP binding(GO:0002135) |
| 0.6 | 1.9 | GO:0016497 | substance K receptor activity(GO:0016497) |
| 0.5 | 2.2 | GO:0005163 | nerve growth factor receptor binding(GO:0005163) |
| 0.4 | 1.3 | GO:0003880 | protein C-terminal carboxyl O-methyltransferase activity(GO:0003880) |
| 0.4 | 4.3 | GO:0001042 | RNA polymerase I core binding(GO:0001042) |
| 0.4 | 3.2 | GO:0005220 | inositol 1,4,5-trisphosphate-sensitive calcium-release channel activity(GO:0005220) |
| 0.4 | 1.5 | GO:0050211 | procollagen galactosyltransferase activity(GO:0050211) |
| 0.3 | 1.4 | GO:0008798 | beta-aspartyl-peptidase activity(GO:0008798) |
| 0.3 | 1.6 | GO:0004769 | steroid delta-isomerase activity(GO:0004769) |
| 0.3 | 1.5 | GO:0042015 | interleukin-20 binding(GO:0042015) |
| 0.3 | 5.1 | GO:0038062 | protein tyrosine kinase collagen receptor activity(GO:0038062) |
| 0.3 | 0.8 | GO:1990259 | protein-glutamine N-methyltransferase activity(GO:0036009) histone-glutamine methyltransferase activity(GO:1990259) |
| 0.2 | 1.7 | GO:0036042 | long-chain fatty acyl-CoA binding(GO:0036042) |
| 0.2 | 0.9 | GO:0033677 | DNA/RNA helicase activity(GO:0033677) |
| 0.2 | 0.7 | GO:0050816 | phosphothreonine binding(GO:0050816) |
| 0.2 | 1.4 | GO:0005052 | peroxisome matrix targeting signal-1 binding(GO:0005052) |
| 0.2 | 0.8 | GO:0004556 | alpha-amylase activity(GO:0004556) |
| 0.2 | 1.4 | GO:0034604 | pyruvate dehydrogenase activity(GO:0004738) pyruvate dehydrogenase [NAD(P)+] activity(GO:0034603) pyruvate dehydrogenase (NAD+) activity(GO:0034604) |
| 0.2 | 3.0 | GO:1904264 | ubiquitin protein ligase activity involved in ERAD pathway(GO:1904264) |
| 0.1 | 0.4 | GO:0031798 | type 1 metabotropic glutamate receptor binding(GO:0031798) |
| 0.1 | 0.7 | GO:0000406 | double-strand/single-strand DNA junction binding(GO:0000406) single thymine insertion binding(GO:0032143) dinucleotide repeat insertion binding(GO:0032181) |
| 0.1 | 1.1 | GO:0004771 | sterol esterase activity(GO:0004771) |
| 0.1 | 2.9 | GO:0070492 | peptidoglycan binding(GO:0042834) oligosaccharide binding(GO:0070492) |
| 0.1 | 4.7 | GO:0001965 | G-protein alpha-subunit binding(GO:0001965) |
| 0.1 | 4.1 | GO:0050811 | GABA receptor binding(GO:0050811) |
| 0.1 | 0.8 | GO:0060961 | phospholipase D inhibitor activity(GO:0060961) |
| 0.1 | 0.5 | GO:0061628 | H3K27me3 modified histone binding(GO:0061628) |
| 0.1 | 1.3 | GO:0015250 | water channel activity(GO:0015250) |
| 0.1 | 2.5 | GO:0031545 | peptidyl-proline 4-dioxygenase activity(GO:0031545) |
| 0.1 | 0.6 | GO:0004447 | iodide peroxidase activity(GO:0004447) |
| 0.1 | 3.0 | GO:0008349 | MAP kinase kinase kinase kinase activity(GO:0008349) |
| 0.1 | 1.8 | GO:0022851 | GABA-gated chloride ion channel activity(GO:0022851) |
| 0.1 | 0.9 | GO:0004046 | aminoacylase activity(GO:0004046) |
| 0.1 | 0.5 | GO:0044378 | non-sequence-specific DNA binding, bending(GO:0044378) |
| 0.1 | 0.6 | GO:0030622 | U4atac snRNA binding(GO:0030622) |
| 0.1 | 0.7 | GO:0061649 | ubiquitinated histone binding(GO:0061649) |
| 0.1 | 0.3 | GO:0003863 | alpha-ketoacid dehydrogenase activity(GO:0003826) 3-methyl-2-oxobutanoate dehydrogenase (2-methylpropanoyl-transferring) activity(GO:0003863) |
| 0.1 | 0.6 | GO:0004741 | [pyruvate dehydrogenase (lipoamide)] phosphatase activity(GO:0004741) |
| 0.1 | 3.0 | GO:0005024 | transforming growth factor beta-activated receptor activity(GO:0005024) |
| 0.1 | 3.9 | GO:0051371 | muscle alpha-actinin binding(GO:0051371) |
| 0.1 | 0.6 | GO:0004489 | methylenetetrahydrofolate reductase (NAD(P)H) activity(GO:0004489) |
| 0.1 | 0.7 | GO:0050815 | phosphoserine binding(GO:0050815) |
| 0.1 | 0.4 | GO:0070991 | medium-chain-acyl-CoA dehydrogenase activity(GO:0070991) |
| 0.1 | 1.3 | GO:0050291 | sphingosine N-acyltransferase activity(GO:0050291) |
| 0.1 | 0.3 | GO:0030366 | molybdopterin synthase activity(GO:0030366) |
| 0.1 | 0.9 | GO:0019784 | NEDD8-specific protease activity(GO:0019784) |
| 0.1 | 0.4 | GO:0008267 | poly-glutamine tract binding(GO:0008267) |
| 0.1 | 7.4 | GO:0015144 | carbohydrate transmembrane transporter activity(GO:0015144) carbohydrate transporter activity(GO:1901476) |
| 0.1 | 0.5 | GO:0004692 | cGMP-dependent protein kinase activity(GO:0004692) |
| 0.1 | 1.0 | GO:0016909 | JUN kinase activity(GO:0004705) SAP kinase activity(GO:0016909) |
| 0.1 | 0.4 | GO:0004826 | phenylalanine-tRNA ligase activity(GO:0004826) |
| 0.1 | 0.2 | GO:0052856 | NADHX epimerase activity(GO:0052856) NADPHX epimerase activity(GO:0052857) |
| 0.1 | 0.9 | GO:0008553 | hydrogen-exporting ATPase activity, phosphorylative mechanism(GO:0008553) |
| 0.1 | 1.0 | GO:0005347 | ATP transmembrane transporter activity(GO:0005347) ADP transmembrane transporter activity(GO:0015217) |
| 0.1 | 0.3 | GO:0031208 | POZ domain binding(GO:0031208) |
| 0.1 | 0.3 | GO:0061752 | telomeric repeat-containing RNA binding(GO:0061752) |
| 0.1 | 0.3 | GO:0004441 | inositol-1,4-bisphosphate 1-phosphatase activity(GO:0004441) inositol-1,3,4-trisphosphate 1-phosphatase activity(GO:0052829) |
| 0.1 | 0.8 | GO:1904929 | coreceptor activity involved in Wnt signaling pathway, planar cell polarity pathway(GO:1904929) |
| 0.1 | 0.5 | GO:0030614 | oxidoreductase activity, acting on phosphorus or arsenic in donors(GO:0030613) oxidoreductase activity, acting on phosphorus or arsenic in donors, disulfide as acceptor(GO:0030614) |
| 0.1 | 0.9 | GO:0008568 | microtubule-severing ATPase activity(GO:0008568) |
| 0.1 | 0.3 | GO:0098626 | methylselenol reductase activity(GO:0098625) methylseleninic acid reductase activity(GO:0098626) |
| 0.1 | 0.3 | GO:0000268 | peroxisome targeting sequence binding(GO:0000268) |
| 0.1 | 1.9 | GO:0017127 | cholesterol transporter activity(GO:0017127) |
| 0.1 | 0.7 | GO:0047134 | protein-disulfide reductase activity(GO:0047134) |
| 0.1 | 0.1 | GO:0032551 | pyrimidine nucleoside binding(GO:0001884) UTP binding(GO:0002134) pyrimidine ribonucleoside binding(GO:0032551) |
| 0.1 | 1.9 | GO:0004012 | phospholipid-translocating ATPase activity(GO:0004012) |
| 0.1 | 0.2 | GO:0019781 | NEDD8 activating enzyme activity(GO:0019781) |
| 0.1 | 0.2 | GO:0031177 | acyl binding(GO:0000035) phosphopantetheine binding(GO:0031177) |
| 0.1 | 0.2 | GO:0061656 | SUMO conjugating enzyme activity(GO:0061656) |
| 0.1 | 1.2 | GO:0033038 | bitter taste receptor activity(GO:0033038) |
| 0.1 | 1.1 | GO:0004017 | adenylate kinase activity(GO:0004017) |
| 0.1 | 0.6 | GO:0004969 | histamine receptor activity(GO:0004969) |
| 0.0 | 1.0 | GO:0005149 | interleukin-1 receptor binding(GO:0005149) |
| 0.0 | 0.8 | GO:0015386 | potassium:proton antiporter activity(GO:0015386) |
| 0.0 | 0.6 | GO:0070290 | N-acylphosphatidylethanolamine-specific phospholipase D activity(GO:0070290) |
| 0.0 | 0.5 | GO:0017176 | phosphatidylinositol N-acetylglucosaminyltransferase activity(GO:0017176) |
| 0.0 | 0.3 | GO:0004749 | ribose phosphate diphosphokinase activity(GO:0004749) |
| 0.0 | 0.7 | GO:0031014 | troponin T binding(GO:0031014) |
| 0.0 | 1.5 | GO:0045503 | dynein light chain binding(GO:0045503) |
| 0.0 | 1.0 | GO:0000062 | fatty-acyl-CoA binding(GO:0000062) |
| 0.0 | 0.3 | GO:0004597 | peptide-aspartate beta-dioxygenase activity(GO:0004597) |
| 0.0 | 1.0 | GO:0052629 | phosphatidylinositol-3,5-bisphosphate 3-phosphatase activity(GO:0052629) |
| 0.0 | 0.5 | GO:0004332 | fructose-bisphosphate aldolase activity(GO:0004332) |
| 0.0 | 0.5 | GO:0004565 | beta-galactosidase activity(GO:0004565) |
| 0.0 | 0.2 | GO:0046573 | lactonohydrolase activity(GO:0046573) acyl-L-homoserine-lactone lactonohydrolase activity(GO:0102007) |
| 0.0 | 0.3 | GO:0031013 | troponin I binding(GO:0031013) |
| 0.0 | 0.6 | GO:0015379 | potassium:chloride symporter activity(GO:0015379) potassium ion symporter activity(GO:0022820) |
| 0.0 | 1.3 | GO:0016805 | dipeptidase activity(GO:0016805) |
| 0.0 | 1.3 | GO:0002162 | dystroglycan binding(GO:0002162) |
| 0.0 | 0.2 | GO:0004329 | formate-tetrahydrofolate ligase activity(GO:0004329) |
| 0.0 | 0.2 | GO:0086020 | gap junction hemi-channel activity(GO:0055077) gap junction channel activity involved in SA node cell-atrial cardiac muscle cell electrical coupling(GO:0086020) |
| 0.0 | 0.6 | GO:0003796 | lysozyme activity(GO:0003796) |
| 0.0 | 0.7 | GO:0000014 | single-stranded DNA endodeoxyribonuclease activity(GO:0000014) |
| 0.0 | 0.5 | GO:0017151 | DEAD/H-box RNA helicase binding(GO:0017151) |
| 0.0 | 9.8 | GO:0008083 | growth factor activity(GO:0008083) |
| 0.0 | 1.0 | GO:0043236 | laminin binding(GO:0043236) |
| 0.0 | 0.2 | GO:0003923 | GPI-anchor transamidase activity(GO:0003923) |
| 0.0 | 0.2 | GO:0001094 | TFIID-class transcription factor binding(GO:0001094) |
| 0.0 | 0.2 | GO:0004161 | dimethylallyltranstransferase activity(GO:0004161) geranyltranstransferase activity(GO:0004337) |
| 0.0 | 0.3 | GO:0045134 | uridine-diphosphatase activity(GO:0045134) |
| 0.0 | 0.4 | GO:0008046 | axon guidance receptor activity(GO:0008046) |
| 0.0 | 0.2 | GO:0004694 | eukaryotic translation initiation factor 2alpha kinase activity(GO:0004694) |
| 0.0 | 2.5 | GO:0017112 | Rab guanyl-nucleotide exchange factor activity(GO:0017112) |
| 0.0 | 2.3 | GO:0005245 | voltage-gated calcium channel activity(GO:0005245) |
| 0.0 | 4.8 | GO:0005518 | collagen binding(GO:0005518) |
| 0.0 | 0.4 | GO:0098599 | palmitoyl-(protein) hydrolase activity(GO:0008474) palmitoyl hydrolase activity(GO:0098599) |
| 0.0 | 0.1 | GO:0008969 | phosphohistidine phosphatase activity(GO:0008969) |
| 0.0 | 1.9 | GO:0016303 | 1-phosphatidylinositol-3-kinase activity(GO:0016303) |
| 0.0 | 0.6 | GO:0008603 | cAMP-dependent protein kinase regulator activity(GO:0008603) |
| 0.0 | 0.8 | GO:0017049 | GTP-Rho binding(GO:0017049) |
| 0.0 | 0.5 | GO:0016671 | oxidoreductase activity, acting on a sulfur group of donors, disulfide as acceptor(GO:0016671) |
| 0.0 | 0.8 | GO:0042043 | neurexin family protein binding(GO:0042043) |
| 0.0 | 1.4 | GO:0005484 | SNAP receptor activity(GO:0005484) |
| 0.0 | 0.8 | GO:0005527 | macrolide binding(GO:0005527) FK506 binding(GO:0005528) |
| 0.0 | 0.3 | GO:0001162 | RNA polymerase II intronic transcription regulatory region sequence-specific DNA binding(GO:0001162) |
| 0.0 | 3.2 | GO:0002039 | p53 binding(GO:0002039) |
| 0.0 | 0.4 | GO:0001055 | RNA polymerase II activity(GO:0001055) |
| 0.0 | 0.2 | GO:0019103 | pyrimidine nucleotide binding(GO:0019103) |
| 0.0 | 0.6 | GO:0008574 | ATP-dependent microtubule motor activity, plus-end-directed(GO:0008574) |
| 0.0 | 0.3 | GO:0001135 | transcription factor activity, RNA polymerase II transcription factor recruiting(GO:0001135) |
| 0.0 | 0.3 | GO:0070567 | cytidylyltransferase activity(GO:0070567) |
| 0.0 | 0.4 | GO:0016018 | cyclosporin A binding(GO:0016018) |
| 0.0 | 0.2 | GO:0008097 | 5S rRNA binding(GO:0008097) ligase inhibitor activity(GO:0055104) ubiquitin ligase inhibitor activity(GO:1990948) |
| 0.0 | 0.6 | GO:0035615 | clathrin adaptor activity(GO:0035615) endocytic adaptor activity(GO:0098748) |
| 0.0 | 0.9 | GO:0043014 | alpha-tubulin binding(GO:0043014) |
| 0.0 | 0.8 | GO:0070034 | telomerase RNA binding(GO:0070034) |
| 0.0 | 0.4 | GO:0097016 | L27 domain binding(GO:0097016) |
| 0.0 | 0.6 | GO:0005328 | neurotransmitter:sodium symporter activity(GO:0005328) |
| 0.0 | 0.5 | GO:0005003 | ephrin receptor activity(GO:0005003) |
| 0.0 | 0.5 | GO:0043495 | protein anchor(GO:0043495) |
| 0.0 | 1.7 | GO:0001540 | beta-amyloid binding(GO:0001540) |
| 0.0 | 0.7 | GO:0016702 | oxidoreductase activity, acting on single donors with incorporation of molecular oxygen, incorporation of two atoms of oxygen(GO:0016702) |
| 0.0 | 3.2 | GO:0005178 | integrin binding(GO:0005178) |
| 0.0 | 0.1 | GO:0050220 | prostaglandin-E synthase activity(GO:0050220) |
| 0.0 | 0.8 | GO:0070840 | dynein complex binding(GO:0070840) |
| 0.0 | 0.8 | GO:0016896 | 3'-5'-exoribonuclease activity(GO:0000175) exoribonuclease activity, producing 5'-phosphomonoesters(GO:0016896) |
| 0.0 | 1.1 | GO:0050699 | WW domain binding(GO:0050699) |
| 0.0 | 0.1 | GO:0004996 | thyroid-stimulating hormone receptor activity(GO:0004996) |
| 0.0 | 1.0 | GO:0001103 | RNA polymerase II repressing transcription factor binding(GO:0001103) |
| 0.0 | 0.4 | GO:0042800 | histone methyltransferase activity (H3-K4 specific)(GO:0042800) |
| 0.0 | 0.2 | GO:0051575 | 5'-deoxyribose-5-phosphate lyase activity(GO:0051575) |
| 0.0 | 0.2 | GO:0035312 | 5'-3' exodeoxyribonuclease activity(GO:0035312) |
| 0.0 | 0.7 | GO:0004385 | guanylate kinase activity(GO:0004385) |
| 0.0 | 0.3 | GO:0005432 | calcium:sodium antiporter activity(GO:0005432) |
| 0.0 | 0.5 | GO:0035255 | ionotropic glutamate receptor binding(GO:0035255) |
| 0.0 | 0.1 | GO:0004517 | nitric-oxide synthase activity(GO:0004517) |
| 0.0 | 2.3 | GO:0036459 | thiol-dependent ubiquitinyl hydrolase activity(GO:0036459) |
| 0.0 | 0.3 | GO:0008430 | selenium binding(GO:0008430) |
| 0.0 | 6.1 | GO:0003924 | GTPase activity(GO:0003924) |
| 0.0 | 0.3 | GO:0045028 | G-protein coupled nucleotide receptor activity(GO:0001608) G-protein coupled purinergic nucleotide receptor activity(GO:0045028) |
| 0.0 | 1.0 | GO:0004407 | histone deacetylase activity(GO:0004407) |
| 0.0 | 0.3 | GO:0031492 | nucleosomal DNA binding(GO:0031492) |
| 0.0 | 0.3 | GO:0019870 | potassium channel inhibitor activity(GO:0019870) |
| 0.0 | 0.3 | GO:0004691 | cyclic nucleotide-dependent protein kinase activity(GO:0004690) cAMP-dependent protein kinase activity(GO:0004691) |
| 0.0 | 0.8 | GO:0005044 | scavenger receptor activity(GO:0005044) |
| 0.0 | 0.0 | GO:0000386 | second spliceosomal transesterification activity(GO:0000386) |
| 0.0 | 0.3 | GO:0001087 | transcription factor activity, sequence-specific DNA binding, RNA polymerase recruiting(GO:0001011) transcription factor activity, TFIIB-class binding(GO:0001087) |
Gene overrepresentation in curated gene sets: canonical pathways category:
| Log-likelihood per target | Total log-likelihood | Term | Description |
|---|---|---|---|
| 0.2 | 9.6 | NABA PROTEOGLYCANS | Genes encoding proteoglycans |
| 0.1 | 4.3 | PID ERBB NETWORK PATHWAY | ErbB receptor signaling network |
| 0.1 | 2.5 | PID HIF1A PATHWAY | Hypoxic and oxygen homeostasis regulation of HIF-1-alpha |
| 0.1 | 4.9 | ST GAQ PATHWAY | G alpha q Pathway |
| 0.1 | 1.9 | PID ANTHRAX PATHWAY | Cellular roles of Anthrax toxin |
| 0.0 | 2.8 | PID TNF PATHWAY | TNF receptor signaling pathway |
| 0.0 | 3.5 | ST FAS SIGNALING PATHWAY | Fas Signaling Pathway |
| 0.0 | 1.4 | PID INSULIN GLUCOSE PATHWAY | Insulin-mediated glucose transport |
| 0.0 | 0.8 | PID ERB GENOMIC PATHWAY | Validated nuclear estrogen receptor beta network |
| 0.0 | 0.8 | PID ALPHA SYNUCLEIN PATHWAY | Alpha-synuclein signaling |
| 0.0 | 0.8 | PID WNT SIGNALING PATHWAY | Wnt signaling network |
| 0.0 | 1.6 | PID NCADHERIN PATHWAY | N-cadherin signaling events |
| 0.0 | 1.4 | PID AURORA B PATHWAY | Aurora B signaling |
| 0.0 | 2.2 | PID ERA GENOMIC PATHWAY | Validated nuclear estrogen receptor alpha network |
| 0.0 | 1.0 | ST JNK MAPK PATHWAY | JNK MAPK Pathway |
| 0.0 | 0.4 | PID AVB3 INTEGRIN PATHWAY | Integrins in angiogenesis |
| 0.0 | 0.7 | PID MYC PATHWAY | C-MYC pathway |
| 0.0 | 0.9 | PID GLYPICAN 1PATHWAY | Glypican 1 network |
| 0.0 | 0.5 | PID NEPHRIN NEPH1 PATHWAY | Nephrin/Neph1 signaling in the kidney podocyte |
| 0.0 | 0.4 | PID RANBP2 PATHWAY | Sumoylation by RanBP2 regulates transcriptional repression |
| 0.0 | 1.4 | PID HEDGEHOG GLI PATHWAY | Hedgehog signaling events mediated by Gli proteins |
| 0.0 | 0.5 | PID TXA2PATHWAY | Thromboxane A2 receptor signaling |
| 0.0 | 4.7 | NABA ECM GLYCOPROTEINS | Genes encoding structural ECM glycoproteins |
| 0.0 | 0.9 | PID BMP PATHWAY | BMP receptor signaling |
| 0.0 | 0.8 | PID LKB1 PATHWAY | LKB1 signaling events |
| 0.0 | 0.6 | PID EPHB FWD PATHWAY | EPHB forward signaling |
Gene overrepresentation in curated gene sets: REACTOME pathways category:
| Log-likelihood per target | Total log-likelihood | Term | Description |
|---|---|---|---|
| 0.3 | 6.4 | REACTOME KERATAN SULFATE DEGRADATION | Genes involved in Keratan sulfate degradation |
| 0.1 | 2.1 | REACTOME SYNTHESIS OF PIPS AT THE LATE ENDOSOME MEMBRANE | Genes involved in Synthesis of PIPs at the late endosome membrane |
| 0.1 | 5.3 | REACTOME DOWNREGULATION OF ERBB2 ERBB3 SIGNALING | Genes involved in Downregulation of ERBB2:ERBB3 signaling |
| 0.1 | 2.2 | REACTOME THE NLRP3 INFLAMMASOME | Genes involved in The NLRP3 inflammasome |
| 0.1 | 1.6 | REACTOME ANDROGEN BIOSYNTHESIS | Genes involved in Androgen biosynthesis |
| 0.1 | 2.6 | REACTOME CS DS DEGRADATION | Genes involved in CS/DS degradation |
| 0.1 | 1.9 | REACTOME RECRUITMENT OF NUMA TO MITOTIC CENTROSOMES | Genes involved in Recruitment of NuMA to mitotic centrosomes |
| 0.1 | 1.6 | REACTOME REGULATION OF PYRUVATE DEHYDROGENASE PDH COMPLEX | Genes involved in Regulation of pyruvate dehydrogenase (PDH) complex |
| 0.1 | 1.1 | REACTOME DIGESTION OF DIETARY CARBOHYDRATE | Genes involved in Digestion of dietary carbohydrate |
| 0.1 | 1.4 | REACTOME PROTEOLYTIC CLEAVAGE OF SNARE COMPLEX PROTEINS | Genes involved in Proteolytic cleavage of SNARE complex proteins |
| 0.0 | 0.4 | REACTOME CYTOSOLIC TRNA AMINOACYLATION | Genes involved in Cytosolic tRNA aminoacylation |
| 0.0 | 4.5 | REACTOME G ALPHA Z SIGNALLING EVENTS | Genes involved in G alpha (z) signalling events |
| 0.0 | 1.3 | REACTOME STEROID HORMONES | Genes involved in Steroid hormones |
| 0.0 | 1.8 | REACTOME GABA A RECEPTOR ACTIVATION | Genes involved in GABA A receptor activation |
| 0.0 | 0.7 | REACTOME METABOLISM OF POLYAMINES | Genes involved in Metabolism of polyamines |
| 0.0 | 1.3 | REACTOME OXYGEN DEPENDENT PROLINE HYDROXYLATION OF HYPOXIA INDUCIBLE FACTOR ALPHA | Genes involved in Oxygen-dependent Proline Hydroxylation of Hypoxia-inducible Factor Alpha |
| 0.0 | 1.0 | REACTOME GLUCAGON SIGNALING IN METABOLIC REGULATION | Genes involved in Glucagon signaling in metabolic regulation |
| 0.0 | 1.4 | REACTOME TRAFFICKING OF GLUR2 CONTAINING AMPA RECEPTORS | Genes involved in Trafficking of GluR2-containing AMPA receptors |
| 0.0 | 1.4 | REACTOME SIGNALING BY NODAL | Genes involved in Signaling by NODAL |
| 0.0 | 2.5 | REACTOME TRANSCRIPTIONAL REGULATION OF WHITE ADIPOCYTE DIFFERENTIATION | Genes involved in Transcriptional Regulation of White Adipocyte Differentiation |
| 0.0 | 0.5 | REACTOME NRIF SIGNALS CELL DEATH FROM THE NUCLEUS | Genes involved in NRIF signals cell death from the nucleus |
| 0.0 | 0.9 | REACTOME SIGNALING BY BMP | Genes involved in Signaling by BMP |
| 0.0 | 1.1 | REACTOME SYNTHESIS AND INTERCONVERSION OF NUCLEOTIDE DI AND TRIPHOSPHATES | Genes involved in Synthesis and interconversion of nucleotide di- and triphosphates |
| 0.0 | 0.3 | REACTOME MEMBRANE BINDING AND TARGETTING OF GAG PROTEINS | Genes involved in Membrane binding and targetting of GAG proteins |
| 0.0 | 1.2 | REACTOME RAP1 SIGNALLING | Genes involved in Rap1 signalling |
| 0.0 | 1.9 | REACTOME ION TRANSPORT BY P TYPE ATPASES | Genes involved in Ion transport by P-type ATPases |
| 0.0 | 1.0 | REACTOME JNK C JUN KINASES PHOSPHORYLATION AND ACTIVATION MEDIATED BY ACTIVATED HUMAN TAK1 | Genes involved in JNK (c-Jun kinases) phosphorylation and activation mediated by activated human TAK1 |
| 0.0 | 2.7 | REACTOME LOSS OF NLP FROM MITOTIC CENTROSOMES | Genes involved in Loss of Nlp from mitotic centrosomes |
| 0.0 | 0.6 | REACTOME AMINE DERIVED HORMONES | Genes involved in Amine-derived hormones |
| 0.0 | 1.0 | REACTOME SIGNALING BY CONSTITUTIVELY ACTIVE EGFR | Genes involved in Signaling by constitutively active EGFR |
| 0.0 | 15.3 | REACTOME GENERIC TRANSCRIPTION PATHWAY | Genes involved in Generic Transcription Pathway |
| 0.0 | 0.5 | REACTOME MEIOTIC RECOMBINATION | Genes involved in Meiotic Recombination |
| 0.0 | 0.4 | REACTOME MITOCHONDRIAL FATTY ACID BETA OXIDATION | Genes involved in Mitochondrial Fatty Acid Beta-Oxidation |
| 0.0 | 0.9 | REACTOME INSULIN RECEPTOR RECYCLING | Genes involved in Insulin receptor recycling |
| 0.0 | 0.8 | REACTOME AMYLOIDS | Genes involved in Amyloids |
| 0.0 | 0.7 | REACTOME ELONGATION ARREST AND RECOVERY | Genes involved in Elongation arrest and recovery |
| 0.0 | 0.3 | REACTOME APOPTOSIS INDUCED DNA FRAGMENTATION | Genes involved in Apoptosis induced DNA fragmentation |
| 0.0 | 0.6 | REACTOME NA CL DEPENDENT NEUROTRANSMITTER TRANSPORTERS | Genes involved in Na+/Cl- dependent neurotransmitter transporters |
| 0.0 | 0.5 | REACTOME SYNTHESIS OF GLYCOSYLPHOSPHATIDYLINOSITOL GPI | Genes involved in Synthesis of glycosylphosphatidylinositol (GPI) |
| 0.0 | 1.1 | REACTOME STRIATED MUSCLE CONTRACTION | Genes involved in Striated Muscle Contraction |
| 0.0 | 4.9 | REACTOME ANTIGEN PROCESSING UBIQUITINATION PROTEASOME DEGRADATION | Genes involved in Antigen processing: Ubiquitination & Proteasome degradation |
| 0.0 | 0.7 | REACTOME KINESINS | Genes involved in Kinesins |
| 0.0 | 0.2 | REACTOME POST TRANSLATIONAL MODIFICATION SYNTHESIS OF GPI ANCHORED PROTEINS | Genes involved in Post-translational modification: synthesis of GPI-anchored proteins |
| 0.0 | 0.6 | REACTOME SYNTHESIS OF PA | Genes involved in Synthesis of PA |
| 0.0 | 0.4 | REACTOME P75 NTR RECEPTOR MEDIATED SIGNALLING | Genes involved in p75 NTR receptor-mediated signalling |
| 0.0 | 0.4 | REACTOME SIGNALING BY FGFR1 FUSION MUTANTS | Genes involved in Signaling by FGFR1 fusion mutants |
| 0.0 | 0.4 | REACTOME ACTIVATION OF RAC | Genes involved in Activation of Rac |
| 0.0 | 0.3 | REACTOME FACILITATIVE NA INDEPENDENT GLUCOSE TRANSPORTERS | Genes involved in Facilitative Na+-independent glucose transporters |
| 0.0 | 0.3 | REACTOME BRANCHED CHAIN AMINO ACID CATABOLISM | Genes involved in Branched-chain amino acid catabolism |
| 0.0 | 0.1 | REACTOME HORMONE LIGAND BINDING RECEPTORS | Genes involved in Hormone ligand-binding receptors |