|
chr2_-_88128049
Show fit
|
9.94 |
ENST00000393750.3
ENST00000295834.8
|
FABP1
|
fatty acid binding protein 1
|
|
chr4_-_68670648
Show fit
|
4.12 |
ENST00000338206.6
|
UGT2B15
|
UDP glucuronosyltransferase family 2 member B15
|
|
chr13_+_53028806
Show fit
|
3.71 |
ENST00000219022.3
|
OLFM4
|
olfactomedin 4
|
|
chr4_-_71784046
Show fit
|
3.31 |
ENST00000513476.5
ENST00000273951.13
|
GC
|
GC vitamin D binding protein
|
|
chr2_-_223602284
Show fit
|
3.31 |
ENST00000421386.1
ENST00000305409.3
ENST00000433889.1
|
SCG2
|
secretogranin II
|
|
chr8_+_79611036
Show fit
|
3.21 |
ENST00000220876.12
ENST00000518111.5
|
STMN2
|
stathmin 2
|
|
chr10_-_95069489
Show fit
|
2.94 |
ENST00000371270.6
ENST00000535898.5
ENST00000623108.3
|
CYP2C8
|
cytochrome P450 family 2 subfamily C member 8
|
|
chr10_+_84173793
Show fit
|
2.68 |
ENST00000372126.4
|
C10orf99
|
chromosome 10 open reading frame 99
|
|
chr16_-_55833186
Show fit
|
2.59 |
ENST00000361503.8
ENST00000422046.6
|
CES1
|
carboxylesterase 1
|
|
chrX_-_13817279
Show fit
|
2.43 |
ENST00000475307.1
|
GPM6B
|
glycoprotein M6B
|
|
chr15_+_40351026
Show fit
|
2.34 |
ENST00000448599.2
|
PHGR1
|
proline, histidine and glycine rich 1
|
|
chr9_-_101435760
Show fit
|
2.30 |
ENST00000647789.2
ENST00000616752.1
|
ALDOB
|
aldolase, fructose-bisphosphate B
|
|
chr1_-_159714581
Show fit
|
2.24 |
ENST00000255030.9
ENST00000437342.1
ENST00000368112.5
ENST00000368111.5
ENST00000368110.1
|
CRP
|
C-reactive protein
|
|
chr10_-_69416912
Show fit
|
2.19 |
ENST00000373306.5
|
TACR2
|
tachykinin receptor 2
|
|
chrX_-_13817346
Show fit
|
2.09 |
ENST00000356942.9
|
GPM6B
|
glycoprotein M6B
|
|
chr10_-_46046264
Show fit
|
2.02 |
ENST00000581478.5
ENST00000582163.3
|
MSMB
|
microseminoprotein beta
|
|
chr8_+_75539862
Show fit
|
2.02 |
ENST00000396423.4
|
HNF4G
|
hepatocyte nuclear factor 4 gamma
|
|
chrX_-_13817027
Show fit
|
1.81 |
ENST00000493677.5
ENST00000355135.6
ENST00000316715.9
|
GPM6B
|
glycoprotein M6B
|
|
chr17_+_29043124
Show fit
|
1.80 |
ENST00000323372.9
|
PIPOX
|
pipecolic acid and sarcosine oxidase
|
|
chrX_+_66164340
Show fit
|
1.77 |
ENST00000441993.7
ENST00000419594.6
ENST00000425114.2
|
HEPH
|
hephaestin
|
|
chr10_+_94938649
Show fit
|
1.76 |
ENST00000461906.1
ENST00000260682.8
|
CYP2C9
|
cytochrome P450 family 2 subfamily C member 9
|
|
chr11_-_18236795
Show fit
|
1.73 |
ENST00000278222.7
|
SAA4
|
serum amyloid A4, constitutive
|
|
chr1_-_119811458
Show fit
|
1.63 |
ENST00000256585.10
ENST00000354219.5
ENST00000369401.4
|
REG4
|
regenerating family member 4
|
|
chr3_+_149474688
Show fit
|
1.62 |
ENST00000305354.5
ENST00000465758.1
|
TM4SF4
|
transmembrane 4 L six family member 4
|
|
chr7_-_93226449
Show fit
|
1.57 |
ENST00000394468.7
ENST00000453812.2
|
HEPACAM2
|
HEPACAM family member 2
|
|
chr1_+_192575765
Show fit
|
1.56 |
ENST00000469578.2
ENST00000367459.8
|
RGS1
|
regulator of G protein signaling 1
|
|
chr16_+_72054477
Show fit
|
1.50 |
ENST00000355906.10
ENST00000570083.5
ENST00000228226.12
ENST00000398131.6
ENST00000569639.5
ENST00000564499.5
ENST00000357763.8
ENST00000613898.1
ENST00000562526.5
ENST00000565574.5
ENST00000568417.6
|
HP
|
haptoglobin
|
|
chr4_-_70666492
Show fit
|
1.48 |
ENST00000254801.9
ENST00000391614.7
|
JCHAIN
|
joining chain of multimeric IgA and IgM
|
|
chr6_+_143126183
Show fit
|
1.45 |
ENST00000458219.1
|
AIG1
|
androgen induced 1
|
|
chr2_-_153478753
Show fit
|
1.44 |
ENST00000325926.4
|
RPRM
|
reprimo, TP53 dependent G2 arrest mediator homolog
|
|
chr1_+_100719734
Show fit
|
1.42 |
ENST00000370119.8
ENST00000294728.7
ENST00000347652.6
ENST00000370115.1
|
VCAM1
|
vascular cell adhesion molecule 1
|
|
chr1_+_207089233
Show fit
|
1.42 |
ENST00000243611.9
ENST00000367076.7
|
C4BPB
|
complement component 4 binding protein beta
|
|
chr4_-_109801978
Show fit
|
1.35 |
ENST00000510800.1
ENST00000512148.5
ENST00000394634.7
ENST00000394635.8
ENST00000645635.1
|
CFI
ENSG00000285330.1
|
complement factor I
novel protein
|
|
chr8_+_75539893
Show fit
|
1.32 |
ENST00000674002.1
|
HNF4G
|
hepatocyte nuclear factor 4 gamma
|
|
chr15_-_40874216
Show fit
|
1.30 |
ENST00000220507.5
|
RHOV
|
ras homolog family member V
|
|
chr4_+_39044995
Show fit
|
1.25 |
ENST00000261425.7
ENST00000508137.6
|
KLHL5
|
kelch like family member 5
|
|
chr16_-_67393486
Show fit
|
1.25 |
ENST00000562206.1
ENST00000393957.7
ENST00000290942.9
|
TPPP3
|
tubulin polymerization promoting protein family member 3
|
|
chr11_-_4697831
Show fit
|
1.21 |
ENST00000641159.1
ENST00000396950.4
ENST00000532598.1
|
OR51C1P
OR51E2
|
olfactory receptor family 51 subfamily C member 1 pseudogene
olfactory receptor family 51 subfamily E member 2
|
|
chr7_+_80133830
Show fit
|
1.18 |
ENST00000648098.1
ENST00000648476.1
ENST00000648412.1
ENST00000648953.1
ENST00000648306.1
ENST00000648832.1
ENST00000648877.1
ENST00000442586.2
ENST00000649487.1
ENST00000649267.1
|
GNAI1
|
G protein subunit alpha i1
|
|
chr1_+_207089283
Show fit
|
1.14 |
ENST00000391923.1
|
C4BPB
|
complement component 4 binding protein beta
|
|
chr4_-_70666961
Show fit
|
1.13 |
ENST00000510437.5
|
JCHAIN
|
joining chain of multimeric IgA and IgM
|
|
chr6_+_125919296
Show fit
|
1.12 |
ENST00000444128.2
|
NCOA7
|
nuclear receptor coactivator 7
|
|
chr3_-_52830664
Show fit
|
1.09 |
ENST00000266041.9
ENST00000406595.5
ENST00000485816.5
|
ITIH4
|
inter-alpha-trypsin inhibitor heavy chain 4
|
|
chr2_-_31414694
Show fit
|
1.09 |
ENST00000379416.4
|
XDH
|
xanthine dehydrogenase
|
|
chr10_-_88952763
Show fit
|
1.07 |
ENST00000224784.10
|
ACTA2
|
actin alpha 2, smooth muscle
|
|
chr11_+_58927623
Show fit
|
1.07 |
ENST00000525608.5
ENST00000526351.5
|
GLYATL1
|
glycine-N-acyltransferase like 1
|
|
chr1_-_204166334
Show fit
|
1.03 |
ENST00000272190.9
|
REN
|
renin
|
|
chr8_+_17027230
Show fit
|
1.03 |
ENST00000318063.10
|
MICU3
|
mitochondrial calcium uptake family member 3
|
|
chr3_+_148827800
Show fit
|
0.98 |
ENST00000282957.9
ENST00000468341.1
|
CPB1
|
carboxypeptidase B1
|
|
chr7_-_16465728
Show fit
|
0.98 |
ENST00000307068.5
|
SOSTDC1
|
sclerostin domain containing 1
|
|
chr22_+_22822658
Show fit
|
0.98 |
ENST00000620395.2
|
IGLV2-8
|
immunoglobulin lambda variable 2-8
|
|
chrX_+_66164210
Show fit
|
0.96 |
ENST00000343002.7
ENST00000336279.9
|
HEPH
|
hephaestin
|
|
chr11_-_5254741
Show fit
|
0.96 |
ENST00000444587.1
ENST00000336906.6
ENST00000642908.1
ENST00000647543.1
|
HBG2
ENSG00000284931.1
|
hemoglobin subunit gamma 2
novel protein
|
|
chr1_+_162381703
Show fit
|
0.95 |
ENST00000458626.4
|
C1orf226
|
chromosome 1 open reading frame 226
|
|
chr22_+_22906342
Show fit
|
0.94 |
ENST00000390325.2
|
IGLC3
|
immunoglobulin lambda constant 3 (Kern-Oz+ marker)
|
|
chr2_+_142877653
Show fit
|
0.94 |
ENST00000375773.6
ENST00000409512.5
ENST00000264170.9
ENST00000410015.6
|
KYNU
|
kynureninase
|
|
chr8_-_38150943
Show fit
|
0.93 |
ENST00000276449.9
|
STAR
|
steroidogenic acute regulatory protein
|
|
chr12_+_80099535
Show fit
|
0.93 |
ENST00000646859.1
ENST00000547103.7
|
OTOGL
|
otogelin like
|
|
chr4_+_37453914
Show fit
|
0.93 |
ENST00000381980.9
ENST00000508175.5
|
C4orf19
|
chromosome 4 open reading frame 19
|
|
chrX_-_132219473
Show fit
|
0.91 |
ENST00000620646.4
|
RAP2C
|
RAP2C, member of RAS oncogene family
|
|
chr5_+_42756811
Show fit
|
0.88 |
ENST00000388827.4
ENST00000361970.10
|
CCDC152
|
coiled-coil domain containing 152
|
|
chr5_-_147453888
Show fit
|
0.87 |
ENST00000398514.7
|
DPYSL3
|
dihydropyrimidinase like 3
|
|
chrX_-_132219439
Show fit
|
0.87 |
ENST00000370874.2
|
RAP2C
|
RAP2C, member of RAS oncogene family
|
|
chr7_+_121076570
Show fit
|
0.87 |
ENST00000443817.1
|
CPED1
|
cadherin like and PC-esterase domain containing 1
|
|
chr6_+_57172290
Show fit
|
0.85 |
ENST00000370693.5
|
BAG2
|
BAG cochaperone 2
|
|
chr7_+_120988683
Show fit
|
0.84 |
ENST00000340646.9
ENST00000310396.10
|
CPED1
|
cadherin like and PC-esterase domain containing 1
|
|
chr5_+_177304571
Show fit
|
0.83 |
ENST00000503853.1
|
PRELID1
|
PRELI domain containing 1
|
|
chr5_-_132011811
Show fit
|
0.82 |
ENST00000379255.5
ENST00000430403.5
ENST00000357096.5
|
ACSL6
|
acyl-CoA synthetase long chain family member 6
|
|
chr4_-_175812746
Show fit
|
0.81 |
ENST00000393658.6
|
GPM6A
|
glycoprotein M6A
|
|
chr17_-_31297231
Show fit
|
0.81 |
ENST00000247271.5
|
OMG
|
oligodendrocyte myelin glycoprotein
|
|
chr1_-_43453792
Show fit
|
0.81 |
ENST00000372434.5
ENST00000486909.1
|
HYI
|
hydroxypyruvate isomerase (putative)
|
|
chr16_+_29679132
Show fit
|
0.80 |
ENST00000395384.9
ENST00000562473.1
|
QPRT
|
quinolinate phosphoribosyltransferase
|
|
chr2_+_20447065
Show fit
|
0.79 |
ENST00000272233.6
|
RHOB
|
ras homolog family member B
|
|
chr3_+_190615308
Show fit
|
0.79 |
ENST00000412080.1
|
IL1RAP
|
interleukin 1 receptor accessory protein
|
|
chr19_-_47471886
Show fit
|
0.78 |
ENST00000236877.11
ENST00000597014.1
|
SLC8A2
|
solute carrier family 8 member A2
|
|
chr2_-_89143133
Show fit
|
0.78 |
ENST00000492167.1
|
IGKV3-20
|
immunoglobulin kappa variable 3-20
|
|
chr9_-_92482350
Show fit
|
0.77 |
ENST00000375543.2
|
ASPN
|
asporin
|
|
chr7_-_84195136
Show fit
|
0.77 |
ENST00000420047.1
|
SEMA3A
|
semaphorin 3A
|
|
chr17_+_65137408
Show fit
|
0.76 |
ENST00000443584.7
ENST00000449996.7
|
RGS9
|
regulator of G protein signaling 9
|
|
chr12_-_70754631
Show fit
|
0.75 |
ENST00000440835.6
ENST00000549308.5
ENST00000550661.1
ENST00000378778.5
|
PTPRR
|
protein tyrosine phosphatase receptor type R
|
|
chr5_-_132011794
Show fit
|
0.74 |
ENST00000650697.1
|
ACSL6
|
acyl-CoA synthetase long chain family member 6
|
|
chr6_+_63571702
Show fit
|
0.74 |
ENST00000672924.1
|
PTP4A1
|
protein tyrosine phosphatase 4A1
|
|
chr2_+_137964279
Show fit
|
0.74 |
ENST00000329366.8
|
HNMT
|
histamine N-methyltransferase
|
|
chr10_-_44978789
Show fit
|
0.74 |
ENST00000448778.1
ENST00000298295.4
|
DEPP1
|
DEPP1 autophagy regulator
|
|
chr19_-_41688258
Show fit
|
0.73 |
ENST00000401731.6
ENST00000006724.7
|
CEACAM7
|
CEA cell adhesion molecule 7
|
|
chr8_-_70245343
Show fit
|
0.73 |
ENST00000519724.1
|
NCOA2
|
nuclear receptor coactivator 2
|
|
chr7_+_20330893
Show fit
|
0.73 |
ENST00000222573.5
|
ITGB8
|
integrin subunit beta 8
|
|
chr12_-_91111460
Show fit
|
0.73 |
ENST00000266718.5
|
LUM
|
lumican
|
|
chr1_+_40988513
Show fit
|
0.72 |
ENST00000649215.1
|
CTPS1
|
CTP synthase 1
|
|
chr7_+_54542300
Show fit
|
0.72 |
ENST00000302287.7
ENST00000407838.7
|
VSTM2A
|
V-set and transmembrane domain containing 2A
|
|
chr2_+_89947508
Show fit
|
0.71 |
ENST00000491977.1
|
IGKV2D-29
|
immunoglobulin kappa variable 2D-29
|
|
chr10_+_5446601
Show fit
|
0.71 |
ENST00000449083.5
ENST00000380359.3
|
NET1
|
neuroepithelial cell transforming 1
|
|
chr1_+_50970234
Show fit
|
0.71 |
ENST00000371761.4
|
CDKN2C
|
cyclin dependent kinase inhibitor 2C
|
|
chr4_+_186266183
Show fit
|
0.70 |
ENST00000403665.7
ENST00000492972.6
ENST00000264692.8
|
F11
|
coagulation factor XI
|
|
chr7_+_93906557
Show fit
|
0.69 |
ENST00000248572.10
ENST00000429473.1
ENST00000430875.1
ENST00000428834.1
|
GNGT1
|
G protein subunit gamma transducin 1
|
|
chr6_+_24126186
Show fit
|
0.69 |
ENST00000378478.5
ENST00000378491.9
ENST00000378477.2
|
NRSN1
|
neurensin 1
|
|
chr7_+_134745460
Show fit
|
0.68 |
ENST00000436461.6
|
CALD1
|
caldesmon 1
|
|
chr3_-_143848442
Show fit
|
0.67 |
ENST00000474151.1
ENST00000316549.11
|
SLC9A9
|
solute carrier family 9 member A9
|
|
chrX_-_120559889
Show fit
|
0.67 |
ENST00000371323.3
|
CUL4B
|
cullin 4B
|
|
chr8_+_68330923
Show fit
|
0.66 |
ENST00000518698.6
|
C8orf34
|
chromosome 8 open reading frame 34
|
|
chr6_+_25754699
Show fit
|
0.65 |
ENST00000439485.6
ENST00000377905.9
|
SLC17A4
|
solute carrier family 17 member 4
|
|
chr7_-_26995237
Show fit
|
0.64 |
ENST00000432747.1
|
SKAP2
|
src kinase associated phosphoprotein 2
|
|
chr7_+_54542362
Show fit
|
0.63 |
ENST00000402613.4
|
VSTM2A
|
V-set and transmembrane domain containing 2A
|
|
chr1_-_152159227
Show fit
|
0.63 |
ENST00000316073.3
|
RPTN
|
repetin
|
|
chr12_-_104958268
Show fit
|
0.62 |
ENST00000432951.1
ENST00000258538.8
ENST00000415674.1
ENST00000424946.1
ENST00000433540.5
|
SLC41A2
|
solute carrier family 41 member 2
|
|
chr17_-_68955332
Show fit
|
0.62 |
ENST00000269080.6
ENST00000615593.4
ENST00000586539.6
ENST00000430352.6
|
ABCA8
|
ATP binding cassette subfamily A member 8
|
|
chr17_+_50835578
Show fit
|
0.60 |
ENST00000311378.5
|
WFIKKN2
|
WAP, follistatin/kazal, immunoglobulin, kunitz and netrin domain containing 2
|
|
chr10_+_94762673
Show fit
|
0.60 |
ENST00000480405.2
ENST00000371321.9
|
CYP2C19
|
cytochrome P450 family 2 subfamily C member 19
|
|
chr1_+_50109620
Show fit
|
0.59 |
ENST00000371819.1
|
ELAVL4
|
ELAV like RNA binding protein 4
|
|
chr1_-_72282457
Show fit
|
0.59 |
ENST00000357731.10
|
NEGR1
|
neuronal growth regulator 1
|
|
chr6_+_47698538
Show fit
|
0.59 |
ENST00000327753.7
|
ADGRF4
|
adhesion G protein-coupled receptor F4
|
|
chr16_+_16340328
Show fit
|
0.59 |
ENST00000524823.6
|
ENSG00000183889.12
|
novel member of the nuclear pore complex interacting protein NPIP gene family
|
|
chr14_-_105987068
Show fit
|
0.57 |
ENST00000390594.3
|
IGHV1-2
|
immunoglobulin heavy variable 1-2
|
|
chr22_-_37844308
Show fit
|
0.57 |
ENST00000411961.6
ENST00000434930.1
ENST00000215941.9
|
ANKRD54
|
ankyrin repeat domain 54
|
|
chr12_+_16347102
Show fit
|
0.57 |
ENST00000536371.5
ENST00000010404.6
|
MGST1
|
microsomal glutathione S-transferase 1
|
|
chr2_-_189179754
Show fit
|
0.57 |
ENST00000374866.9
ENST00000618828.1
|
COL5A2
|
collagen type V alpha 2 chain
|
|
chr15_-_51737611
Show fit
|
0.56 |
ENST00000267838.7
|
LYSMD2
|
LysM domain containing 2
|
|
chr11_+_31816266
Show fit
|
0.55 |
ENST00000644607.1
ENST00000646221.1
ENST00000643671.1
ENST00000643931.1
ENST00000642614.1
ENST00000642818.1
ENST00000645848.1
ENST00000506388.2
ENST00000645824.1
ENST00000532942.5
|
PAUPAR
ENSG00000285283.1
|
PAX6 upstream antisense RNA
novel protein
|
|
chr2_+_188991663
Show fit
|
0.55 |
ENST00000450867.1
|
COL3A1
|
collagen type III alpha 1 chain
|
|
chr15_+_59438149
Show fit
|
0.54 |
ENST00000288228.10
ENST00000559628.5
ENST00000557914.5
ENST00000560474.5
|
FAM81A
|
family with sequence similarity 81 member A
|
|
chr20_+_59628609
Show fit
|
0.54 |
ENST00000541461.5
|
PHACTR3
|
phosphatase and actin regulator 3
|
|
chr6_+_63563448
Show fit
|
0.54 |
ENST00000673199.1
|
PTP4A1
|
protein tyrosine phosphatase 4A1
|
|
chr13_-_52011337
Show fit
|
0.53 |
ENST00000400366.6
ENST00000400370.8
ENST00000634844.1
ENST00000673772.1
ENST00000418097.7
ENST00000242839.10
ENST00000344297.9
ENST00000448424.7
|
ATP7B
|
ATPase copper transporting beta
|
|
chr4_+_113049616
Show fit
|
0.52 |
ENST00000504454.5
ENST00000357077.9
ENST00000394537.7
ENST00000672779.1
ENST00000264366.10
|
ANK2
|
ankyrin 2
|
|
chr1_+_24319342
Show fit
|
0.52 |
ENST00000361548.9
|
GRHL3
|
grainyhead like transcription factor 3
|
|
chr9_-_92482499
Show fit
|
0.51 |
ENST00000375544.7
|
ASPN
|
asporin
|
|
chrX_+_115593570
Show fit
|
0.51 |
ENST00000539310.5
|
PLS3
|
plastin 3
|
|
chr6_+_47698574
Show fit
|
0.50 |
ENST00000283303.3
|
ADGRF4
|
adhesion G protein-coupled receptor F4
|
|
chr17_-_58417547
Show fit
|
0.49 |
ENST00000577716.5
|
RNF43
|
ring finger protein 43
|
|
chr4_+_48016764
Show fit
|
0.49 |
ENST00000295461.10
|
NIPAL1
|
NIPA like domain containing 1
|
|
chr4_-_82844418
Show fit
|
0.49 |
ENST00000503937.5
|
SEC31A
|
SEC31 homolog A, COPII coat complex component
|
|
chr16_+_11965193
Show fit
|
0.48 |
ENST00000053243.6
ENST00000396495.3
|
TNFRSF17
|
TNF receptor superfamily member 17
|
|
chr12_+_18262730
Show fit
|
0.48 |
ENST00000675017.1
|
PIK3C2G
|
phosphatidylinositol-4-phosphate 3-kinase catalytic subunit type 2 gamma
|
|
chr5_+_141223332
Show fit
|
0.48 |
ENST00000239449.7
ENST00000624896.1
ENST00000624396.1
|
PCDHB14
ENSG00000279983.1
|
protocadherin beta 14
novel protein
|
|
chr3_+_191199234
Show fit
|
0.48 |
ENST00000445281.5
ENST00000682035.1
|
OSTN
|
osteocrin
|
|
chr16_-_88663065
Show fit
|
0.47 |
ENST00000301012.8
ENST00000569177.5
|
MVD
|
mevalonate diphosphate decarboxylase
|
|
chr15_+_51829644
Show fit
|
0.47 |
ENST00000308580.12
|
TMOD3
|
tropomodulin 3
|
|
chr6_-_73521783
Show fit
|
0.47 |
ENST00000331523.7
ENST00000356303.7
|
EEF1A1
|
eukaryotic translation elongation factor 1 alpha 1
|
|
chr17_+_65137344
Show fit
|
0.46 |
ENST00000262406.10
|
RGS9
|
regulator of G protein signaling 9
|
|
chr16_-_65072207
Show fit
|
0.46 |
ENST00000562882.5
ENST00000567934.5
|
CDH11
|
cadherin 11
|
|
chr1_+_50108856
Show fit
|
0.46 |
ENST00000650764.1
ENST00000494555.2
ENST00000371824.7
ENST00000371823.8
ENST00000652693.1
|
ELAVL4
|
ELAV like RNA binding protein 4
|
|
chr10_+_78033760
Show fit
|
0.46 |
ENST00000435275.5
ENST00000613865.5
ENST00000645440.1
ENST00000464716.6
ENST00000360830.9
ENST00000372360.9
ENST00000440692.6
|
RPS24
|
ribosomal protein S24
|
|
chr6_-_132714045
Show fit
|
0.45 |
ENST00000367928.5
|
VNN1
|
vanin 1
|
|
chr15_-_51738095
Show fit
|
0.45 |
ENST00000560491.2
|
LYSMD2
|
LysM domain containing 2
|
|
chr17_+_56153458
Show fit
|
0.45 |
ENST00000318698.6
ENST00000682825.1
ENST00000566473.6
|
ANKFN1
|
ankyrin repeat and fibronectin type III domain containing 1
|
|
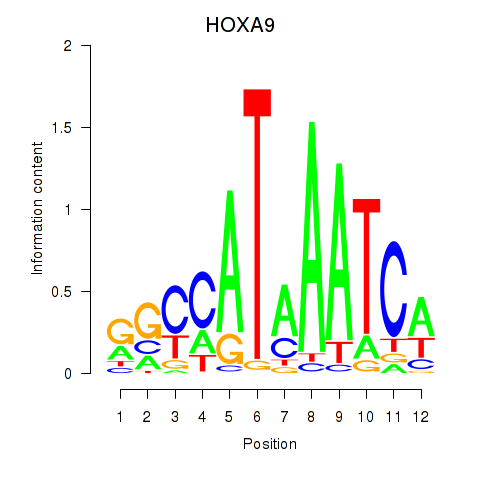
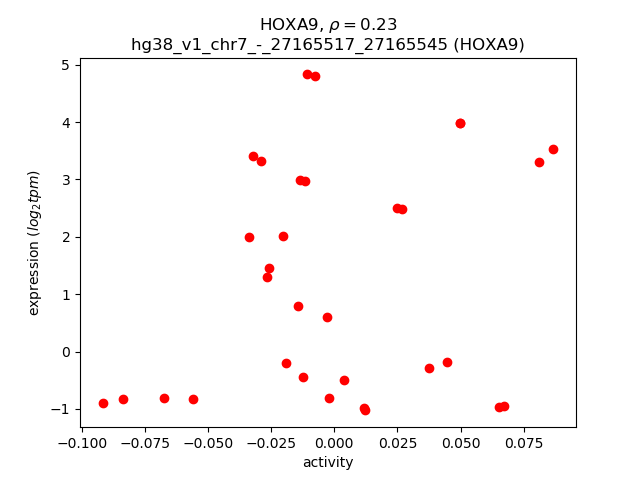
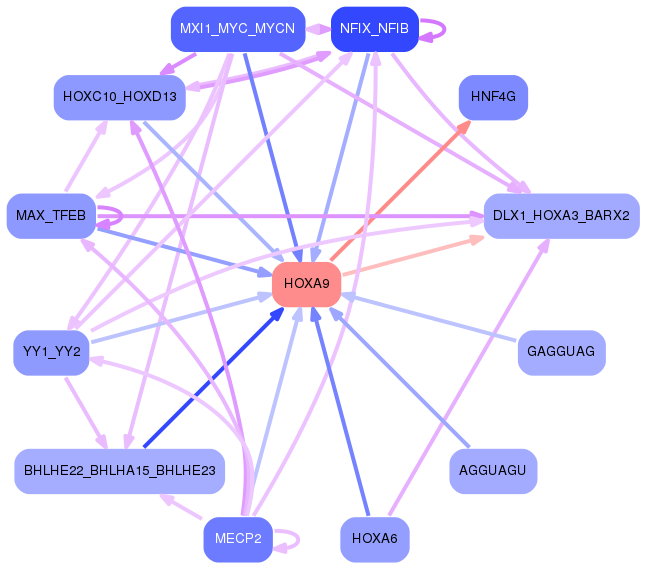
chr7_-_27152561
Show fit
|
0.45 |
ENST00000467897.2
ENST00000612286.5
ENST00000498652.1
|
ENSG00000273433.1
HOXA3
ENSG00000272801.1
|
novel transcript
homeobox A3
novel transcript
|
|
chr9_-_124507382
Show fit
|
0.45 |
ENST00000373588.9
ENST00000620110.4
|
NR5A1
|
nuclear receptor subfamily 5 group A member 1
|
|
chr5_+_38846002
Show fit
|
0.45 |
ENST00000274276.8
|
OSMR
|
oncostatin M receptor
|
|
chr7_+_65873091
Show fit
|
0.45 |
ENST00000648187.1
|
VKORC1L1
|
vitamin K epoxide reductase complex subunit 1 like 1
|
|
chr14_-_31457495
Show fit
|
0.44 |
ENST00000310850.9
|
DTD2
|
D-aminoacyl-tRNA deacylase 2
|
|
chr2_-_224947030
Show fit
|
0.44 |
ENST00000409592.7
|
DOCK10
|
dedicator of cytokinesis 10
|
|
chr22_+_22734577
Show fit
|
0.44 |
ENST00000390310.3
|
IGLV2-18
|
immunoglobulin lambda variable 2-18
|
|
chr6_+_151690492
Show fit
|
0.43 |
ENST00000404742.5
ENST00000440973.5
|
ESR1
|
estrogen receptor 1
|
|
chr12_-_23944301
Show fit
|
0.43 |
ENST00000538083.1
|
SOX5
|
SRY-box transcription factor 5
|
|
chr17_-_41140487
Show fit
|
0.43 |
ENST00000345847.4
|
KRTAP4-6
|
keratin associated protein 4-6
|
|
chr2_-_241686712
Show fit
|
0.43 |
ENST00000445261.5
|
DTYMK
|
deoxythymidylate kinase
|
|
chr5_+_38845824
Show fit
|
0.43 |
ENST00000502536.5
|
OSMR
|
oncostatin M receptor
|
|
chr8_-_20183127
Show fit
|
0.43 |
ENST00000276373.10
ENST00000519026.5
ENST00000440926.3
ENST00000437980.3
|
SLC18A1
|
solute carrier family 18 member A1
|
|
chr6_-_32154326
Show fit
|
0.42 |
ENST00000475826.1
ENST00000485392.5
ENST00000494332.5
ENST00000498575.1
ENST00000428778.5
|
ENSG00000284954.1
ENSG00000285085.1
|
novel transcript
novel protein
|
|
chr9_-_92878018
Show fit
|
0.42 |
ENST00000332591.6
ENST00000375495.8
ENST00000395505.6
ENST00000395506.7
|
ZNF484
|
zinc finger protein 484
|
|
chr10_+_4963406
Show fit
|
0.42 |
ENST00000380872.9
ENST00000442997.5
|
AKR1C1
|
aldo-keto reductase family 1 member C1
|
|
chr7_-_14841267
Show fit
|
0.41 |
ENST00000406247.7
ENST00000399322.7
|
DGKB
|
diacylglycerol kinase beta
|
|
chr11_+_17295322
Show fit
|
0.41 |
ENST00000458064.6
ENST00000622082.4
|
NUCB2
|
nucleobindin 2
|
|
chr13_+_45464901
Show fit
|
0.41 |
ENST00000349995.10
|
COG3
|
component of oligomeric golgi complex 3
|
|
chrX_-_111270474
Show fit
|
0.40 |
ENST00000324068.2
|
CAPN6
|
calpain 6
|
|
chr9_-_127980976
Show fit
|
0.40 |
ENST00000373095.6
|
FAM102A
|
family with sequence similarity 102 member A
|
|
chr9_-_38720428
Show fit
|
0.40 |
ENST00000637493.1
|
FAM240B
|
family with sequence similarity 240 member B
|
|
chr11_-_108593738
Show fit
|
0.40 |
ENST00000525344.5
ENST00000265843.9
|
EXPH5
|
exophilin 5
|
|
chrX_+_9463272
Show fit
|
0.40 |
ENST00000407597.7
ENST00000380961.5
ENST00000424279.6
|
TBL1X
|
transducin beta like 1 X-linked
|
|
chr8_-_20183090
Show fit
|
0.39 |
ENST00000265808.11
ENST00000522513.5
|
SLC18A1
|
solute carrier family 18 member A1
|
|
chr7_+_120273129
Show fit
|
0.39 |
ENST00000331113.9
|
KCND2
|
potassium voltage-gated channel subfamily D member 2
|
|
chr19_-_49961081
Show fit
|
0.39 |
ENST00000426971.2
ENST00000447370.6
|
SIGLEC11
|
sialic acid binding Ig like lectin 11
|
|
chr4_-_69214743
Show fit
|
0.39 |
ENST00000446444.2
|
UGT2B11
|
UDP glucuronosyltransferase family 2 member B11
|
|
chr10_-_5003850
Show fit
|
0.39 |
ENST00000421196.7
ENST00000455190.2
ENST00000380753.8
|
AKR1C2
|
aldo-keto reductase family 1 member C2
|
|
chr7_+_16753731
Show fit
|
0.39 |
ENST00000262067.5
|
TSPAN13
|
tetraspanin 13
|
|
chrX_+_71283577
Show fit
|
0.39 |
ENST00000420903.6
ENST00000373856.8
ENST00000678437.1
ENST00000678830.1
ENST00000677879.1
ENST00000373841.5
ENST00000276079.13
ENST00000676797.1
ENST00000678660.1
ENST00000678231.1
ENST00000677612.1
ENST00000413858.5
ENST00000450092.6
|
NONO
|
non-POU domain containing octamer binding
|
|
chrX_+_66162663
Show fit
|
0.39 |
ENST00000519389.6
|
HEPH
|
hephaestin
|
|
chr6_-_25726553
Show fit
|
0.38 |
ENST00000297012.5
|
H2AC1
|
H2A clustered histone 1
|
|
chr17_+_7407838
Show fit
|
0.38 |
ENST00000302926.7
|
NLGN2
|
neuroligin 2
|
|
chr5_+_148202771
Show fit
|
0.38 |
ENST00000514389.5
ENST00000621437.4
|
SPINK6
|
serine peptidase inhibitor Kazal type 6
|
|
chr20_-_17558811
Show fit
|
0.37 |
ENST00000536626.7
ENST00000377868.6
|
BFSP1
|
beaded filament structural protein 1
|
|
chrX_+_120604199
Show fit
|
0.37 |
ENST00000371315.3
|
MCTS1
|
MCTS1 re-initiation and release factor
|
|
chr21_-_28885347
Show fit
|
0.37 |
ENST00000303775.10
ENST00000351429.7
|
N6AMT1
|
N-6 adenine-specific DNA methyltransferase 1
|
|
chr1_-_79006680
Show fit
|
0.36 |
ENST00000370742.4
ENST00000656841.1
|
ADGRL4
|
adhesion G protein-coupled receptor L4
|
|
chr1_+_92168915
Show fit
|
0.36 |
ENST00000637221.2
|
BTBD8
|
BTB domain containing 8
|
|
chr8_-_98942814
Show fit
|
0.36 |
ENST00000519420.1
|
STK3
|
serine/threonine kinase 3
|
|
chr22_+_22369601
Show fit
|
0.36 |
ENST00000390295.3
|
IGLV7-46
|
immunoglobulin lambda variable 7-46
|
|
chr2_+_170715317
Show fit
|
0.35 |
ENST00000375281.4
|
SP5
|
Sp5 transcription factor
|
|
chr10_+_18261080
Show fit
|
0.35 |
ENST00000377319.8
ENST00000377331.8
|
CACNB2
|
calcium voltage-gated channel auxiliary subunit beta 2
|
|
chr4_+_168712159
Show fit
|
0.35 |
ENST00000510998.5
|
PALLD
|
palladin, cytoskeletal associated protein
|
|
chr17_+_60677822
Show fit
|
0.35 |
ENST00000407086.8
ENST00000589222.5
ENST00000626960.2
ENST00000390652.9
|
BCAS3
|
BCAS3 microtubule associated cell migration factor
|
|
chr4_-_175812236
Show fit
|
0.34 |
ENST00000505375.5
|
GPM6A
|
glycoprotein M6A
|
|
chr1_-_42817357
Show fit
|
0.33 |
ENST00000372521.9
|
SVBP
|
small vasohibin binding protein
|
|
chr2_+_108377947
Show fit
|
0.33 |
ENST00000272452.7
|
SULT1C4
|
sulfotransferase family 1C member 4
|
|
chr10_-_107164692
Show fit
|
0.33 |
ENST00000263054.11
|
SORCS1
|
sortilin related VPS10 domain containing receptor 1
|
|
chr6_+_130018565
Show fit
|
0.33 |
ENST00000361794.7
ENST00000526087.5
ENST00000533560.5
|
L3MBTL3
|
L3MBTL histone methyl-lysine binding protein 3
|
|
chr13_-_30307539
Show fit
|
0.32 |
ENST00000380615.8
|
KATNAL1
|
katanin catalytic subunit A1 like 1
|
|
chr6_+_25726767
Show fit
|
0.32 |
ENST00000274764.5
|
H2BC1
|
H2B clustered histone 1
|
|
chr11_+_86244745
Show fit
|
0.32 |
ENST00000528180.5
ENST00000263360.11
ENST00000672825.1
|
EED
|
embryonic ectoderm development
|
|
chr7_+_29122274
Show fit
|
0.31 |
ENST00000582692.2
ENST00000644824.1
|
ENSG00000285412.1
ENSG00000285162.1
|
novel transcript, antisense to CPVL
chimerin 2
|
