Project
Illumina Body Map 2 (GSE30611)
Navigation
Downloads
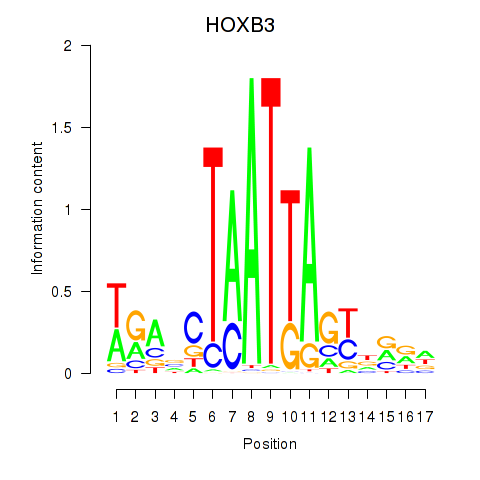
Results for HOXB3
Z-value: 1.03
Motif logo
Transcription factors associated with HOXB3
| Gene Symbol | Gene ID | Gene Info |
|---|---|---|
|
HOXB3
|
ENSG00000120093.12 | homeobox B3 |
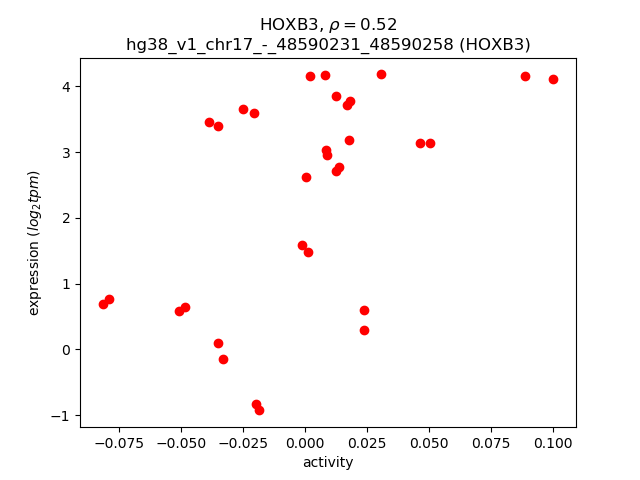
Activity-expression correlation:
| Gene | Promoter | Pearson corr. coef. | P-value | Plot |
|---|---|---|---|---|
| HOXB3 | hg38_v1_chr17_-_48590231_48590258 | 0.52 | 2.0e-03 | Click! |
Activity profile of HOXB3 motif
Sorted Z-values of HOXB3 motif
| Promoter | Log-likelihood | Transcript | Gene | Gene Info |
|---|---|---|---|---|
| chr2_+_88885397 | 6.05 |
ENST00000390243.2
|
IGKV4-1
|
immunoglobulin kappa variable 4-1 |
| chr14_-_106038355 | 4.54 |
ENST00000390597.3
|
IGHV2-5
|
immunoglobulin heavy variable 2-5 |
| chr22_+_22811737 | 4.44 |
ENST00000390315.3
|
IGLV3-10
|
immunoglobulin lambda variable 3-10 |
| chr2_-_88861563 | 4.32 |
ENST00000624935.3
ENST00000390241.3 |
ENSG00000240040.6
IGKJ2
|
novel transcript immunoglobulin kappa joining 2 |
| chr22_+_22720615 | 4.19 |
ENST00000390309.2
|
IGLV3-19
|
immunoglobulin lambda variable 3-19 |
| chr2_-_89177160 | 4.07 |
ENST00000484817.1
|
IGKV2-24
|
immunoglobulin kappa variable 2-24 |
| chr4_-_25863537 | 4.00 |
ENST00000502949.5
ENST00000264868.9 ENST00000513691.1 ENST00000514872.1 |
SEL1L3
|
SEL1L family member 3 |
| chr14_-_106470788 | 3.65 |
ENST00000434710.1
|
IGHV3-43
|
immunoglobulin heavy variable 3-43 |
| chr2_+_90038848 | 3.10 |
ENST00000390270.2
|
IGKV3D-20
|
immunoglobulin kappa variable 3D-20 |
| chr22_+_22375984 | 2.97 |
ENST00000390296.2
|
IGLV5-45
|
immunoglobulin lambda variable 5-45 |
| chr16_+_11965193 | 2.65 |
ENST00000053243.6
ENST00000396495.3 |
TNFRSF17
|
TNF receptor superfamily member 17 |
| chr19_+_17527250 | 2.59 |
ENST00000599164.6
ENST00000449408.6 ENST00000600871.5 ENST00000599124.1 |
NIBAN3
|
niban apoptosis regulator 3 |
| chr4_+_40196907 | 2.53 |
ENST00000622175.4
ENST00000619474.4 ENST00000615083.4 ENST00000610353.4 ENST00000614836.1 |
RHOH
|
ras homolog family member H |
| chr2_+_90004792 | 2.43 |
ENST00000462693.1
|
IGKV2D-24
|
immunoglobulin kappa variable 2D-24 (non-functional) |
| chr12_-_122716790 | 2.35 |
ENST00000528880.3
|
HCAR3
|
hydroxycarboxylic acid receptor 3 |
| chr8_-_48921735 | 2.10 |
ENST00000396822.6
|
SNAI2
|
snail family transcriptional repressor 2 |
| chr8_-_48921419 | 1.87 |
ENST00000020945.4
|
SNAI2
|
snail family transcriptional repressor 2 |
| chr7_+_2519763 | 1.85 |
ENST00000222725.10
ENST00000359574.7 |
LFNG
|
LFNG O-fucosylpeptide 3-beta-N-acetylglucosaminyltransferase |
| chr12_-_122703346 | 1.81 |
ENST00000328880.6
|
HCAR2
|
hydroxycarboxylic acid receptor 2 |
| chr3_+_114294020 | 1.77 |
ENST00000383671.8
|
TIGIT
|
T cell immunoreceptor with Ig and ITIM domains |
| chr14_+_20781139 | 1.69 |
ENST00000304677.3
|
RNASE6
|
ribonuclease A family member k6 |
| chr11_-_107858777 | 1.66 |
ENST00000525815.6
|
SLC35F2
|
solute carrier family 35 member F2 |
| chrX_+_136648214 | 1.65 |
ENST00000370628.2
|
CD40LG
|
CD40 ligand |
| chrX_+_136648138 | 1.65 |
ENST00000370629.7
|
CD40LG
|
CD40 ligand |
| chr2_-_88861920 | 1.63 |
ENST00000390242.2
|
IGKJ1
|
immunoglobulin kappa joining 1 |
| chr6_+_29550407 | 1.55 |
ENST00000641137.1
|
OR2I1P
|
olfactory receptor family 2 subfamily I member 1 pseudogene |
| chr15_-_55270383 | 1.54 |
ENST00000396307.6
|
RAB27A
|
RAB27A, member RAS oncogene family |
| chr21_-_14546297 | 1.52 |
ENST00000400566.6
ENST00000400564.5 |
SAMSN1
|
SAM domain, SH3 domain and nuclear localization signals 1 |
| chr7_+_100119607 | 1.51 |
ENST00000262932.5
|
CNPY4
|
canopy FGF signaling regulator 4 |
| chr15_-_55270280 | 1.42 |
ENST00000564609.5
|
RAB27A
|
RAB27A, member RAS oncogene family |
| chr11_+_5691004 | 1.41 |
ENST00000414641.5
|
TRIM22
|
tripartite motif containing 22 |
| chr8_+_91249307 | 1.41 |
ENST00000309536.6
ENST00000276609.8 |
SLC26A7
|
solute carrier family 26 member 7 |
| chr4_+_40197023 | 1.40 |
ENST00000381799.10
|
RHOH
|
ras homolog family member H |
| chr11_-_105035113 | 1.38 |
ENST00000526568.5
ENST00000531166.5 ENST00000534497.5 ENST00000527979.5 ENST00000533400.6 ENST00000528974.1 ENST00000525825.5 ENST00000353247.9 ENST00000446369.5 ENST00000436863.7 |
CASP1
|
caspase 1 |
| chr15_-_55270874 | 1.36 |
ENST00000567380.5
ENST00000565972.5 ENST00000569493.5 |
RAB27A
|
RAB27A, member RAS oncogene family |
| chr19_-_5286163 | 1.33 |
ENST00000592099.5
ENST00000588012.5 ENST00000262963.10 ENST00000587303.5 ENST00000590509.5 |
PTPRS
|
protein tyrosine phosphatase receptor type S |
| chr19_+_49513353 | 1.33 |
ENST00000596975.5
|
FCGRT
|
Fc fragment of IgG receptor and transporter |
| chr14_+_100019375 | 1.32 |
ENST00000544450.6
|
EVL
|
Enah/Vasp-like |
| chr16_+_11965234 | 1.29 |
ENST00000562385.1
|
TNFRSF17
|
TNF receptor superfamily member 17 |
| chr14_+_21997531 | 1.26 |
ENST00000390445.2
|
TRAV17
|
T cell receptor alpha variable 17 |
| chr19_+_1077394 | 1.25 |
ENST00000590577.2
|
ARHGAP45
|
Rho GTPase activating protein 45 |
| chr3_-_151329539 | 1.24 |
ENST00000325602.6
|
P2RY13
|
purinergic receptor P2Y13 |
| chr14_+_22096017 | 1.20 |
ENST00000390452.2
|
TRDV1
|
T cell receptor delta variable 1 |
| chr16_+_22513523 | 1.16 |
ENST00000538606.5
ENST00000451409.5 ENST00000424340.5 ENST00000517539.5 ENST00000528249.5 |
NPIPB5
|
nuclear pore complex interacting protein family member B5 |
| chr1_-_201171545 | 1.16 |
ENST00000367333.6
|
TMEM9
|
transmembrane protein 9 |
| chr19_+_17527232 | 1.15 |
ENST00000601861.5
|
NIBAN3
|
niban apoptosis regulator 3 |
| chr19_+_49487510 | 1.13 |
ENST00000679106.1
ENST00000621674.4 ENST00000391857.9 ENST00000678510.1 ENST00000467825.2 |
RPL13A
|
ribosomal protein L13a |
| chr6_+_130018565 | 1.12 |
ENST00000361794.7
ENST00000526087.5 ENST00000533560.5 |
L3MBTL3
|
L3MBTL histone methyl-lysine binding protein 3 |
| chr12_-_14938508 | 1.11 |
ENST00000266397.7
|
ERP27
|
endoplasmic reticulum protein 27 |
| chr21_+_42403874 | 1.11 |
ENST00000319294.11
ENST00000398367.1 |
UBASH3A
|
ubiquitin associated and SH3 domain containing A |
| chr7_+_142300924 | 1.09 |
ENST00000455382.2
|
TRBV2
|
T cell receptor beta variable 2 |
| chr16_-_29505820 | 1.08 |
ENST00000550665.5
|
NPIPB12
|
nuclear pore complex interacting protein family member B12 |
| chr8_+_27311471 | 1.08 |
ENST00000397501.5
|
PTK2B
|
protein tyrosine kinase 2 beta |
| chr3_+_122055355 | 1.07 |
ENST00000330540.7
ENST00000469710.5 ENST00000493101.5 |
CD86
|
CD86 molecule |
| chr16_+_22513058 | 1.04 |
ENST00000536620.1
|
NPIPB5
|
nuclear pore complex interacting protein family member B5 |
| chr16_-_21425278 | 1.02 |
ENST00000504841.6
ENST00000419180.6 |
NPIPB3
|
nuclear pore complex interacting protein family member B3 |
| chr12_-_7936177 | 1.02 |
ENST00000544291.1
ENST00000075120.12 |
SLC2A3
|
solute carrier family 2 member 3 |
| chr12_-_15662692 | 1.01 |
ENST00000540613.5
|
EPS8
|
epidermal growth factor receptor pathway substrate 8 |
| chrX_+_15749848 | 1.01 |
ENST00000479740.5
ENST00000454127.2 |
CA5B
|
carbonic anhydrase 5B |
| chr12_+_56128217 | 1.00 |
ENST00000267113.4
ENST00000394048.10 |
ESYT1
|
extended synaptotagmin 1 |
| chr5_-_50441350 | 0.98 |
ENST00000508934.5
|
EMB
|
embigin |
| chr7_-_55552741 | 0.97 |
ENST00000418904.5
|
VOPP1
|
VOPP1 WW domain binding protein |
| chr13_+_101489940 | 0.96 |
ENST00000376162.7
|
ITGBL1
|
integrin subunit beta like 1 |
| chr1_+_222737283 | 0.93 |
ENST00000360827.6
|
FAM177B
|
family with sequence similarity 177 member B |
| chr14_+_61187544 | 0.91 |
ENST00000555185.5
ENST00000557294.5 ENST00000556778.5 |
PRKCH
|
protein kinase C eta |
| chr7_+_26291850 | 0.90 |
ENST00000338523.9
ENST00000446848.6 |
SNX10
|
sorting nexin 10 |
| chr14_+_21852457 | 0.89 |
ENST00000390435.1
|
TRAV8-3
|
T cell receptor alpha variable 8-3 |
| chr16_-_21857418 | 0.89 |
ENST00000415645.6
|
NPIPB4
|
nuclear pore complex interacting protein family member B4 |
| chr16_-_29404029 | 0.88 |
ENST00000524087.5
|
NPIPB11
|
nuclear pore complex interacting protein family member B11 |
| chr2_-_88861258 | 0.88 |
ENST00000390240.2
|
IGKJ3
|
immunoglobulin kappa joining 3 |
| chr17_-_64130813 | 0.87 |
ENST00000606895.2
|
ERN1
|
endoplasmic reticulum to nucleus signaling 1 |
| chr16_-_21857657 | 0.87 |
ENST00000341400.11
ENST00000518761.8 ENST00000682606.1 |
NPIPB4
|
nuclear pore complex interacting protein family member B4 |
| chr11_-_107858561 | 0.86 |
ENST00000375682.8
|
SLC35F2
|
solute carrier family 35 member F2 |
| chr11_+_121576760 | 0.85 |
ENST00000532694.5
ENST00000534286.5 |
SORL1
|
sortilin related receptor 1 |
| chr19_-_3557563 | 0.85 |
ENST00000389395.7
ENST00000355415.7 |
MFSD12
|
major facilitator superfamily domain containing 12 |
| chr6_-_25042003 | 0.84 |
ENST00000510784.8
|
RIPOR2
|
RHO family interacting cell polarization regulator 2 |
| chr9_-_122828539 | 0.84 |
ENST00000259467.9
|
PDCL
|
phosducin like |
| chr3_-_131026726 | 0.84 |
ENST00000514044.5
ENST00000264992.8 |
ASTE1
|
asteroid homolog 1 |
| chr11_+_5689691 | 0.84 |
ENST00000425490.5
|
TRIM22
|
tripartite motif containing 22 |
| chr6_-_75119058 | 0.83 |
ENST00000493109.2
|
COL12A1
|
collagen type XII alpha 1 chain |
| chr4_+_173168800 | 0.83 |
ENST00000512285.5
ENST00000265000.9 |
GALNT7
|
polypeptide N-acetylgalactosaminyltransferase 7 |
| chr1_+_222737196 | 0.82 |
ENST00000434700.5
|
FAM177B
|
family with sequence similarity 177 member B |
| chr2_-_101308681 | 0.82 |
ENST00000295317.4
|
RNF149
|
ring finger protein 149 |
| chr1_+_159008978 | 0.81 |
ENST00000447473.6
|
IFI16
|
interferon gamma inducible protein 16 |
| chr1_+_78649818 | 0.81 |
ENST00000370747.9
ENST00000438486.1 |
IFI44
|
interferon induced protein 44 |
| chr11_-_60183011 | 0.79 |
ENST00000533023.5
ENST00000420732.6 ENST00000528851.6 |
MS4A6A
|
membrane spanning 4-domains A6A |
| chr11_-_96343170 | 0.79 |
ENST00000524717.6
|
MAML2
|
mastermind like transcriptional coactivator 2 |
| chr2_+_137964446 | 0.75 |
ENST00000280096.5
ENST00000280097.5 |
HNMT
|
histamine N-methyltransferase |
| chr4_-_137532452 | 0.75 |
ENST00000412923.6
ENST00000511115.5 ENST00000344876.9 ENST00000507846.5 ENST00000510305.5 ENST00000611581.1 |
PCDH18
|
protocadherin 18 |
| chr9_+_12775012 | 0.74 |
ENST00000319264.4
|
LURAP1L
|
leucine rich adaptor protein 1 like |
| chr5_-_160119389 | 0.73 |
ENST00000523662.1
ENST00000456329.7 ENST00000307063.9 |
PWWP2A
|
PWWP domain containing 2A |
| chr16_+_31873772 | 0.73 |
ENST00000394846.7
ENST00000300870.15 |
ZNF267
|
zinc finger protein 267 |
| chr9_+_122371036 | 0.72 |
ENST00000619306.5
ENST00000426608.6 ENST00000223423.8 |
PTGS1
|
prostaglandin-endoperoxide synthase 1 |
| chr1_-_92486916 | 0.72 |
ENST00000294702.6
|
GFI1
|
growth factor independent 1 transcriptional repressor |
| chr17_+_32021005 | 0.71 |
ENST00000327564.11
ENST00000584368.5 ENST00000394713.7 ENST00000341671.11 |
LRRC37B
|
leucine rich repeat containing 37B |
| chr13_+_30906706 | 0.71 |
ENST00000428944.1
|
MEDAG
|
mesenteric estrogen dependent adipogenesis |
| chr11_-_60183191 | 0.70 |
ENST00000412309.6
|
MS4A6A
|
membrane spanning 4-domains A6A |
| chr3_-_131026558 | 0.70 |
ENST00000504725.1
ENST00000509060.1 |
ASTE1
|
asteroid homolog 1 |
| chr17_-_46579651 | 0.70 |
ENST00000573185.5
ENST00000570550.5 ENST00000445552.6 ENST00000329240.10 ENST00000622488.6 ENST00000336125.6 |
ARL17A
|
ADP ribosylation factor like GTPase 17A |
| chr22_-_32255344 | 0.69 |
ENST00000266086.6
|
SLC5A4
|
solute carrier family 5 member 4 |
| chr1_+_161721563 | 0.69 |
ENST00000367948.6
|
FCRLB
|
Fc receptor like B |
| chr9_+_122371014 | 0.69 |
ENST00000362012.7
|
PTGS1
|
prostaglandin-endoperoxide synthase 1 |
| chr5_-_34043205 | 0.69 |
ENST00000382065.8
ENST00000231338.7 |
C1QTNF3
|
C1q and TNF related 3 |
| chr17_-_8867639 | 0.67 |
ENST00000619866.5
|
PIK3R6
|
phosphoinositide-3-kinase regulatory subunit 6 |
| chr2_+_142877653 | 0.67 |
ENST00000375773.6
ENST00000409512.5 ENST00000264170.9 ENST00000410015.6 |
KYNU
|
kynureninase |
| chr6_+_36594354 | 0.66 |
ENST00000373715.11
|
SRSF3
|
serine and arginine rich splicing factor 3 |
| chr5_+_149357999 | 0.65 |
ENST00000274569.9
|
PCYOX1L
|
prenylcysteine oxidase 1 like |
| chr15_-_55270249 | 0.65 |
ENST00000568803.1
|
RAB27A
|
RAB27A, member RAS oncogene family |
| chr17_-_46361718 | 0.63 |
ENST00000575960.5
ENST00000575698.5 ENST00000571246.5 ENST00000434041.6 ENST00000656849.1 ENST00000570618.5 ENST00000450673.4 ENST00000622877.4 |
ARL17B
|
ADP ribosylation factor like GTPase 17B |
| chr11_-_125111708 | 0.63 |
ENST00000531909.5
ENST00000529530.1 |
TMEM218
|
transmembrane protein 218 |
| chr11_-_118212885 | 0.61 |
ENST00000524477.5
|
JAML
|
junction adhesion molecule like |
| chr11_-_95789744 | 0.61 |
ENST00000358780.10
ENST00000542135.5 |
FAM76B
|
family with sequence similarity 76 member B |
| chr19_+_54137740 | 0.61 |
ENST00000644245.1
ENST00000646002.1 ENST00000221232.11 ENST00000440571.6 ENST00000617930.2 |
CNOT3
|
CCR4-NOT transcription complex subunit 3 |
| chr1_+_167721954 | 0.60 |
ENST00000359523.7
ENST00000392121.7 ENST00000474859.5 |
MPZL1
|
myelin protein zero like 1 |
| chr7_+_26291898 | 0.60 |
ENST00000416246.5
|
SNX10
|
sorting nexin 10 |
| chr1_+_27934980 | 0.59 |
ENST00000373894.8
|
SMPDL3B
|
sphingomyelin phosphodiesterase acid like 3B |
| chr7_-_101217569 | 0.59 |
ENST00000223127.8
|
PLOD3
|
procollagen-lysine,2-oxoglutarate 5-dioxygenase 3 |
| chr4_-_142846275 | 0.59 |
ENST00000513000.5
ENST00000509777.5 ENST00000503927.5 |
INPP4B
|
inositol polyphosphate-4-phosphatase type II B |
| chr6_-_32128191 | 0.59 |
ENST00000453203.2
ENST00000375203.8 ENST00000375201.8 |
ATF6B
|
activating transcription factor 6 beta |
| chr17_-_75262344 | 0.58 |
ENST00000579743.2
ENST00000578348.5 ENST00000582486.5 ENST00000582717.5 |
GGA3
|
golgi associated, gamma adaptin ear containing, ARF binding protein 3 |
| chr3_-_143848442 | 0.58 |
ENST00000474151.1
ENST00000316549.11 |
SLC9A9
|
solute carrier family 9 member A9 |
| chr1_-_1778790 | 0.58 |
ENST00000341991.7
|
NADK
|
NAD kinase |
| chr5_+_140639419 | 0.57 |
ENST00000513002.5
ENST00000394671.8 |
TMCO6
|
transmembrane and coiled-coil domains 6 |
| chr4_-_163613505 | 0.57 |
ENST00000339875.9
|
MARCHF1
|
membrane associated ring-CH-type finger 1 |
| chr15_+_40765620 | 0.57 |
ENST00000558467.1
|
GCHFR
|
GTP cyclohydrolase I feedback regulator |
| chr12_-_76423256 | 0.57 |
ENST00000546946.5
|
OSBPL8
|
oxysterol binding protein like 8 |
| chr4_+_25160631 | 0.56 |
ENST00000510415.1
ENST00000507794.2 ENST00000512921.4 |
SEPSECS-AS1
PI4K2B
|
SEPSECS antisense RNA 1 (head to head) phosphatidylinositol 4-kinase type 2 beta |
| chr15_-_44676824 | 0.56 |
ENST00000560110.1
|
PATL2
|
PAT1 homolog 2 |
| chr9_+_122370523 | 0.56 |
ENST00000643810.1
ENST00000540753.6 |
PTGS1
|
prostaglandin-endoperoxide synthase 1 |
| chr8_+_97869040 | 0.55 |
ENST00000254898.7
ENST00000524308.5 ENST00000522025.6 |
MATN2
|
matrilin 2 |
| chr13_+_45464901 | 0.55 |
ENST00000349995.10
|
COG3
|
component of oligomeric golgi complex 3 |
| chr19_+_49527988 | 0.55 |
ENST00000270645.8
|
RCN3
|
reticulocalbin 3 |
| chrX_+_41689006 | 0.55 |
ENST00000378138.5
ENST00000620846.1 ENST00000649219.1 |
GPR34
|
G protein-coupled receptor 34 |
| chr8_-_121641424 | 0.53 |
ENST00000303924.5
|
HAS2
|
hyaluronan synthase 2 |
| chr6_-_116545658 | 0.53 |
ENST00000368602.4
|
TRAPPC3L
|
trafficking protein particle complex 3 like |
| chr18_+_63887698 | 0.53 |
ENST00000457692.5
ENST00000299502.9 ENST00000413956.5 |
SERPINB2
|
serpin family B member 2 |
| chr2_+_8682046 | 0.52 |
ENST00000331129.3
ENST00000396290.2 |
ID2
|
inhibitor of DNA binding 2 |
| chr2_+_171453122 | 0.52 |
ENST00000611110.4
ENST00000339506.7 |
DCAF17
|
DDB1 and CUL4 associated factor 17 |
| chr11_+_33039996 | 0.52 |
ENST00000432887.5
ENST00000528898.1 ENST00000531632.6 |
TCP11L1
|
t-complex 11 like 1 |
| chr16_+_14186707 | 0.52 |
ENST00000572567.5
|
MRTFB
|
myocardin related transcription factor B |
| chr12_+_15546344 | 0.51 |
ENST00000674388.1
ENST00000542557.5 ENST00000445537.6 ENST00000544244.5 ENST00000442921.7 |
PTPRO
|
protein tyrosine phosphatase receptor type O |
| chr20_-_290717 | 0.51 |
ENST00000360321.7
ENST00000400269.4 |
C20orf96
|
chromosome 20 open reading frame 96 |
| chr17_-_50707855 | 0.51 |
ENST00000285243.7
|
ANKRD40
|
ankyrin repeat domain 40 |
| chr5_+_132873660 | 0.51 |
ENST00000296877.3
|
LEAP2
|
liver enriched antimicrobial peptide 2 |
| chr7_-_100119323 | 0.50 |
ENST00000523306.5
ENST00000344095.8 ENST00000417349.5 ENST00000493322.5 ENST00000520135.5 ENST00000460673.2 ENST00000453269.7 ENST00000452041.5 ENST00000452438.6 ENST00000451699.5 |
TAF6
|
TATA-box binding protein associated factor 6 |
| chr17_+_46295099 | 0.50 |
ENST00000393465.7
ENST00000320254.5 |
LRRC37A
|
leucine rich repeat containing 37A |
| chr17_-_35119733 | 0.50 |
ENST00000460118.6
ENST00000335858.11 |
RAD51D
|
RAD51 paralog D |
| chr11_+_47272244 | 0.49 |
ENST00000422579.1
|
MADD
|
MAP kinase activating death domain |
| chr1_+_160400543 | 0.49 |
ENST00000368061.3
|
VANGL2
|
VANGL planar cell polarity protein 2 |
| chr5_+_172641241 | 0.49 |
ENST00000369800.6
ENST00000520919.5 ENST00000522853.5 |
NEURL1B
|
neuralized E3 ubiquitin protein ligase 1B |
| chr3_-_52535006 | 0.48 |
ENST00000307076.8
|
NT5DC2
|
5'-nucleotidase domain containing 2 |
| chr15_+_64387828 | 0.47 |
ENST00000261884.8
|
TRIP4
|
thyroid hormone receptor interactor 4 |
| chr2_+_48314637 | 0.46 |
ENST00000413569.5
ENST00000340553.8 |
FOXN2
|
forkhead box N2 |
| chr6_+_26204552 | 0.46 |
ENST00000615164.2
|
H4C5
|
H4 clustered histone 5 |
| chr1_-_1778399 | 0.45 |
ENST00000341426.9
|
NADK
|
NAD kinase |
| chrX_+_41688967 | 0.45 |
ENST00000378142.9
|
GPR34
|
G protein-coupled receptor 34 |
| chr11_-_95789474 | 0.44 |
ENST00000536839.1
|
FAM76B
|
family with sequence similarity 76 member B |
| chr12_+_16347102 | 0.43 |
ENST00000536371.5
ENST00000010404.6 |
MGST1
|
microsomal glutathione S-transferase 1 |
| chr6_-_110815152 | 0.43 |
ENST00000413605.6
|
CDK19
|
cyclin dependent kinase 19 |
| chr11_+_95790459 | 0.43 |
ENST00000325486.9
ENST00000325542.10 ENST00000544522.5 ENST00000541365.5 |
CEP57
|
centrosomal protein 57 |
| chr12_-_51028234 | 0.42 |
ENST00000547688.7
ENST00000394904.9 |
SLC11A2
|
solute carrier family 11 member 2 |
| chr22_+_21642287 | 0.42 |
ENST00000248958.5
|
SDF2L1
|
stromal cell derived factor 2 like 1 |
| chr3_+_158801926 | 0.42 |
ENST00000622669.4
ENST00000392813.8 ENST00000415822.8 ENST00000651862.1 ENST00000264266.12 |
MFSD1
|
major facilitator superfamily domain containing 1 |
| chr14_-_24242600 | 0.42 |
ENST00000646753.1
ENST00000558566.1 ENST00000267415.12 ENST00000559019.1 ENST00000399423.8 ENST00000626689.2 |
TINF2
|
TERF1 interacting nuclear factor 2 |
| chr8_+_27311620 | 0.41 |
ENST00000522338.5
|
PTK2B
|
protein tyrosine kinase 2 beta |
| chr20_-_45972171 | 0.41 |
ENST00000322927.3
|
ZNF335
|
zinc finger protein 335 |
| chr16_+_51553436 | 0.41 |
ENST00000565308.2
|
HNRNPA1P48
|
heterogeneous nuclear ribonucleoprotein A1 pseudogene 48 |
| chr20_+_59996335 | 0.41 |
ENST00000244049.7
ENST00000350849.10 ENST00000456106.1 |
CDH26
|
cadherin 26 |
| chr4_+_85604146 | 0.40 |
ENST00000512201.5
|
ARHGAP24
|
Rho GTPase activating protein 24 |
| chr1_-_150697128 | 0.40 |
ENST00000427665.1
ENST00000271732.8 |
GOLPH3L
|
golgi phosphoprotein 3 like |
| chr4_+_94207596 | 0.40 |
ENST00000359052.8
|
SMARCAD1
|
SWI/SNF-related, matrix-associated actin-dependent regulator of chromatin, subfamily a, containing DEAD/H box 1 |
| chr3_-_122022122 | 0.40 |
ENST00000393631.5
ENST00000273691.7 ENST00000344209.10 |
ILDR1
|
immunoglobulin like domain containing receptor 1 |
| chr11_-_60243103 | 0.39 |
ENST00000651255.1
|
MS4A4E
|
membrane spanning 4-domains A4E |
| chrX_+_13689116 | 0.39 |
ENST00000464506.2
ENST00000243325.6 |
RAB9A
|
RAB9A, member RAS oncogene family |
| chr3_+_136819069 | 0.38 |
ENST00000393079.3
ENST00000446465.3 |
SLC35G2
|
solute carrier family 35 member G2 |
| chr5_+_140639494 | 0.38 |
ENST00000252100.6
|
TMCO6
|
transmembrane and coiled-coil domains 6 |
| chr19_+_48445961 | 0.38 |
ENST00000253237.10
|
GRWD1
|
glutamate rich WD repeat containing 1 |
| chr12_+_16347665 | 0.37 |
ENST00000535309.5
ENST00000540056.5 ENST00000396209.5 ENST00000540126.5 |
MGST1
|
microsomal glutathione S-transferase 1 |
| chr12_+_16347637 | 0.37 |
ENST00000543076.5
ENST00000396210.8 |
MGST1
|
microsomal glutathione S-transferase 1 |
| chr1_+_15764419 | 0.36 |
ENST00000441801.6
|
FBLIM1
|
filamin binding LIM protein 1 |
| chr1_+_192636121 | 0.36 |
ENST00000543215.5
ENST00000391995.7 |
RGS13
|
regulator of G protein signaling 13 |
| chr2_+_186694007 | 0.35 |
ENST00000304698.10
|
FAM171B
|
family with sequence similarity 171 member B |
| chr4_-_99290975 | 0.35 |
ENST00000209668.3
|
ADH1A
|
alcohol dehydrogenase 1A (class I), alpha polypeptide |
| chr8_-_41309434 | 0.35 |
ENST00000220772.8
|
SFRP1
|
secreted frizzled related protein 1 |
| chr6_-_169250825 | 0.35 |
ENST00000676869.1
ENST00000676760.1 |
THBS2
|
thrombospondin 2 |
| chr10_+_4963406 | 0.34 |
ENST00000380872.9
ENST00000442997.5 |
AKR1C1
|
aldo-keto reductase family 1 member C1 |
| chrX_-_13817027 | 0.34 |
ENST00000493677.5
ENST00000355135.6 ENST00000316715.9 |
GPM6B
|
glycoprotein M6B |
| chr12_+_54854505 | 0.34 |
ENST00000308796.11
ENST00000619042.1 |
MUCL1
|
mucin like 1 |
| chr12_-_6631632 | 0.34 |
ENST00000431922.1
|
LPAR5
|
lysophosphatidic acid receptor 5 |
| chr7_-_135211313 | 0.34 |
ENST00000682802.1
ENST00000683848.1 ENST00000354475.5 |
WDR91
|
WD repeat domain 91 |
| chr8_+_56211686 | 0.33 |
ENST00000521831.5
ENST00000303759.3 ENST00000517636.5 ENST00000517933.5 ENST00000355315.8 ENST00000518801.5 ENST00000523975.5 ENST00000396723.9 ENST00000523061.5 ENST00000521524.5 |
CHCHD7
|
coiled-coil-helix-coiled-coil-helix domain containing 7 |
| chr19_+_49528290 | 0.33 |
ENST00000597801.1
|
RCN3
|
reticulocalbin 3 |
| chr7_-_100167284 | 0.33 |
ENST00000413800.5
|
GAL3ST4
|
galactose-3-O-sulfotransferase 4 |
| chr8_-_673547 | 0.33 |
ENST00000522893.1
|
ERICH1
|
glutamate rich 1 |
| chr7_-_100119840 | 0.32 |
ENST00000437822.6
|
TAF6
|
TATA-box binding protein associated factor 6 |
| chr4_+_127632926 | 0.31 |
ENST00000335251.11
|
INTU
|
inturned planar cell polarity protein |
| chr22_-_28712136 | 0.31 |
ENST00000464581.6
|
CHEK2
|
checkpoint kinase 2 |
| chr7_+_5879827 | 0.31 |
ENST00000416608.5
|
OCM
|
oncomodulin |
| chr6_-_110815408 | 0.30 |
ENST00000368911.8
|
CDK19
|
cyclin dependent kinase 19 |
| chr19_+_48445795 | 0.30 |
ENST00000598711.1
|
GRWD1
|
glutamate rich WD repeat containing 1 |
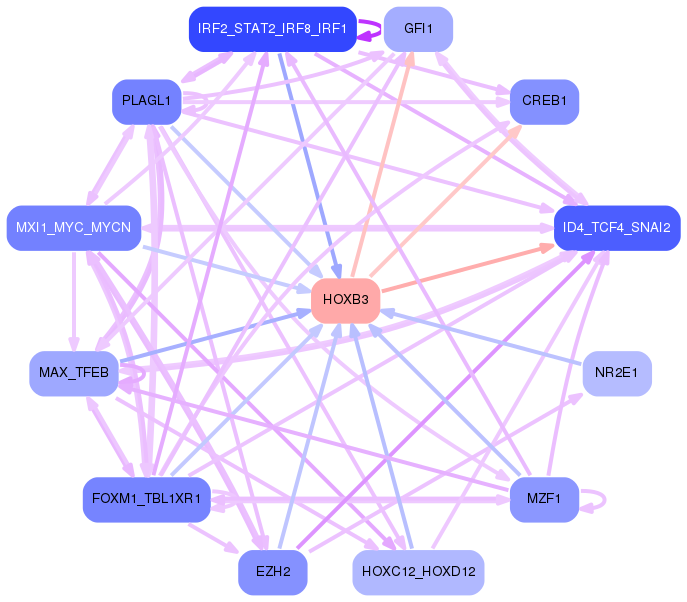
Network of associatons between targets according to the STRING database.

First level regulatory network of HOXB3
Gene Ontology Analysis
Gene overrepresentation in biological process category:
| Log-likelihood per target | Total log-likelihood | Term | Description |
|---|---|---|---|
| 1.3 | 4.0 | GO:0070563 | negative regulation of vitamin D receptor signaling pathway(GO:0070563) |
| 0.7 | 5.0 | GO:1903435 | positive regulation of constitutive secretory pathway(GO:1903435) |
| 0.5 | 1.4 | GO:0050717 | positive regulation of interleukin-1 alpha secretion(GO:0050717) |
| 0.4 | 1.3 | GO:0002416 | IgG immunoglobulin transcytosis in epithelial cells mediated by FcRn immunoglobulin receptor(GO:0002416) |
| 0.4 | 1.2 | GO:0071449 | cellular response to lipid hydroperoxide(GO:0071449) |
| 0.4 | 1.8 | GO:0033031 | positive regulation of neutrophil apoptotic process(GO:0033031) |
| 0.4 | 1.1 | GO:0002912 | negative regulation of T cell tolerance induction(GO:0002665) negative regulation of T cell anergy(GO:0002668) negative regulation of lymphocyte anergy(GO:0002912) regulation of lymphotoxin A production(GO:0032681) positive regulation of lymphotoxin A production(GO:0032761) regulation of lymphotoxin A biosynthetic process(GO:0043016) positive regulation of lymphotoxin A biosynthetic process(GO:0043017) |
| 0.3 | 1.8 | GO:0007386 | compartment pattern specification(GO:0007386) |
| 0.3 | 0.9 | GO:1990579 | protein trans-autophosphorylation(GO:0036290) peptidyl-serine trans-autophosphorylation(GO:1990579) |
| 0.3 | 0.8 | GO:1902955 | regulation of choline O-acetyltransferase activity(GO:1902769) positive regulation of choline O-acetyltransferase activity(GO:1902771) negative regulation of tau-protein kinase activity(GO:1902948) positive regulation of early endosome to recycling endosome transport(GO:1902955) negative regulation of aspartic-type endopeptidase activity involved in amyloid precursor protein catabolic process(GO:1902960) negative regulation of neurofibrillary tangle assembly(GO:1902997) negative regulation of aspartic-type peptidase activity(GO:1905246) |
| 0.2 | 1.5 | GO:2000538 | regulation of cGMP-mediated signaling(GO:0010752) regulation of B cell chemotaxis(GO:2000537) positive regulation of B cell chemotaxis(GO:2000538) |
| 0.2 | 0.7 | GO:0070105 | positive regulation of interleukin-6-mediated signaling pathway(GO:0070105) |
| 0.2 | 0.7 | GO:0019442 | tryptophan catabolic process to acetyl-CoA(GO:0019442) |
| 0.2 | 1.3 | GO:0034164 | negative regulation of toll-like receptor 9 signaling pathway(GO:0034164) |
| 0.2 | 0.7 | GO:0030327 | prenylated protein catabolic process(GO:0030327) |
| 0.2 | 1.0 | GO:0070837 | dehydroascorbic acid transport(GO:0070837) |
| 0.2 | 0.6 | GO:0031104 | dendrite regeneration(GO:0031104) |
| 0.2 | 0.8 | GO:0008616 | queuosine biosynthetic process(GO:0008616) queuosine metabolic process(GO:0046116) |
| 0.1 | 1.0 | GO:0070358 | actin polymerization-dependent cell motility(GO:0070358) |
| 0.1 | 0.9 | GO:0001692 | histamine metabolic process(GO:0001692) |
| 0.1 | 0.6 | GO:0010607 | negative regulation of cytoplasmic mRNA processing body assembly(GO:0010607) |
| 0.1 | 0.8 | GO:1903904 | negative regulation of establishment of T cell polarity(GO:1903904) negative regulation of Rho guanyl-nucleotide exchange factor activity(GO:2001107) |
| 0.1 | 0.5 | GO:0046379 | extracellular polysaccharide biosynthetic process(GO:0045226) extracellular polysaccharide metabolic process(GO:0046379) |
| 0.1 | 3.3 | GO:2000353 | positive regulation of endothelial cell apoptotic process(GO:2000353) |
| 0.1 | 0.5 | GO:0071931 | positive regulation of transcription involved in G1/S transition of mitotic cell cycle(GO:0071931) |
| 0.1 | 1.0 | GO:0006741 | NADP biosynthetic process(GO:0006741) |
| 0.1 | 0.5 | GO:0036058 | filtration diaphragm assembly(GO:0036058) slit diaphragm assembly(GO:0036060) |
| 0.1 | 21.1 | GO:0006958 | complement activation, classical pathway(GO:0006958) |
| 0.1 | 0.5 | GO:0022007 | neural plate elongation(GO:0014022) convergent extension involved in neural plate elongation(GO:0022007) dichotomous subdivision of terminal units involved in lung branching(GO:0060448) |
| 0.1 | 0.6 | GO:0046946 | hydroxylysine metabolic process(GO:0046946) hydroxylysine biosynthetic process(GO:0046947) |
| 0.1 | 0.3 | GO:0014034 | neural crest cell fate commitment(GO:0014034) regulation of midbrain dopaminergic neuron differentiation(GO:1904956) |
| 0.1 | 0.9 | GO:0010836 | negative regulation of protein ADP-ribosylation(GO:0010836) |
| 0.1 | 1.0 | GO:0035879 | plasma membrane lactate transport(GO:0035879) |
| 0.1 | 2.0 | GO:0019371 | cyclooxygenase pathway(GO:0019371) |
| 0.1 | 1.1 | GO:0001731 | formation of translation preinitiation complex(GO:0001731) |
| 0.1 | 0.3 | GO:0071395 | response to jasmonic acid(GO:0009753) cellular response to jasmonic acid stimulus(GO:0071395) |
| 0.1 | 0.9 | GO:0034351 | regulation of glial cell apoptotic process(GO:0034350) negative regulation of glial cell apoptotic process(GO:0034351) |
| 0.1 | 0.5 | GO:0070086 | ubiquitin-dependent endocytosis(GO:0070086) |
| 0.1 | 2.0 | GO:0035589 | G-protein coupled purinergic nucleotide receptor signaling pathway(GO:0035589) |
| 0.1 | 1.4 | GO:0019532 | oxalate transport(GO:0019532) |
| 0.1 | 1.1 | GO:0043249 | erythrocyte maturation(GO:0043249) |
| 0.1 | 0.4 | GO:0015692 | lead ion transport(GO:0015692) |
| 0.1 | 0.3 | GO:0000454 | snoRNA guided rRNA pseudouridine synthesis(GO:0000454) |
| 0.1 | 0.7 | GO:0070162 | adiponectin secretion(GO:0070162) regulation of adiponectin secretion(GO:0070163) |
| 0.1 | 0.6 | GO:0035696 | monocyte extravasation(GO:0035696) |
| 0.1 | 13.9 | GO:0002377 | immunoglobulin production(GO:0002377) |
| 0.1 | 0.5 | GO:0032483 | regulation of Rab protein signal transduction(GO:0032483) |
| 0.1 | 1.8 | GO:0032695 | negative regulation of interleukin-12 production(GO:0032695) |
| 0.1 | 0.5 | GO:0000707 | meiotic DNA recombinase assembly(GO:0000707) |
| 0.1 | 0.2 | GO:1903925 | signal transduction involved in intra-S DNA damage checkpoint(GO:0072428) negative regulation of mitotic cell cycle DNA replication(GO:1903464) response to bisphenol A(GO:1903925) cellular response to bisphenol A(GO:1903926) |
| 0.1 | 0.8 | GO:1900028 | negative regulation of ruffle assembly(GO:1900028) |
| 0.0 | 0.6 | GO:0090204 | protein localization to nuclear pore(GO:0090204) |
| 0.0 | 0.2 | GO:0035419 | detection of peptidoglycan(GO:0032499) activation of MAPK activity involved in innate immune response(GO:0035419) regulation of prostaglandin-endoperoxide synthase activity(GO:0060584) positive regulation of prostaglandin-endoperoxide synthase activity(GO:0060585) |
| 0.0 | 0.3 | GO:1904550 | chemotaxis to arachidonic acid(GO:0034670) response to arachidonic acid(GO:1904550) |
| 0.0 | 0.3 | GO:0010813 | neuropeptide catabolic process(GO:0010813) substance P catabolic process(GO:0010814) calcitonin catabolic process(GO:0010816) endothelin maturation(GO:0034959) |
| 0.0 | 0.8 | GO:0007221 | positive regulation of transcription of Notch receptor target(GO:0007221) |
| 0.0 | 3.9 | GO:0002260 | lymphocyte homeostasis(GO:0002260) |
| 0.0 | 0.2 | GO:0061357 | positive regulation of Wnt protein secretion(GO:0061357) |
| 0.0 | 1.5 | GO:0050869 | negative regulation of B cell activation(GO:0050869) |
| 0.0 | 0.2 | GO:0071874 | microglia differentiation(GO:0014004) microglia development(GO:0014005) smooth endoplasmic reticulum calcium ion homeostasis(GO:0051563) cellular response to norepinephrine stimulus(GO:0071874) |
| 0.0 | 3.4 | GO:0034260 | negative regulation of GTPase activity(GO:0034260) |
| 0.0 | 0.2 | GO:0090290 | positive regulation of osteoclast proliferation(GO:0090290) |
| 0.0 | 0.4 | GO:0048194 | Golgi vesicle budding(GO:0048194) |
| 0.0 | 0.1 | GO:0099404 | negative regulation of maintenance of sister chromatid cohesion(GO:0034092) negative regulation of maintenance of mitotic sister chromatid cohesion(GO:0034183) maintenance of mitotic sister chromatid cohesion, telomeric(GO:0099403) mitotic sister chromatid cohesion, telomeric(GO:0099404) regulation of maintenance of mitotic sister chromatid cohesion, telomeric(GO:1904907) negative regulation of maintenance of mitotic sister chromatid cohesion, telomeric(GO:1904908) |
| 0.0 | 0.4 | GO:0052405 | negative regulation by host of symbiont molecular function(GO:0052405) |
| 0.0 | 0.4 | GO:0006685 | sphingomyelin catabolic process(GO:0006685) |
| 0.0 | 1.7 | GO:0019731 | antibacterial humoral response(GO:0019731) |
| 0.0 | 1.1 | GO:0050860 | negative regulation of T cell receptor signaling pathway(GO:0050860) |
| 0.0 | 1.4 | GO:0071539 | protein localization to centrosome(GO:0071539) |
| 0.0 | 0.6 | GO:0036500 | ATF6-mediated unfolded protein response(GO:0036500) |
| 0.0 | 0.1 | GO:0006617 | SRP-dependent cotranslational protein targeting to membrane, signal sequence recognition(GO:0006617) |
| 0.0 | 0.1 | GO:0002881 | negative regulation of chronic inflammatory response to non-antigenic stimulus(GO:0002881) |
| 0.0 | 0.1 | GO:0033140 | negative regulation of peptidyl-serine phosphorylation of STAT protein(GO:0033140) |
| 0.0 | 0.3 | GO:2000645 | negative regulation of receptor catabolic process(GO:2000645) |
| 0.0 | 0.6 | GO:1990118 | sodium ion import across plasma membrane(GO:0098719) sodium ion import into cell(GO:1990118) |
| 0.0 | 0.3 | GO:0051581 | negative regulation of neurotransmitter uptake(GO:0051581) regulation of serotonin uptake(GO:0051611) negative regulation of serotonin uptake(GO:0051612) |
| 0.0 | 0.3 | GO:0008063 | Toll signaling pathway(GO:0008063) |
| 0.0 | 0.1 | GO:2001271 | negative regulation of cysteine-type endopeptidase activity involved in execution phase of apoptosis(GO:2001271) |
| 0.0 | 0.4 | GO:0035269 | protein O-linked mannosylation(GO:0035269) |
| 0.0 | 0.6 | GO:0001829 | trophectodermal cell differentiation(GO:0001829) |
| 0.0 | 0.4 | GO:0080182 | histone H3-K4 trimethylation(GO:0080182) |
| 0.0 | 0.2 | GO:1904862 | inhibitory synapse assembly(GO:1904862) |
| 0.0 | 0.5 | GO:0006069 | ethanol oxidation(GO:0006069) |
| 0.0 | 0.2 | GO:2000767 | positive regulation of cytoplasmic translation(GO:2000767) |
| 0.0 | 2.0 | GO:0070206 | protein trimerization(GO:0070206) |
| 0.0 | 0.1 | GO:0015785 | UDP-galactose transport(GO:0015785) UDP-galactose transmembrane transport(GO:0072334) |
| 0.0 | 0.3 | GO:0016255 | attachment of GPI anchor to protein(GO:0016255) |
| 0.0 | 0.4 | GO:0033623 | regulation of integrin activation(GO:0033623) |
| 0.0 | 0.1 | GO:0051970 | negative regulation of transmission of nerve impulse(GO:0051970) |
| 0.0 | 0.1 | GO:0033387 | putrescine biosynthetic process from ornithine(GO:0033387) |
| 0.0 | 0.2 | GO:0031665 | negative regulation of lipopolysaccharide-mediated signaling pathway(GO:0031665) |
| 0.0 | 0.7 | GO:0006337 | nucleosome disassembly(GO:0006337) |
| 0.0 | 0.7 | GO:1904659 | hexose transmembrane transport(GO:0035428) glucose transmembrane transport(GO:1904659) |
| 0.0 | 0.2 | GO:0009414 | response to water deprivation(GO:0009414) |
| 0.0 | 0.3 | GO:0010839 | negative regulation of keratinocyte proliferation(GO:0010839) |
| 0.0 | 0.3 | GO:0051546 | keratinocyte migration(GO:0051546) |
| 0.0 | 0.8 | GO:0032731 | positive regulation of interleukin-1 beta production(GO:0032731) |
| 0.0 | 0.4 | GO:0070933 | histone H4 deacetylation(GO:0070933) |
| 0.0 | 0.2 | GO:2000628 | regulation of miRNA metabolic process(GO:2000628) |
| 0.0 | 0.2 | GO:0006689 | ganglioside catabolic process(GO:0006689) |
| 0.0 | 0.8 | GO:0030199 | collagen fibril organization(GO:0030199) |
| 0.0 | 0.1 | GO:1904387 | cellular response to thyroxine stimulus(GO:0097069) cellular response to L-phenylalanine derivative(GO:1904387) |
| 0.0 | 0.5 | GO:0042269 | regulation of natural killer cell mediated cytotoxicity(GO:0042269) |
| 0.0 | 0.3 | GO:0042730 | fibrinolysis(GO:0042730) |
| 0.0 | 1.2 | GO:0009301 | snRNA transcription(GO:0009301) snRNA transcription from RNA polymerase II promoter(GO:0042795) |
Gene overrepresentation in cellular component category:
| Log-likelihood per target | Total log-likelihood | Term | Description |
|---|---|---|---|
| 0.3 | 0.9 | GO:1990332 | Ire1 complex(GO:1990332) |
| 0.3 | 5.3 | GO:0033093 | Weibel-Palade body(GO:0033093) |
| 0.3 | 1.4 | GO:0097179 | protease inhibitor complex(GO:0097179) |
| 0.2 | 0.7 | GO:0005944 | phosphatidylinositol 3-kinase complex, class IB(GO:0005944) |
| 0.2 | 0.8 | GO:0005595 | collagen type XII trimer(GO:0005595) |
| 0.2 | 0.5 | GO:0060187 | cell pole(GO:0060187) |
| 0.1 | 1.1 | GO:0097452 | GAIT complex(GO:0097452) |
| 0.1 | 1.4 | GO:0031313 | extrinsic component of endosome membrane(GO:0031313) |
| 0.1 | 2.5 | GO:0017146 | NMDA selective glutamate receptor complex(GO:0017146) |
| 0.1 | 0.4 | GO:0070826 | paraferritin complex(GO:0070826) |
| 0.1 | 0.8 | GO:0060171 | stereocilium membrane(GO:0060171) |
| 0.1 | 0.5 | GO:0033063 | Rad51B-Rad51C-Rad51D-XRCC2 complex(GO:0033063) |
| 0.1 | 3.7 | GO:0042571 | immunoglobulin complex, circulating(GO:0042571) |
| 0.1 | 0.9 | GO:0070187 | telosome(GO:0070187) |
| 0.1 | 1.1 | GO:0005641 | nuclear envelope lumen(GO:0005641) |
| 0.1 | 1.2 | GO:0033276 | transcription factor TFTC complex(GO:0033276) |
| 0.0 | 0.1 | GO:0002947 | tumor necrosis factor receptor superfamily complex(GO:0002947) |
| 0.0 | 3.9 | GO:0001772 | immunological synapse(GO:0001772) |
| 0.0 | 0.2 | GO:0005889 | hydrogen:potassium-exchanging ATPase complex(GO:0005889) |
| 0.0 | 1.3 | GO:0030285 | integral component of synaptic vesicle membrane(GO:0030285) intrinsic component of synaptic vesicle membrane(GO:0098563) |
| 0.0 | 0.3 | GO:0042765 | GPI-anchor transamidase complex(GO:0042765) |
| 0.0 | 0.3 | GO:0072589 | box H/ACA scaRNP complex(GO:0072589) box H/ACA telomerase RNP complex(GO:0090661) |
| 0.0 | 0.2 | GO:0097362 | MCM8-MCM9 complex(GO:0097362) |
| 0.0 | 0.3 | GO:1990589 | ATF4-CREB1 transcription factor complex(GO:1990589) |
| 0.0 | 0.6 | GO:0030015 | CCR4-NOT core complex(GO:0030015) |
| 0.0 | 1.0 | GO:0044232 | organelle membrane contact site(GO:0044232) |
| 0.0 | 0.5 | GO:0030008 | TRAPP complex(GO:0030008) |
| 0.0 | 0.4 | GO:0061689 | tricellular tight junction(GO:0061689) |
| 0.0 | 2.2 | GO:0015030 | Cajal body(GO:0015030) |
| 0.0 | 1.9 | GO:0030173 | integral component of Golgi membrane(GO:0030173) |
| 0.0 | 0.1 | GO:0031933 | telomeric heterochromatin(GO:0031933) |
| 0.0 | 0.2 | GO:0042788 | polysomal ribosome(GO:0042788) |
| 0.0 | 0.1 | GO:0034388 | Pwp2p-containing subcomplex of 90S preribosome(GO:0034388) |
| 0.0 | 0.1 | GO:0016035 | zeta DNA polymerase complex(GO:0016035) |
| 0.0 | 0.3 | GO:0034663 | endoplasmic reticulum chaperone complex(GO:0034663) |
| 0.0 | 0.6 | GO:0030867 | rough endoplasmic reticulum membrane(GO:0030867) |
| 0.0 | 2.0 | GO:0001750 | photoreceptor outer segment(GO:0001750) |
| 0.0 | 2.9 | GO:0072562 | blood microparticle(GO:0072562) |
| 0.0 | 0.2 | GO:0000940 | condensed chromosome outer kinetochore(GO:0000940) |
| 0.0 | 0.2 | GO:0017119 | Golgi transport complex(GO:0017119) |
| 0.0 | 0.1 | GO:0005786 | signal recognition particle, endoplasmic reticulum targeting(GO:0005786) signal recognition particle(GO:0048500) |
| 0.0 | 0.1 | GO:0017109 | glutamate-cysteine ligase complex(GO:0017109) |
| 0.0 | 0.2 | GO:0000812 | Swr1 complex(GO:0000812) |
| 0.0 | 1.2 | GO:0035577 | azurophil granule membrane(GO:0035577) |
| 0.0 | 0.2 | GO:0070776 | H3 histone acetyltransferase complex(GO:0070775) MOZ/MORF histone acetyltransferase complex(GO:0070776) |
| 0.0 | 0.5 | GO:0080008 | Cul4-RING E3 ubiquitin ligase complex(GO:0080008) |
| 0.0 | 0.6 | GO:0016592 | mediator complex(GO:0016592) |
| 0.0 | 1.0 | GO:0055038 | recycling endosome membrane(GO:0055038) |
Gene overrepresentation in molecular function category:
| Log-likelihood per target | Total log-likelihood | Term | Description |
|---|---|---|---|
| 1.1 | 3.3 | GO:0005174 | CD40 receptor binding(GO:0005174) |
| 0.4 | 2.0 | GO:0004666 | prostaglandin-endoperoxide synthase activity(GO:0004666) |
| 0.4 | 1.8 | GO:0033829 | O-fucosylpeptide 3-beta-N-acetylglucosaminyltransferase activity(GO:0033829) |
| 0.3 | 1.3 | GO:0019770 | IgG receptor activity(GO:0019770) |
| 0.3 | 1.5 | GO:0043423 | 3-phosphoinositide-dependent protein kinase binding(GO:0043423) |
| 0.2 | 1.0 | GO:0033300 | dehydroascorbic acid transporter activity(GO:0033300) |
| 0.2 | 5.0 | GO:0031489 | myosin V binding(GO:0031489) |
| 0.1 | 0.6 | GO:0050211 | procollagen galactosyltransferase activity(GO:0050211) |
| 0.1 | 0.7 | GO:0016823 | hydrolase activity, acting on acid carbon-carbon bonds(GO:0016822) hydrolase activity, acting on acid carbon-carbon bonds, in ketonic substances(GO:0016823) |
| 0.1 | 0.5 | GO:0050698 | proteoglycan sulfotransferase activity(GO:0050698) |
| 0.1 | 0.4 | GO:0070506 | high-density lipoprotein particle receptor activity(GO:0070506) |
| 0.1 | 0.8 | GO:0008479 | queuine tRNA-ribosyltransferase activity(GO:0008479) |
| 0.1 | 32.9 | GO:0003823 | antigen binding(GO:0003823) |
| 0.1 | 3.9 | GO:0005095 | GTPase inhibitor activity(GO:0005095) |
| 0.1 | 0.5 | GO:0050501 | hyaluronan synthase activity(GO:0050501) |
| 0.1 | 0.9 | GO:0004699 | calcium-independent protein kinase C activity(GO:0004699) |
| 0.1 | 0.6 | GO:0034597 | phosphatidylinositol-3,4-bisphosphate 4-phosphatase activity(GO:0016316) inositol-1,3,4-trisphosphate 4-phosphatase activity(GO:0017161) phosphatidylinositol-4,5-bisphosphate 4-phosphatase activity(GO:0034597) inositol-3,4-bisphosphate 4-phosphatase activity(GO:0052828) |
| 0.1 | 1.3 | GO:0035374 | chondroitin sulfate binding(GO:0035374) |
| 0.1 | 0.3 | GO:0047718 | androsterone dehydrogenase activity(GO:0047023) indanol dehydrogenase activity(GO:0047718) |
| 0.1 | 0.3 | GO:0050309 | glucose-6-phosphatase activity(GO:0004346) sugar-terminal-phosphatase activity(GO:0050309) |
| 0.1 | 1.4 | GO:0019531 | oxalate transmembrane transporter activity(GO:0019531) |
| 0.1 | 1.6 | GO:0050700 | CARD domain binding(GO:0050700) |
| 0.1 | 2.0 | GO:0001608 | G-protein coupled nucleotide receptor activity(GO:0001608) G-protein coupled purinergic nucleotide receptor activity(GO:0045028) |
| 0.1 | 0.7 | GO:0016670 | oxidoreductase activity, acting on a sulfur group of donors, oxygen as acceptor(GO:0016670) |
| 0.1 | 0.6 | GO:0004430 | 1-phosphatidylinositol 4-kinase activity(GO:0004430) |
| 0.1 | 0.4 | GO:0015639 | cadmium ion transmembrane transporter activity(GO:0015086) cobalt ion transmembrane transporter activity(GO:0015087) lead ion transmembrane transporter activity(GO:0015094) ferrous iron uptake transmembrane transporter activity(GO:0015639) |
| 0.1 | 0.7 | GO:0005412 | glucose:sodium symporter activity(GO:0005412) |
| 0.1 | 1.4 | GO:0030306 | ADP-ribosylation factor binding(GO:0030306) |
| 0.1 | 1.2 | GO:0017162 | aryl hydrocarbon receptor binding(GO:0017162) |
| 0.1 | 0.4 | GO:0004169 | dolichyl-phosphate-mannose-protein mannosyltransferase activity(GO:0004169) |
| 0.1 | 0.2 | GO:0030290 | sphingolipid activator protein activity(GO:0030290) beta-N-acetylgalactosaminidase activity(GO:0032428) |
| 0.1 | 1.2 | GO:0043295 | glutathione binding(GO:0043295) |
| 0.1 | 1.3 | GO:0005522 | profilin binding(GO:0005522) |
| 0.1 | 0.5 | GO:0004024 | alcohol dehydrogenase activity, zinc-dependent(GO:0004024) |
| 0.1 | 0.8 | GO:0030020 | extracellular matrix structural constituent conferring tensile strength(GO:0030020) |
| 0.1 | 0.3 | GO:0016524 | latrotoxin receptor activity(GO:0016524) |
| 0.0 | 0.7 | GO:0046935 | 1-phosphatidylinositol-3-kinase regulator activity(GO:0046935) |
| 0.0 | 0.7 | GO:1990825 | sequence-specific mRNA binding(GO:1990825) |
| 0.0 | 0.3 | GO:0003923 | GPI-anchor transamidase activity(GO:0003923) |
| 0.0 | 0.6 | GO:0015386 | potassium:proton antiporter activity(GO:0015386) |
| 0.0 | 0.1 | GO:0008665 | 2'-phosphotransferase activity(GO:0008665) |
| 0.0 | 0.7 | GO:0003688 | DNA replication origin binding(GO:0003688) |
| 0.0 | 0.1 | GO:0015616 | DNA translocase activity(GO:0015616) |
| 0.0 | 0.3 | GO:1990763 | arrestin family protein binding(GO:1990763) |
| 0.0 | 0.3 | GO:0034513 | box H/ACA snoRNA binding(GO:0034513) |
| 0.0 | 1.4 | GO:0005545 | 1-phosphatidylinositol binding(GO:0005545) |
| 0.0 | 0.4 | GO:0004767 | sphingomyelin phosphodiesterase activity(GO:0004767) |
| 0.0 | 0.1 | GO:0016495 | C-X3-C chemokine receptor activity(GO:0016495) |
| 0.0 | 0.9 | GO:0005161 | platelet-derived growth factor receptor binding(GO:0005161) |
| 0.0 | 0.8 | GO:0004653 | polypeptide N-acetylgalactosaminyltransferase activity(GO:0004653) |
| 0.0 | 1.0 | GO:0017147 | Wnt-protein binding(GO:0017147) |
| 0.0 | 0.5 | GO:0008253 | 5'-nucleotidase activity(GO:0008253) |
| 0.0 | 1.0 | GO:0003951 | NAD+ kinase activity(GO:0003951) |
| 0.0 | 0.3 | GO:0030280 | structural constituent of epidermis(GO:0030280) |
| 0.0 | 0.5 | GO:0004089 | carbonate dehydratase activity(GO:0004089) |
| 0.0 | 4.8 | GO:0003705 | transcription factor activity, RNA polymerase II distal enhancer sequence-specific binding(GO:0003705) |
| 0.0 | 0.5 | GO:0000150 | recombinase activity(GO:0000150) |
| 0.0 | 0.1 | GO:0004853 | uroporphyrinogen decarboxylase activity(GO:0004853) |
| 0.0 | 0.1 | GO:0005459 | UDP-galactose transmembrane transporter activity(GO:0005459) |
| 0.0 | 0.2 | GO:0051425 | PTB domain binding(GO:0051425) |
| 0.0 | 0.1 | GO:0030620 | U2 snRNA binding(GO:0030620) |
| 0.0 | 1.1 | GO:0015026 | coreceptor activity(GO:0015026) |
| 0.0 | 0.1 | GO:0030942 | endoplasmic reticulum signal peptide binding(GO:0030942) |
| 0.0 | 0.2 | GO:0008097 | 5S rRNA binding(GO:0008097) |
| 0.0 | 0.6 | GO:0030742 | GTP-dependent protein binding(GO:0030742) |
| 0.0 | 0.9 | GO:0042162 | telomeric DNA binding(GO:0042162) |
| 0.0 | 0.9 | GO:0001784 | phosphotyrosine binding(GO:0001784) |
| 0.0 | 0.4 | GO:0031005 | filamin binding(GO:0031005) |
| 0.0 | 0.1 | GO:0004357 | glutamate-cysteine ligase activity(GO:0004357) |
| 0.0 | 0.1 | GO:0001733 | galactosylceramide sulfotransferase activity(GO:0001733) galactose 3-O-sulfotransferase activity(GO:0050694) |
| 0.0 | 0.0 | GO:0030350 | iron-responsive element binding(GO:0030350) |
| 0.0 | 0.3 | GO:0052629 | phosphatidylinositol-3,5-bisphosphate 3-phosphatase activity(GO:0052629) |
| 0.0 | 0.3 | GO:0034450 | ubiquitin-ubiquitin ligase activity(GO:0034450) |
Gene overrepresentation in curated gene sets: canonical pathways category:
| Log-likelihood per target | Total log-likelihood | Term | Description |
|---|---|---|---|
| 0.1 | 3.3 | PID INTEGRIN2 PATHWAY | Beta2 integrin cell surface interactions |
| 0.0 | 1.4 | PID ANTHRAX PATHWAY | Cellular roles of Anthrax toxin |
| 0.0 | 3.3 | PID KIT PATHWAY | Signaling events mediated by Stem cell factor receptor (c-Kit) |
| 0.0 | 1.5 | SA PTEN PATHWAY | PTEN is a tumor suppressor that dephosphorylates the lipid messenger phosphatidylinositol triphosphate. |
| 0.0 | 1.1 | PID IL12 STAT4 PATHWAY | IL12 signaling mediated by STAT4 |
| 0.0 | 0.7 | PID IL8 CXCR1 PATHWAY | IL8- and CXCR1-mediated signaling events |
| 0.0 | 0.9 | PID TXA2PATHWAY | Thromboxane A2 receptor signaling |
| 0.0 | 1.9 | PID MYC REPRESS PATHWAY | Validated targets of C-MYC transcriptional repression |
Gene overrepresentation in curated gene sets: REACTOME pathways category:
| Log-likelihood per target | Total log-likelihood | Term | Description |
|---|---|---|---|
| 0.1 | 5.0 | REACTOME INSULIN SYNTHESIS AND PROCESSING | Genes involved in Insulin Synthesis and Processing |
| 0.1 | 1.6 | REACTOME THE NLRP3 INFLAMMASOME | Genes involved in The NLRP3 inflammasome |
| 0.1 | 0.9 | REACTOME PACKAGING OF TELOMERE ENDS | Genes involved in Packaging Of Telomere Ends |
| 0.1 | 1.4 | REACTOME SYNTHESIS OF PIPS AT THE EARLY ENDOSOME MEMBRANE | Genes involved in Synthesis of PIPs at the early endosome membrane |
| 0.1 | 1.2 | REACTOME P2Y RECEPTORS | Genes involved in P2Y receptors |
| 0.1 | 1.8 | REACTOME PRE NOTCH PROCESSING IN GOLGI | Genes involved in Pre-NOTCH Processing in Golgi |
| 0.0 | 0.7 | REACTOME TRYPTOPHAN CATABOLISM | Genes involved in Tryptophan catabolism |
| 0.0 | 1.1 | REACTOME CD28 DEPENDENT VAV1 PATHWAY | Genes involved in CD28 dependent Vav1 pathway |
| 0.0 | 1.1 | REACTOME FACILITATIVE NA INDEPENDENT GLUCOSE TRANSPORTERS | Genes involved in Facilitative Na+-independent glucose transporters |
| 0.0 | 1.5 | REACTOME SIGNAL REGULATORY PROTEIN SIRP FAMILY INTERACTIONS | Genes involved in Signal regulatory protein (SIRP) family interactions |
| 0.0 | 0.8 | REACTOME NOTCH HLH TRANSCRIPTION PATHWAY | Genes involved in Notch-HLH transcription pathway |
| 0.0 | 1.3 | REACTOME GENERATION OF SECOND MESSENGER MOLECULES | Genes involved in Generation of second messenger molecules |
| 0.0 | 0.5 | REACTOME ETHANOL OXIDATION | Genes involved in Ethanol oxidation |
| 0.0 | 3.0 | REACTOME IMMUNOREGULATORY INTERACTIONS BETWEEN A LYMPHOID AND A NON LYMPHOID CELL | Genes involved in Immunoregulatory interactions between a Lymphoid and a non-Lymphoid cell |
| 0.0 | 0.5 | REACTOME REVERSIBLE HYDRATION OF CARBON DIOXIDE | Genes involved in Reversible Hydration of Carbon Dioxide |
| 0.0 | 0.6 | REACTOME TETRAHYDROBIOPTERIN BH4 SYNTHESIS RECYCLING SALVAGE AND REGULATION | Genes involved in Tetrahydrobiopterin (BH4) synthesis, recycling, salvage and regulation |
| 0.0 | 1.2 | REACTOME RNA POL II TRANSCRIPTION PRE INITIATION AND PROMOTER OPENING | Genes involved in RNA Polymerase II Transcription Pre-Initiation And Promoter Opening |
| 0.0 | 0.5 | REACTOME HYALURONAN METABOLISM | Genes involved in Hyaluronan metabolism |
| 0.0 | 0.9 | REACTOME EFFECTS OF PIP2 HYDROLYSIS | Genes involved in Effects of PIP2 hydrolysis |
| 0.0 | 0.3 | REACTOME IRAK1 RECRUITS IKK COMPLEX | Genes involved in IRAK1 recruits IKK complex |
| 0.0 | 0.8 | REACTOME GLUTATHIONE CONJUGATION | Genes involved in Glutathione conjugation |
| 0.0 | 0.7 | REACTOME G BETA GAMMA SIGNALLING THROUGH PI3KGAMMA | Genes involved in G beta:gamma signalling through PI3Kgamma |
| 0.0 | 4.1 | REACTOME SIGNALING BY RHO GTPASES | Genes involved in Signaling by Rho GTPases |
| 0.0 | 1.3 | REACTOME COLLAGEN FORMATION | Genes involved in Collagen formation |
| 0.0 | 0.8 | REACTOME MRNA 3 END PROCESSING | Genes involved in mRNA 3'-end processing |
| 0.0 | 0.6 | REACTOME DEADENYLATION OF MRNA | Genes involved in Deadenylation of mRNA |
| 0.0 | 1.0 | REACTOME PHASE1 FUNCTIONALIZATION OF COMPOUNDS | Genes involved in Phase 1 - Functionalization of compounds |