Project
Illumina Body Map 2 (GSE30611)
Navigation
Downloads
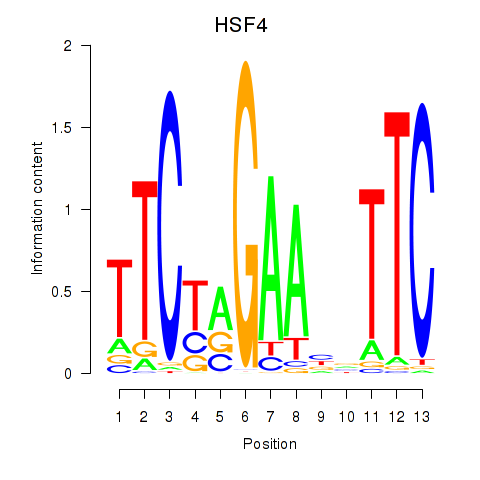
Results for HSF4
Z-value: 1.89
Motif logo
Transcription factors associated with HSF4
| Gene Symbol | Gene ID | Gene Info |
|---|---|---|
|
HSF4
|
ENSG00000102878.18 | heat shock transcription factor 4 |
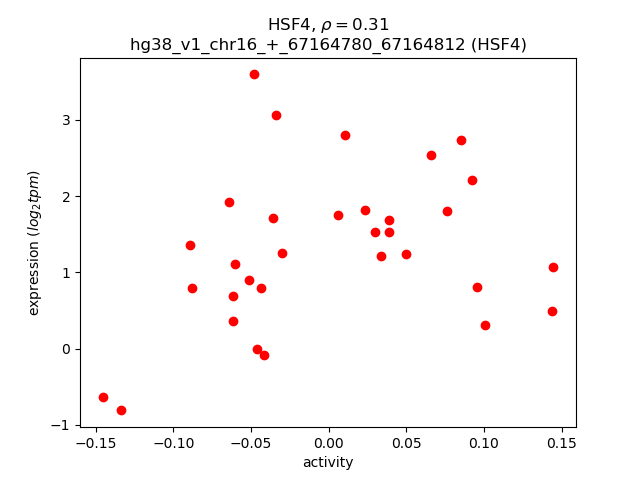
Activity-expression correlation:
| Gene | Promoter | Pearson corr. coef. | P-value | Plot |
|---|---|---|---|---|
| HSF4 | hg38_v1_chr16_+_67164780_67164812 | 0.31 | 8.9e-02 | Click! |
Activity profile of HSF4 motif
Sorted Z-values of HSF4 motif
| Promoter | Log-likelihood | Transcript | Gene | Gene Info |
|---|---|---|---|---|
| chr13_-_31161927 | 6.12 |
ENST00000380405.7
|
HSPH1
|
heat shock protein family H (Hsp110) member 1 |
| chr13_-_31162341 | 5.95 |
ENST00000445273.6
ENST00000630972.2 |
HSPH1
|
heat shock protein family H (Hsp110) member 1 |
| chr13_-_31161890 | 5.84 |
ENST00000320027.10
|
HSPH1
|
heat shock protein family H (Hsp110) member 1 |
| chr4_+_41256921 | 4.78 |
ENST00000284440.9
ENST00000508768.5 ENST00000512788.1 |
UCHL1
|
ubiquitin C-terminal hydrolase L1 |
| chr14_+_63204436 | 4.62 |
ENST00000316754.8
|
RHOJ
|
ras homolog family member J |
| chr19_+_6135635 | 4.05 |
ENST00000588304.5
ENST00000588722.5 ENST00000588485.6 ENST00000591403.5 ENST00000586696.5 ENST00000681525.1 ENST00000589401.5 |
ACSBG2
|
acyl-CoA synthetase bubblegum family member 2 |
| chr1_+_161524539 | 3.95 |
ENST00000309758.6
|
HSPA6
|
heat shock protein family A (Hsp70) member 6 |
| chr11_-_111923722 | 3.85 |
ENST00000527950.5
|
CRYAB
|
crystallin alpha B |
| chr1_+_156338455 | 3.67 |
ENST00000368253.6
ENST00000470342.5 ENST00000368254.6 |
TSACC
|
TSSK6 activating cochaperone |
| chr11_-_111910830 | 3.62 |
ENST00000526167.5
ENST00000651650.1 |
CRYAB
|
crystallin alpha B |
| chr11_-_111910888 | 3.61 |
ENST00000525823.1
ENST00000528961.6 |
CRYAB
|
crystallin alpha B |
| chr19_-_14518383 | 3.53 |
ENST00000254322.3
ENST00000595139.2 |
DNAJB1
|
DnaJ heat shock protein family (Hsp40) member B1 |
| chr12_+_2794961 | 3.39 |
ENST00000001008.6
|
FKBP4
|
FKBP prolyl isomerase 4 |
| chr14_-_102087034 | 3.34 |
ENST00000216281.13
ENST00000553585.5 |
HSP90AA1
|
heat shock protein 90 alpha family class A member 1 |
| chr5_+_40909490 | 3.23 |
ENST00000313164.10
|
C7
|
complement C7 |
| chr19_-_51390528 | 3.23 |
ENST00000570516.1
ENST00000574814.2 |
C19orf84
|
chromosome 19 open reading frame 84 |
| chr15_+_96325935 | 3.13 |
ENST00000421109.6
|
NR2F2
|
nuclear receptor subfamily 2 group F member 2 |
| chr11_-_111911759 | 3.11 |
ENST00000650687.2
|
CRYAB
|
crystallin alpha B |
| chr11_-_111910790 | 3.02 |
ENST00000533280.6
|
CRYAB
|
crystallin alpha B |
| chr19_-_6720641 | 2.99 |
ENST00000245907.11
|
C3
|
complement C3 |
| chr17_-_76141240 | 2.95 |
ENST00000322957.7
|
FOXJ1
|
forkhead box J1 |
| chr1_+_156338619 | 2.92 |
ENST00000481479.5
ENST00000368252.5 ENST00000466306.5 ENST00000368251.1 |
TSACC
|
TSSK6 activating cochaperone |
| chr11_+_64186163 | 2.90 |
ENST00000305218.9
ENST00000538945.5 |
STIP1
|
stress induced phosphoprotein 1 |
| chr4_+_76011171 | 2.80 |
ENST00000513353.5
ENST00000341029.9 |
ART3
|
ADP-ribosyltransferase 3 (inactive) |
| chr15_-_58065734 | 2.80 |
ENST00000347587.7
|
ALDH1A2
|
aldehyde dehydrogenase 1 family member A2 |
| chr9_-_76652516 | 2.75 |
ENST00000424866.1
|
PRUNE2
|
prune homolog 2 with BCH domain |
| chr15_-_58065870 | 2.62 |
ENST00000537372.5
|
ALDH1A2
|
aldehyde dehydrogenase 1 family member A2 |
| chr11_+_64186219 | 2.56 |
ENST00000543847.1
|
STIP1
|
stress induced phosphoprotein 1 |
| chr1_+_53459391 | 2.56 |
ENST00000371445.3
|
DMRTB1
|
DMRT like family B with proline rich C-terminal 1 |
| chr11_+_75562242 | 2.52 |
ENST00000526397.5
ENST00000529643.1 ENST00000525492.5 ENST00000530284.5 ENST00000358171.8 |
SERPINH1
|
serpin family H member 1 |
| chr15_-_58065703 | 2.51 |
ENST00000249750.9
|
ALDH1A2
|
aldehyde dehydrogenase 1 family member A2 |
| chr11_+_75562274 | 2.49 |
ENST00000532356.5
ENST00000524558.5 |
SERPINH1
|
serpin family H member 1 |
| chr1_-_173669835 | 2.48 |
ENST00000333279.3
|
ANKRD45
|
ankyrin repeat domain 45 |
| chr19_-_46471484 | 2.45 |
ENST00000313683.15
ENST00000602246.1 |
PNMA8A
|
PNMA family member 8A |
| chr1_+_92217910 | 2.38 |
ENST00000370375.8
ENST00000370373.2 |
C1orf146
|
chromosome 1 open reading frame 146 |
| chr12_-_88029385 | 2.28 |
ENST00000298699.7
ENST00000550553.5 |
C12orf50
|
chromosome 12 open reading frame 50 |
| chr3_-_42410558 | 2.28 |
ENST00000441172.1
ENST00000287748.8 |
LYZL4
|
lysozyme like 4 |
| chr1_-_182400660 | 2.27 |
ENST00000367565.2
|
TEDDM1
|
transmembrane epididymal protein 1 |
| chr11_+_75562056 | 2.26 |
ENST00000533603.5
|
SERPINH1
|
serpin family H member 1 |
| chr7_+_76303547 | 2.24 |
ENST00000429938.1
|
HSPB1
|
heat shock protein family B (small) member 1 |
| chr6_+_44247866 | 2.18 |
ENST00000371554.2
|
HSP90AB1
|
heat shock protein 90 alpha family class B member 1 |
| chr10_-_20897288 | 2.17 |
ENST00000377122.9
|
NEBL
|
nebulette |
| chr1_+_174999925 | 2.16 |
ENST00000367679.7
|
CACYBP
|
calcyclin binding protein |
| chr17_+_35760881 | 2.16 |
ENST00000605587.2
ENST00000604830.1 |
C17orf50
|
chromosome 17 open reading frame 50 |
| chrX_-_103093109 | 2.13 |
ENST00000395065.8
|
NXF3
|
nuclear RNA export factor 3 |
| chr18_-_74147816 | 2.11 |
ENST00000419743.7
ENST00000582526.1 |
FBXO15
|
F-box protein 15 |
| chr15_+_78264552 | 2.11 |
ENST00000394852.8
ENST00000343789.7 |
DNAJA4
|
DnaJ heat shock protein family (Hsp40) member A4 |
| chr19_-_14517425 | 2.09 |
ENST00000676577.1
ENST00000677204.1 ENST00000598235.2 |
DNAJB1
|
DnaJ heat shock protein family (Hsp40) member B1 |
| chr7_+_157336961 | 2.07 |
ENST00000429029.6
|
DNAJB6
|
DnaJ heat shock protein family (Hsp40) member B6 |
| chr9_-_135499846 | 2.05 |
ENST00000429260.7
|
C9orf116
|
chromosome 9 open reading frame 116 |
| chr11_-_10568650 | 2.04 |
ENST00000256178.8
|
LYVE1
|
lymphatic vessel endothelial hyaluronan receptor 1 |
| chr2_-_27139395 | 2.03 |
ENST00000432962.2
ENST00000335524.7 |
PRR30
|
proline rich 30 |
| chr3_+_45026296 | 2.01 |
ENST00000296130.5
|
CLEC3B
|
C-type lectin domain family 3 member B |
| chr20_+_57329801 | 1.94 |
ENST00000371263.8
ENST00000345868.8 ENST00000371260.8 ENST00000418127.5 |
SPO11
|
SPO11 initiator of meiotic double stranded breaks |
| chr19_+_11539894 | 1.94 |
ENST00000586059.5
|
CNN1
|
calponin 1 |
| chrX_-_81121663 | 1.93 |
ENST00000430960.5
ENST00000447319.5 |
HMGN5
|
high mobility group nucleosome binding domain 5 |
| chr7_+_76302665 | 1.90 |
ENST00000248553.7
ENST00000674638.1 ENST00000674547.1 ENST00000675226.1 ENST00000675538.1 ENST00000676231.1 ENST00000675134.1 ENST00000675906.1 ENST00000674650.1 |
HSPB1
|
heat shock protein family B (small) member 1 |
| chr12_+_103930600 | 1.86 |
ENST00000680316.1
ENST00000679861.1 |
HSP90B1
|
heat shock protein 90 beta family member 1 |
| chr20_-_44960348 | 1.85 |
ENST00000372813.4
|
TOMM34
|
translocase of outer mitochondrial membrane 34 |
| chr11_-_10568571 | 1.82 |
ENST00000529598.1
|
LYVE1
|
lymphatic vessel endothelial hyaluronan receptor 1 |
| chr2_+_197500371 | 1.80 |
ENST00000409468.1
ENST00000233893.10 |
HSPE1
|
heat shock protein family E (Hsp10) member 1 |
| chr1_+_175000126 | 1.79 |
ENST00000406752.1
ENST00000405362.1 |
CACYBP
|
calcyclin binding protein |
| chr5_-_178187364 | 1.79 |
ENST00000463439.3
|
GMCL2
|
germ cell-less 2, spermatogenesis associated |
| chr9_-_135699473 | 1.78 |
ENST00000425225.2
ENST00000298466.9 |
SOHLH1
|
spermatogenesis and oogenesis specific basic helix-loop-helix 1 |
| chr6_-_32371872 | 1.78 |
ENST00000527965.5
ENST00000532023.5 ENST00000447241.6 ENST00000534588.1 |
TSBP1
|
testis expressed basic protein 1 |
| chr11_-_90223036 | 1.78 |
ENST00000320585.11
|
CHORDC1
|
cysteine and histidine rich domain containing 1 |
| chr8_-_27614681 | 1.78 |
ENST00000519472.5
ENST00000523589.5 ENST00000522413.5 ENST00000523396.1 ENST00000316403.15 |
CLU
|
clusterin |
| chrX_+_54920796 | 1.77 |
ENST00000442098.5
ENST00000430420.5 ENST00000453081.5 ENST00000319167.12 ENST00000622017.4 ENST00000375022.8 ENST00000399736.5 ENST00000440072.5 ENST00000173898.12 ENST00000431115.5 ENST00000440759.5 ENST00000375041.6 |
TRO
|
trophinin |
| chr1_-_60073733 | 1.77 |
ENST00000450089.6
|
C1orf87
|
chromosome 1 open reading frame 87 |
| chr2_+_209579598 | 1.74 |
ENST00000445941.5
ENST00000673860.1 |
MAP2
|
microtubule associated protein 2 |
| chr8_+_142700095 | 1.73 |
ENST00000292430.10
ENST00000518841.5 ENST00000519387.1 |
LY6K
|
lymphocyte antigen 6 family member K |
| chrX_-_155334580 | 1.70 |
ENST00000369449.7
ENST00000321926.4 |
CLIC2
|
chloride intracellular channel 2 |
| chr11_-_90223059 | 1.69 |
ENST00000457199.6
ENST00000530765.5 |
CHORDC1
|
cysteine and histidine rich domain containing 1 |
| chr3_+_96814552 | 1.69 |
ENST00000470610.6
ENST00000389672.9 |
EPHA6
|
EPH receptor A6 |
| chrX_-_140784366 | 1.67 |
ENST00000674533.1
|
CDR1
|
cerebellar degeneration related protein 1 |
| chr11_-_123062335 | 1.64 |
ENST00000453788.6
ENST00000527387.5 |
HSPA8
|
heat shock protein family A (Hsp70) member 8 |
| chr17_+_47323941 | 1.62 |
ENST00000331493.7
ENST00000519772.5 ENST00000517484.5 |
EFCAB13
|
EF-hand calcium binding domain 13 |
| chr12_+_48727431 | 1.61 |
ENST00000548380.6
|
TEX49
|
testis expressed 49 |
| chr6_-_32371897 | 1.60 |
ENST00000442822.6
ENST00000375015.8 ENST00000533191.5 |
TSBP1
|
testis expressed basic protein 1 |
| chr17_-_78577383 | 1.59 |
ENST00000389840.7
|
DNAH17
|
dynein axonemal heavy chain 17 |
| chr20_+_56533246 | 1.55 |
ENST00000371325.1
|
FAM209B
|
family with sequence similarity 209 member B |
| chr2_-_197499857 | 1.55 |
ENST00000428204.6
ENST00000678170.1 ENST00000676933.1 ENST00000678621.1 |
HSPD1
|
heat shock protein family D (Hsp60) member 1 |
| chr4_-_151226427 | 1.54 |
ENST00000304527.8
ENST00000409598.8 |
SH3D19
|
SH3 domain containing 19 |
| chr20_+_37521206 | 1.53 |
ENST00000346199.3
ENST00000647955.1 ENST00000649451.1 ENST00000649697.1 ENST00000649309.1 |
NNAT
|
neuronatin |
| chr12_+_120071703 | 1.52 |
ENST00000548673.5
|
BICDL1
|
BICD family like cargo adaptor 1 |
| chr7_-_1160144 | 1.51 |
ENST00000397083.6
ENST00000401903.5 ENST00000316495.8 |
ZFAND2A
|
zinc finger AN1-type containing 2A |
| chrX_-_101293057 | 1.51 |
ENST00000372907.7
|
TAF7L
|
TATA-box binding protein associated factor 7 like |
| chr1_-_60073750 | 1.48 |
ENST00000371201.3
|
C1orf87
|
chromosome 1 open reading frame 87 |
| chr2_+_227813834 | 1.48 |
ENST00000358813.5
ENST00000409189.7 |
CCL20
|
C-C motif chemokine ligand 20 |
| chr9_+_121207774 | 1.46 |
ENST00000373823.7
|
GSN
|
gelsolin |
| chr2_+_209579399 | 1.46 |
ENST00000360351.8
|
MAP2
|
microtubule associated protein 2 |
| chrX_-_81121619 | 1.45 |
ENST00000373250.7
|
HMGN5
|
high mobility group nucleosome binding domain 5 |
| chr4_-_76421121 | 1.45 |
ENST00000682701.1
|
CCDC158
|
coiled-coil domain containing 158 |
| chr11_-_66744648 | 1.44 |
ENST00000611817.5
|
SPTBN2
|
spectrin beta, non-erythrocytic 2 |
| chr8_-_119592954 | 1.44 |
ENST00000522167.5
|
ENPP2
|
ectonucleotide pyrophosphatase/phosphodiesterase 2 |
| chr3_-_36739791 | 1.42 |
ENST00000416516.2
|
DCLK3
|
doublecortin like kinase 3 |
| chr17_-_76726590 | 1.42 |
ENST00000397625.9
ENST00000445478.6 |
JMJD6
|
jumonji domain containing 6, arginine demethylase and lysine hydroxylase |
| chr11_-_32794610 | 1.41 |
ENST00000531481.1
ENST00000335185.10 |
CCDC73
|
coiled-coil domain containing 73 |
| chr1_-_6393750 | 1.39 |
ENST00000545482.5
ENST00000361521.9 |
ACOT7
|
acyl-CoA thioesterase 7 |
| chr19_-_55160668 | 1.39 |
ENST00000588076.1
|
DNAAF3
|
dynein axonemal assembly factor 3 |
| chr6_+_44246166 | 1.37 |
ENST00000620073.4
|
HSP90AB1
|
heat shock protein 90 alpha family class B member 1 |
| chr16_-_18375069 | 1.36 |
ENST00000545114.5
|
NPIPA9
|
nuclear pore complex interacting protein family, member A9 |
| chr17_-_76726753 | 1.32 |
ENST00000617192.4
|
JMJD6
|
jumonji domain containing 6, arginine demethylase and lysine hydroxylase |
| chr11_+_66744618 | 1.31 |
ENST00000524551.5
ENST00000525908.6 ENST00000540737.7 ENST00000527634.5 |
C11orf80
|
chromosome 11 open reading frame 80 |
| chr1_+_212608628 | 1.31 |
ENST00000613954.4
ENST00000341491.9 ENST00000366985.5 |
ATF3
|
activating transcription factor 3 |
| chr6_+_35737028 | 1.30 |
ENST00000373869.7
ENST00000373866.4 |
ARMC12
|
armadillo repeat containing 12 |
| chr20_+_18813777 | 1.30 |
ENST00000377428.4
|
SCP2D1
|
SCP2 sterol binding domain containing 1 |
| chr9_+_33025265 | 1.30 |
ENST00000330899.5
|
DNAJA1
|
DnaJ heat shock protein family (Hsp40) member A1 |
| chr12_+_13196777 | 1.27 |
ENST00000538364.5
ENST00000396301.7 |
EMP1
|
epithelial membrane protein 1 |
| chrX_-_103688033 | 1.27 |
ENST00000434230.5
ENST00000418819.5 ENST00000360458.5 |
MORF4L2
|
mortality factor 4 like 2 |
| chr17_-_76726453 | 1.27 |
ENST00000585429.1
|
JMJD6
|
jumonji domain containing 6, arginine demethylase and lysine hydroxylase |
| chr1_-_25905989 | 1.24 |
ENST00000399728.5
|
STMN1
|
stathmin 1 |
| chr3_+_186783567 | 1.22 |
ENST00000323963.10
ENST00000440191.6 |
EIF4A2
|
eukaryotic translation initiation factor 4A2 |
| chr19_+_49388276 | 1.20 |
ENST00000598730.5
ENST00000594905.5 ENST00000595828.5 ENST00000594043.5 |
KASH5
|
KASH domain containing 5 |
| chrX_-_103688090 | 1.19 |
ENST00000433176.6
|
MORF4L2
|
mortality factor 4 like 2 |
| chr3_+_186784185 | 1.18 |
ENST00000498746.1
|
EIF4A2
|
eukaryotic translation initiation factor 4A2 |
| chr2_+_200306048 | 1.16 |
ENST00000409988.7
ENST00000409385.5 |
SPATS2L
|
spermatogenesis associated serine rich 2 like |
| chr16_+_29778252 | 1.16 |
ENST00000400752.6
|
ZG16
|
zymogen granule protein 16 |
| chr2_-_197499826 | 1.13 |
ENST00000439605.2
ENST00000388968.8 ENST00000418022.2 |
HSPD1
|
heat shock protein family D (Hsp60) member 1 |
| chr10_-_73096850 | 1.12 |
ENST00000307116.6
ENST00000373008.6 ENST00000394890.7 |
P4HA1
|
prolyl 4-hydroxylase subunit alpha 1 |
| chr13_-_28322504 | 1.11 |
ENST00000543394.2
|
FLT1
|
fms related receptor tyrosine kinase 1 |
| chr1_-_6393339 | 1.10 |
ENST00000608083.5
|
ACOT7
|
acyl-CoA thioesterase 7 |
| chr6_-_32371912 | 1.09 |
ENST00000612031.4
|
TSBP1
|
testis expressed basic protein 1 |
| chr4_+_76011222 | 1.09 |
ENST00000513122.5
|
ART3
|
ADP-ribosyltransferase 3 (inactive) |
| chr6_+_35737078 | 1.09 |
ENST00000288065.6
|
ARMC12
|
armadillo repeat containing 12 |
| chr7_-_56051544 | 1.08 |
ENST00000395471.7
|
PSPH
|
phosphoserine phosphatase |
| chr2_-_9003657 | 1.07 |
ENST00000462696.1
ENST00000305997.8 |
MBOAT2
|
membrane bound O-acyltransferase domain containing 2 |
| chr17_+_47323770 | 1.07 |
ENST00000517310.5
|
EFCAB13
|
EF-hand calcium binding domain 13 |
| chr9_+_129141637 | 1.06 |
ENST00000419582.5
|
PTPA
|
protein phosphatase 2 phosphatase activator |
| chr7_+_157336988 | 1.04 |
ENST00000262177.9
ENST00000417758.5 ENST00000443280.5 |
DNAJB6
|
DnaJ heat shock protein family (Hsp40) member B6 |
| chr11_+_66744831 | 1.00 |
ENST00000642265.1
ENST00000532565.6 |
C11orf80
|
chromosome 11 open reading frame 80 |
| chr9_-_86100123 | 1.00 |
ENST00000388711.7
ENST00000466178.1 |
GOLM1
|
golgi membrane protein 1 |
| chr11_+_75562134 | 0.98 |
ENST00000526242.1
|
SERPINH1
|
serpin family H member 1 |
| chr8_+_142700465 | 0.98 |
ENST00000522591.1
|
LY6K
|
lymphocyte antigen 6 family member K |
| chr4_+_22692906 | 0.97 |
ENST00000613293.4
ENST00000610628.4 |
GBA3
|
glucosylceramidase beta 3 (gene/pseudogene) |
| chr2_+_200306545 | 0.96 |
ENST00000423749.5
ENST00000428692.5 ENST00000457757.5 ENST00000453663.5 |
SPATS2L
|
spermatogenesis associated serine rich 2 like |
| chr14_+_104745960 | 0.95 |
ENST00000556623.1
ENST00000555674.1 |
ADSS1
|
adenylosuccinate synthase 1 |
| chr8_+_141514638 | 0.94 |
ENST00000427937.1
ENST00000643770.1 |
ENSG00000226490.2
|
novel protein |
| chr2_-_237590660 | 0.94 |
ENST00000409576.1
|
RAB17
|
RAB17, member RAS oncogene family |
| chr2_+_200306519 | 0.94 |
ENST00000360760.9
|
SPATS2L
|
spermatogenesis associated serine rich 2 like |
| chr3_+_136957948 | 0.93 |
ENST00000329582.9
|
IL20RB
|
interleukin 20 receptor subunit beta |
| chrX_-_43882411 | 0.93 |
ENST00000378069.5
|
MAOB
|
monoamine oxidase B |
| chr2_+_200306340 | 0.90 |
ENST00000451764.6
|
SPATS2L
|
spermatogenesis associated serine rich 2 like |
| chr17_-_64230727 | 0.89 |
ENST00000583097.5
ENST00000615733.4 |
TEX2
|
testis expressed 2 |
| chr15_-_43800132 | 0.89 |
ENST00000299969.10
ENST00000319327.7 |
SERINC4
|
serine incorporator 4 |
| chr16_-_1444489 | 0.89 |
ENST00000389176.3
ENST00000409671.5 |
CCDC154
|
coiled-coil domain containing 154 |
| chr3_+_101724633 | 0.86 |
ENST00000494050.5
|
CEP97
|
centrosomal protein 97 |
| chr11_-_123062022 | 0.85 |
ENST00000532182.5
ENST00000524590.5 ENST00000528292.5 ENST00000533540.5 ENST00000534624.6 ENST00000525463.5 |
HSPA8
|
heat shock protein family A (Hsp70) member 8 |
| chr19_+_49851173 | 0.84 |
ENST00000599732.5
|
PTOV1
|
PTOV1 extended AT-hook containing adaptor protein |
| chr18_+_46917561 | 0.84 |
ENST00000683218.1
|
KATNAL2
|
katanin catalytic subunit A1 like 2 |
| chr19_+_49851136 | 0.84 |
ENST00000391842.5
|
PTOV1
|
PTOV1 extended AT-hook containing adaptor protein |
| chr10_-_60572599 | 0.82 |
ENST00000503366.5
|
ANK3
|
ankyrin 3 |
| chr7_-_56051288 | 0.82 |
ENST00000419984.6
ENST00000413218.5 ENST00000275605.8 ENST00000424596.1 ENST00000421312.5 ENST00000416592.1 |
PSPH
|
phosphoserine phosphatase |
| chrX_-_107000185 | 0.82 |
ENST00000355610.9
|
MORC4
|
MORC family CW-type zinc finger 4 |
| chr2_+_209579429 | 0.82 |
ENST00000361559.8
|
MAP2
|
microtubule associated protein 2 |
| chr19_+_49851205 | 0.79 |
ENST00000601675.5
|
PTOV1
|
PTOV1 extended AT-hook containing adaptor protein |
| chr17_-_46818680 | 0.78 |
ENST00000225512.6
|
WNT3
|
Wnt family member 3 |
| chr3_+_130894382 | 0.78 |
ENST00000509662.5
ENST00000328560.12 ENST00000428331.6 ENST00000359644.7 ENST00000422190.6 |
ATP2C1
|
ATPase secretory pathway Ca2+ transporting 1 |
| chr5_-_134371004 | 0.78 |
ENST00000521755.1
ENST00000523054.5 ENST00000518409.1 |
CDKL3
ENSG00000273345.5
|
cyclin dependent kinase like 3 novel transcript |
| chr17_+_35760908 | 0.77 |
ENST00000603305.1
|
C17orf50
|
chromosome 17 open reading frame 50 |
| chr2_+_200306854 | 0.77 |
ENST00000409397.6
|
SPATS2L
|
spermatogenesis associated serine rich 2 like |
| chr20_-_63463843 | 0.77 |
ENST00000637193.1
|
KCNQ2
|
potassium voltage-gated channel subfamily Q member 2 |
| chrX_-_153673778 | 0.76 |
ENST00000340888.8
|
PNCK
|
pregnancy up-regulated nonubiquitous CaM kinase |
| chr19_+_1354931 | 0.75 |
ENST00000591337.7
|
PWWP3A
|
PWWP domain containing 3A, DNA repair factor |
| chr12_+_103930332 | 0.75 |
ENST00000681861.1
ENST00000550595.2 ENST00000680762.1 ENST00000614327.2 ENST00000681949.1 ENST00000299767.10 |
HSP90B1
|
heat shock protein 90 beta family member 1 |
| chr7_-_151410677 | 0.73 |
ENST00000621812.2
ENST00000477459.5 |
WDR86
|
WD repeat domain 86 |
| chr5_+_141223332 | 0.72 |
ENST00000239449.7
ENST00000624896.1 ENST00000624396.1 |
PCDHB14
ENSG00000279983.1
|
protocadherin beta 14 novel protein |
| chr3_+_96814791 | 0.71 |
ENST00000506569.1
|
EPHA6
|
EPH receptor A6 |
| chr16_-_8861744 | 0.71 |
ENST00000569398.5
ENST00000568968.1 |
CARHSP1
|
calcium regulated heat stable protein 1 |
| chr16_-_8861713 | 0.70 |
ENST00000567554.5
|
CARHSP1
|
calcium regulated heat stable protein 1 |
| chr3_+_159069252 | 0.69 |
ENST00000640015.1
ENST00000476809.7 ENST00000485419.7 |
IQCJ-SCHIP1
|
IQCJ-SCHIP1 readthrough |
| chr21_+_43728851 | 0.68 |
ENST00000327574.4
|
PDXK
|
pyridoxal kinase |
| chr19_-_42253888 | 0.67 |
ENST00000593944.5
|
ERF
|
ETS2 repressor factor |
| chr11_-_83285965 | 0.65 |
ENST00000529073.5
ENST00000529611.5 |
CCDC90B
|
coiled-coil domain containing 90B |
| chr18_-_46917432 | 0.63 |
ENST00000324794.11
ENST00000545673.5 ENST00000585916.6 |
PIAS2
|
protein inhibitor of activated STAT 2 |
| chrX_-_107000062 | 0.63 |
ENST00000255495.7
|
MORC4
|
MORC family CW-type zinc finger 4 |
| chr3_+_39467598 | 0.61 |
ENST00000428261.5
ENST00000420739.5 ENST00000415443.5 ENST00000447324.5 ENST00000383754.7 |
MOBP
|
myelin associated oligodendrocyte basic protein |
| chr9_-_86099506 | 0.61 |
ENST00000388712.7
|
GOLM1
|
golgi membrane protein 1 |
| chr12_+_40742342 | 0.61 |
ENST00000548005.5
ENST00000552248.5 |
CNTN1
|
contactin 1 |
| chr6_+_127577168 | 0.61 |
ENST00000329722.8
|
C6orf58
|
chromosome 6 open reading frame 58 |
| chr3_+_130893959 | 0.60 |
ENST00000508532.5
ENST00000533801.6 |
ATP2C1
|
ATPase secretory pathway Ca2+ transporting 1 |
| chr11_-_83286328 | 0.58 |
ENST00000525503.5
|
CCDC90B
|
coiled-coil domain containing 90B |
| chr14_+_96256194 | 0.57 |
ENST00000216629.11
ENST00000553356.1 |
BDKRB1
|
bradykinin receptor B1 |
| chr8_+_142834801 | 0.57 |
ENST00000220940.2
|
GML
|
glycosylphosphatidylinositol anchored molecule like |
| chr12_-_122526929 | 0.57 |
ENST00000331738.12
ENST00000528279.1 ENST00000344591.8 ENST00000526560.6 |
RSRC2
|
arginine and serine rich coiled-coil 2 |
| chr15_+_43800586 | 0.56 |
ENST00000442995.4
ENST00000458412.2 |
HYPK
|
huntingtin interacting protein K |
| chr3_+_130894050 | 0.55 |
ENST00000510168.6
|
ATP2C1
|
ATPase secretory pathway Ca2+ transporting 1 |
| chr1_-_241999091 | 0.54 |
ENST00000357246.4
|
MAP1LC3C
|
microtubule associated protein 1 light chain 3 gamma |
| chr12_+_69585434 | 0.53 |
ENST00000299300.11
ENST00000544368.6 |
CCT2
|
chaperonin containing TCP1 subunit 2 |
| chr9_+_72149424 | 0.51 |
ENST00000358399.8
ENST00000376986.5 |
GDA
|
guanine deaminase |
| chr12_+_110502200 | 0.51 |
ENST00000409246.5
ENST00000392672.8 ENST00000409425.5 |
RAD9B
|
RAD9 checkpoint clamp component B |
| chr11_-_83286377 | 0.50 |
ENST00000455220.6
ENST00000529689.5 |
CCDC90B
|
coiled-coil domain containing 90B |
| chr2_-_61888570 | 0.50 |
ENST00000394440.8
ENST00000544079.2 |
CCT4
|
chaperonin containing TCP1 subunit 4 |
| chr3_+_130894157 | 0.50 |
ENST00000504948.5
ENST00000513801.5 ENST00000505072.5 |
ATP2C1
|
ATPase secretory pathway Ca2+ transporting 1 |
| chr14_-_80959484 | 0.49 |
ENST00000555529.5
ENST00000556042.5 ENST00000556981.5 |
CEP128
|
centrosomal protein 128 |
| chr13_+_30617902 | 0.49 |
ENST00000255304.9
ENST00000614860.1 |
USPL1
|
ubiquitin specific peptidase like 1 |
| chr20_+_4686320 | 0.48 |
ENST00000430350.2
|
PRNP
|
prion protein |
| chr4_+_41359599 | 0.47 |
ENST00000513024.5
|
LIMCH1
|
LIM and calponin homology domains 1 |
| chr1_+_154974653 | 0.47 |
ENST00000368439.5
|
CKS1B
|
CDC28 protein kinase regulatory subunit 1B |
| chr1_-_27383326 | 0.47 |
ENST00000374030.3
|
CD164L2
|
CD164 molecule like 2 |
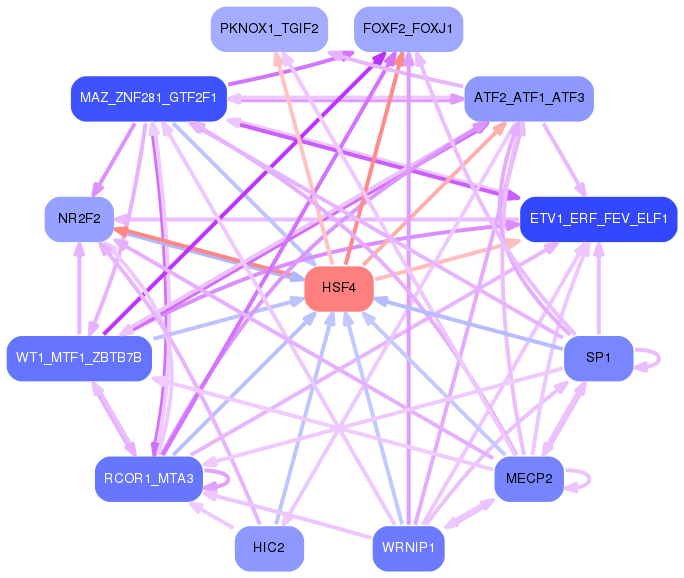
Network of associatons between targets according to the STRING database.

First level regulatory network of HSF4
Gene Ontology Analysis
Gene overrepresentation in biological process category:
| Log-likelihood per target | Total log-likelihood | Term | Description |
|---|---|---|---|
| 2.6 | 17.9 | GO:1903751 | regulation of intrinsic apoptotic signaling pathway in response to hydrogen peroxide(GO:1903750) negative regulation of intrinsic apoptotic signaling pathway in response to hydrogen peroxide(GO:1903751) |
| 1.3 | 4.0 | GO:0070079 | peptidyl-lysine hydroxylation to 5-hydroxy-L-lysine(GO:0018395) histone arginine demethylation(GO:0070077) histone H3-R2 demethylation(GO:0070078) histone H4-R3 demethylation(GO:0070079) |
| 1.2 | 3.5 | GO:1901388 | regulation of transforming growth factor beta activation(GO:1901388) negative regulation of transforming growth factor beta activation(GO:1901389) |
| 1.0 | 3.0 | GO:0002892 | type IIa hypersensitivity(GO:0001794) regulation of type IIa hypersensitivity(GO:0001796) positive regulation of activation of membrane attack complex(GO:0001970) type II hypersensitivity(GO:0002445) regulation of type II hypersensitivity(GO:0002892) |
| 0.9 | 2.7 | GO:0002368 | B cell cytokine production(GO:0002368) protein import into mitochondrial intermembrane space(GO:0045041) |
| 0.9 | 7.9 | GO:0042904 | 9-cis-retinoic acid biosynthetic process(GO:0042904) 9-cis-retinoic acid metabolic process(GO:0042905) |
| 0.9 | 3.5 | GO:2000298 | regulation of Rho-dependent protein serine/threonine kinase activity(GO:2000298) |
| 0.9 | 2.6 | GO:0031247 | actin rod assembly(GO:0031247) |
| 0.8 | 3.3 | GO:0043335 | protein unfolding(GO:0043335) |
| 0.8 | 3.1 | GO:0009956 | radial pattern formation(GO:0009956) |
| 0.8 | 8.3 | GO:0003433 | chondrocyte development involved in endochondral bone morphogenesis(GO:0003433) |
| 0.7 | 17.2 | GO:0007021 | tubulin complex assembly(GO:0007021) |
| 0.7 | 4.1 | GO:0099640 | axo-dendritic protein transport(GO:0099640) |
| 0.6 | 2.5 | GO:0036116 | medium-chain fatty-acyl-CoA catabolic process(GO:0036114) long-chain fatty-acyl-CoA catabolic process(GO:0036116) palmitic acid metabolic process(GO:1900533) palmitic acid biosynthetic process(GO:1900535) |
| 0.6 | 4.8 | GO:0007412 | axon target recognition(GO:0007412) |
| 0.6 | 3.9 | GO:0070370 | heat acclimation(GO:0010286) cellular heat acclimation(GO:0070370) |
| 0.5 | 2.5 | GO:1902904 | negative regulation of fibril organization(GO:1902904) chaperone-mediated autophagy translocation complex disassembly(GO:1904764) |
| 0.5 | 11.2 | GO:0090084 | negative regulation of inclusion body assembly(GO:0090084) |
| 0.5 | 1.9 | GO:0000706 | meiotic DNA double-strand break processing(GO:0000706) double-strand break repair involved in meiotic recombination(GO:1990918) |
| 0.4 | 1.5 | GO:0045360 | regulation of interleukin-1 biosynthetic process(GO:0045360) positive regulation of interleukin-1 biosynthetic process(GO:0045362) |
| 0.4 | 3.0 | GO:0045409 | negative regulation of interleukin-6 biosynthetic process(GO:0045409) glomerular parietal epithelial cell differentiation(GO:0072139) |
| 0.4 | 1.1 | GO:0036323 | vascular endothelial growth factor receptor-1 signaling pathway(GO:0036323) |
| 0.3 | 2.4 | GO:0032468 | Golgi calcium ion homeostasis(GO:0032468) |
| 0.3 | 1.3 | GO:1903984 | regulation of transcription from RNA polymerase II promoter in response to arsenic-containing substance(GO:0061394) regulation of TRAIL-activated apoptotic signaling pathway(GO:1903121) positive regulation of TRAIL-activated apoptotic signaling pathway(GO:1903984) |
| 0.3 | 1.0 | GO:1903015 | regulation of exo-alpha-sialidase activity(GO:1903015) |
| 0.3 | 0.9 | GO:0002415 | immunoglobulin transcytosis in epithelial cells mediated by polymeric immunoglobulin receptor(GO:0002415) |
| 0.3 | 0.9 | GO:0002884 | negative regulation of type IV hypersensitivity(GO:0001808) negative regulation of hypersensitivity(GO:0002884) |
| 0.3 | 4.6 | GO:0061299 | retina vasculature morphogenesis in camera-type eye(GO:0061299) |
| 0.3 | 1.5 | GO:0044855 | plasma membrane raft distribution(GO:0044855) plasma membrane raft localization(GO:0044856) plasma membrane raft polarization(GO:0044858) regulation of plasma membrane raft polarization(GO:1903906) |
| 0.2 | 1.8 | GO:1902996 | regulation of neuronal signal transduction(GO:1902847) regulation of neurofibrillary tangle assembly(GO:1902996) positive regulation of neurofibrillary tangle assembly(GO:1902998) |
| 0.2 | 1.0 | GO:0090666 | scaRNA localization to Cajal body(GO:0090666) |
| 0.2 | 0.6 | GO:0006147 | guanine catabolic process(GO:0006147) |
| 0.2 | 0.8 | GO:0060061 | Spemann organizer formation(GO:0060061) |
| 0.2 | 2.0 | GO:0010756 | positive regulation of plasminogen activation(GO:0010756) |
| 0.2 | 0.5 | GO:0006463 | steroid hormone receptor complex assembly(GO:0006463) |
| 0.2 | 0.7 | GO:0009443 | pyridoxal 5'-phosphate salvage(GO:0009443) |
| 0.1 | 2.3 | GO:0016998 | cell wall macromolecule catabolic process(GO:0016998) |
| 0.1 | 0.9 | GO:0014063 | negative regulation of serotonin secretion(GO:0014063) |
| 0.1 | 1.5 | GO:0009249 | protein lipoylation(GO:0009249) |
| 0.1 | 0.5 | GO:0030576 | Cajal body organization(GO:0030576) |
| 0.1 | 0.5 | GO:1990535 | neuron projection maintenance(GO:1990535) |
| 0.1 | 2.4 | GO:0006957 | complement activation, alternative pathway(GO:0006957) |
| 0.1 | 1.9 | GO:0006564 | L-serine biosynthetic process(GO:0006564) |
| 0.1 | 1.3 | GO:1903748 | negative regulation of establishment of protein localization to mitochondrion(GO:1903748) |
| 0.1 | 1.8 | GO:0051085 | chaperone mediated protein folding requiring cofactor(GO:0051085) |
| 0.1 | 1.1 | GO:0030472 | mitotic spindle organization in nucleus(GO:0030472) |
| 0.1 | 0.8 | GO:0072658 | maintenance of protein location in membrane(GO:0072658) maintenance of protein location in plasma membrane(GO:0072660) positive regulation of membrane depolarization during cardiac muscle cell action potential(GO:1900827) |
| 0.1 | 3.4 | GO:0071157 | negative regulation of cell cycle arrest(GO:0071157) |
| 0.1 | 1.1 | GO:0018401 | peptidyl-proline hydroxylation to 4-hydroxy-L-proline(GO:0018401) |
| 0.1 | 1.4 | GO:0034638 | phosphatidylcholine catabolic process(GO:0034638) |
| 0.1 | 1.7 | GO:0060315 | negative regulation of ryanodine-sensitive calcium-release channel activity(GO:0060315) |
| 0.1 | 1.2 | GO:0070495 | regulation of thrombin receptor signaling pathway(GO:0070494) negative regulation of thrombin receptor signaling pathway(GO:0070495) |
| 0.1 | 1.9 | GO:1904706 | negative regulation of vascular smooth muscle cell proliferation(GO:1904706) |
| 0.1 | 2.1 | GO:0016973 | poly(A)+ mRNA export from nucleus(GO:0016973) |
| 0.1 | 0.8 | GO:1904851 | positive regulation of establishment of protein localization to telomere(GO:1904851) |
| 0.1 | 3.0 | GO:0030214 | hyaluronan catabolic process(GO:0030214) |
| 0.1 | 4.1 | GO:0035338 | long-chain fatty-acyl-CoA biosynthetic process(GO:0035338) |
| 0.1 | 2.5 | GO:0043968 | histone H2A acetylation(GO:0043968) |
| 0.1 | 3.9 | GO:0006471 | protein ADP-ribosylation(GO:0006471) |
| 0.1 | 1.1 | GO:0030050 | vesicle transport along actin filament(GO:0030050) |
| 0.1 | 0.9 | GO:0015825 | L-serine transport(GO:0015825) |
| 0.1 | 0.2 | GO:0031550 | positive regulation of brain-derived neurotrophic factor receptor signaling pathway(GO:0031550) |
| 0.1 | 1.5 | GO:0071243 | cellular response to arsenic-containing substance(GO:0071243) |
| 0.1 | 1.3 | GO:1902018 | negative regulation of cilium assembly(GO:1902018) |
| 0.1 | 2.2 | GO:0055003 | cardiac myofibril assembly(GO:0055003) |
| 0.1 | 1.4 | GO:0021692 | cerebellar Purkinje cell layer morphogenesis(GO:0021692) |
| 0.0 | 0.4 | GO:0016191 | synaptic vesicle uncoating(GO:0016191) |
| 0.0 | 0.3 | GO:0021780 | oligodendrocyte cell fate specification(GO:0021778) oligodendrocyte cell fate commitment(GO:0021779) glial cell fate specification(GO:0021780) |
| 0.0 | 1.4 | GO:0070286 | axonemal dynein complex assembly(GO:0070286) |
| 0.0 | 0.3 | GO:0070127 | tRNA aminoacylation for mitochondrial protein translation(GO:0070127) |
| 0.0 | 1.6 | GO:0060285 | cilium-dependent cell motility(GO:0060285) |
| 0.0 | 0.2 | GO:2000255 | negative regulation of male germ cell proliferation(GO:2000255) |
| 0.0 | 1.3 | GO:0032060 | bleb assembly(GO:0032060) |
| 0.0 | 1.7 | GO:0007339 | binding of sperm to zona pellucida(GO:0007339) |
| 0.0 | 3.9 | GO:0001578 | microtubule bundle formation(GO:0001578) |
| 0.0 | 0.4 | GO:0071847 | TNFSF11-mediated signaling pathway(GO:0071847) |
| 0.0 | 1.1 | GO:0036152 | phosphatidylethanolamine acyl-chain remodeling(GO:0036152) |
| 0.0 | 0.3 | GO:0044806 | G-quadruplex DNA unwinding(GO:0044806) |
| 0.0 | 0.4 | GO:0071492 | cellular response to UV-A(GO:0071492) |
| 0.0 | 6.2 | GO:1990830 | response to leukemia inhibitory factor(GO:1990823) cellular response to leukemia inhibitory factor(GO:1990830) |
| 0.0 | 0.6 | GO:0043562 | cellular response to nitrogen starvation(GO:0006995) cellular response to nitrogen levels(GO:0043562) |
| 0.0 | 0.2 | GO:0036378 | calcitriol biosynthetic process from calciol(GO:0036378) |
| 0.0 | 0.1 | GO:0032072 | plasmacytoid dendritic cell activation(GO:0002270) regulation of restriction endodeoxyribonuclease activity(GO:0032072) |
| 0.0 | 0.4 | GO:0006983 | ER overload response(GO:0006983) |
| 0.0 | 1.8 | GO:0007566 | embryo implantation(GO:0007566) |
| 0.0 | 0.5 | GO:0000076 | DNA replication checkpoint(GO:0000076) |
| 0.0 | 0.7 | GO:0016339 | calcium-dependent cell-cell adhesion via plasma membrane cell adhesion molecules(GO:0016339) |
| 0.0 | 0.3 | GO:1903599 | positive regulation of mitophagy(GO:1903599) |
| 0.0 | 0.6 | GO:0060766 | negative regulation of androgen receptor signaling pathway(GO:0060766) |
| 0.0 | 0.4 | GO:0010992 | ubiquitin homeostasis(GO:0010992) |
| 0.0 | 0.8 | GO:0030517 | negative regulation of axon extension(GO:0030517) |
| 0.0 | 0.6 | GO:0051281 | positive regulation of release of sequestered calcium ion into cytosol(GO:0051281) |
| 0.0 | 1.8 | GO:0048477 | oogenesis(GO:0048477) |
| 0.0 | 0.6 | GO:0010765 | positive regulation of sodium ion transport(GO:0010765) |
Gene overrepresentation in cellular component category:
| Log-likelihood per target | Total log-likelihood | Term | Description |
|---|---|---|---|
| 1.2 | 3.5 | GO:1990913 | sperm head plasma membrane(GO:1990913) ooplasm(GO:1990917) |
| 1.0 | 17.2 | GO:0097512 | cardiac myofibril(GO:0097512) |
| 0.7 | 23.9 | GO:0071682 | endocytic vesicle lumen(GO:0071682) |
| 0.4 | 1.3 | GO:1990622 | CHOP-ATF3 complex(GO:1990622) |
| 0.4 | 4.3 | GO:0097442 | CA3 pyramidal cell dendrite(GO:0097442) |
| 0.4 | 1.1 | GO:0016222 | procollagen-proline 4-dioxygenase complex(GO:0016222) |
| 0.4 | 3.2 | GO:0005579 | membrane attack complex(GO:0005579) |
| 0.3 | 2.1 | GO:0042272 | nuclear RNA export factor complex(GO:0042272) |
| 0.3 | 2.0 | GO:0001652 | granular component(GO:0001652) |
| 0.3 | 2.5 | GO:0098575 | lumenal side of lysosomal membrane(GO:0098575) |
| 0.3 | 2.7 | GO:0019907 | cyclin-dependent protein kinase activating kinase holoenzyme complex(GO:0019907) |
| 0.2 | 3.9 | GO:0005641 | nuclear envelope lumen(GO:0005641) |
| 0.1 | 1.3 | GO:0098554 | cytoplasmic side of endoplasmic reticulum membrane(GO:0098554) |
| 0.1 | 8.9 | GO:1904115 | axon cytoplasm(GO:1904115) |
| 0.1 | 2.4 | GO:0016281 | eukaryotic translation initiation factor 4F complex(GO:0016281) |
| 0.1 | 1.8 | GO:0097418 | spherical high-density lipoprotein particle(GO:0034366) neurofibrillary tangle(GO:0097418) |
| 0.1 | 1.5 | GO:0030478 | actin cap(GO:0030478) |
| 0.1 | 0.3 | GO:0097409 | glial cytoplasmic inclusion(GO:0097409) classical Lewy body(GO:0097414) Lewy neurite(GO:0097462) Lewy body corona(GO:1990038) |
| 0.1 | 0.4 | GO:0034753 | nuclear aryl hydrocarbon receptor complex(GO:0034753) |
| 0.1 | 1.6 | GO:0005858 | axonemal dynein complex(GO:0005858) |
| 0.1 | 1.8 | GO:0000177 | cytoplasmic exosome (RNase complex)(GO:0000177) |
| 0.1 | 3.9 | GO:0008180 | COP9 signalosome(GO:0008180) |
| 0.1 | 1.4 | GO:0008091 | spectrin(GO:0008091) |
| 0.1 | 2.5 | GO:1902562 | NuA4 histone acetyltransferase complex(GO:0035267) H4/H2A histone acetyltransferase complex(GO:0043189) H4 histone acetyltransferase complex(GO:1902562) |
| 0.1 | 1.2 | GO:0042589 | zymogen granule membrane(GO:0042589) |
| 0.1 | 0.5 | GO:0030896 | checkpoint clamp complex(GO:0030896) |
| 0.0 | 1.6 | GO:0043194 | axon initial segment(GO:0043194) |
| 0.0 | 0.8 | GO:0005832 | chaperonin-containing T-complex(GO:0005832) |
| 0.0 | 0.8 | GO:1990909 | Wnt signalosome(GO:1990909) |
| 0.0 | 6.1 | GO:0005793 | endoplasmic reticulum-Golgi intermediate compartment(GO:0005793) |
| 0.0 | 0.5 | GO:0031362 | anchored component of external side of plasma membrane(GO:0031362) |
| 0.0 | 3.0 | GO:0035578 | azurophil granule lumen(GO:0035578) |
| 0.0 | 1.1 | GO:0000159 | protein phosphatase type 2A complex(GO:0000159) |
| 0.0 | 4.4 | GO:0031225 | anchored component of membrane(GO:0031225) |
| 0.0 | 5.6 | GO:0030018 | Z disc(GO:0030018) |
| 0.0 | 2.3 | GO:0036126 | sperm flagellum(GO:0036126) |
| 0.0 | 0.4 | GO:0043220 | Schmidt-Lanterman incisure(GO:0043220) |
| 0.0 | 0.1 | GO:0034274 | Atg12-Atg5-Atg16 complex(GO:0034274) |
| 0.0 | 1.7 | GO:0034707 | chloride channel complex(GO:0034707) |
| 0.0 | 0.5 | GO:0000421 | autophagosome membrane(GO:0000421) |
| 0.0 | 0.5 | GO:0044295 | axonal growth cone(GO:0044295) |
| 0.0 | 0.4 | GO:0044322 | endoplasmic reticulum quality control compartment(GO:0044322) |
Gene overrepresentation in molecular function category:
| Log-likelihood per target | Total log-likelihood | Term | Description |
|---|---|---|---|
| 1.3 | 4.0 | GO:0033746 | histone demethylase activity (H3-R2 specific)(GO:0033746) histone demethylase activity (H4-R3 specific)(GO:0033749) |
| 1.2 | 17.9 | GO:0000774 | adenyl-nucleotide exchange factor activity(GO:0000774) |
| 1.2 | 3.5 | GO:0002135 | CTP binding(GO:0002135) |
| 1.0 | 4.1 | GO:0008426 | protein kinase C inhibitor activity(GO:0008426) |
| 0.8 | 4.8 | GO:0031694 | alpha-2A adrenergic receptor binding(GO:0031694) |
| 0.6 | 1.9 | GO:0003918 | DNA topoisomerase type II (ATP-hydrolyzing) activity(GO:0003918) DNA topoisomerase II activity(GO:0061505) |
| 0.5 | 7.9 | GO:0001758 | retinal dehydrogenase activity(GO:0001758) |
| 0.5 | 16.5 | GO:0005212 | structural constituent of eye lens(GO:0005212) |
| 0.4 | 2.7 | GO:0034186 | apolipoprotein A-I binding(GO:0034186) |
| 0.4 | 3.9 | GO:0003956 | NAD(P)+-protein-arginine ADP-ribosyltransferase activity(GO:0003956) |
| 0.4 | 1.5 | GO:0031731 | CCR6 chemokine receptor binding(GO:0031731) |
| 0.4 | 1.1 | GO:0036332 | VEGF-A-activated receptor activity(GO:0036326) VEGF-B-activated receptor activity(GO:0036327) placental growth factor-activated receptor activity(GO:0036332) |
| 0.3 | 3.8 | GO:0055131 | C3HC4-type RING finger domain binding(GO:0055131) |
| 0.3 | 3.3 | GO:0030911 | TPR domain binding(GO:0030911) |
| 0.3 | 1.9 | GO:0004647 | phosphoserine phosphatase activity(GO:0004647) |
| 0.3 | 1.4 | GO:0047391 | alkylglycerophosphoethanolamine phosphodiesterase activity(GO:0047391) |
| 0.3 | 2.5 | GO:0036042 | long-chain fatty acyl-CoA binding(GO:0036042) |
| 0.2 | 1.2 | GO:0042015 | interleukin-20 binding(GO:0042015) |
| 0.2 | 0.6 | GO:0008892 | guanine deaminase activity(GO:0008892) |
| 0.2 | 1.0 | GO:0004348 | glucosylceramidase activity(GO:0004348) |
| 0.2 | 8.3 | GO:0001671 | ATPase activator activity(GO:0001671) |
| 0.2 | 4.1 | GO:0047617 | very long-chain fatty acid-CoA ligase activity(GO:0031957) acyl-CoA hydrolase activity(GO:0047617) |
| 0.2 | 2.6 | GO:0046790 | virion binding(GO:0046790) |
| 0.2 | 0.7 | GO:0008478 | pyridoxal kinase activity(GO:0008478) |
| 0.1 | 1.1 | GO:0004656 | procollagen-proline 4-dioxygenase activity(GO:0004656) |
| 0.1 | 2.3 | GO:0003796 | lysozyme activity(GO:0003796) |
| 0.1 | 4.3 | GO:0002162 | dystroglycan binding(GO:0002162) |
| 0.1 | 15.9 | GO:0051087 | chaperone binding(GO:0051087) |
| 0.1 | 0.5 | GO:0032767 | copper-dependent protein binding(GO:0032767) |
| 0.1 | 0.6 | GO:0061575 | cyclin-dependent protein serine/threonine kinase activator activity(GO:0061575) |
| 0.1 | 13.4 | GO:0051082 | unfolded protein binding(GO:0051082) |
| 0.1 | 1.5 | GO:0045159 | myosin II binding(GO:0045159) |
| 0.1 | 0.9 | GO:0008131 | primary amine oxidase activity(GO:0008131) |
| 0.1 | 1.1 | GO:0008160 | protein tyrosine phosphatase activator activity(GO:0008160) |
| 0.1 | 2.2 | GO:0031005 | filamin binding(GO:0031005) |
| 0.1 | 0.6 | GO:0061665 | SUMO ligase activity(GO:0061665) |
| 0.1 | 1.5 | GO:0034452 | dynactin binding(GO:0034452) |
| 0.1 | 2.4 | GO:0005003 | ephrin receptor activity(GO:0005003) |
| 0.1 | 3.1 | GO:0001972 | retinoic acid binding(GO:0001972) |
| 0.1 | 4.0 | GO:0051879 | Hsp90 protein binding(GO:0051879) |
| 0.1 | 2.4 | GO:0005388 | calcium-transporting ATPase activity(GO:0005388) |
| 0.1 | 3.0 | GO:0005540 | hyaluronic acid binding(GO:0005540) |
| 0.1 | 1.1 | GO:0019911 | structural constituent of myelin sheath(GO:0019911) |
| 0.1 | 1.6 | GO:0045505 | dynein intermediate chain binding(GO:0045505) |
| 0.1 | 0.9 | GO:0015194 | L-serine transmembrane transporter activity(GO:0015194) serine transmembrane transporter activity(GO:0022889) |
| 0.1 | 3.1 | GO:0031492 | nucleosomal DNA binding(GO:0031492) |
| 0.1 | 0.2 | GO:0005169 | neurotrophin TRKB receptor binding(GO:0005169) |
| 0.0 | 1.7 | GO:0004602 | glutathione peroxidase activity(GO:0004602) |
| 0.0 | 0.5 | GO:0016929 | SUMO-specific protease activity(GO:0016929) |
| 0.0 | 0.6 | GO:0008568 | microtubule-severing ATPase activity(GO:0008568) |
| 0.0 | 0.2 | GO:0070643 | vitamin D3 25-hydroxylase activity(GO:0030343) vitamin D 25-hydroxylase activity(GO:0070643) |
| 0.0 | 0.2 | GO:0004667 | prostaglandin-D synthase activity(GO:0004667) |
| 0.0 | 1.3 | GO:0015248 | sterol transporter activity(GO:0015248) |
| 0.0 | 0.4 | GO:0047144 | 2-acylglycerol-3-phosphate O-acyltransferase activity(GO:0047144) |
| 0.0 | 0.8 | GO:0048018 | receptor agonist activity(GO:0048018) |
| 0.0 | 0.3 | GO:1990247 | N6-methyladenosine-containing RNA binding(GO:1990247) |
| 0.0 | 1.5 | GO:0035035 | histone acetyltransferase binding(GO:0035035) |
| 0.0 | 2.2 | GO:0031072 | heat shock protein binding(GO:0031072) |
| 0.0 | 2.4 | GO:0004004 | ATP-dependent RNA helicase activity(GO:0004004) |
| 0.0 | 0.8 | GO:0030506 | ankyrin binding(GO:0030506) |
| 0.0 | 0.1 | GO:0030550 | acetylcholine receptor inhibitor activity(GO:0030550) |
| 0.0 | 0.1 | GO:0008379 | thioredoxin peroxidase activity(GO:0008379) |
| 0.0 | 0.1 | GO:0019776 | Atg8 ligase activity(GO:0019776) |
| 0.0 | 1.8 | GO:0003730 | mRNA 3'-UTR binding(GO:0003730) |
| 0.0 | 0.8 | GO:0030507 | spectrin binding(GO:0030507) |
| 0.0 | 0.1 | GO:0031849 | olfactory receptor binding(GO:0031849) |
| 0.0 | 0.1 | GO:0010858 | calcium-dependent protein kinase regulator activity(GO:0010858) |
| 0.0 | 0.4 | GO:0005112 | Notch binding(GO:0005112) |
| 0.0 | 0.8 | GO:0004683 | calmodulin-dependent protein kinase activity(GO:0004683) |
| 0.0 | 0.3 | GO:0004812 | aminoacyl-tRNA ligase activity(GO:0004812) ligase activity, forming carbon-oxygen bonds(GO:0016875) ligase activity, forming aminoacyl-tRNA and related compounds(GO:0016876) |
Gene overrepresentation in curated gene sets: canonical pathways category:
| Log-likelihood per target | Total log-likelihood | Term | Description |
|---|---|---|---|
| 0.1 | 3.0 | PID ERB GENOMIC PATHWAY | Validated nuclear estrogen receptor beta network |
| 0.1 | 3.3 | PID HIF1A PATHWAY | Hypoxic and oxygen homeostasis regulation of HIF-1-alpha |
| 0.1 | 4.1 | PID P38 MK2 PATHWAY | p38 signaling mediated by MAPKAP kinases |
| 0.1 | 5.7 | PID ALPHA SYNUCLEIN PATHWAY | Alpha-synuclein signaling |
| 0.1 | 2.4 | PID EPHA FWDPATHWAY | EPHA forward signaling |
| 0.1 | 2.8 | PID TOLL ENDOGENOUS PATHWAY | Endogenous TLR signaling |
| 0.1 | 1.1 | PID VEGF VEGFR PATHWAY | VEGF and VEGFR signaling network |
| 0.1 | 1.2 | PID P38 GAMMA DELTA PATHWAY | Signaling mediated by p38-gamma and p38-delta |
| 0.0 | 4.3 | PID LKB1 PATHWAY | LKB1 signaling events |
| 0.0 | 1.5 | PID ERBB1 RECEPTOR PROXIMAL PATHWAY | EGF receptor (ErbB1) signaling pathway |
| 0.0 | 3.5 | PID VEGFR1 2 PATHWAY | Signaling events mediated by VEGFR1 and VEGFR2 |
| 0.0 | 3.1 | PID HNF3A PATHWAY | FOXA1 transcription factor network |
| 0.0 | 0.6 | PID FOXM1 PATHWAY | FOXM1 transcription factor network |
| 0.0 | 2.6 | PID IL6 7 PATHWAY | IL6-mediated signaling events |
| 0.0 | 0.6 | PID RANBP2 PATHWAY | Sumoylation by RanBP2 regulates transcriptional repression |
| 0.0 | 3.8 | PID SMAD2 3NUCLEAR PATHWAY | Regulation of nuclear SMAD2/3 signaling |
| 0.0 | 0.8 | PID WNT SIGNALING PATHWAY | Wnt signaling network |
| 0.0 | 1.3 | PID AR TF PATHWAY | Regulation of Androgen receptor activity |
| 0.0 | 6.2 | NABA ECM REGULATORS | Genes encoding enzymes and their regulators involved in the remodeling of the extracellular matrix |
Gene overrepresentation in curated gene sets: REACTOME pathways category:
| Log-likelihood per target | Total log-likelihood | Term | Description |
|---|---|---|---|
| 0.2 | 3.5 | REACTOME THE NLRP3 INFLAMMASOME | Genes involved in The NLRP3 inflammasome |
| 0.2 | 2.6 | REACTOME TRAFFICKING AND PROCESSING OF ENDOSOMAL TLR | Genes involved in Trafficking and processing of endosomal TLR |
| 0.1 | 3.3 | REACTOME TETRAHYDROBIOPTERIN BH4 SYNTHESIS RECYCLING SALVAGE AND REGULATION | Genes involved in Tetrahydrobiopterin (BH4) synthesis, recycling, salvage and regulation |
| 0.1 | 3.0 | REACTOME HYALURONAN UPTAKE AND DEGRADATION | Genes involved in Hyaluronan uptake and degradation |
| 0.1 | 4.9 | REACTOME COMPLEMENT CASCADE | Genes involved in Complement cascade |
| 0.1 | 8.3 | REACTOME COLLAGEN FORMATION | Genes involved in Collagen formation |
| 0.1 | 2.4 | REACTOME DEADENYLATION OF MRNA | Genes involved in Deadenylation of mRNA |
| 0.1 | 6.6 | REACTOME DESTABILIZATION OF MRNA BY AUF1 HNRNP D0 | Genes involved in Destabilization of mRNA by AUF1 (hnRNP D0) |
| 0.1 | 1.9 | REACTOME AMINO ACID SYNTHESIS AND INTERCONVERSION TRANSAMINATION | Genes involved in Amino acid synthesis and interconversion (transamination) |
| 0.1 | 1.1 | REACTOME VEGF LIGAND RECEPTOR INTERACTIONS | Genes involved in VEGF ligand-receptor interactions |
| 0.1 | 3.0 | REACTOME INTERACTION BETWEEN L1 AND ANKYRINS | Genes involved in Interaction between L1 and Ankyrins |
| 0.0 | 6.7 | REACTOME L1CAM INTERACTIONS | Genes involved in L1CAM interactions |
| 0.0 | 2.7 | REACTOME MITOCHONDRIAL PROTEIN IMPORT | Genes involved in Mitochondrial Protein Import |
| 0.0 | 1.5 | REACTOME CASPASE MEDIATED CLEAVAGE OF CYTOSKELETAL PROTEINS | Genes involved in Caspase-mediated cleavage of cytoskeletal proteins |
| 0.0 | 2.4 | REACTOME ION TRANSPORT BY P TYPE ATPASES | Genes involved in Ion transport by P-type ATPases |
| 0.0 | 1.1 | REACTOME ACYL CHAIN REMODELLING OF PE | Genes involved in Acyl chain remodelling of PE |
| 0.0 | 1.3 | REACTOME ACTIVATION OF GENES BY ATF4 | Genes involved in Activation of Genes by ATF4 |
| 0.0 | 0.6 | REACTOME PURINE CATABOLISM | Genes involved in Purine catabolism |
| 0.0 | 0.6 | REACTOME SCFSKP2 MEDIATED DEGRADATION OF P27 P21 | Genes involved in SCF(Skp2)-mediated degradation of p27/p21 |
| 0.0 | 1.4 | REACTOME MEIOTIC RECOMBINATION | Genes involved in Meiotic Recombination |
| 0.0 | 0.1 | REACTOME HYALURONAN METABOLISM | Genes involved in Hyaluronan metabolism |
| 0.0 | 0.8 | REACTOME FORMATION OF TUBULIN FOLDING INTERMEDIATES BY CCT TRIC | Genes involved in Formation of tubulin folding intermediates by CCT/TriC |
| 0.0 | 2.0 | REACTOME GOLGI ASSOCIATED VESICLE BIOGENESIS | Genes involved in Golgi Associated Vesicle Biogenesis |
| 0.0 | 4.9 | REACTOME SIGNALING BY RHO GTPASES | Genes involved in Signaling by Rho GTPases |
| 0.0 | 0.4 | REACTOME APOPTOTIC CLEAVAGE OF CELL ADHESION PROTEINS | Genes involved in Apoptotic cleavage of cell adhesion proteins |
| 0.0 | 0.3 | REACTOME MITOCHONDRIAL TRNA AMINOACYLATION | Genes involved in Mitochondrial tRNA aminoacylation |
| 0.0 | 1.0 | REACTOME GLYCOSPHINGOLIPID METABOLISM | Genes involved in Glycosphingolipid metabolism |