Project
Illumina Body Map 2 (GSE30611)
Navigation
Downloads
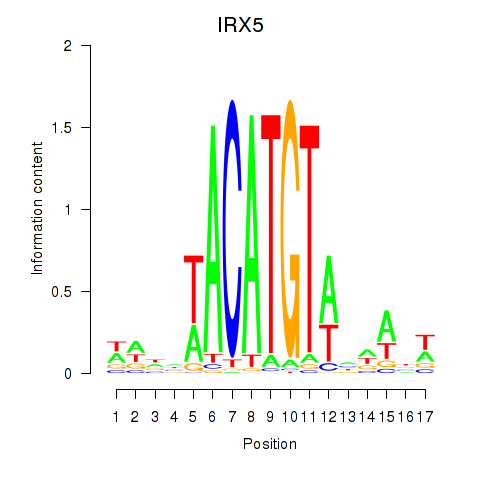
Results for IRX5
Z-value: 0.90
Motif logo
Transcription factors associated with IRX5
| Gene Symbol | Gene ID | Gene Info |
|---|---|---|
|
IRX5
|
ENSG00000176842.15 | iroquois homeobox 5 |
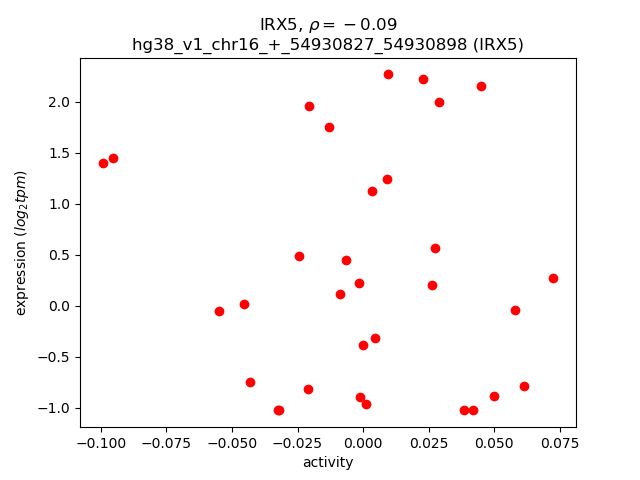
Activity-expression correlation:
| Gene | Promoter | Pearson corr. coef. | P-value | Plot |
|---|---|---|---|---|
| IRX5 | hg38_v1_chr16_+_54930827_54930898 | -0.09 | 6.1e-01 | Click! |
Activity profile of IRX5 motif
Sorted Z-values of IRX5 motif
| Promoter | Log-likelihood | Transcript | Gene | Gene Info |
|---|---|---|---|---|
| chr12_+_21526287 | 3.54 |
ENST00000256969.7
|
SPX
|
spexin hormone |
| chr10_-_95069489 | 3.30 |
ENST00000371270.6
ENST00000535898.5 ENST00000623108.3 |
CYP2C8
|
cytochrome P450 family 2 subfamily C member 8 |
| chr4_+_140343443 | 2.48 |
ENST00000338517.8
ENST00000394203.7 ENST00000506322.5 |
SCOC
|
short coiled-coil protein |
| chr15_+_66293217 | 2.21 |
ENST00000319194.9
ENST00000525134.6 |
DIS3L
|
DIS3 like exosome 3'-5' exoribonuclease |
| chr20_+_10218948 | 2.19 |
ENST00000430336.1
|
SNAP25
|
synaptosome associated protein 25 |
| chr7_-_99976017 | 2.15 |
ENST00000411734.1
ENST00000292401.9 |
AZGP1
|
alpha-2-glycoprotein 1, zinc-binding |
| chr5_+_36608146 | 2.01 |
ENST00000381918.4
ENST00000513646.1 |
SLC1A3
|
solute carrier family 1 member 3 |
| chr4_+_76074701 | 1.99 |
ENST00000355810.9
ENST00000349321.7 |
ART3
|
ADP-ribosyltransferase 3 (inactive) |
| chr14_-_23408265 | 1.98 |
ENST00000405093.9
|
MYH6
|
myosin heavy chain 6 |
| chr9_-_90642791 | 1.89 |
ENST00000375765.5
ENST00000636786.1 |
DIRAS2
|
DIRAS family GTPase 2 |
| chr8_-_17697654 | 1.79 |
ENST00000297488.10
|
MTUS1
|
microtubule associated scaffold protein 1 |
| chr3_+_159069252 | 1.75 |
ENST00000640015.1
ENST00000476809.7 ENST00000485419.7 |
IQCJ-SCHIP1
|
IQCJ-SCHIP1 readthrough |
| chr12_-_21604840 | 1.72 |
ENST00000261195.3
|
GYS2
|
glycogen synthase 2 |
| chr1_+_196943738 | 1.64 |
ENST00000367415.8
ENST00000367421.5 ENST00000649283.1 ENST00000476712.6 ENST00000496448.6 ENST00000473386.1 ENST00000649960.1 |
CFHR2
|
complement factor H related 2 |
| chr4_-_176269213 | 1.61 |
ENST00000296525.7
|
ASB5
|
ankyrin repeat and SOCS box containing 5 |
| chr19_+_50188180 | 1.60 |
ENST00000598205.5
|
MYH14
|
myosin heavy chain 14 |
| chr8_+_12945667 | 1.59 |
ENST00000524591.7
|
TRMT9B
|
tRNA methyltransferase 9B (putative) |
| chr1_+_207034366 | 1.57 |
ENST00000545806.5
ENST00000618513.4 |
PFKFB2
|
6-phosphofructo-2-kinase/fructose-2,6-biphosphatase 2 |
| chr14_-_23154369 | 1.47 |
ENST00000453702.5
|
SLC7A8
|
solute carrier family 7 member 8 |
| chr1_+_196888014 | 1.46 |
ENST00000367416.6
ENST00000608469.6 ENST00000251424.8 ENST00000367418.2 |
CFHR4
|
complement factor H related 4 |
| chrX_-_15315615 | 1.44 |
ENST00000380470.7
ENST00000480796.6 |
ASB11
|
ankyrin repeat and SOCS box containing 11 |
| chr14_-_23155302 | 1.42 |
ENST00000529705.6
|
SLC7A8
|
solute carrier family 7 member 8 |
| chr1_+_247965233 | 1.39 |
ENST00000366480.5
|
OR2AK2
|
olfactory receptor family 2 subfamily AK member 2 |
| chr2_-_182242031 | 1.36 |
ENST00000358139.6
|
PDE1A
|
phosphodiesterase 1A |
| chr7_+_123601815 | 1.34 |
ENST00000451215.6
|
ASB15
|
ankyrin repeat and SOCS box containing 15 |
| chr7_+_123601836 | 1.31 |
ENST00000434204.5
|
ASB15
|
ankyrin repeat and SOCS box containing 15 |
| chr6_-_33711684 | 1.31 |
ENST00000374231.8
ENST00000607484.6 |
UQCC2
|
ubiquinol-cytochrome c reductase complex assembly factor 2 |
| chr12_+_21527017 | 1.27 |
ENST00000535033.5
|
SPX
|
spexin hormone |
| chr8_+_12945636 | 1.24 |
ENST00000447063.6
|
TRMT9B
|
tRNA methyltransferase 9B (putative) |
| chr7_+_123601859 | 1.21 |
ENST00000437535.5
|
ASB15
|
ankyrin repeat and SOCS box containing 15 |
| chr1_+_61203496 | 1.19 |
ENST00000663597.1
|
NFIA
|
nuclear factor I A |
| chr4_+_41359599 | 1.12 |
ENST00000513024.5
|
LIMCH1
|
LIM and calponin homology domains 1 |
| chr14_-_23154422 | 1.11 |
ENST00000422941.6
|
SLC7A8
|
solute carrier family 7 member 8 |
| chr11_-_82733850 | 1.11 |
ENST00000329203.5
|
FAM181B
|
family with sequence similarity 181 member B |
| chr3_+_68004231 | 1.10 |
ENST00000478136.6
|
TAFA1
|
TAFA chemokine like family member 1 |
| chrX_-_33211540 | 1.08 |
ENST00000357033.9
|
DMD
|
dystrophin |
| chr20_+_10218808 | 1.07 |
ENST00000254976.7
ENST00000304886.6 |
SNAP25
|
synaptosome associated protein 25 |
| chr15_+_66293541 | 1.07 |
ENST00000319212.9
ENST00000525109.1 |
DIS3L
|
DIS3 like exosome 3'-5' exoribonuclease |
| chr1_+_61082398 | 1.05 |
ENST00000664149.1
|
NFIA
|
nuclear factor I A |
| chr7_-_6026552 | 1.04 |
ENST00000422786.1
|
EIF2AK1
|
eukaryotic translation initiation factor 2 alpha kinase 1 |
| chr8_-_73582830 | 1.02 |
ENST00000523533.5
|
STAU2
|
staufen double-stranded RNA binding protein 2 |
| chr12_+_55720367 | 1.01 |
ENST00000547072.5
ENST00000552930.5 ENST00000257895.10 |
RDH5
|
retinol dehydrogenase 5 |
| chr1_+_61081728 | 1.00 |
ENST00000371189.8
|
NFIA
|
nuclear factor I A |
| chr7_+_36420163 | 1.00 |
ENST00000446635.5
|
ANLN
|
anillin actin binding protein |
| chr6_-_24489565 | 1.00 |
ENST00000230036.2
|
GPLD1
|
glycosylphosphatidylinositol specific phospholipase D1 |
| chr12_+_10212867 | 0.97 |
ENST00000545047.5
ENST00000266458.10 ENST00000629504.1 ENST00000543602.5 ENST00000545887.1 |
GABARAPL1
|
GABA type A receptor associated protein like 1 |
| chr19_+_35358460 | 0.96 |
ENST00000327809.5
|
FFAR3
|
free fatty acid receptor 3 |
| chr6_-_154356735 | 0.94 |
ENST00000367220.8
ENST00000265198.8 ENST00000520261.1 |
IPCEF1
|
interaction protein for cytohesin exchange factors 1 |
| chr1_+_196819731 | 0.93 |
ENST00000320493.10
ENST00000367424.4 |
CFHR1
|
complement factor H related 1 |
| chr14_+_73097027 | 0.91 |
ENST00000532192.1
|
RBM25
|
RNA binding motif protein 25 |
| chr3_+_186666003 | 0.91 |
ENST00000232003.5
|
HRG
|
histidine rich glycoprotein |
| chr19_-_44448435 | 0.91 |
ENST00000588655.1
ENST00000592308.1 ENST00000614049.5 ENST00000613197.4 |
ENSG00000267188.1
ZNF229
|
novel transcript zinc finger protein 229 |
| chr3_+_173398438 | 0.88 |
ENST00000457714.5
|
NLGN1
|
neuroligin 1 |
| chr8_-_73259502 | 0.88 |
ENST00000624510.3
ENST00000613105.4 ENST00000625134.1 |
C8orf89
|
chromosome 8 open reading frame 89 |
| chr6_+_29461440 | 0.87 |
ENST00000396792.2
|
OR2H1
|
olfactory receptor family 2 subfamily H member 1 |
| chr10_-_89643870 | 0.86 |
ENST00000322191.10
ENST00000342512.3 |
PANK1
|
pantothenate kinase 1 |
| chr4_+_113145608 | 0.86 |
ENST00000511380.1
|
ANK2
|
ankyrin 2 |
| chr9_-_21187671 | 0.86 |
ENST00000421715.2
|
IFNA4
|
interferon alpha 4 |
| chr6_+_43243468 | 0.85 |
ENST00000259750.9
|
TTBK1
|
tau tubulin kinase 1 |
| chr2_-_88128049 | 0.85 |
ENST00000393750.3
ENST00000295834.8 |
FABP1
|
fatty acid binding protein 1 |
| chr17_-_69268812 | 0.85 |
ENST00000586811.1
|
ABCA5
|
ATP binding cassette subfamily A member 5 |
| chr14_+_55661242 | 0.82 |
ENST00000553624.5
|
KTN1
|
kinectin 1 |
| chr5_-_177780633 | 0.81 |
ENST00000513554.5
ENST00000440605.7 |
FAM153A
|
family with sequence similarity 153 member A |
| chr10_+_94938649 | 0.81 |
ENST00000461906.1
ENST00000260682.8 |
CYP2C9
|
cytochrome P450 family 2 subfamily C member 9 |
| chr8_+_119873710 | 0.80 |
ENST00000523492.5
ENST00000286234.6 |
DEPTOR
|
DEP domain containing MTOR interacting protein |
| chr10_-_15088768 | 0.79 |
ENST00000356189.6
|
ACBD7
|
acyl-CoA binding domain containing 7 |
| chr12_+_10212836 | 0.79 |
ENST00000421801.6
ENST00000544284.5 |
GABARAPL1
|
GABA type A receptor associated protein like 1 |
| chr20_+_59300703 | 0.78 |
ENST00000395654.3
|
EDN3
|
endothelin 3 |
| chr1_-_114581589 | 0.77 |
ENST00000369541.4
|
BCAS2
|
BCAS2 pre-mRNA processing factor |
| chr4_+_122732727 | 0.77 |
ENST00000433287.1
|
BBS12
|
Bardet-Biedl syndrome 12 |
| chr11_+_71565563 | 0.77 |
ENST00000398531.3
|
KRTAP5-10
|
keratin associated protein 5-10 |
| chr1_-_85404494 | 0.76 |
ENST00000633113.1
|
DDAH1
|
dimethylarginine dimethylaminohydrolase 1 |
| chr1_+_10450004 | 0.76 |
ENST00000377049.4
|
CORT
|
cortistatin |
| chr18_-_72638510 | 0.75 |
ENST00000581073.1
|
CBLN2
|
cerebellin 2 precursor |
| chr5_+_140450 | 0.75 |
ENST00000502646.1
|
PLEKHG4B
|
pleckstrin homology and RhoGEF domain containing G4B |
| chr1_+_86547070 | 0.75 |
ENST00000370563.3
|
CLCA4
|
chloride channel accessory 4 |
| chr12_+_55720405 | 0.75 |
ENST00000548082.1
|
RDH5
|
retinol dehydrogenase 5 |
| chr8_+_30638562 | 0.73 |
ENST00000517349.2
|
SMIM18
|
small integral membrane protein 18 |
| chr1_+_220094086 | 0.71 |
ENST00000366922.3
|
IARS2
|
isoleucyl-tRNA synthetase 2, mitochondrial |
| chr12_+_10212483 | 0.70 |
ENST00000545859.5
|
GABARAPL1
|
GABA type A receptor associated protein like 1 |
| chr4_+_143391506 | 0.69 |
ENST00000509992.1
|
GAB1
|
GRB2 associated binding protein 1 |
| chr1_+_235367360 | 0.68 |
ENST00000651186.1
ENST00000406207.5 ENST00000645899.1 ENST00000644578.1 ENST00000645372.1 ENST00000647407.1 ENST00000642610.2 ENST00000543662.4 ENST00000366601.8 |
TBCE
|
tubulin folding cofactor E |
| chr1_-_111563956 | 0.67 |
ENST00000369717.8
|
TMIGD3
|
transmembrane and immunoglobulin domain containing 3 |
| chr3_+_156120572 | 0.67 |
ENST00000389636.9
ENST00000490337.6 |
KCNAB1
|
potassium voltage-gated channel subfamily A member regulatory beta subunit 1 |
| chr8_+_232137 | 0.67 |
ENST00000521145.5
ENST00000320552.6 ENST00000308811.8 ENST00000640035.1 ENST00000522866.5 |
ZNF596
|
zinc finger protein 596 |
| chr2_+_209653171 | 0.66 |
ENST00000447185.5
|
MAP2
|
microtubule associated protein 2 |
| chr13_-_35855627 | 0.66 |
ENST00000379893.5
|
DCLK1
|
doublecortin like kinase 1 |
| chr11_-_35526024 | 0.65 |
ENST00000615849.4
|
PAMR1
|
peptidase domain containing associated with muscle regeneration 1 |
| chr8_+_28090229 | 0.65 |
ENST00000521015.5
ENST00000521570.5 |
ELP3
|
elongator acetyltransferase complex subunit 3 |
| chr3_+_160756225 | 0.64 |
ENST00000498165.6
|
PPM1L
|
protein phosphatase, Mg2+/Mn2+ dependent 1L |
| chr13_-_35855758 | 0.64 |
ENST00000615680.4
|
DCLK1
|
doublecortin like kinase 1 |
| chr6_+_168002058 | 0.64 |
ENST00000652547.1
|
KIF25
|
kinesin family member 25 |
| chrX_-_139708190 | 0.63 |
ENST00000414978.5
ENST00000519895.5 |
MCF2
|
MCF.2 cell line derived transforming sequence |
| chr3_+_138347648 | 0.62 |
ENST00000614350.4
ENST00000289104.8 |
MRAS
|
muscle RAS oncogene homolog |
| chr4_+_118850668 | 0.62 |
ENST00000610556.4
|
SYNPO2
|
synaptopodin 2 |
| chr12_-_119877270 | 0.62 |
ENST00000261833.11
ENST00000612548.4 |
CIT
|
citron rho-interacting serine/threonine kinase |
| chr1_+_53014926 | 0.60 |
ENST00000430330.6
ENST00000408941.7 ENST00000478274.6 ENST00000484100.5 ENST00000435345.6 ENST00000488965.1 |
SCP2
|
sterol carrier protein 2 |
| chr4_+_112637456 | 0.60 |
ENST00000505034.5
ENST00000324052.10 |
LARP7
|
La ribonucleoprotein 7, transcriptional regulator |
| chr3_-_20012250 | 0.60 |
ENST00000389050.5
|
PP2D1
|
protein phosphatase 2C like domain containing 1 |
| chr4_+_112637514 | 0.60 |
ENST00000651579.1
|
LARP7
|
La ribonucleoprotein 7, transcriptional regulator |
| chr6_+_112087576 | 0.60 |
ENST00000368656.7
ENST00000604268.1 |
FAM229B
|
family with sequence similarity 229 member B |
| chr4_-_103077282 | 0.59 |
ENST00000503230.5
ENST00000503818.1 |
SLC9B2
|
solute carrier family 9 member B2 |
| chr12_+_6724008 | 0.58 |
ENST00000626119.2
ENST00000543155.6 |
COPS7A
|
COP9 signalosome subunit 7A |
| chr4_+_164877164 | 0.58 |
ENST00000507152.6
ENST00000515275.1 |
APELA
|
apelin receptor early endogenous ligand |
| chr1_+_240245260 | 0.58 |
ENST00000441342.1
|
FMN2
|
formin 2 |
| chr18_+_24426682 | 0.57 |
ENST00000585067.5
ENST00000578221.1 |
IMPACT
|
impact RWD domain protein |
| chr11_-_49059112 | 0.56 |
ENST00000617704.1
|
TRIM64C
|
tripartite motif containing 64C |
| chr3_-_52679713 | 0.56 |
ENST00000296302.11
ENST00000356770.8 ENST00000337303.8 ENST00000409057.5 ENST00000410007.5 ENST00000409114.7 ENST00000409767.5 ENST00000423351.5 |
PBRM1
|
polybromo 1 |
| chr1_-_212847649 | 0.56 |
ENST00000332912.3
|
SPATA45
|
spermatogenesis associated 45 |
| chr11_+_56315144 | 0.56 |
ENST00000641662.1
ENST00000641689.1 |
OR8K3
|
olfactory receptor family 8 subfamily K member 3 (gene/pseudogene) |
| chr2_+_233729042 | 0.56 |
ENST00000482026.6
|
UGT1A3
|
UDP glucuronosyltransferase family 1 member A3 |
| chr11_+_22666604 | 0.55 |
ENST00000454584.6
|
GAS2
|
growth arrest specific 2 |
| chr6_+_26204552 | 0.55 |
ENST00000615164.2
|
H4C5
|
H4 clustered histone 5 |
| chr5_-_146516190 | 0.55 |
ENST00000311104.3
|
GPR151
|
G protein-coupled receptor 151 |
| chr15_-_51338575 | 0.55 |
ENST00000557858.5
ENST00000558328.5 ENST00000396402.6 ENST00000396404.8 ENST00000561075.5 ENST00000405011.6 ENST00000559980.5 ENST00000453807.6 |
CYP19A1
|
cytochrome P450 family 19 subfamily A member 1 |
| chr7_-_120858066 | 0.55 |
ENST00000222747.8
|
TSPAN12
|
tetraspanin 12 |
| chrX_+_49529869 | 0.53 |
ENST00000361446.5
|
GAGE12B
|
G antigen 12B |
| chr14_+_55661272 | 0.53 |
ENST00000555573.5
|
KTN1
|
kinectin 1 |
| chr7_-_108243234 | 0.53 |
ENST00000417701.5
|
NRCAM
|
neuronal cell adhesion molecule |
| chr5_+_68280281 | 0.52 |
ENST00000522084.5
|
PIK3R1
|
phosphoinositide-3-kinase regulatory subunit 1 |
| chr12_+_57941499 | 0.52 |
ENST00000300145.4
|
ATP23
|
ATP23 metallopeptidase and ATP synthase assembly factor homolog |
| chr13_-_41194485 | 0.51 |
ENST00000379483.4
|
KBTBD7
|
kelch repeat and BTB domain containing 7 |
| chr9_-_125650417 | 0.51 |
ENST00000420643.5
|
MAPKAP1
|
MAPK associated protein 1 |
| chr3_+_12351470 | 0.51 |
ENST00000287820.10
|
PPARG
|
peroxisome proliferator activated receptor gamma |
| chr6_-_39322968 | 0.50 |
ENST00000507712.5
|
KCNK16
|
potassium two pore domain channel subfamily K member 16 |
| chr1_-_243843164 | 0.50 |
ENST00000491219.6
ENST00000680056.1 ENST00000492957.2 |
AKT3
|
AKT serine/threonine kinase 3 |
| chr3_+_180868748 | 0.49 |
ENST00000465551.5
|
FXR1
|
FMR1 autosomal homolog 1 |
| chr5_-_145873014 | 0.49 |
ENST00000377976.3
|
GRXCR2
|
glutaredoxin and cysteine rich domain containing 2 |
| chr18_-_36798482 | 0.48 |
ENST00000590258.2
|
TPGS2
|
tubulin polyglutamylase complex subunit 2 |
| chr9_+_94084458 | 0.48 |
ENST00000620992.5
ENST00000288976.3 |
PTPDC1
|
protein tyrosine phosphatase domain containing 1 |
| chr4_+_55346291 | 0.48 |
ENST00000680700.1
|
ENSG00000288695.1
|
novel protein, SRD5A3-RP11-177J6.1 readthrough |
| chr5_-_147081462 | 0.48 |
ENST00000508267.5
ENST00000504198.5 |
PPP2R2B
|
protein phosphatase 2 regulatory subunit Bbeta |
| chr3_-_124887658 | 0.47 |
ENST00000483168.5
|
ITGB5
|
integrin subunit beta 5 |
| chr3_+_100635598 | 0.47 |
ENST00000475887.1
|
ADGRG7
|
adhesion G protein-coupled receptor G7 |
| chr19_+_12833908 | 0.47 |
ENST00000591495.5
|
MAST1
|
microtubule associated serine/threonine kinase 1 |
| chr1_-_111563934 | 0.46 |
ENST00000443498.5
|
TMIGD3
|
transmembrane and immunoglobulin domain containing 3 |
| chr3_+_12351493 | 0.45 |
ENST00000683699.1
|
PPARG
|
peroxisome proliferator activated receptor gamma |
| chr2_-_87825952 | 0.45 |
ENST00000398146.4
|
RGPD2
|
RANBP2 like and GRIP domain containing 2 |
| chr3_+_11011640 | 0.44 |
ENST00000643396.1
|
SLC6A1
|
solute carrier family 6 member 1 |
| chr12_-_7503744 | 0.43 |
ENST00000396620.7
ENST00000432237.3 |
CD163
|
CD163 molecule |
| chrX_-_33211462 | 0.43 |
ENST00000682071.1
ENST00000684237.1 |
DMD
|
dystrophin |
| chr9_+_35042213 | 0.43 |
ENST00000378745.3
ENST00000312292.6 |
C9orf131
|
chromosome 9 open reading frame 131 |
| chr12_-_52473798 | 0.42 |
ENST00000252250.7
|
KRT6C
|
keratin 6C |
| chr2_+_112542413 | 0.42 |
ENST00000417433.6
ENST00000263331.10 |
POLR1B
|
RNA polymerase I subunit B |
| chr12_+_133181409 | 0.42 |
ENST00000416488.5
ENST00000228289.9 ENST00000541211.6 ENST00000536435.7 ENST00000500625.7 ENST00000539248.6 ENST00000542711.6 ENST00000536899.6 ENST00000542986.6 ENST00000611984.4 ENST00000541975.2 |
ZNF268
|
zinc finger protein 268 |
| chr14_+_94619313 | 0.42 |
ENST00000621603.1
|
SERPINA3
|
serpin family A member 3 |
| chr18_+_36129888 | 0.41 |
ENST00000351393.10
ENST00000442325.6 ENST00000423854.6 ENST00000358232.11 ENST00000350494.10 ENST00000542824.5 |
ELP2
|
elongator acetyltransferase complex subunit 2 |
| chr3_+_46242453 | 0.41 |
ENST00000452454.1
ENST00000395940.3 ENST00000457243.1 |
CCR3
|
C-C motif chemokine receptor 3 |
| chr1_-_89175997 | 0.41 |
ENST00000294671.3
ENST00000650452.1 |
GBP7
|
guanylate binding protein 7 |
| chr2_+_200308943 | 0.40 |
ENST00000619961.4
|
SPATS2L
|
spermatogenesis associated serine rich 2 like |
| chr1_+_196774813 | 0.40 |
ENST00000471440.6
ENST00000391985.7 ENST00000617219.1 ENST00000367425.9 |
CFHR3
|
complement factor H related 3 |
| chr6_+_144330797 | 0.39 |
ENST00000628146.2
|
UTRN
|
utrophin |
| chr12_+_55492378 | 0.39 |
ENST00000548615.1
|
OR6C68
|
olfactory receptor family 6 subfamily C member 68 |
| chr15_+_24954912 | 0.39 |
ENST00000584968.5
ENST00000346403.10 ENST00000554227.6 ENST00000390687.9 ENST00000579070.5 ENST00000577565.1 ENST00000577949.5 ENST00000338327.4 |
SNRPN
SNURF
|
small nuclear ribonucleoprotein polypeptide N SNRPN upstream reading frame |
| chrX_+_48004336 | 0.38 |
ENST00000304355.9
|
SPACA5
|
sperm acrosome associated 5 |
| chr19_-_3500664 | 0.38 |
ENST00000427575.6
|
DOHH
|
deoxyhypusine hydroxylase |
| chr17_-_7205116 | 0.38 |
ENST00000649520.1
ENST00000649186.1 |
DLG4
|
discs large MAGUK scaffold protein 4 |
| chr6_+_36871841 | 0.37 |
ENST00000359359.6
|
C6orf89
|
chromosome 6 open reading frame 89 |
| chr18_+_24426633 | 0.37 |
ENST00000648078.1
ENST00000284202.9 |
IMPACT
|
impact RWD domain protein |
| chr11_+_31509744 | 0.37 |
ENST00000639878.1
ENST00000379163.10 ENST00000638347.1 ENST00000350638.10 ENST00000638764.1 ENST00000639570.1 ENST00000640533.1 ENST00000638482.1 ENST00000640961.2 ENST00000640342.1 ENST00000640231.1 ENST00000640954.1 ENST00000395934.2 |
ELP4
|
elongator acetyltransferase complex subunit 4 |
| chr16_-_75677009 | 0.37 |
ENST00000640173.1
|
ENSG00000284484.1
|
novel protein similar to cytoplasmic polyadenylated homeobox like CPHXL |
| chrX_-_33211312 | 0.36 |
ENST00000420596.5
ENST00000448370.5 |
DMD
|
dystrophin |
| chr11_+_89924064 | 0.36 |
ENST00000623787.3
|
TRIM49D2
|
tripartite motif containing 49D2 |
| chr3_+_52211442 | 0.35 |
ENST00000459884.1
|
ALAS1
|
5'-aminolevulinate synthase 1 |
| chr11_-_18939493 | 0.35 |
ENST00000526914.1
|
MRGPRX1
|
MAS related GPR family member X1 |
| chr11_+_95049422 | 0.35 |
ENST00000545950.2
|
KDM4F
|
lysine demethylase 4F |
| chr3_-_38816217 | 0.35 |
ENST00000449082.3
ENST00000655275.1 |
SCN10A
|
sodium voltage-gated channel alpha subunit 10 |
| chr19_-_40090921 | 0.35 |
ENST00000595508.1
ENST00000414720.6 ENST00000455521.5 ENST00000595773.5 ENST00000683561.1 |
ENSG00000269749.1
ZNF780A
|
novel transcript zinc finger protein 780A |
| chr1_+_67207614 | 0.35 |
ENST00000425614.3
|
IL23R
|
interleukin 23 receptor |
| chr11_-_58508105 | 0.34 |
ENST00000360374.3
|
OR5B21
|
olfactory receptor family 5 subfamily B member 21 |
| chr16_+_19523913 | 0.34 |
ENST00000565376.2
|
CCP110
|
centriolar coiled-coil protein 110 |
| chr15_-_50546660 | 0.33 |
ENST00000532404.6
ENST00000616326.1 |
USP50
|
ubiquitin specific peptidase 50 |
| chr7_-_6348906 | 0.33 |
ENST00000313324.9
ENST00000530143.1 |
FAM220A
|
family with sequence similarity 220 member A |
| chr19_-_40090860 | 0.33 |
ENST00000599972.1
ENST00000450241.6 ENST00000595687.6 ENST00000340963.9 |
ZNF780A
|
zinc finger protein 780A |
| chr17_+_12955763 | 0.33 |
ENST00000583608.1
|
ARHGAP44
|
Rho GTPase activating protein 44 |
| chr1_+_155610218 | 0.32 |
ENST00000649846.1
ENST00000245564.8 ENST00000368341.8 |
MSTO1
|
misato mitochondrial distribution and morphology regulator 1 |
| chr5_-_147081428 | 0.32 |
ENST00000394413.7
|
PPP2R2B
|
protein phosphatase 2 regulatory subunit Bbeta |
| chr1_-_115841116 | 0.32 |
ENST00000320238.3
|
NHLH2
|
nescient helix-loop-helix 2 |
| chr11_-_60243103 | 0.32 |
ENST00000651255.1
|
MS4A4E
|
membrane spanning 4-domains A4E |
| chr4_+_109848102 | 0.32 |
ENST00000594814.6
|
LRIT3
|
leucine rich repeat, Ig-like and transmembrane domains 3 |
| chr5_+_65563239 | 0.32 |
ENST00000535264.5
ENST00000538977.5 ENST00000261308.10 |
PPWD1
|
peptidylprolyl isomerase domain and WD repeat containing 1 |
| chr2_+_209653324 | 0.31 |
ENST00000452717.1
|
MAP2
|
microtubule associated protein 2 |
| chr12_+_54854505 | 0.31 |
ENST00000308796.11
ENST00000619042.1 |
MUCL1
|
mucin like 1 |
| chr3_-_46027477 | 0.31 |
ENST00000309285.4
ENST00000395946.2 |
XCR1
|
X-C motif chemokine receptor 1 |
| chr1_-_149887955 | 0.31 |
ENST00000331128.6
|
H2AC21
|
H2A clustered histone 21 |
| chr8_+_22367526 | 0.30 |
ENST00000289952.9
ENST00000524285.1 |
SLC39A14
|
solute carrier family 39 member 14 |
| chr5_+_169583636 | 0.30 |
ENST00000506574.5
ENST00000515224.5 ENST00000629457.2 ENST00000508247.5 ENST00000265295.9 ENST00000513941.5 |
SPDL1
|
spindle apparatus coiled-coil protein 1 |
| chr19_-_2740039 | 0.30 |
ENST00000586572.1
|
ENSG00000267001.1
|
novel protein |
| chrX_+_48007796 | 0.30 |
ENST00000376940.3
|
SPACA5
|
sperm acrosome associated 5 |
| chr11_-_7830840 | 0.30 |
ENST00000641167.1
|
OR5P3
|
olfactory receptor family 5 subfamily P member 3 |
| chr17_-_7204502 | 0.29 |
ENST00000486626.8
ENST00000648263.1 |
DLG4
|
discs large MAGUK scaffold protein 4 |
| chr7_+_831922 | 0.29 |
ENST00000421580.5
|
SUN1
|
Sad1 and UNC84 domain containing 1 |
| chr19_-_47555856 | 0.29 |
ENST00000391901.7
ENST00000314121.8 |
ZNF541
|
zinc finger protein 541 |
| chr11_+_58023881 | 0.29 |
ENST00000335397.3
|
OR9Q1
|
olfactory receptor family 9 subfamily Q member 1 |
| chr4_+_121801311 | 0.28 |
ENST00000379663.7
ENST00000243498.10 ENST00000509800.5 |
EXOSC9
|
exosome component 9 |
| chr17_+_3475959 | 0.28 |
ENST00000263080.3
|
ASPA
|
aspartoacylase |
| chr1_-_61725121 | 0.28 |
ENST00000371177.2
ENST00000606498.5 |
TM2D1
|
TM2 domain containing 1 |
| chr3_-_74521140 | 0.28 |
ENST00000263665.6
|
CNTN3
|
contactin 3 |
| chr1_-_108200849 | 0.28 |
ENST00000569674.1
|
SLC25A24
|
solute carrier family 25 member 24 |
| chr3_+_109136707 | 0.28 |
ENST00000622536.6
|
C3orf85
|
chromosome 3 open reading frame 85 |
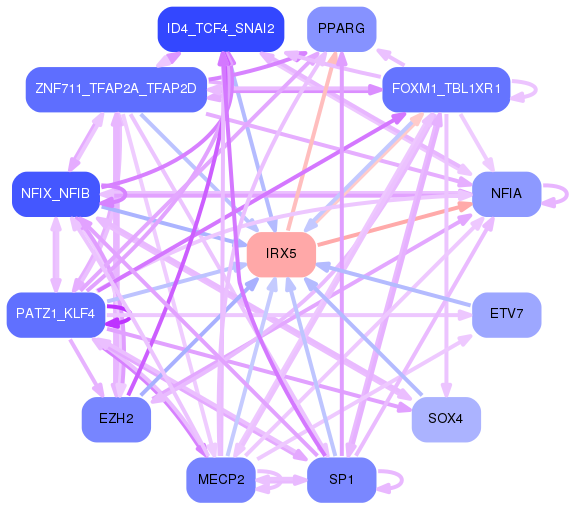
Network of associatons between targets according to the STRING database.

First level regulatory network of IRX5
Gene Ontology Analysis
Gene overrepresentation in biological process category:
| Log-likelihood per target | Total log-likelihood | Term | Description |
|---|---|---|---|
| 0.8 | 3.3 | GO:1990926 | short-term synaptic potentiation(GO:1990926) |
| 0.6 | 4.8 | GO:1904306 | regulation of gastro-intestinal system smooth muscle contraction(GO:1904304) positive regulation of gastro-intestinal system smooth muscle contraction(GO:1904306) |
| 0.5 | 3.3 | GO:0002933 | lipid hydroxylation(GO:0002933) |
| 0.3 | 0.9 | GO:0071264 | regulation of eIF2 alpha phosphorylation by amino acid starvation(GO:0060733) regulation of translational initiation in response to starvation(GO:0071262) positive regulation of translational initiation in response to starvation(GO:0071264) |
| 0.3 | 3.6 | GO:0045919 | positive regulation of cytolysis(GO:0045919) |
| 0.3 | 1.0 | GO:1904170 | septin ring assembly(GO:0000921) septin ring organization(GO:0031106) regulation of bleb assembly(GO:1904170) positive regulation of bleb assembly(GO:1904172) |
| 0.2 | 1.0 | GO:0002879 | positive regulation of acute inflammatory response to non-antigenic stimulus(GO:0002879) |
| 0.2 | 0.9 | GO:2001027 | negative regulation of endothelial cell chemotaxis(GO:2001027) |
| 0.2 | 1.6 | GO:0033133 | positive regulation of glucokinase activity(GO:0033133) |
| 0.2 | 0.9 | GO:0097115 | cytoskeletal matrix organization at active zone(GO:0048789) neurexin clustering involved in presynaptic membrane assembly(GO:0097115) retrograde trans-synaptic signaling by trans-synaptic protein complex(GO:0098942) |
| 0.2 | 1.0 | GO:0006447 | regulation of translational initiation by iron(GO:0006447) |
| 0.2 | 0.6 | GO:0090134 | mesendoderm migration(GO:0090133) cell migration involved in mesendoderm migration(GO:0090134) |
| 0.2 | 2.0 | GO:0055009 | atrial cardiac muscle tissue development(GO:0003228) atrial cardiac muscle tissue morphogenesis(GO:0055009) |
| 0.2 | 0.8 | GO:0016098 | monoterpenoid metabolic process(GO:0016098) |
| 0.2 | 0.6 | GO:0046603 | negative regulation of mitotic centrosome separation(GO:0046603) |
| 0.2 | 0.5 | GO:0032053 | ciliary basal body organization(GO:0032053) |
| 0.1 | 0.4 | GO:0051939 | gamma-aminobutyric acid import(GO:0051939) |
| 0.1 | 2.0 | GO:0009449 | gamma-aminobutyric acid biosynthetic process(GO:0009449) |
| 0.1 | 3.6 | GO:0016075 | rRNA catabolic process(GO:0016075) |
| 0.1 | 0.4 | GO:0045897 | positive regulation of transcription during mitosis(GO:0045897) |
| 0.1 | 2.5 | GO:0061635 | regulation of protein complex stability(GO:0061635) |
| 0.1 | 1.0 | GO:2000230 | negative regulation of pancreatic stellate cell proliferation(GO:2000230) |
| 0.1 | 1.3 | GO:0017062 | respiratory chain complex III assembly(GO:0017062) mitochondrial respiratory chain complex III assembly(GO:0034551) |
| 0.1 | 1.9 | GO:0014809 | regulation of skeletal muscle contraction by regulation of release of sequestered calcium ion(GO:0014809) |
| 0.1 | 0.6 | GO:0051758 | homologous chromosome movement towards spindle pole involved in homologous chromosome segregation(GO:0051758) |
| 0.1 | 0.7 | GO:0048936 | peripheral nervous system neuron axonogenesis(GO:0048936) |
| 0.1 | 0.5 | GO:2000863 | positive regulation of estrogen secretion(GO:2000863) positive regulation of estradiol secretion(GO:2000866) |
| 0.1 | 2.5 | GO:0043562 | cellular response to nitrogen starvation(GO:0006995) cellular response to nitrogen levels(GO:0043562) |
| 0.1 | 0.8 | GO:0010961 | cellular magnesium ion homeostasis(GO:0010961) |
| 0.1 | 0.3 | GO:0006533 | aspartate catabolic process(GO:0006533) |
| 0.1 | 0.5 | GO:0038155 | interleukin-23-mediated signaling pathway(GO:0038155) |
| 0.1 | 3.2 | GO:0072189 | ureter development(GO:0072189) |
| 0.1 | 3.6 | GO:0015695 | organic cation transport(GO:0015695) |
| 0.1 | 0.6 | GO:0032383 | regulation of intracellular lipid transport(GO:0032377) regulation of intracellular sterol transport(GO:0032380) regulation of intracellular cholesterol transport(GO:0032383) |
| 0.1 | 0.2 | GO:0035397 | helper T cell enhancement of adaptive immune response(GO:0035397) |
| 0.1 | 0.9 | GO:0036371 | protein localization to T-tubule(GO:0036371) |
| 0.1 | 0.5 | GO:0030950 | establishment or maintenance of actin cytoskeleton polarity(GO:0030950) |
| 0.1 | 0.2 | GO:1990451 | cellular stress response to acidic pH(GO:1990451) |
| 0.1 | 0.6 | GO:2001206 | positive regulation of osteoclast development(GO:2001206) |
| 0.1 | 0.3 | GO:0098886 | modification of dendritic spine(GO:0098886) |
| 0.1 | 1.4 | GO:0046069 | cGMP catabolic process(GO:0046069) |
| 0.1 | 0.4 | GO:0007000 | nucleolus organization(GO:0007000) |
| 0.0 | 1.0 | GO:0033141 | positive regulation of peptidyl-serine phosphorylation of STAT protein(GO:0033141) |
| 0.0 | 0.9 | GO:0032000 | positive regulation of fatty acid beta-oxidation(GO:0032000) |
| 0.0 | 0.6 | GO:0052696 | flavonoid glucuronidation(GO:0052696) xenobiotic glucuronidation(GO:0052697) |
| 0.0 | 0.7 | GO:0097113 | AMPA glutamate receptor clustering(GO:0097113) glutamate receptor clustering(GO:0097688) |
| 0.0 | 1.8 | GO:0001580 | detection of chemical stimulus involved in sensory perception of bitter taste(GO:0001580) |
| 0.0 | 0.7 | GO:0016998 | cell wall macromolecule catabolic process(GO:0016998) |
| 0.0 | 1.9 | GO:0042572 | retinol metabolic process(GO:0042572) |
| 0.0 | 2.0 | GO:0006471 | protein ADP-ribosylation(GO:0006471) |
| 0.0 | 0.8 | GO:0000712 | resolution of meiotic recombination intermediates(GO:0000712) |
| 0.0 | 0.7 | GO:0006450 | regulation of translational fidelity(GO:0006450) |
| 0.0 | 1.6 | GO:0070584 | mitochondrion morphogenesis(GO:0070584) |
| 0.0 | 0.9 | GO:0010745 | negative regulation of macrophage derived foam cell differentiation(GO:0010745) |
| 0.0 | 0.8 | GO:0045792 | negative regulation of cell size(GO:0045792) |
| 0.0 | 0.3 | GO:0060371 | regulation of atrial cardiac muscle cell membrane depolarization(GO:0060371) |
| 0.0 | 0.9 | GO:0015937 | coenzyme A biosynthetic process(GO:0015937) |
| 0.0 | 0.6 | GO:0000338 | protein deneddylation(GO:0000338) |
| 0.0 | 0.8 | GO:0006527 | citrulline metabolic process(GO:0000052) arginine catabolic process(GO:0006527) |
| 0.0 | 0.1 | GO:0021558 | trochlear nerve development(GO:0021558) regulation of timing of neuron differentiation(GO:0060164) |
| 0.0 | 0.4 | GO:0008612 | peptidyl-lysine modification to peptidyl-hypusine(GO:0008612) |
| 0.0 | 0.9 | GO:0015671 | oxygen transport(GO:0015671) |
| 0.0 | 0.4 | GO:1901727 | positive regulation of histone deacetylase activity(GO:1901727) |
| 0.0 | 0.8 | GO:0070262 | peptidyl-serine dephosphorylation(GO:0070262) |
| 0.0 | 0.5 | GO:0019227 | neuronal action potential propagation(GO:0019227) action potential propagation(GO:0098870) |
| 0.0 | 0.2 | GO:0006776 | vitamin A metabolic process(GO:0006776) |
| 0.0 | 0.7 | GO:0060539 | diaphragm development(GO:0060539) |
| 0.0 | 0.5 | GO:0045793 | positive regulation of cell size(GO:0045793) |
| 0.0 | 0.3 | GO:0015866 | ADP transport(GO:0015866) |
| 0.0 | 0.4 | GO:0014894 | response to muscle inactivity involved in regulation of muscle adaptation(GO:0014877) response to denervation involved in regulation of muscle adaptation(GO:0014894) |
| 0.0 | 0.2 | GO:0097577 | intracellular sequestering of iron ion(GO:0006880) sequestering of iron ion(GO:0097577) |
| 0.0 | 0.1 | GO:0050912 | detection of chemical stimulus involved in sensory perception of taste(GO:0050912) |
| 0.0 | 0.3 | GO:0098582 | innate vocalization behavior(GO:0098582) |
| 0.0 | 0.5 | GO:0051531 | NFAT protein import into nucleus(GO:0051531) |
| 0.0 | 1.3 | GO:0021952 | central nervous system projection neuron axonogenesis(GO:0021952) |
| 0.0 | 0.3 | GO:0097240 | meiotic telomere tethering at nuclear periphery(GO:0044821) meiotic attachment of telomere to nuclear envelope(GO:0070197) chromosome attachment to the nuclear envelope(GO:0097240) |
| 0.0 | 0.8 | GO:0051131 | chaperone-mediated protein complex assembly(GO:0051131) |
| 0.0 | 1.7 | GO:0005978 | glycogen biosynthetic process(GO:0005978) glucan biosynthetic process(GO:0009250) |
| 0.0 | 0.5 | GO:0030322 | stabilization of membrane potential(GO:0030322) |
| 0.0 | 0.4 | GO:0006782 | protoporphyrinogen IX biosynthetic process(GO:0006782) |
| 0.0 | 0.5 | GO:0090136 | epithelial cell-cell adhesion(GO:0090136) |
| 0.0 | 6.2 | GO:0050911 | detection of chemical stimulus involved in sensory perception of smell(GO:0050911) |
| 0.0 | 1.1 | GO:0007190 | activation of adenylate cyclase activity(GO:0007190) |
| 0.0 | 0.4 | GO:0030277 | maintenance of gastrointestinal epithelium(GO:0030277) |
| 0.0 | 0.3 | GO:1903874 | ferrous iron transport(GO:0015684) ferrous iron transmembrane transport(GO:1903874) |
| 0.0 | 0.5 | GO:2000637 | positive regulation of gene silencing by miRNA(GO:2000637) |
| 0.0 | 0.2 | GO:0006390 | transcription from mitochondrial promoter(GO:0006390) |
| 0.0 | 0.2 | GO:2001288 | positive regulation of caveolin-mediated endocytosis(GO:2001288) |
| 0.0 | 0.7 | GO:0035728 | response to hepatocyte growth factor(GO:0035728) |
| 0.0 | 0.3 | GO:0048311 | mitochondrion distribution(GO:0048311) |
| 0.0 | 0.1 | GO:0036060 | filtration diaphragm assembly(GO:0036058) slit diaphragm assembly(GO:0036060) negative regulation of retinal ganglion cell axon guidance(GO:0090260) |
| 0.0 | 0.9 | GO:0021762 | substantia nigra development(GO:0021762) |
| 0.0 | 1.2 | GO:0000381 | regulation of alternative mRNA splicing, via spliceosome(GO:0000381) |
| 0.0 | 0.5 | GO:0010842 | retina layer formation(GO:0010842) |
| 0.0 | 0.3 | GO:0090073 | positive regulation of protein homodimerization activity(GO:0090073) |
| 0.0 | 0.8 | GO:0006953 | acute-phase response(GO:0006953) |
| 0.0 | 0.6 | GO:0032467 | positive regulation of cytokinesis(GO:0032467) |
Gene overrepresentation in cellular component category:
| Log-likelihood per target | Total log-likelihood | Term | Description |
|---|---|---|---|
| 0.5 | 3.3 | GO:0070032 | synaptobrevin 2-SNAP-25-syntaxin-1a-complexin I complex(GO:0070032) |
| 0.2 | 1.6 | GO:0097513 | myosin II filament(GO:0097513) |
| 0.2 | 0.8 | GO:0071821 | FANCM-MHF complex(GO:0071821) |
| 0.2 | 4.8 | GO:0031045 | dense core granule(GO:0031045) |
| 0.2 | 3.6 | GO:0000177 | cytoplasmic exosome (RNase complex)(GO:0000177) |
| 0.1 | 1.0 | GO:0005826 | actomyosin contractile ring(GO:0005826) |
| 0.1 | 1.6 | GO:0033588 | Elongator holoenzyme complex(GO:0033588) |
| 0.1 | 0.5 | GO:0034684 | integrin alphav-beta5 complex(GO:0034684) |
| 0.1 | 1.9 | GO:0016013 | syntrophin complex(GO:0016013) |
| 0.1 | 0.5 | GO:0072536 | interleukin-23 receptor complex(GO:0072536) |
| 0.1 | 2.0 | GO:0032982 | myosin filament(GO:0032982) |
| 0.1 | 1.0 | GO:0097442 | CA3 pyramidal cell dendrite(GO:0097442) |
| 0.1 | 0.5 | GO:0005958 | DNA-dependent protein kinase-DNA ligase 4 complex(GO:0005958) |
| 0.1 | 0.7 | GO:1990635 | proximal dendrite(GO:1990635) |
| 0.1 | 3.1 | GO:0032839 | dendrite cytoplasm(GO:0032839) |
| 0.1 | 0.5 | GO:1990578 | perinuclear endoplasmic reticulum membrane(GO:1990578) |
| 0.0 | 1.0 | GO:0000974 | Prp19 complex(GO:0000974) |
| 0.0 | 0.9 | GO:0045179 | apical cortex(GO:0045179) |
| 0.0 | 0.9 | GO:0017146 | NMDA selective glutamate receptor complex(GO:0017146) |
| 0.0 | 0.8 | GO:0005832 | chaperonin-containing T-complex(GO:0005832) |
| 0.0 | 0.4 | GO:0031462 | Cul2-RING ubiquitin ligase complex(GO:0031462) |
| 0.0 | 0.4 | GO:0005687 | U4 snRNP(GO:0005687) |
| 0.0 | 0.3 | GO:0031464 | Cul4A-RING E3 ubiquitin ligase complex(GO:0031464) |
| 0.0 | 0.4 | GO:0070938 | contractile ring(GO:0070938) |
| 0.0 | 0.2 | GO:0098843 | postsynaptic endocytic zone(GO:0098843) |
| 0.0 | 0.8 | GO:0043194 | axon initial segment(GO:0043194) |
| 0.0 | 1.3 | GO:0043034 | costamere(GO:0043034) |
| 0.0 | 0.4 | GO:0005736 | DNA-directed RNA polymerase I complex(GO:0005736) |
| 0.0 | 1.3 | GO:0009295 | nucleoid(GO:0009295) mitochondrial nucleoid(GO:0042645) |
| 0.0 | 0.5 | GO:0031932 | TORC2 complex(GO:0031932) |
| 0.0 | 0.2 | GO:0019773 | proteasome core complex, alpha-subunit complex(GO:0019773) |
| 0.0 | 0.3 | GO:0071439 | clathrin complex(GO:0071439) |
| 0.0 | 1.2 | GO:0045095 | keratin filament(GO:0045095) |
| 0.0 | 0.7 | GO:0000159 | protein phosphatase type 2A complex(GO:0000159) |
| 0.0 | 0.1 | GO:0043541 | UDP-N-acetylglucosamine transferase complex(GO:0043541) |
| 0.0 | 0.6 | GO:0097228 | sperm principal piece(GO:0097228) |
| 0.0 | 0.3 | GO:0034993 | microtubule organizing center attachment site(GO:0034992) LINC complex(GO:0034993) |
Gene overrepresentation in molecular function category:
| Log-likelihood per target | Total log-likelihood | Term | Description |
|---|---|---|---|
| 0.8 | 4.1 | GO:0033695 | oxidoreductase activity, acting on CH or CH2 groups, quinone or similar compound as acceptor(GO:0033695) caffeine oxidase activity(GO:0034875) |
| 0.3 | 4.0 | GO:0019534 | toxin transporter activity(GO:0019534) |
| 0.2 | 2.0 | GO:0017018 | myosin phosphatase activity(GO:0017018) |
| 0.2 | 1.4 | GO:0048101 | calcium- and calmodulin-regulated 3',5'-cyclic-GMP phosphodiesterase activity(GO:0048101) |
| 0.2 | 2.0 | GO:0003956 | NAD(P)+-protein-arginine ADP-ribosyltransferase activity(GO:0003956) |
| 0.2 | 0.6 | GO:0070538 | oleic acid binding(GO:0070538) |
| 0.2 | 0.6 | GO:0010348 | lithium:proton antiporter activity(GO:0010348) |
| 0.2 | 1.6 | GO:0003873 | 6-phosphofructo-2-kinase activity(GO:0003873) |
| 0.1 | 1.7 | GO:0035251 | UDP-glucosyltransferase activity(GO:0035251) |
| 0.1 | 0.9 | GO:0005324 | long-chain fatty acid transporter activity(GO:0005324) |
| 0.1 | 5.6 | GO:0005184 | neuropeptide hormone activity(GO:0005184) |
| 0.1 | 2.0 | GO:0015501 | glutamate:sodium symporter activity(GO:0015501) |
| 0.1 | 0.8 | GO:0031708 | endothelin B receptor binding(GO:0031708) |
| 0.1 | 1.0 | GO:0004694 | eukaryotic translation initiation factor 2alpha kinase activity(GO:0004694) |
| 0.1 | 0.9 | GO:0004594 | pantothenate kinase activity(GO:0004594) |
| 0.1 | 2.2 | GO:0008320 | protein transmembrane transporter activity(GO:0008320) |
| 0.1 | 1.2 | GO:0008607 | phosphorylase kinase regulator activity(GO:0008607) |
| 0.1 | 0.8 | GO:0016403 | dimethylargininase activity(GO:0016403) |
| 0.1 | 2.5 | GO:0030957 | Tat protein binding(GO:0030957) |
| 0.1 | 0.5 | GO:0042020 | interleukin-23 binding(GO:0042019) interleukin-23 receptor activity(GO:0042020) |
| 0.1 | 0.3 | GO:0097677 | STAT family protein binding(GO:0097677) |
| 0.1 | 1.0 | GO:0050692 | DBD domain binding(GO:0050692) |
| 0.1 | 1.0 | GO:0005132 | type I interferon receptor binding(GO:0005132) |
| 0.1 | 1.0 | GO:0004630 | phospholipase D activity(GO:0004630) |
| 0.1 | 0.4 | GO:0016749 | 5-aminolevulinate synthase activity(GO:0003870) N-succinyltransferase activity(GO:0016749) |
| 0.1 | 1.9 | GO:0004745 | retinol dehydrogenase activity(GO:0004745) |
| 0.1 | 0.7 | GO:0031811 | G-protein coupled nucleotide receptor binding(GO:0031811) P2Y1 nucleotide receptor binding(GO:0031812) |
| 0.1 | 1.9 | GO:0050998 | nitric-oxide synthase binding(GO:0050998) |
| 0.1 | 1.6 | GO:0030898 | actin-dependent ATPase activity(GO:0030898) |
| 0.1 | 0.7 | GO:0002161 | aminoacyl-tRNA editing activity(GO:0002161) |
| 0.1 | 3.3 | GO:0005484 | SNAP receptor activity(GO:0005484) syntaxin-1 binding(GO:0017075) |
| 0.1 | 0.5 | GO:0004677 | DNA-dependent protein kinase activity(GO:0004677) |
| 0.0 | 0.4 | GO:0005332 | gamma-aminobutyric acid:sodium symporter activity(GO:0005332) |
| 0.0 | 0.9 | GO:0005344 | oxygen transporter activity(GO:0005344) |
| 0.0 | 0.7 | GO:0003796 | lysozyme activity(GO:0003796) |
| 0.0 | 0.3 | GO:0004046 | aminoacylase activity(GO:0004046) |
| 0.0 | 0.5 | GO:0046935 | 1-phosphatidylinositol-3-kinase regulator activity(GO:0046935) |
| 0.0 | 0.1 | GO:0051800 | phosphatidylinositol-3,4-bisphosphate 3-phosphatase activity(GO:0051800) |
| 0.0 | 0.9 | GO:0043395 | heparan sulfate proteoglycan binding(GO:0043395) |
| 0.0 | 0.5 | GO:0033592 | RNA strand annealing activity(GO:0033592) |
| 0.0 | 0.9 | GO:0042043 | neurexin family protein binding(GO:0042043) |
| 0.0 | 0.8 | GO:0000062 | fatty-acyl-CoA binding(GO:0000062) |
| 0.0 | 0.2 | GO:0030171 | voltage-gated proton channel activity(GO:0030171) |
| 0.0 | 0.3 | GO:0015093 | ferrous iron transmembrane transporter activity(GO:0015093) |
| 0.0 | 1.7 | GO:0005549 | odorant binding(GO:0005549) |
| 0.0 | 0.4 | GO:0019957 | C-C chemokine binding(GO:0019957) |
| 0.0 | 0.7 | GO:0070402 | NADPH binding(GO:0070402) |
| 0.0 | 1.2 | GO:0000175 | 3'-5'-exoribonuclease activity(GO:0000175) |
| 0.0 | 0.5 | GO:0042813 | Wnt-activated receptor activity(GO:0042813) |
| 0.0 | 0.5 | GO:0070330 | aromatase activity(GO:0070330) |
| 0.0 | 0.8 | GO:0005229 | intracellular calcium activated chloride channel activity(GO:0005229) |
| 0.0 | 0.5 | GO:0086080 | protein binding involved in heterotypic cell-cell adhesion(GO:0086080) |
| 0.0 | 0.3 | GO:0005347 | ATP transmembrane transporter activity(GO:0005347) ADP transmembrane transporter activity(GO:0015217) |
| 0.0 | 0.2 | GO:0016724 | ferroxidase activity(GO:0004322) oxidoreductase activity, oxidizing metal ions, oxygen as acceptor(GO:0016724) |
| 0.0 | 0.4 | GO:0001054 | RNA polymerase I activity(GO:0001054) |
| 0.0 | 0.6 | GO:0031005 | filamin binding(GO:0031005) |
| 0.0 | 0.3 | GO:0001591 | dopamine neurotransmitter receptor activity, coupled via Gi/Go(GO:0001591) |
| 0.0 | 0.5 | GO:0022841 | potassium ion leak channel activity(GO:0022841) |
| 0.0 | 1.4 | GO:0019894 | kinesin binding(GO:0019894) |
| 0.0 | 2.0 | GO:0004722 | protein serine/threonine phosphatase activity(GO:0004722) |
| 0.0 | 0.8 | GO:0044183 | protein binding involved in protein folding(GO:0044183) |
| 0.0 | 4.2 | GO:0004984 | olfactory receptor activity(GO:0004984) |
| 0.0 | 0.6 | GO:0071855 | neuropeptide receptor binding(GO:0071855) |
| 0.0 | 0.6 | GO:0001972 | retinoic acid binding(GO:0001972) |
| 0.0 | 0.2 | GO:0019841 | retinol binding(GO:0019841) |
| 0.0 | 0.5 | GO:0070300 | phosphatidic acid binding(GO:0070300) |
| 0.0 | 2.7 | GO:0005319 | lipid transporter activity(GO:0005319) |
| 0.0 | 0.3 | GO:0048156 | tau protein binding(GO:0048156) |
| 0.0 | 0.4 | GO:0008569 | ATP-dependent microtubule motor activity, minus-end-directed(GO:0008569) |
| 0.0 | 0.4 | GO:0017166 | vinculin binding(GO:0017166) |
| 0.0 | 0.9 | GO:0030507 | spectrin binding(GO:0030507) |
| 0.0 | 0.0 | GO:0004531 | deoxyribonuclease II activity(GO:0004531) |
| 0.0 | 0.2 | GO:0004971 | AMPA glutamate receptor activity(GO:0004971) |
| 0.0 | 0.4 | GO:0000993 | RNA polymerase II core binding(GO:0000993) |
| 0.0 | 0.3 | GO:0043495 | protein anchor(GO:0043495) |
Gene overrepresentation in curated gene sets: canonical pathways category:
| Log-likelihood per target | Total log-likelihood | Term | Description |
|---|---|---|---|
| 0.0 | 1.8 | PID CONE PATHWAY | Visual signal transduction: Cones |
| 0.0 | 1.0 | PID UPA UPAR PATHWAY | Urokinase-type plasminogen activator (uPA) and uPAR-mediated signaling |
| 0.0 | 3.3 | PID HNF3A PATHWAY | FOXA1 transcription factor network |
| 0.0 | 1.4 | SA PTEN PATHWAY | PTEN is a tumor suppressor that dephosphorylates the lipid messenger phosphatidylinositol triphosphate. |
| 0.0 | 0.4 | ST INTERFERON GAMMA PATHWAY | Interferon gamma pathway. |
| 0.0 | 0.5 | PID IL5 PATHWAY | IL5-mediated signaling events |
| 0.0 | 0.5 | PID INTEGRIN5 PATHWAY | Beta5 beta6 beta7 and beta8 integrin cell surface interactions |
| 0.0 | 0.7 | PID EPO PATHWAY | EPO signaling pathway |
| 0.0 | 1.0 | PID RXR VDR PATHWAY | RXR and RAR heterodimerization with other nuclear receptor |
| 0.0 | 0.7 | ST GA12 PATHWAY | G alpha 12 Pathway |
| 0.0 | 0.8 | PID ATR PATHWAY | ATR signaling pathway |
| 0.0 | 0.5 | PID IL23 PATHWAY | IL23-mediated signaling events |
| 0.0 | 1.0 | PID CD8 TCR DOWNSTREAM PATHWAY | Downstream signaling in naïve CD8+ T cells |
| 0.0 | 1.0 | PID LKB1 PATHWAY | LKB1 signaling events |
| 0.0 | 1.1 | PID MTOR 4PATHWAY | mTOR signaling pathway |
Gene overrepresentation in curated gene sets: REACTOME pathways category:
| Log-likelihood per target | Total log-likelihood | Term | Description |
|---|---|---|---|
| 0.2 | 4.1 | REACTOME XENOBIOTICS | Genes involved in Xenobiotics |
| 0.1 | 3.3 | REACTOME PROTEOLYTIC CLEAVAGE OF SNARE COMPLEX PROTEINS | Genes involved in Proteolytic cleavage of SNARE complex proteins |
| 0.1 | 4.0 | REACTOME BASIGIN INTERACTIONS | Genes involved in Basigin interactions |
| 0.1 | 3.9 | REACTOME STRIATED MUSCLE CONTRACTION | Genes involved in Striated Muscle Contraction |
| 0.0 | 0.9 | REACTOME VITAMIN B5 PANTOTHENATE METABOLISM | Genes involved in Vitamin B5 (pantothenate) metabolism |
| 0.0 | 1.6 | REACTOME SEMA4D INDUCED CELL MIGRATION AND GROWTH CONE COLLAPSE | Genes involved in Sema4D induced cell migration and growth-cone collapse |
| 0.0 | 1.0 | REACTOME REGULATION OF IFNA SIGNALING | Genes involved in Regulation of IFNA signaling |
| 0.0 | 0.7 | REACTOME MITOCHONDRIAL TRNA AMINOACYLATION | Genes involved in Mitochondrial tRNA aminoacylation |
| 0.0 | 1.2 | REACTOME SIGNALING BY CONSTITUTIVELY ACTIVE EGFR | Genes involved in Signaling by constitutively active EGFR |
| 0.0 | 0.6 | REACTOME SYNTHESIS OF BILE ACIDS AND BILE SALTS VIA 7ALPHA HYDROXYCHOLESTEROL | Genes involved in Synthesis of bile acids and bile salts via 7alpha-hydroxycholesterol |
| 0.0 | 0.5 | REACTOME NEGATIVE REGULATION OF THE PI3K AKT NETWORK | Genes involved in Negative regulation of the PI3K/AKT network |
| 0.0 | 0.6 | REACTOME GLUCURONIDATION | Genes involved in Glucuronidation |
| 0.0 | 1.2 | REACTOME CGMP EFFECTS | Genes involved in cGMP effects |
| 0.0 | 0.5 | REACTOME ENDOGENOUS STEROLS | Genes involved in Endogenous sterols |
| 0.0 | 0.4 | REACTOME NA CL DEPENDENT NEUROTRANSMITTER TRANSPORTERS | Genes involved in Na+/Cl- dependent neurotransmitter transporters |
| 0.0 | 2.0 | REACTOME AMINO ACID AND OLIGOPEPTIDE SLC TRANSPORTERS | Genes involved in Amino acid and oligopeptide SLC transporters |
| 0.0 | 3.3 | REACTOME GLUCOSE METABOLISM | Genes involved in Glucose metabolism |
| 0.0 | 0.5 | REACTOME TANDEM PORE DOMAIN POTASSIUM CHANNELS | Genes involved in Tandem pore domain potassium channels |
| 0.0 | 0.3 | REACTOME MRNA DECAY BY 3 TO 5 EXORIBONUCLEASE | Genes involved in mRNA Decay by 3' to 5' Exoribonuclease |
| 0.0 | 6.8 | REACTOME ANTIGEN PROCESSING UBIQUITINATION PROTEASOME DEGRADATION | Genes involved in Antigen processing: Ubiquitination & Proteasome degradation |
| 0.0 | 5.4 | REACTOME OLFACTORY SIGNALING PATHWAY | Genes involved in Olfactory Signaling Pathway |
| 0.0 | 0.7 | REACTOME POST CHAPERONIN TUBULIN FOLDING PATHWAY | Genes involved in Post-chaperonin tubulin folding pathway |
| 0.0 | 0.5 | REACTOME CD28 DEPENDENT PI3K AKT SIGNALING | Genes involved in CD28 dependent PI3K/Akt signaling |
| 0.0 | 0.4 | REACTOME REGULATION OF COMPLEMENT CASCADE | Genes involved in Regulation of Complement cascade |
| 0.0 | 0.5 | REACTOME MUSCLE CONTRACTION | Genes involved in Muscle contraction |
| 0.0 | 0.2 | REACTOME RECYCLING OF BILE ACIDS AND SALTS | Genes involved in Recycling of bile acids and salts |
| 0.0 | 0.6 | REACTOME SPHINGOLIPID DE NOVO BIOSYNTHESIS | Genes involved in Sphingolipid de novo biosynthesis |
| 0.0 | 0.4 | REACTOME METABOLISM OF PORPHYRINS | Genes involved in Metabolism of porphyrins |
| 0.0 | 0.4 | REACTOME RNA POL I TRANSCRIPTION TERMINATION | Genes involved in RNA Polymerase I Transcription Termination |