Project
Illumina Body Map 2 (GSE30611)
Navigation
Downloads
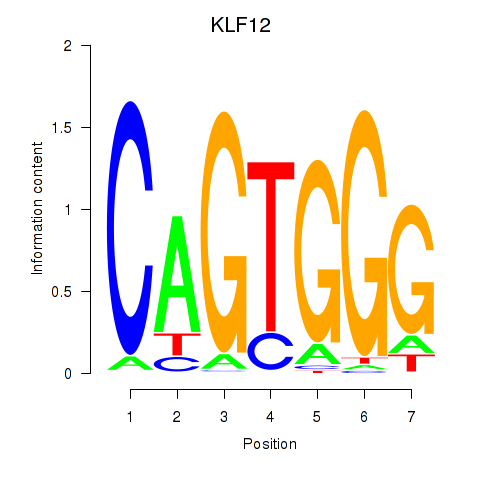
Results for KLF12
Z-value: 1.09
Motif logo
Transcription factors associated with KLF12
| Gene Symbol | Gene ID | Gene Info |
|---|---|---|
|
KLF12
|
ENSG00000118922.18 | Kruppel like factor 12 |
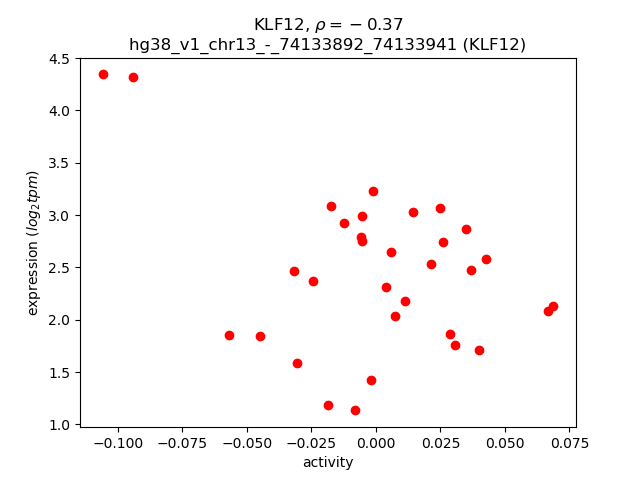
Activity-expression correlation:
| Gene | Promoter | Pearson corr. coef. | P-value | Plot |
|---|---|---|---|---|
| KLF12 | hg38_v1_chr13_-_74133892_74133941 | -0.37 | 3.6e-02 | Click! |
Activity profile of KLF12 motif
Sorted Z-values of KLF12 motif
| Promoter | Log-likelihood | Transcript | Gene | Gene Info |
|---|---|---|---|---|
| chr11_-_102530738 | 3.38 |
ENST00000260227.5
|
MMP7
|
matrix metallopeptidase 7 |
| chr17_+_1762012 | 3.19 |
ENST00000571360.5
|
SERPINF1
|
serpin family F member 1 |
| chr17_+_1762052 | 3.17 |
ENST00000254722.9
ENST00000576406.5 ENST00000571149.5 |
SERPINF1
|
serpin family F member 1 |
| chr6_+_31927683 | 3.05 |
ENST00000456570.5
|
ENSG00000244255.5
|
novel complement component 2 (C2) and complement factor B (CFB) protein |
| chr3_-_49685090 | 2.94 |
ENST00000448220.5
|
MST1
|
macrophage stimulating 1 |
| chr16_-_67944113 | 2.85 |
ENST00000264005.10
|
LCAT
|
lecithin-cholesterol acyltransferase |
| chr2_-_219571241 | 2.78 |
ENST00000373876.5
ENST00000603926.5 ENST00000373873.8 ENST00000289656.3 |
OBSL1
|
obscurin like cytoskeletal adaptor 1 |
| chr12_-_7088848 | 2.74 |
ENST00000649804.1
|
C1R
|
complement C1r |
| chr12_+_7060676 | 2.39 |
ENST00000617865.4
ENST00000402681.7 ENST00000360817.10 |
C1S
|
complement C1s |
| chr1_-_18902520 | 2.34 |
ENST00000538839.5
ENST00000290597.9 ENST00000375341.8 |
ALDH4A1
|
aldehyde dehydrogenase 4 family member A1 |
| chr6_+_31927703 | 2.32 |
ENST00000418949.6
ENST00000299367.10 ENST00000383177.7 ENST00000477310.1 |
C2
ENSG00000244255.5
|
complement C2 novel complement component 2 (C2) and complement factor B (CFB) protein |
| chr14_+_63204436 | 2.28 |
ENST00000316754.8
|
RHOJ
|
ras homolog family member J |
| chr2_+_233636445 | 2.16 |
ENST00000344644.9
|
UGT1A10
|
UDP glucuronosyltransferase family 1 member A10 |
| chr2_-_21044063 | 2.08 |
ENST00000233242.5
|
APOB
|
apolipoprotein B |
| chr10_-_50885656 | 2.07 |
ENST00000374001.6
ENST00000395489.6 ENST00000282641.6 ENST00000395495.5 ENST00000373995.7 ENST00000414883.1 |
A1CF
|
APOBEC1 complementation factor |
| chr12_-_95790755 | 2.07 |
ENST00000343702.9
ENST00000344911.8 |
NTN4
|
netrin 4 |
| chr11_+_117199363 | 1.98 |
ENST00000392951.9
ENST00000525531.5 ENST00000278968.10 |
TAGLN
|
transgelin |
| chr1_+_213987929 | 1.87 |
ENST00000498508.6
ENST00000366958.9 |
PROX1
|
prospero homeobox 1 |
| chr5_+_34656288 | 1.87 |
ENST00000265109.8
|
RAI14
|
retinoic acid induced 14 |
| chr2_+_233636502 | 1.82 |
ENST00000373445.1
|
UGT1A10
|
UDP glucuronosyltransferase family 1 member A10 |
| chr19_-_4338786 | 1.81 |
ENST00000601482.1
ENST00000600324.5 ENST00000594605.6 |
STAP2
|
signal transducing adaptor family member 2 |
| chr12_+_7061206 | 1.79 |
ENST00000423384.5
ENST00000413211.5 |
C1S
|
complement C1s |
| chr9_+_134641768 | 1.72 |
ENST00000371817.8
ENST00000618395.4 |
COL5A1
|
collagen type V alpha 1 chain |
| chr2_+_104854104 | 1.69 |
ENST00000361360.4
|
POU3F3
|
POU class 3 homeobox 3 |
| chr2_+_168802610 | 1.68 |
ENST00000397206.6
ENST00000317647.12 ENST00000397209.6 |
NOSTRIN
|
nitric oxide synthase trafficking |
| chr4_-_74099187 | 1.67 |
ENST00000508487.3
|
CXCL2
|
C-X-C motif chemokine ligand 2 |
| chr9_-_34637800 | 1.66 |
ENST00000680730.1
ENST00000477726.1 |
SIGMAR1
|
sigma non-opioid intracellular receptor 1 |
| chr5_+_34656446 | 1.62 |
ENST00000428746.6
|
RAI14
|
retinoic acid induced 14 |
| chr9_-_34637719 | 1.62 |
ENST00000378892.5
ENST00000680277.1 ENST00000277010.9 ENST00000679597.1 ENST00000680244.1 |
SIGMAR1
|
sigma non-opioid intracellular receptor 1 |
| chr10_-_89643870 | 1.61 |
ENST00000322191.10
ENST00000342512.3 |
PANK1
|
pantothenate kinase 1 |
| chr12_-_55727044 | 1.60 |
ENST00000548160.5
|
CD63
|
CD63 molecule |
| chr11_-_57322197 | 1.59 |
ENST00000532437.1
|
TNKS1BP1
|
tankyrase 1 binding protein 1 |
| chr16_+_46884675 | 1.51 |
ENST00000562132.5
ENST00000440783.2 |
GPT2
|
glutamic--pyruvic transaminase 2 |
| chr10_-_73641450 | 1.45 |
ENST00000359322.5
|
MYOZ1
|
myozenin 1 |
| chr11_-_16356538 | 1.44 |
ENST00000683767.1
|
SOX6
|
SRY-box transcription factor 6 |
| chr11_-_61580826 | 1.42 |
ENST00000540677.5
ENST00000542836.5 ENST00000542670.5 ENST00000535826.5 ENST00000545053.1 ENST00000539008.6 |
SYT7
|
synaptotagmin 7 |
| chr11_-_61581104 | 1.38 |
ENST00000263846.8
|
SYT7
|
synaptotagmin 7 |
| chr17_+_42853232 | 1.34 |
ENST00000617500.4
|
AOC3
|
amine oxidase copper containing 3 |
| chr7_-_27185223 | 1.34 |
ENST00000517402.1
ENST00000006015.4 |
HOXA11
|
homeobox A11 |
| chr5_+_34656424 | 1.31 |
ENST00000513974.5
ENST00000512629.5 |
RAI14
|
retinoic acid induced 14 |
| chr3_+_46883337 | 1.30 |
ENST00000313049.9
|
PTH1R
|
parathyroid hormone 1 receptor |
| chr1_+_213988501 | 1.26 |
ENST00000261454.8
ENST00000435016.2 |
PROX1
|
prospero homeobox 1 |
| chr14_+_104724221 | 1.24 |
ENST00000330877.7
|
ADSS1
|
adenylosuccinate synthase 1 |
| chr2_+_168802563 | 1.23 |
ENST00000445023.6
|
NOSTRIN
|
nitric oxide synthase trafficking |
| chr19_+_44777860 | 1.22 |
ENST00000341505.4
ENST00000647358.2 |
CBLC
|
Cbl proto-oncogene C |
| chr3_+_194136138 | 1.21 |
ENST00000232424.4
|
HES1
|
hes family bHLH transcription factor 1 |
| chr1_+_162366896 | 1.20 |
ENST00000420220.1
|
ENSG00000254706.3
|
novel protein |
| chr12_-_56488350 | 1.19 |
ENST00000623608.3
ENST00000610413.4 |
GLS2
|
glutaminase 2 |
| chr16_+_28878382 | 1.19 |
ENST00000357084.7
|
ATP2A1
|
ATPase sarcoplasmic/endoplasmic reticulum Ca2+ transporting 1 |
| chr17_-_42676980 | 1.18 |
ENST00000587627.1
ENST00000591022.6 ENST00000293349.10 |
PLEKHH3
|
pleckstrin homology, MyTH4 and FERM domain containing H3 |
| chr5_+_53480619 | 1.16 |
ENST00000396947.7
ENST00000256759.8 |
FST
|
follistatin |
| chr14_+_73950285 | 1.15 |
ENST00000334571.7
ENST00000554920.5 |
COQ6
|
coenzyme Q6, monooxygenase |
| chr5_+_132369908 | 1.15 |
ENST00000435065.6
|
SLC22A5
|
solute carrier family 22 member 5 |
| chr16_+_28878480 | 1.13 |
ENST00000395503.9
|
ATP2A1
|
ATPase sarcoplasmic/endoplasmic reticulum Ca2+ transporting 1 |
| chr12_-_55727080 | 1.12 |
ENST00000548898.5
ENST00000552067.5 |
CD63
|
CD63 molecule |
| chr7_+_37920602 | 1.12 |
ENST00000199448.9
ENST00000423717.1 |
EPDR1
|
ependymin related 1 |
| chr10_-_79445617 | 1.11 |
ENST00000372336.4
|
ZCCHC24
|
zinc finger CCHC-type containing 24 |
| chr11_-_72781858 | 1.11 |
ENST00000537947.5
|
STARD10
|
StAR related lipid transfer domain containing 10 |
| chr7_-_135748785 | 1.10 |
ENST00000338588.8
|
FAM180A
|
family with sequence similarity 180 member A |
| chr3_+_148791058 | 1.08 |
ENST00000491148.5
|
CPB1
|
carboxypeptidase B1 |
| chr12_-_56488153 | 1.08 |
ENST00000311966.9
|
GLS2
|
glutaminase 2 |
| chr17_-_38749806 | 1.07 |
ENST00000616199.4
|
PCGF2
|
polycomb group ring finger 2 |
| chr1_+_156114700 | 1.07 |
ENST00000677389.1
ENST00000368300.9 ENST00000368299.7 |
LMNA
|
lamin A/C |
| chr17_+_28744002 | 1.05 |
ENST00000618771.1
ENST00000262395.10 ENST00000422344.5 |
TRAF4
|
TNF receptor associated factor 4 |
| chr11_-_72781833 | 1.05 |
ENST00000535054.1
ENST00000545082.5 |
STARD10
|
StAR related lipid transfer domain containing 10 |
| chr18_+_22169580 | 1.05 |
ENST00000269216.10
|
GATA6
|
GATA binding protein 6 |
| chr9_-_127873462 | 1.04 |
ENST00000223836.10
|
AK1
|
adenylate kinase 1 |
| chr2_+_127423265 | 1.04 |
ENST00000402125.2
|
PROC
|
protein C, inactivator of coagulation factors Va and VIIIa |
| chr5_+_132369691 | 1.04 |
ENST00000245407.8
|
SLC22A5
|
solute carrier family 22 member 5 |
| chr1_+_155127866 | 1.03 |
ENST00000368406.2
ENST00000368407.8 |
EFNA1
|
ephrin A1 |
| chr11_-_32435529 | 1.01 |
ENST00000448076.9
ENST00000452863.10 |
WT1
|
WT1 transcription factor |
| chr10_-_50885619 | 1.01 |
ENST00000373997.8
|
A1CF
|
APOBEC1 complementation factor |
| chr11_-_34511710 | 1.00 |
ENST00000620316.4
ENST00000312319.6 |
ELF5
|
E74 like ETS transcription factor 5 |
| chr1_-_42740140 | 1.00 |
ENST00000372539.3
ENST00000296387.6 ENST00000539749.5 |
CLDN19
|
claudin 19 |
| chr8_+_96493803 | 1.00 |
ENST00000518385.5
ENST00000302190.9 |
SDC2
|
syndecan 2 |
| chr16_+_2026834 | 0.99 |
ENST00000424542.7
ENST00000432365.6 |
SLC9A3R2
|
SLC9A3 regulator 2 |
| chr1_+_153778178 | 0.98 |
ENST00000532853.5
|
SLC27A3
|
solute carrier family 27 member 3 |
| chr17_+_7307602 | 0.97 |
ENST00000573542.5
ENST00000336458.13 |
EIF5A
|
eukaryotic translation initiation factor 5A |
| chr19_+_6740878 | 0.95 |
ENST00000596673.1
|
TRIP10
|
thyroid hormone receptor interactor 10 |
| chr17_+_7307531 | 0.95 |
ENST00000576930.5
|
EIF5A
|
eukaryotic translation initiation factor 5A |
| chr12_+_53985783 | 0.94 |
ENST00000513209.1
|
ENSG00000273049.1
|
novel protein, readthrough between HOXC10 and HOXC5 |
| chr7_-_117873420 | 0.93 |
ENST00000160373.8
|
CTTNBP2
|
cortactin binding protein 2 |
| chr19_-_45768627 | 0.92 |
ENST00000560160.1
|
SIX5
|
SIX homeobox 5 |
| chr22_+_25111810 | 0.91 |
ENST00000637069.1
|
KIAA1671
|
KIAA1671 |
| chr17_+_42853265 | 0.91 |
ENST00000592999.5
|
AOC3
|
amine oxidase copper containing 3 |
| chr17_+_7307579 | 0.91 |
ENST00000572815.5
|
EIF5A
|
eukaryotic translation initiation factor 5A |
| chr4_+_77605807 | 0.90 |
ENST00000682537.1
|
CXCL13
|
C-X-C motif chemokine ligand 13 |
| chrX_-_100731504 | 0.89 |
ENST00000372989.5
ENST00000276141.10 |
SYTL4
|
synaptotagmin like 4 |
| chr20_+_36154630 | 0.89 |
ENST00000338074.7
ENST00000636016.2 ENST00000373945.5 |
EPB41L1
|
erythrocyte membrane protein band 4.1 like 1 |
| chr12_-_56488125 | 0.88 |
ENST00000461077.1
|
GLS2
|
glutaminase 2 |
| chr14_-_22926413 | 0.88 |
ENST00000556043.5
|
PRMT5
|
protein arginine methyltransferase 5 |
| chr4_+_71339014 | 0.86 |
ENST00000340595.4
|
SLC4A4
|
solute carrier family 4 member 4 |
| chr1_-_153628180 | 0.85 |
ENST00000339556.8
ENST00000440685.7 |
S100A13
|
S100 calcium binding protein A13 |
| chr2_-_219543537 | 0.85 |
ENST00000373891.2
|
CHPF
|
chondroitin polymerizing factor |
| chr11_+_66593194 | 0.85 |
ENST00000310190.8
|
CCS
|
copper chaperone for superoxide dismutase |
| chr9_+_128322816 | 0.84 |
ENST00000300452.8
ENST00000372875.3 |
COQ4
|
coenzyme Q4 |
| chr7_-_27662836 | 0.83 |
ENST00000265395.7
|
HIBADH
|
3-hydroxyisobutyrate dehydrogenase |
| chr16_-_70685791 | 0.83 |
ENST00000616026.4
|
MTSS2
|
MTSS I-BAR domain containing 2 |
| chr1_+_226548747 | 0.81 |
ENST00000366788.8
ENST00000366789.5 |
STUM
|
stum, mechanosensory transduction mediator homolog |
| chr8_-_6563409 | 0.81 |
ENST00000325203.9
|
ANGPT2
|
angiopoietin 2 |
| chr9_+_97501622 | 0.80 |
ENST00000259365.9
|
TMOD1
|
tropomodulin 1 |
| chr22_+_31093358 | 0.80 |
ENST00000404574.5
|
SMTN
|
smoothelin |
| chr1_-_153613095 | 0.80 |
ENST00000368706.9
|
S100A16
|
S100 calcium binding protein A16 |
| chr22_-_23767876 | 0.80 |
ENST00000520222.1
ENST00000401675.7 ENST00000484558.3 |
CHCHD10
|
coiled-coil-helix-coiled-coil-helix domain containing 10 |
| chrX_+_23664251 | 0.79 |
ENST00000379349.5
|
PRDX4
|
peroxiredoxin 4 |
| chr16_+_28863946 | 0.78 |
ENST00000395532.8
|
SH2B1
|
SH2B adaptor protein 1 |
| chr2_-_109614143 | 0.78 |
ENST00000356688.8
|
SEPTIN10
|
septin 10 |
| chr19_-_45769204 | 0.77 |
ENST00000317578.7
|
SIX5
|
SIX homeobox 5 |
| chr6_-_43053832 | 0.76 |
ENST00000265348.9
ENST00000674134.1 ENST00000674100.1 |
CUL7
|
cullin 7 |
| chr11_-_32435360 | 0.75 |
ENST00000639563.3
|
WT1
|
WT1 transcription factor |
| chr2_-_219543793 | 0.75 |
ENST00000243776.11
|
CHPF
|
chondroitin polymerizing factor |
| chrX_-_130165825 | 0.74 |
ENST00000675240.1
ENST00000319908.8 ENST00000674546.1 ENST00000287295.8 |
AIFM1
|
apoptosis inducing factor mitochondria associated 1 |
| chr19_+_10701431 | 0.74 |
ENST00000250237.10
ENST00000592254.1 |
QTRT1
|
queuine tRNA-ribosyltransferase catalytic subunit 1 |
| chr8_-_6563238 | 0.74 |
ENST00000629816.3
ENST00000523120.2 |
ANGPT2
|
angiopoietin 2 |
| chrX_-_130165699 | 0.73 |
ENST00000676328.1
ENST00000675857.1 ENST00000675427.1 ENST00000675092.1 |
AIFM1
|
apoptosis inducing factor mitochondria associated 1 |
| chrX_-_130165873 | 0.73 |
ENST00000676229.1
|
AIFM1
|
apoptosis inducing factor mitochondria associated 1 |
| chr3_-_190120881 | 0.72 |
ENST00000319332.10
|
P3H2
|
prolyl 3-hydroxylase 2 |
| chr3_+_49021071 | 0.72 |
ENST00000395458.6
|
NDUFAF3
|
NADH:ubiquinone oxidoreductase complex assembly factor 3 |
| chr11_+_66593171 | 0.71 |
ENST00000533244.6
|
CCS
|
copper chaperone for superoxide dismutase |
| chr14_+_73950252 | 0.71 |
ENST00000629426.2
|
COQ6
|
coenzyme Q6, monooxygenase |
| chr7_+_43926419 | 0.71 |
ENST00000222402.8
ENST00000446008.5 |
UBE2D4
|
ubiquitin conjugating enzyme E2 D4 (putative) |
| chr16_-_19886133 | 0.71 |
ENST00000568214.1
ENST00000569479.5 |
GPRC5B
|
G protein-coupled receptor class C group 5 member B |
| chr9_-_128322407 | 0.70 |
ENST00000372890.6
|
TRUB2
|
TruB pseudouridine synthase family member 2 |
| chr6_+_33200820 | 0.70 |
ENST00000374675.7
|
SLC39A7
|
solute carrier family 39 member 7 |
| chr17_-_7294592 | 0.69 |
ENST00000007699.10
|
YBX2
|
Y-box binding protein 2 |
| chr12_-_120469571 | 0.69 |
ENST00000550458.1
|
SRSF9
|
serine and arginine rich splicing factor 9 |
| chr8_+_22165358 | 0.69 |
ENST00000306349.13
ENST00000306385.10 |
BMP1
|
bone morphogenetic protein 1 |
| chr2_+_178194460 | 0.69 |
ENST00000392505.6
ENST00000359685.7 ENST00000357080.8 ENST00000190611.9 ENST00000409045.7 |
OSBPL6
|
oxysterol binding protein like 6 |
| chr1_-_201112420 | 0.69 |
ENST00000362061.4
ENST00000681874.1 |
CACNA1S
|
calcium voltage-gated channel subunit alpha1 S |
| chr9_+_34652167 | 0.68 |
ENST00000441545.7
ENST00000553620.5 |
IL11RA
|
interleukin 11 receptor subunit alpha |
| chr1_+_56645299 | 0.68 |
ENST00000371244.9
ENST00000610361.1 |
PRKAA2
|
protein kinase AMP-activated catalytic subunit alpha 2 |
| chr12_+_49972837 | 0.68 |
ENST00000618286.1
ENST00000315520.10 |
AQP6
|
aquaporin 6 |
| chrX_-_135022473 | 0.68 |
ENST00000391440.3
|
RTL8B
|
retrotransposon Gag like 8B |
| chr5_+_129904458 | 0.68 |
ENST00000305031.5
|
CHSY3
|
chondroitin sulfate synthase 3 |
| chr22_-_31346317 | 0.67 |
ENST00000266269.10
|
PATZ1
|
POZ/BTB and AT hook containing zinc finger 1 |
| chr15_+_34102037 | 0.67 |
ENST00000397766.4
|
PGBD4
|
piggyBac transposable element derived 4 |
| chrX_-_85379659 | 0.66 |
ENST00000262753.9
|
POF1B
|
POF1B actin binding protein |
| chr12_+_118136086 | 0.66 |
ENST00000261313.3
|
PEBP1
|
phosphatidylethanolamine binding protein 1 |
| chr5_-_140043069 | 0.65 |
ENST00000289409.8
ENST00000358522.7 ENST00000289422.11 ENST00000541337.5 ENST00000361474.6 |
NRG2
|
neuregulin 2 |
| chr11_-_57322300 | 0.65 |
ENST00000527207.1
|
TNKS1BP1
|
tankyrase 1 binding protein 1 |
| chr5_+_138465472 | 0.65 |
ENST00000239938.5
|
EGR1
|
early growth response 1 |
| chr2_-_21043941 | 0.65 |
ENST00000399256.4
|
APOB
|
apolipoprotein B |
| chr15_-_89496574 | 0.65 |
ENST00000268122.9
|
RHCG
|
Rh family C glycoprotein |
| chr12_+_80937815 | 0.64 |
ENST00000549175.1
|
ACSS3
|
acyl-CoA synthetase short chain family member 3 |
| chr1_+_15756659 | 0.64 |
ENST00000375771.5
|
FBLIM1
|
filamin binding LIM protein 1 |
| chr12_+_80707625 | 0.64 |
ENST00000228641.4
|
MYF6
|
myogenic factor 6 |
| chr1_+_153628393 | 0.64 |
ENST00000368696.3
ENST00000292169.6 ENST00000436839.1 |
S100A1
|
S100 calcium binding protein A1 |
| chr4_+_127782270 | 0.64 |
ENST00000508549.5
ENST00000296464.9 |
HSPA4L
|
heat shock protein family A (Hsp70) member 4 like |
| chr19_-_5785619 | 0.64 |
ENST00000586012.1
ENST00000590343.1 |
ENSG00000267157.1
DUS3L
|
novel protein dihydrouridine synthase 3 like |
| chr1_-_159862648 | 0.63 |
ENST00000368100.1
|
VSIG8
|
V-set and immunoglobulin domain containing 8 |
| chr1_-_201112451 | 0.63 |
ENST00000367338.7
|
CACNA1S
|
calcium voltage-gated channel subunit alpha1 S |
| chr5_-_124744513 | 0.63 |
ENST00000504926.5
|
ZNF608
|
zinc finger protein 608 |
| chr12_+_101568350 | 0.62 |
ENST00000550514.5
|
MYBPC1
|
myosin binding protein C1 |
| chr4_+_3441960 | 0.62 |
ENST00000382774.8
ENST00000511533.1 |
HGFAC
|
HGF activator |
| chr2_+_9961165 | 0.61 |
ENST00000405379.6
|
GRHL1
|
grainyhead like transcription factor 1 |
| chr9_+_121743561 | 0.61 |
ENST00000648693.1
|
DAB2IP
|
DAB2 interacting protein |
| chr2_-_96843992 | 0.61 |
ENST00000418232.5
|
ANKRD23
|
ankyrin repeat domain 23 |
| chr1_-_111989608 | 0.61 |
ENST00000302127.5
|
KCND3
|
potassium voltage-gated channel subfamily D member 3 |
| chr2_-_38377256 | 0.61 |
ENST00000443098.5
ENST00000449130.5 ENST00000651368.1 ENST00000378954.9 ENST00000419554.6 ENST00000451483.1 ENST00000406122.5 |
ATL2
|
atlastin GTPase 2 |
| chrX_-_130165664 | 0.61 |
ENST00000535724.6
ENST00000346424.6 ENST00000676436.1 |
AIFM1
|
apoptosis inducing factor mitochondria associated 1 |
| chr17_-_8630749 | 0.61 |
ENST00000379980.8
ENST00000269243.8 |
MYH10
|
myosin heavy chain 10 |
| chr20_-_17659917 | 0.60 |
ENST00000610403.4
|
RRBP1
|
ribosome binding protein 1 |
| chr16_+_28863812 | 0.60 |
ENST00000684370.1
|
SH2B1
|
SH2B adaptor protein 1 |
| chr2_-_96844012 | 0.60 |
ENST00000318357.9
ENST00000331001.2 |
ANKRD23
|
ankyrin repeat domain 23 |
| chr12_+_27524151 | 0.60 |
ENST00000545334.5
ENST00000540114.5 ENST00000537927.5 ENST00000228425.11 ENST00000318304.12 ENST00000535047.5 ENST00000542629.5 |
PPFIBP1
|
PPFIA binding protein 1 |
| chr7_+_66087761 | 0.60 |
ENST00000450043.2
|
ENSG00000249319.2
|
novel protein |
| chr11_-_119340816 | 0.60 |
ENST00000528368.3
|
C1QTNF5
|
C1q and TNF related 5 |
| chr8_+_22165140 | 0.60 |
ENST00000397814.7
ENST00000354870.5 |
BMP1
|
bone morphogenetic protein 1 |
| chr6_+_52671080 | 0.59 |
ENST00000211314.5
|
TMEM14A
|
transmembrane protein 14A |
| chr12_+_72272360 | 0.59 |
ENST00000547300.2
ENST00000261180.10 |
TRHDE
|
thyrotropin releasing hormone degrading enzyme |
| chr17_+_4950147 | 0.58 |
ENST00000522301.5
|
ENO3
|
enolase 3 |
| chr20_-_35699298 | 0.58 |
ENST00000306750.3
|
NFS1
|
NFS1 cysteine desulfurase |
| chr1_+_6785518 | 0.58 |
ENST00000467404.6
|
CAMTA1
|
calmodulin binding transcription activator 1 |
| chr8_+_116938180 | 0.58 |
ENST00000378279.4
|
AARD
|
alanine and arginine rich domain containing protein |
| chr14_+_73950489 | 0.58 |
ENST00000554320.1
|
COQ6
|
coenzyme Q6, monooxygenase |
| chr14_+_24368020 | 0.58 |
ENST00000554050.5
ENST00000554903.1 ENST00000250373.9 ENST00000554779.1 ENST00000553708.5 |
NFATC4
|
nuclear factor of activated T cells 4 |
| chr6_+_33200860 | 0.57 |
ENST00000374677.8
|
SLC39A7
|
solute carrier family 39 member 7 |
| chr17_-_82840010 | 0.57 |
ENST00000269394.4
ENST00000572562.1 |
ZNF750
|
zinc finger protein 750 |
| chr1_-_22143088 | 0.57 |
ENST00000290167.11
|
WNT4
|
Wnt family member 4 |
| chr10_+_49942048 | 0.57 |
ENST00000651259.3
ENST00000652716.1 |
TIMM23B
|
translocase of inner mitochondrial membrane 23 homolog B |
| chr10_-_75401746 | 0.56 |
ENST00000372524.5
|
ZNF503
|
zinc finger protein 503 |
| chr9_-_34589701 | 0.56 |
ENST00000351266.8
|
CNTFR
|
ciliary neurotrophic factor receptor |
| chr12_+_120302316 | 0.56 |
ENST00000536460.1
ENST00000202967.4 |
SIRT4
|
sirtuin 4 |
| chr17_-_28357455 | 0.56 |
ENST00000618887.2
ENST00000540200.6 |
POLDIP2
|
DNA polymerase delta interacting protein 2 |
| chr10_+_23694707 | 0.55 |
ENST00000376462.5
|
KIAA1217
|
KIAA1217 |
| chr22_-_43343283 | 0.55 |
ENST00000615096.4
ENST00000290460.7 ENST00000360835.9 |
SCUBE1
|
signal peptide, CUB domain and EGF like domain containing 1 |
| chrX_-_84188148 | 0.55 |
ENST00000262752.5
|
RPS6KA6
|
ribosomal protein S6 kinase A6 |
| chr9_-_34590123 | 0.55 |
ENST00000417345.2
ENST00000610543.4 |
CNTFR
|
ciliary neurotrophic factor receptor |
| chr17_+_7404851 | 0.55 |
ENST00000575301.5
|
NLGN2
|
neuroligin 2 |
| chr6_+_19837362 | 0.54 |
ENST00000378700.8
|
ID4
|
inhibitor of DNA binding 4, HLH protein |
| chr1_+_109249530 | 0.54 |
ENST00000271332.4
|
CELSR2
|
cadherin EGF LAG seven-pass G-type receptor 2 |
| chr14_+_85530127 | 0.54 |
ENST00000330753.6
|
FLRT2
|
fibronectin leucine rich transmembrane protein 2 |
| chr21_-_43060546 | 0.54 |
ENST00000430013.1
|
CBS
|
cystathionine beta-synthase |
| chr9_-_34589716 | 0.54 |
ENST00000378980.8
|
CNTFR
|
ciliary neurotrophic factor receptor |
| chr4_+_102501298 | 0.54 |
ENST00000394820.8
ENST00000226574.9 ENST00000511926.5 ENST00000507079.5 |
NFKB1
|
nuclear factor kappa B subunit 1 |
| chr20_-_35699317 | 0.54 |
ENST00000397425.5
ENST00000374092.9 ENST00000541387.5 |
NFS1
|
NFS1 cysteine desulfurase |
| chr16_-_31508370 | 0.53 |
ENST00000430477.6
ENST00000567994.5 ENST00000570164.5 ENST00000327237.7 |
RUSF1
|
RUS family member 1 |
| chrX_+_153781033 | 0.53 |
ENST00000370104.5
ENST00000370108.7 ENST00000370101.8 ENST00000430541.5 ENST00000370100.5 |
SRPK3
|
SRSF protein kinase 3 |
| chr15_-_34101807 | 0.53 |
ENST00000527822.5
ENST00000528949.1 ENST00000256545.9 |
EMC7
|
ER membrane protein complex subunit 7 |
| chr6_+_133241318 | 0.53 |
ENST00000430974.6
ENST00000355286.12 ENST00000355167.8 ENST00000431403.3 |
EYA4
|
EYA transcriptional coactivator and phosphatase 4 |
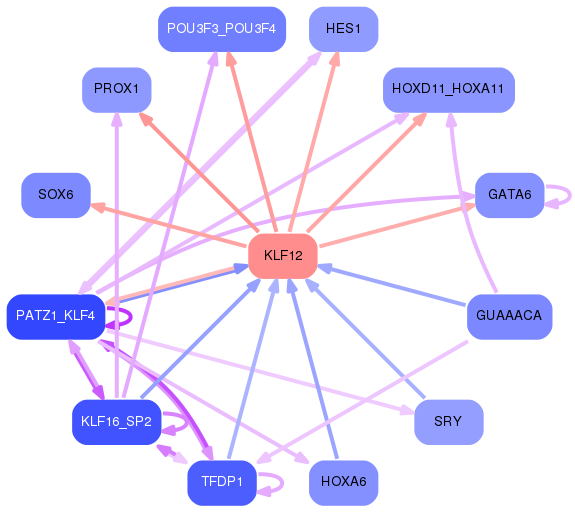
Network of associatons between targets according to the STRING database.

First level regulatory network of KLF12
Gene Ontology Analysis
Gene overrepresentation in biological process category:
| Log-likelihood per target | Total log-likelihood | Term | Description |
|---|---|---|---|
| 1.0 | 3.1 | GO:0002194 | hepatocyte cell migration(GO:0002194) otic placode formation(GO:0043049) branching involved in pancreas morphogenesis(GO:0061114) acinar cell differentiation(GO:0090425) positive regulation of forebrain neuron differentiation(GO:2000979) |
| 0.9 | 2.8 | GO:1990927 | calcium ion regulated lysosome exocytosis(GO:1990927) |
| 0.8 | 2.3 | GO:0031448 | regulation of fast-twitch skeletal muscle fiber contraction(GO:0031446) positive regulation of fast-twitch skeletal muscle fiber contraction(GO:0031448) |
| 0.7 | 2.2 | GO:0060730 | regulation of intestinal epithelial structure maintenance(GO:0060730) |
| 0.7 | 6.4 | GO:0071279 | cellular response to cobalt ion(GO:0071279) |
| 0.7 | 2.8 | GO:1904045 | cellular response to aldosterone(GO:1904045) |
| 0.7 | 2.0 | GO:0050928 | negative regulation of positive chemotaxis(GO:0050928) |
| 0.6 | 2.3 | GO:0010133 | proline catabolic process to glutamate(GO:0010133) |
| 0.6 | 2.9 | GO:0090107 | regulation of high-density lipoprotein particle assembly(GO:0090107) |
| 0.5 | 2.4 | GO:0072301 | regulation of metanephric glomerular mesangial cell proliferation(GO:0072301) |
| 0.4 | 3.1 | GO:0006543 | glutamine catabolic process(GO:0006543) |
| 0.4 | 4.0 | GO:0051552 | flavone metabolic process(GO:0051552) |
| 0.4 | 1.7 | GO:1903225 | negative regulation of endodermal cell differentiation(GO:1903225) |
| 0.4 | 1.7 | GO:0072023 | thick ascending limb development(GO:0072023) metanephric thick ascending limb development(GO:0072233) |
| 0.4 | 1.2 | GO:2000974 | auditory receptor cell fate determination(GO:0042668) negative regulation of auditory receptor cell differentiation(GO:0045608) negative regulation of pro-B cell differentiation(GO:2000974) |
| 0.4 | 2.3 | GO:1902283 | negative regulation of primary amine oxidase activity(GO:1902283) |
| 0.4 | 3.3 | GO:0045905 | translational frameshifting(GO:0006452) positive regulation of translational termination(GO:0045905) |
| 0.3 | 0.9 | GO:0035565 | regulation of pronephros size(GO:0035565) |
| 0.3 | 2.7 | GO:0006642 | triglyceride mobilization(GO:0006642) |
| 0.3 | 1.5 | GO:0042851 | L-alanine metabolic process(GO:0042851) L-alanine catabolic process(GO:0042853) |
| 0.3 | 0.9 | GO:2001027 | negative regulation of endothelial cell chemotaxis(GO:2001027) |
| 0.3 | 2.1 | GO:0035426 | extracellular matrix-cell signaling(GO:0035426) |
| 0.3 | 0.6 | GO:2000297 | negative regulation of synapse maturation(GO:2000297) |
| 0.3 | 1.1 | GO:0018283 | metal incorporation into metallo-sulfur cluster(GO:0018282) iron incorporation into metallo-sulfur cluster(GO:0018283) |
| 0.3 | 1.0 | GO:0032912 | negative regulation of transforming growth factor beta2 production(GO:0032912) |
| 0.3 | 1.6 | GO:0015680 | intracellular copper ion transport(GO:0015680) |
| 0.3 | 1.0 | GO:0044537 | regulation of circulating fibrinogen levels(GO:0044537) |
| 0.3 | 1.0 | GO:0014028 | notochord formation(GO:0014028) |
| 0.3 | 3.1 | GO:0016554 | cytidine to uridine editing(GO:0016554) |
| 0.2 | 3.7 | GO:2000680 | rubidium ion transport(GO:0035826) regulation of rubidium ion transport(GO:2000680) |
| 0.2 | 1.7 | GO:1902723 | negative regulation of skeletal muscle cell proliferation(GO:0014859) negative regulation of skeletal muscle satellite cell proliferation(GO:1902723) |
| 0.2 | 4.2 | GO:0001867 | complement activation, lectin pathway(GO:0001867) |
| 0.2 | 0.7 | GO:0009386 | translational attenuation(GO:0009386) |
| 0.2 | 2.6 | GO:0061299 | retina vasculature morphogenesis in camera-type eye(GO:0061299) |
| 0.2 | 0.6 | GO:0070634 | transepithelial ammonium transport(GO:0070634) |
| 0.2 | 1.4 | GO:0021778 | oligodendrocyte cell fate specification(GO:0021778) oligodendrocyte cell fate commitment(GO:0021779) glial cell fate specification(GO:0021780) |
| 0.2 | 0.8 | GO:2000255 | negative regulation of male germ cell proliferation(GO:2000255) |
| 0.2 | 0.6 | GO:2000224 | renal vesicle induction(GO:0072034) positive regulation of steroid hormone biosynthetic process(GO:0090031) regulation of testosterone biosynthetic process(GO:2000224) |
| 0.2 | 3.3 | GO:0044849 | estrous cycle(GO:0044849) |
| 0.2 | 1.1 | GO:0035105 | sterol regulatory element binding protein import into nucleus(GO:0035105) |
| 0.2 | 0.7 | GO:0035519 | protein K29-linked ubiquitination(GO:0035519) |
| 0.2 | 0.5 | GO:0003365 | establishment of cell polarity involved in ameboidal cell migration(GO:0003365) |
| 0.2 | 1.0 | GO:0008218 | bioluminescence(GO:0008218) |
| 0.2 | 3.0 | GO:0038003 | opioid receptor signaling pathway(GO:0038003) |
| 0.2 | 2.3 | GO:2000427 | positive regulation of apoptotic cell clearance(GO:2000427) |
| 0.2 | 0.2 | GO:0061346 | non-canonical Wnt signaling pathway involved in heart development(GO:0061341) planar cell polarity pathway involved in heart morphogenesis(GO:0061346) |
| 0.1 | 2.9 | GO:0045721 | negative regulation of gluconeogenesis(GO:0045721) |
| 0.1 | 0.4 | GO:0021763 | subthalamic nucleus development(GO:0021763) prolactin secreting cell differentiation(GO:0060127) superior vena cava morphogenesis(GO:0060578) |
| 0.1 | 3.3 | GO:0071688 | striated muscle myosin thick filament assembly(GO:0071688) |
| 0.1 | 2.0 | GO:0003360 | brainstem development(GO:0003360) |
| 0.1 | 0.6 | GO:1903216 | regulation of protein processing involved in protein targeting to mitochondrion(GO:1903216) negative regulation of protein processing involved in protein targeting to mitochondrion(GO:1903217) |
| 0.1 | 0.8 | GO:0006574 | valine catabolic process(GO:0006574) |
| 0.1 | 0.4 | GO:0060739 | mesenchymal-epithelial cell signaling involved in prostate gland development(GO:0060739) |
| 0.1 | 0.5 | GO:0060741 | prostate gland stromal morphogenesis(GO:0060741) |
| 0.1 | 0.8 | GO:2000984 | regulation of ATP citrate synthase activity(GO:2000983) negative regulation of ATP citrate synthase activity(GO:2000984) |
| 0.1 | 2.2 | GO:0032782 | bile acid secretion(GO:0032782) |
| 0.1 | 0.5 | GO:0032223 | negative regulation of synaptic transmission, cholinergic(GO:0032223) neurotransmitter receptor biosynthetic process(GO:0045212) |
| 0.1 | 2.5 | GO:0032926 | negative regulation of activin receptor signaling pathway(GO:0032926) |
| 0.1 | 1.1 | GO:0061343 | cell adhesion involved in heart morphogenesis(GO:0061343) |
| 0.1 | 1.0 | GO:0001712 | ectodermal cell fate commitment(GO:0001712) |
| 0.1 | 0.5 | GO:2000381 | negative regulation of mesoderm development(GO:2000381) |
| 0.1 | 0.9 | GO:0060161 | peptidyl-arginine methylation, to symmetrical-dimethyl arginine(GO:0019918) positive regulation of dopamine receptor signaling pathway(GO:0060161) |
| 0.1 | 0.3 | GO:1901804 | beta-glucoside metabolic process(GO:1901804) beta-glucoside catabolic process(GO:1901805) positive regulation of neuronal action potential(GO:1904457) |
| 0.1 | 0.4 | GO:0018277 | protein deamination(GO:0018277) |
| 0.1 | 3.0 | GO:0006744 | ubiquinone biosynthetic process(GO:0006744) quinone biosynthetic process(GO:1901663) |
| 0.1 | 0.4 | GO:0071931 | positive regulation of transcription involved in G1/S transition of mitotic cell cycle(GO:0071931) |
| 0.1 | 1.3 | GO:0071313 | cellular response to caffeine(GO:0071313) |
| 0.1 | 1.2 | GO:0060297 | regulation of sarcomere organization(GO:0060297) |
| 0.1 | 1.6 | GO:0007512 | adult heart development(GO:0007512) |
| 0.1 | 0.5 | GO:0009093 | cysteine catabolic process(GO:0009093) L-cysteine catabolic process(GO:0019448) L-cysteine metabolic process(GO:0046439) |
| 0.1 | 0.9 | GO:0051694 | pointed-end actin filament capping(GO:0051694) |
| 0.1 | 0.4 | GO:0070460 | thyroid-stimulating hormone secretion(GO:0070460) regulation of thyroid-stimulating hormone secretion(GO:2000612) |
| 0.1 | 0.3 | GO:0006463 | steroid hormone receptor complex assembly(GO:0006463) |
| 0.1 | 0.3 | GO:1904049 | negative regulation of spontaneous neurotransmitter secretion(GO:1904049) |
| 0.1 | 1.3 | GO:0007501 | mesodermal cell fate specification(GO:0007501) |
| 0.1 | 0.5 | GO:1904862 | inhibitory synapse assembly(GO:1904862) |
| 0.1 | 0.9 | GO:0050703 | interleukin-1 alpha secretion(GO:0050703) |
| 0.1 | 0.5 | GO:0010956 | negative regulation of calcidiol 1-monooxygenase activity(GO:0010956) |
| 0.1 | 0.2 | GO:0031204 | posttranslational protein targeting to membrane, translocation(GO:0031204) |
| 0.1 | 0.6 | GO:0036324 | vascular endothelial growth factor receptor-2 signaling pathway(GO:0036324) |
| 0.1 | 1.3 | GO:0016576 | histone dephosphorylation(GO:0016576) |
| 0.1 | 0.3 | GO:0071110 | protein biotinylation(GO:0009305) histone biotinylation(GO:0071110) |
| 0.1 | 0.7 | GO:0050428 | purine ribonucleoside bisphosphate biosynthetic process(GO:0034036) 3'-phosphoadenosine 5'-phosphosulfate biosynthetic process(GO:0050428) |
| 0.1 | 1.3 | GO:0021894 | cerebral cortex GABAergic interneuron development(GO:0021894) |
| 0.1 | 0.3 | GO:0016240 | autophagosome docking(GO:0016240) |
| 0.1 | 0.6 | GO:0002943 | tRNA dihydrouridine synthesis(GO:0002943) |
| 0.1 | 1.4 | GO:0090073 | positive regulation of protein homodimerization activity(GO:0090073) |
| 0.1 | 0.2 | GO:0048561 | establishment of organ orientation(GO:0048561) |
| 0.1 | 0.7 | GO:0070294 | renal sodium ion transport(GO:0003096) renal sodium ion absorption(GO:0070294) |
| 0.1 | 0.7 | GO:0006853 | carnitine shuttle(GO:0006853) |
| 0.1 | 0.8 | GO:0051715 | replicative cell aging(GO:0001302) cytolysis in other organism(GO:0051715) |
| 0.1 | 0.4 | GO:0048664 | neuron fate determination(GO:0048664) |
| 0.1 | 1.6 | GO:0034030 | coenzyme A biosynthetic process(GO:0015937) nucleoside bisphosphate biosynthetic process(GO:0033866) ribonucleoside bisphosphate biosynthetic process(GO:0034030) purine nucleoside bisphosphate biosynthetic process(GO:0034033) |
| 0.1 | 0.2 | GO:0072287 | distal tubule morphogenesis(GO:0072156) metanephric distal tubule morphogenesis(GO:0072287) |
| 0.1 | 1.6 | GO:0001502 | cartilage condensation(GO:0001502) |
| 0.1 | 0.6 | GO:0046951 | ketone body biosynthetic process(GO:0046951) |
| 0.1 | 0.6 | GO:0048743 | positive regulation of skeletal muscle fiber development(GO:0048743) |
| 0.1 | 0.7 | GO:0032057 | negative regulation of translational initiation in response to stress(GO:0032057) |
| 0.1 | 0.2 | GO:0016062 | adaptation of rhodopsin mediated signaling(GO:0016062) light adaption(GO:0036367) |
| 0.1 | 0.3 | GO:0006420 | arginyl-tRNA aminoacylation(GO:0006420) |
| 0.1 | 0.2 | GO:0090410 | malonate catabolic process(GO:0090410) |
| 0.0 | 0.3 | GO:0000432 | carbon catabolite regulation of transcription from RNA polymerase II promoter(GO:0000429) regulation of transcription from RNA polymerase II promoter by glucose(GO:0000430) positive regulation of transcription from RNA polymerase II promoter by glucose(GO:0000432) carbon catabolite activation of transcription from RNA polymerase II promoter(GO:0000436) |
| 0.0 | 1.2 | GO:0007175 | negative regulation of epidermal growth factor-activated receptor activity(GO:0007175) |
| 0.0 | 0.5 | GO:1904847 | cell chemotaxis to fibroblast growth factor(GO:0035766) endothelial cell chemotaxis to fibroblast growth factor(GO:0035768) regulation of cell chemotaxis to fibroblast growth factor(GO:1904847) regulation of endothelial cell chemotaxis to fibroblast growth factor(GO:2000544) |
| 0.0 | 0.6 | GO:0070315 | G1 to G0 transition involved in cell differentiation(GO:0070315) |
| 0.0 | 0.2 | GO:0016480 | negative regulation of transcription from RNA polymerase III promoter(GO:0016480) |
| 0.0 | 0.5 | GO:0021999 | neural plate anterior/posterior regionalization(GO:0021999) neural plate regionalization(GO:0060897) |
| 0.0 | 0.8 | GO:0003322 | pancreatic A cell development(GO:0003322) |
| 0.0 | 2.3 | GO:0030206 | chondroitin sulfate biosynthetic process(GO:0030206) |
| 0.0 | 2.1 | GO:0010800 | positive regulation of peptidyl-threonine phosphorylation(GO:0010800) |
| 0.0 | 0.5 | GO:0048251 | elastic fiber assembly(GO:0048251) |
| 0.0 | 1.3 | GO:0060732 | positive regulation of inositol phosphate biosynthetic process(GO:0060732) |
| 0.0 | 0.1 | GO:0045226 | extracellular polysaccharide biosynthetic process(GO:0045226) extracellular polysaccharide metabolic process(GO:0046379) |
| 0.0 | 0.6 | GO:1901387 | positive regulation of voltage-gated calcium channel activity(GO:1901387) |
| 0.0 | 0.5 | GO:0045048 | protein insertion into ER membrane(GO:0045048) |
| 0.0 | 0.3 | GO:0030174 | regulation of DNA-dependent DNA replication initiation(GO:0030174) |
| 0.0 | 0.2 | GO:2000210 | positive regulation of anoikis(GO:2000210) |
| 0.0 | 0.8 | GO:0030150 | protein import into mitochondrial matrix(GO:0030150) |
| 0.0 | 0.2 | GO:0070091 | glucagon secretion(GO:0070091) regulation of glucagon secretion(GO:0070092) |
| 0.0 | 1.0 | GO:0006646 | phosphatidylethanolamine biosynthetic process(GO:0006646) |
| 0.0 | 0.6 | GO:0033623 | regulation of integrin activation(GO:0033623) |
| 0.0 | 0.3 | GO:0048133 | germ-line stem cell division(GO:0042078) male germ-line stem cell asymmetric division(GO:0048133) germline stem cell asymmetric division(GO:0098728) |
| 0.0 | 2.9 | GO:0050999 | regulation of nitric-oxide synthase activity(GO:0050999) |
| 0.0 | 0.6 | GO:0032958 | inositol phosphate biosynthetic process(GO:0032958) |
| 0.0 | 0.4 | GO:2000582 | regulation of ATP-dependent microtubule motor activity, plus-end-directed(GO:2000580) positive regulation of ATP-dependent microtubule motor activity, plus-end-directed(GO:2000582) |
| 0.0 | 0.6 | GO:0002934 | desmosome organization(GO:0002934) |
| 0.0 | 0.4 | GO:0075525 | viral translational termination-reinitiation(GO:0075525) |
| 0.0 | 0.1 | GO:0039534 | negative regulation of MDA-5 signaling pathway(GO:0039534) |
| 0.0 | 0.3 | GO:2000346 | negative regulation of hepatocyte proliferation(GO:2000346) |
| 0.0 | 0.3 | GO:0097396 | response to interleukin-17(GO:0097396) cellular response to interleukin-17(GO:0097398) |
| 0.0 | 0.4 | GO:0097475 | motor neuron migration(GO:0097475) |
| 0.0 | 0.2 | GO:0030263 | apoptotic chromosome condensation(GO:0030263) |
| 0.0 | 0.7 | GO:0060907 | positive regulation of macrophage cytokine production(GO:0060907) |
| 0.0 | 0.1 | GO:0061086 | negative regulation of histone H3-K27 methylation(GO:0061086) |
| 0.0 | 0.1 | GO:0048496 | maintenance of organ identity(GO:0048496) |
| 0.0 | 0.4 | GO:0016255 | attachment of GPI anchor to protein(GO:0016255) |
| 0.0 | 0.2 | GO:0007197 | adenylate cyclase-inhibiting G-protein coupled acetylcholine receptor signaling pathway(GO:0007197) |
| 0.0 | 1.3 | GO:0071577 | zinc II ion transmembrane transport(GO:0071577) |
| 0.0 | 0.2 | GO:1903659 | regulation of complement-dependent cytotoxicity(GO:1903659) |
| 0.0 | 0.2 | GO:0098532 | histone H3-K27 trimethylation(GO:0098532) |
| 0.0 | 0.7 | GO:0019511 | peptidyl-proline hydroxylation(GO:0019511) |
| 0.0 | 0.2 | GO:0010637 | negative regulation of mitochondrial fusion(GO:0010637) |
| 0.0 | 0.3 | GO:0060371 | regulation of atrial cardiac muscle cell membrane depolarization(GO:0060371) |
| 0.0 | 0.1 | GO:0098971 | anterograde dendritic transport of neurotransmitter receptor complex(GO:0098971) |
| 0.0 | 1.0 | GO:0016338 | calcium-independent cell-cell adhesion via plasma membrane cell-adhesion molecules(GO:0016338) |
| 0.0 | 0.4 | GO:0010225 | response to UV-C(GO:0010225) |
| 0.0 | 0.2 | GO:0021902 | commitment of neuronal cell to specific neuron type in forebrain(GO:0021902) |
| 0.0 | 0.5 | GO:0010839 | negative regulation of keratinocyte proliferation(GO:0010839) |
| 0.0 | 0.6 | GO:0097623 | potassium ion export across plasma membrane(GO:0097623) |
| 0.0 | 0.3 | GO:0016198 | axon choice point recognition(GO:0016198) |
| 0.0 | 0.6 | GO:0001522 | pseudouridine synthesis(GO:0001522) |
| 0.0 | 0.7 | GO:0006833 | water transport(GO:0006833) |
| 0.0 | 0.1 | GO:0031161 | phosphatidylinositol catabolic process(GO:0031161) |
| 0.0 | 1.5 | GO:0030239 | myofibril assembly(GO:0030239) |
| 0.0 | 0.5 | GO:0072189 | ureter development(GO:0072189) |
| 0.0 | 0.3 | GO:0003417 | growth plate cartilage development(GO:0003417) |
| 0.0 | 1.3 | GO:0050775 | positive regulation of dendrite morphogenesis(GO:0050775) |
| 0.0 | 1.2 | GO:0003382 | epithelial cell morphogenesis(GO:0003382) |
| 0.0 | 0.2 | GO:0002191 | cap-dependent translational initiation(GO:0002191) |
| 0.0 | 0.6 | GO:0070584 | mitochondrion morphogenesis(GO:0070584) |
| 0.0 | 0.2 | GO:0042985 | negative regulation of amyloid precursor protein biosynthetic process(GO:0042985) |
| 0.0 | 0.2 | GO:0045919 | positive regulation of cytolysis(GO:0045919) |
| 0.0 | 0.1 | GO:1903385 | regulation of homophilic cell adhesion(GO:1903385) |
| 0.0 | 0.4 | GO:0006388 | tRNA splicing, via endonucleolytic cleavage and ligation(GO:0006388) |
| 0.0 | 0.4 | GO:0016254 | preassembly of GPI anchor in ER membrane(GO:0016254) |
| 0.0 | 0.0 | GO:1904640 | response to methionine(GO:1904640) |
| 0.0 | 1.3 | GO:0042531 | positive regulation of tyrosine phosphorylation of STAT protein(GO:0042531) |
| 0.0 | 0.1 | GO:0033512 | L-lysine catabolic process to acetyl-CoA via saccharopine(GO:0033512) |
| 0.0 | 0.6 | GO:0043403 | skeletal muscle tissue regeneration(GO:0043403) |
| 0.0 | 0.7 | GO:0051281 | positive regulation of release of sequestered calcium ion into cytosol(GO:0051281) |
| 0.0 | 0.4 | GO:0042118 | endothelial cell activation(GO:0042118) |
| 0.0 | 0.7 | GO:2001275 | positive regulation of glucose import in response to insulin stimulus(GO:2001275) |
| 0.0 | 0.1 | GO:0034128 | negative regulation of MyD88-independent toll-like receptor signaling pathway(GO:0034128) |
| 0.0 | 0.2 | GO:0002862 | negative regulation of inflammatory response to antigenic stimulus(GO:0002862) |
| 0.0 | 1.0 | GO:0015949 | nucleobase-containing small molecule interconversion(GO:0015949) |
| 0.0 | 1.2 | GO:0070206 | protein trimerization(GO:0070206) |
| 0.0 | 1.5 | GO:0000245 | spliceosomal complex assembly(GO:0000245) |
| 0.0 | 0.4 | GO:0071985 | multivesicular body sorting pathway(GO:0071985) |
| 0.0 | 0.3 | GO:0006488 | dolichol-linked oligosaccharide biosynthetic process(GO:0006488) |
| 0.0 | 0.8 | GO:0021952 | central nervous system projection neuron axonogenesis(GO:0021952) |
| 0.0 | 0.2 | GO:0060158 | phospholipase C-activating dopamine receptor signaling pathway(GO:0060158) |
| 0.0 | 0.7 | GO:0006699 | bile acid biosynthetic process(GO:0006699) |
| 0.0 | 0.4 | GO:0030322 | stabilization of membrane potential(GO:0030322) |
| 0.0 | 0.3 | GO:0046069 | cGMP catabolic process(GO:0046069) |
| 0.0 | 0.3 | GO:2000311 | regulation of alpha-amino-3-hydroxy-5-methyl-4-isoxazole propionate selective glutamate receptor activity(GO:2000311) |
| 0.0 | 0.2 | GO:0035414 | negative regulation of catenin import into nucleus(GO:0035414) |
| 0.0 | 0.2 | GO:0035372 | protein localization to microtubule(GO:0035372) |
| 0.0 | 0.1 | GO:0050957 | equilibrioception(GO:0050957) |
| 0.0 | 0.2 | GO:0015824 | proline transport(GO:0015824) |
| 0.0 | 0.1 | GO:0031914 | negative regulation of synaptic plasticity(GO:0031914) |
| 0.0 | 0.3 | GO:0045880 | positive regulation of smoothened signaling pathway(GO:0045880) |
| 0.0 | 0.1 | GO:0001731 | formation of translation preinitiation complex(GO:0001731) |
| 0.0 | 1.0 | GO:0010257 | NADH dehydrogenase complex assembly(GO:0010257) mitochondrial respiratory chain complex I assembly(GO:0032981) mitochondrial respiratory chain complex I biogenesis(GO:0097031) |
| 0.0 | 0.1 | GO:0002084 | protein depalmitoylation(GO:0002084) |
| 0.0 | 0.1 | GO:0014807 | regulation of somitogenesis(GO:0014807) |
| 0.0 | 0.4 | GO:0060716 | labyrinthine layer blood vessel development(GO:0060716) |
| 0.0 | 0.7 | GO:0006400 | tRNA modification(GO:0006400) |
| 0.0 | 0.4 | GO:0032201 | telomere maintenance via semi-conservative replication(GO:0032201) |
| 0.0 | 2.0 | GO:0048706 | embryonic skeletal system development(GO:0048706) |
Gene overrepresentation in cellular component category:
| Log-likelihood per target | Total log-likelihood | Term | Description |
|---|---|---|---|
| 0.8 | 3.1 | GO:0030895 | apolipoprotein B mRNA editing enzyme complex(GO:0030895) |
| 0.5 | 3.5 | GO:1990393 | 3M complex(GO:1990393) |
| 0.4 | 1.7 | GO:0005588 | collagen type V trimer(GO:0005588) |
| 0.3 | 2.7 | GO:0034363 | intermediate-density lipoprotein particle(GO:0034363) |
| 0.3 | 1.5 | GO:0097059 | CNTFR-CLCF1 complex(GO:0097059) |
| 0.3 | 6.4 | GO:0043203 | axon hillock(GO:0043203) |
| 0.2 | 3.7 | GO:0097487 | multivesicular body, internal vesicle(GO:0097487) |
| 0.2 | 2.8 | GO:0032009 | early phagosome(GO:0032009) |
| 0.2 | 3.3 | GO:0005642 | annulate lamellae(GO:0005642) |
| 0.2 | 1.4 | GO:0001739 | sex chromatin(GO:0001739) |
| 0.1 | 1.0 | GO:0097513 | myosin II filament(GO:0097513) |
| 0.1 | 2.2 | GO:0046581 | intercellular canaliculus(GO:0046581) |
| 0.1 | 0.6 | GO:1990032 | parallel fiber(GO:1990032) |
| 0.1 | 1.1 | GO:0005638 | lamin filament(GO:0005638) |
| 0.1 | 0.8 | GO:0035032 | phosphatidylinositol 3-kinase complex, class III(GO:0035032) |
| 0.1 | 0.9 | GO:0005851 | eukaryotic translation initiation factor 2B complex(GO:0005851) |
| 0.1 | 1.3 | GO:0036056 | filtration diaphragm(GO:0036056) slit diaphragm(GO:0036057) |
| 0.1 | 0.4 | GO:0043625 | delta DNA polymerase complex(GO:0043625) |
| 0.1 | 2.2 | GO:0030014 | CCR4-NOT complex(GO:0030014) |
| 0.1 | 2.9 | GO:0034364 | high-density lipoprotein particle(GO:0034364) |
| 0.1 | 0.4 | GO:0042765 | GPI-anchor transamidase complex(GO:0042765) |
| 0.1 | 0.7 | GO:0005652 | nuclear lamina(GO:0005652) |
| 0.1 | 0.8 | GO:0005744 | mitochondrial inner membrane presequence translocase complex(GO:0005744) |
| 0.1 | 3.3 | GO:0005640 | nuclear outer membrane(GO:0005640) |
| 0.1 | 1.6 | GO:0031095 | platelet dense tubular network membrane(GO:0031095) |
| 0.1 | 1.3 | GO:1990454 | L-type voltage-gated calcium channel complex(GO:1990454) |
| 0.1 | 0.9 | GO:0034709 | methylosome(GO:0034709) |
| 0.1 | 0.2 | GO:0060187 | cell pole(GO:0060187) |
| 0.0 | 0.6 | GO:0000015 | phosphopyruvate hydratase complex(GO:0000015) |
| 0.0 | 0.2 | GO:0000839 | Hrd1p ubiquitin ligase ERAD-L complex(GO:0000839) |
| 0.0 | 0.2 | GO:0002133 | polycystin complex(GO:0002133) |
| 0.0 | 1.5 | GO:0031143 | pseudopodium(GO:0031143) |
| 0.0 | 0.1 | GO:1990696 | stereocilia ankle link(GO:0002141) USH2 complex(GO:1990696) |
| 0.0 | 0.5 | GO:0072546 | ER membrane protein complex(GO:0072546) |
| 0.0 | 0.4 | GO:0071953 | elastic fiber(GO:0071953) |
| 0.0 | 0.3 | GO:0044326 | dendritic spine neck(GO:0044326) |
| 0.0 | 1.3 | GO:0005614 | interstitial matrix(GO:0005614) |
| 0.0 | 0.7 | GO:0005942 | phosphatidylinositol 3-kinase complex(GO:0005942) |
| 0.0 | 0.4 | GO:0000506 | glycosylphosphatidylinositol-N-acetylglucosaminyltransferase (GPI-GnT) complex(GO:0000506) |
| 0.0 | 3.5 | GO:0031526 | brush border membrane(GO:0031526) |
| 0.0 | 0.2 | GO:0032279 | asymmetric synapse(GO:0032279) |
| 0.0 | 3.9 | GO:0005758 | mitochondrial intermembrane space(GO:0005758) |
| 0.0 | 0.1 | GO:0060342 | photoreceptor inner segment membrane(GO:0060342) |
| 0.0 | 7.2 | GO:0001650 | fibrillar center(GO:0001650) |
| 0.0 | 0.3 | GO:0016602 | CCAAT-binding factor complex(GO:0016602) |
| 0.0 | 0.7 | GO:0031588 | nucleotide-activated protein kinase complex(GO:0031588) |
| 0.0 | 0.2 | GO:1990131 | Gtr1-Gtr2 GTPase complex(GO:1990131) |
| 0.0 | 0.7 | GO:0097038 | perinuclear endoplasmic reticulum(GO:0097038) |
| 0.0 | 0.1 | GO:0036117 | hyaluranon cable(GO:0036117) |
| 0.0 | 0.6 | GO:0060077 | inhibitory synapse(GO:0060077) |
| 0.0 | 0.9 | GO:0031092 | platelet alpha granule membrane(GO:0031092) |
| 0.0 | 1.6 | GO:0008180 | COP9 signalosome(GO:0008180) |
| 0.0 | 0.1 | GO:0000333 | telomerase catalytic core complex(GO:0000333) |
| 0.0 | 1.0 | GO:0030057 | desmosome(GO:0030057) |
| 0.0 | 0.6 | GO:0032591 | dendritic spine membrane(GO:0032591) |
| 0.0 | 0.5 | GO:0043083 | synaptic cleft(GO:0043083) |
| 0.0 | 0.2 | GO:0061574 | ASAP complex(GO:0061574) |
| 0.0 | 2.8 | GO:0005902 | microvillus(GO:0005902) |
| 0.0 | 0.5 | GO:0032982 | myosin filament(GO:0032982) |
| 0.0 | 3.2 | GO:0005604 | basement membrane(GO:0005604) |
| 0.0 | 1.0 | GO:0031941 | filamentous actin(GO:0031941) |
| 0.0 | 12.9 | GO:0005759 | mitochondrial matrix(GO:0005759) |
| 0.0 | 0.3 | GO:1990712 | HFE-transferrin receptor complex(GO:1990712) |
| 0.0 | 0.2 | GO:0060091 | kinocilium(GO:0060091) |
| 0.0 | 0.2 | GO:0071541 | eukaryotic translation initiation factor 3 complex, eIF3m(GO:0071541) |
| 0.0 | 0.4 | GO:0005689 | U12-type spliceosomal complex(GO:0005689) |
| 0.0 | 0.8 | GO:0005790 | smooth endoplasmic reticulum(GO:0005790) |
| 0.0 | 0.3 | GO:0032039 | integrator complex(GO:0032039) |
| 0.0 | 0.3 | GO:0071439 | clathrin complex(GO:0071439) |
| 0.0 | 0.3 | GO:0005751 | mitochondrial respiratory chain complex IV(GO:0005751) |
| 0.0 | 0.0 | GO:0097058 | CRLF-CLCF1 complex(GO:0097058) |
| 0.0 | 0.4 | GO:0005665 | DNA-directed RNA polymerase II, core complex(GO:0005665) |
| 0.0 | 0.2 | GO:0030008 | TRAPP complex(GO:0030008) |
| 0.0 | 0.4 | GO:0042629 | mast cell granule(GO:0042629) |
| 0.0 | 0.8 | GO:0031430 | M band(GO:0031430) |
| 0.0 | 0.1 | GO:0044294 | dendritic growth cone(GO:0044294) |
| 0.0 | 1.7 | GO:0005796 | Golgi lumen(GO:0005796) |
| 0.0 | 1.0 | GO:0030118 | clathrin coat(GO:0030118) |
| 0.0 | 0.1 | GO:1990769 | proximal neuron projection(GO:1990769) |
| 0.0 | 1.4 | GO:0005581 | collagen trimer(GO:0005581) |
| 0.0 | 3.4 | GO:0005578 | proteinaceous extracellular matrix(GO:0005578) |
Gene overrepresentation in molecular function category:
| Log-likelihood per target | Total log-likelihood | Term | Description |
|---|---|---|---|
| 0.5 | 1.5 | GO:0047635 | L-alanine:2-oxoglutarate aminotransferase activity(GO:0004021) alanine-oxo-acid transaminase activity(GO:0047635) |
| 0.5 | 2.9 | GO:0034186 | apolipoprotein A-I binding(GO:0034186) |
| 0.5 | 2.3 | GO:0050510 | N-acetylgalactosaminyl-proteoglycan 3-beta-glucuronosyltransferase activity(GO:0050510) |
| 0.5 | 2.3 | GO:0052593 | tryptamine:oxygen oxidoreductase (deaminating) activity(GO:0052593) aminoacetone:oxygen oxidoreductase(deaminating) activity(GO:0052594) aliphatic-amine oxidase activity(GO:0052595) phenethylamine:oxygen oxidoreductase (deaminating) activity(GO:0052596) |
| 0.4 | 3.1 | GO:0004359 | glutaminase activity(GO:0004359) |
| 0.4 | 1.1 | GO:0031071 | cysteine desulfurase activity(GO:0031071) |
| 0.3 | 2.4 | GO:0044729 | hemi-methylated DNA-binding(GO:0044729) |
| 0.3 | 2.7 | GO:0035473 | lipase binding(GO:0035473) |
| 0.3 | 1.6 | GO:0016532 | superoxide dismutase copper chaperone activity(GO:0016532) |
| 0.3 | 2.2 | GO:0015226 | amino-acid betaine transmembrane transporter activity(GO:0015199) carnitine transmembrane transporter activity(GO:0015226) |
| 0.3 | 1.3 | GO:0004991 | parathyroid hormone receptor activity(GO:0004991) |
| 0.2 | 3.1 | GO:0050692 | DBD domain binding(GO:0050692) |
| 0.2 | 1.6 | GO:0004594 | pantothenate kinase activity(GO:0004594) |
| 0.2 | 2.1 | GO:0043237 | laminin-1 binding(GO:0043237) |
| 0.2 | 0.7 | GO:0050405 | [hydroxymethylglutaryl-CoA reductase (NADPH)] kinase activity(GO:0047322) [acetyl-CoA carboxylase] kinase activity(GO:0050405) |
| 0.2 | 2.8 | GO:0016174 | NAD(P)H oxidase activity(GO:0016174) |
| 0.2 | 2.2 | GO:0071532 | ankyrin repeat binding(GO:0071532) |
| 0.2 | 1.5 | GO:0051373 | FATZ binding(GO:0051373) |
| 0.2 | 0.9 | GO:0048248 | CXCR3 chemokine receptor binding(GO:0048248) |
| 0.2 | 3.0 | GO:0004985 | opioid receptor activity(GO:0004985) |
| 0.2 | 0.8 | GO:0004616 | phosphogluconate dehydrogenase (decarboxylating) activity(GO:0004616) |
| 0.2 | 0.8 | GO:0005173 | stem cell factor receptor binding(GO:0005173) |
| 0.2 | 3.3 | GO:0017070 | U6 snRNA binding(GO:0017070) |
| 0.2 | 1.7 | GO:0004897 | ciliary neurotrophic factor receptor activity(GO:0004897) |
| 0.1 | 0.7 | GO:0019797 | procollagen-proline 3-dioxygenase activity(GO:0019797) |
| 0.1 | 0.6 | GO:0047708 | biotinidase activity(GO:0047708) |
| 0.1 | 0.4 | GO:0047012 | C-3 sterol dehydrogenase (C-4 sterol decarboxylase) activity(GO:0000252) sterol-4-alpha-carboxylate 3-dehydrogenase (decarboxylating) activity(GO:0047012) |
| 0.1 | 1.3 | GO:0070699 | type II activin receptor binding(GO:0070699) |
| 0.1 | 0.9 | GO:0035243 | protein-arginine omega-N symmetric methyltransferase activity(GO:0035243) histone methyltransferase activity (H4-R3 specific)(GO:0044020) |
| 0.1 | 0.5 | GO:0050421 | oxidoreductase activity, acting on other nitrogenous compounds as donors, cytochrome as acceptor(GO:0016662) nitrite reductase (NO-forming) activity(GO:0050421) carbon monoxide binding(GO:0070025) nitrite reductase activity(GO:0098809) |
| 0.1 | 0.7 | GO:0008479 | queuine tRNA-ribosyltransferase activity(GO:0008479) |
| 0.1 | 0.7 | GO:0008467 | [heparan sulfate]-glucosamine 3-sulfotransferase 1 activity(GO:0008467) |
| 0.1 | 0.5 | GO:0003990 | acetylcholinesterase activity(GO:0003990) |
| 0.1 | 0.4 | GO:0008665 | 2'-phosphotransferase activity(GO:0008665) |
| 0.1 | 0.6 | GO:0003987 | acetate-CoA ligase activity(GO:0003987) |
| 0.1 | 3.6 | GO:0051371 | muscle alpha-actinin binding(GO:0051371) |
| 0.1 | 0.8 | GO:0015450 | P-P-bond-hydrolysis-driven protein transmembrane transporter activity(GO:0015450) |
| 0.1 | 4.0 | GO:0001972 | retinoic acid binding(GO:0001972) |
| 0.1 | 0.8 | GO:0008379 | thioredoxin peroxidase activity(GO:0008379) |
| 0.1 | 2.4 | GO:0071949 | FAD binding(GO:0071949) |
| 0.1 | 0.6 | GO:0005250 | A-type (transient outward) potassium channel activity(GO:0005250) |
| 0.1 | 1.4 | GO:0031996 | thioesterase binding(GO:0031996) |
| 0.1 | 0.3 | GO:0004080 | biotin-[acetyl-CoA-carboxylase] ligase activity(GO:0004077) biotin-[methylcrotonoyl-CoA-carboxylase] ligase activity(GO:0004078) biotin-[methylmalonyl-CoA-carboxytransferase] ligase activity(GO:0004079) biotin-[propionyl-CoA-carboxylase (ATP-hydrolyzing)] ligase activity(GO:0004080) biotin-protein ligase activity(GO:0018271) |
| 0.1 | 2.2 | GO:0042043 | neurexin family protein binding(GO:0042043) |
| 0.1 | 0.6 | GO:0035662 | Toll-like receptor 4 binding(GO:0035662) |
| 0.1 | 2.3 | GO:0004029 | aldehyde dehydrogenase (NAD) activity(GO:0004029) |
| 0.1 | 0.6 | GO:0033857 | diphosphoinositol-pentakisphosphate kinase activity(GO:0033857) |
| 0.1 | 0.6 | GO:0017150 | tRNA dihydrouridine synthase activity(GO:0017150) |
| 0.1 | 0.3 | GO:0004348 | glucosylceramidase activity(GO:0004348) |
| 0.1 | 0.7 | GO:0045236 | CXCR chemokine receptor binding(GO:0045236) |
| 0.1 | 2.3 | GO:0005388 | calcium-transporting ATPase activity(GO:0005388) |
| 0.1 | 2.9 | GO:0043394 | proteoglycan binding(GO:0043394) |
| 0.1 | 0.4 | GO:0003923 | GPI-anchor transamidase activity(GO:0003923) |
| 0.1 | 0.8 | GO:0045499 | chemorepellent activity(GO:0045499) |
| 0.1 | 1.3 | GO:0031432 | titin binding(GO:0031432) |
| 0.1 | 0.4 | GO:0045545 | syndecan binding(GO:0045545) |
| 0.1 | 0.3 | GO:0032767 | copper-dependent protein binding(GO:0032767) |
| 0.1 | 0.3 | GO:0004814 | arginine-tRNA ligase activity(GO:0004814) |
| 0.1 | 0.2 | GO:0090409 | malonyl-CoA synthetase activity(GO:0090409) |
| 0.0 | 0.7 | GO:0046935 | 1-phosphatidylinositol-3-kinase regulator activity(GO:0046935) |
| 0.0 | 1.0 | GO:0004017 | adenylate kinase activity(GO:0004017) |
| 0.0 | 1.0 | GO:0031957 | very long-chain fatty acid-CoA ligase activity(GO:0031957) |
| 0.0 | 0.6 | GO:0004634 | phosphopyruvate hydratase activity(GO:0004634) |
| 0.0 | 0.5 | GO:0036312 | phosphatidylinositol 3-kinase regulatory subunit binding(GO:0036312) |
| 0.0 | 0.4 | GO:0000285 | 1-phosphatidylinositol-3-phosphate 5-kinase activity(GO:0000285) |
| 0.0 | 5.3 | GO:0030971 | receptor tyrosine kinase binding(GO:0030971) |
| 0.0 | 0.4 | GO:0004957 | prostaglandin E receptor activity(GO:0004957) |
| 0.0 | 0.4 | GO:0004996 | thyroid-stimulating hormone receptor activity(GO:0004996) |
| 0.0 | 2.1 | GO:0071837 | HMG box domain binding(GO:0071837) |
| 0.0 | 0.1 | GO:0071074 | eukaryotic initiation factor eIF2 binding(GO:0071074) |
| 0.0 | 6.8 | GO:0004867 | serine-type endopeptidase inhibitor activity(GO:0004867) |
| 0.0 | 1.0 | GO:0008195 | phosphatidate phosphatase activity(GO:0008195) |
| 0.0 | 0.7 | GO:0005000 | vasopressin receptor activity(GO:0005000) |
| 0.0 | 0.9 | GO:0050786 | RAGE receptor binding(GO:0050786) |
| 0.0 | 0.4 | GO:0017176 | phosphatidylinositol N-acetylglucosaminyltransferase activity(GO:0017176) |
| 0.0 | 1.1 | GO:0044548 | S100 protein binding(GO:0044548) |
| 0.0 | 0.3 | GO:0030368 | interleukin-17 receptor activity(GO:0030368) |
| 0.0 | 1.0 | GO:0030898 | actin-dependent ATPase activity(GO:0030898) |
| 0.0 | 0.7 | GO:0015250 | water channel activity(GO:0015250) |
| 0.0 | 1.3 | GO:0008331 | high voltage-gated calcium channel activity(GO:0008331) |
| 0.0 | 0.9 | GO:0005523 | tropomyosin binding(GO:0005523) |
| 0.0 | 0.6 | GO:0042975 | peroxisome proliferator activated receptor binding(GO:0042975) |
| 0.0 | 10.2 | GO:0004252 | serine-type endopeptidase activity(GO:0004252) |
| 0.0 | 0.2 | GO:0004045 | aminoacyl-tRNA hydrolase activity(GO:0004045) |
| 0.0 | 0.6 | GO:0031005 | filamin binding(GO:0031005) |
| 0.0 | 0.6 | GO:0009982 | pseudouridine synthase activity(GO:0009982) |
| 0.0 | 2.6 | GO:0005544 | calcium-dependent phospholipid binding(GO:0005544) |
| 0.0 | 1.3 | GO:0005385 | zinc ion transmembrane transporter activity(GO:0005385) |
| 0.0 | 0.2 | GO:0016907 | G-protein coupled acetylcholine receptor activity(GO:0016907) |
| 0.0 | 1.0 | GO:0004181 | metallocarboxypeptidase activity(GO:0004181) |
| 0.0 | 0.2 | GO:0008454 | alpha-1,3-mannosylglycoprotein 4-beta-N-acetylglucosaminyltransferase activity(GO:0008454) |
| 0.0 | 0.3 | GO:0004118 | cGMP-stimulated cyclic-nucleotide phosphodiesterase activity(GO:0004118) |
| 0.0 | 0.3 | GO:0005005 | transmembrane-ephrin receptor activity(GO:0005005) |
| 0.0 | 0.6 | GO:0070006 | metalloaminopeptidase activity(GO:0070006) |
| 0.0 | 0.3 | GO:0005025 | transforming growth factor beta receptor activity, type I(GO:0005025) |
| 0.0 | 0.2 | GO:0008440 | inositol-1,4,5-trisphosphate 3-kinase activity(GO:0008440) |
| 0.0 | 0.6 | GO:0048018 | receptor agonist activity(GO:0048018) |
| 0.0 | 0.4 | GO:0030215 | semaphorin receptor binding(GO:0030215) |
| 0.0 | 1.6 | GO:0003743 | translation initiation factor activity(GO:0003743) |
| 0.0 | 0.4 | GO:0004089 | carbonate dehydratase activity(GO:0004089) |
| 0.0 | 2.6 | GO:0003727 | single-stranded RNA binding(GO:0003727) |
| 0.0 | 0.6 | GO:0008519 | ammonium transmembrane transporter activity(GO:0008519) |
| 0.0 | 0.2 | GO:0070097 | delta-catenin binding(GO:0070097) |
| 0.0 | 0.5 | GO:0004745 | retinol dehydrogenase activity(GO:0004745) |
| 0.0 | 0.1 | GO:0050501 | hyaluronan synthase activity(GO:0050501) |
| 0.0 | 0.2 | GO:0004321 | fatty-acyl-CoA synthase activity(GO:0004321) |
| 0.0 | 0.3 | GO:0019531 | oxalate transmembrane transporter activity(GO:0019531) |
| 0.0 | 0.7 | GO:0015248 | sterol transporter activity(GO:0015248) |
| 0.0 | 0.7 | GO:0046875 | ephrin receptor binding(GO:0046875) |
| 0.0 | 0.4 | GO:0008510 | sodium:bicarbonate symporter activity(GO:0008510) |
| 0.0 | 0.5 | GO:0042805 | actinin binding(GO:0042805) |
| 0.0 | 0.4 | GO:0022841 | potassium ion leak channel activity(GO:0022841) |
| 0.0 | 0.3 | GO:0047617 | acyl-CoA hydrolase activity(GO:0047617) |
| 0.0 | 0.1 | GO:0016748 | succinyltransferase activity(GO:0016748) |
| 0.0 | 0.5 | GO:0008574 | ATP-dependent microtubule motor activity, plus-end-directed(GO:0008574) |
| 0.0 | 0.2 | GO:1904264 | ubiquitin protein ligase activity involved in ERAD pathway(GO:1904264) |
| 0.0 | 0.4 | GO:0005112 | Notch binding(GO:0005112) |
| 0.0 | 0.2 | GO:0001206 | transcriptional repressor activity, RNA polymerase II distal enhancer sequence-specific binding(GO:0001206) |
| 0.0 | 0.2 | GO:0001591 | dopamine neurotransmitter receptor activity, coupled via Gi/Go(GO:0001591) |
| 0.0 | 0.7 | GO:0061631 | ubiquitin conjugating enzyme activity(GO:0061631) |
| 0.0 | 0.2 | GO:0004551 | nucleotide diphosphatase activity(GO:0004551) |
| 0.0 | 0.4 | GO:0000993 | RNA polymerase II core binding(GO:0000993) |
| 0.0 | 0.1 | GO:0004571 | mannosyl-oligosaccharide 1,2-alpha-mannosidase activity(GO:0004571) |
| 0.0 | 0.7 | GO:0001103 | RNA polymerase II repressing transcription factor binding(GO:0001103) |
Gene overrepresentation in curated gene sets: canonical pathways category:
| Log-likelihood per target | Total log-likelihood | Term | Description |
|---|---|---|---|
| 0.0 | 4.6 | PID SYNDECAN 1 PATHWAY | Syndecan-1-mediated signaling events |
| 0.0 | 4.3 | PID AMB2 NEUTROPHILS PATHWAY | amb2 Integrin signaling |
| 0.0 | 0.7 | PID KIT PATHWAY | Signaling events mediated by Stem cell factor receptor (c-Kit) |
| 0.0 | 1.6 | ST GRANULE CELL SURVIVAL PATHWAY | Granule Cell Survival Pathway is a specific case of more general PAC1 Receptor Pathway. |
| 0.0 | 1.2 | PID SYNDECAN 2 PATHWAY | Syndecan-2-mediated signaling events |
| 0.0 | 1.0 | PID EPHA FWDPATHWAY | EPHA forward signaling |
| 0.0 | 2.8 | PID CERAMIDE PATHWAY | Ceramide signaling pathway |
| 0.0 | 0.4 | NABA COLLAGENS | Genes encoding collagen proteins |
| 0.0 | 1.5 | NABA BASEMENT MEMBRANES | Genes encoding structural components of basement membranes |
| 0.0 | 1.0 | PID INTEGRIN2 PATHWAY | Beta2 integrin cell surface interactions |
| 0.0 | 1.5 | PID PI3K PLC TRK PATHWAY | Trk receptor signaling mediated by PI3K and PLC-gamma |
| 0.0 | 1.1 | PID ERBB2 ERBB3 PATHWAY | ErbB2/ErbB3 signaling events |
| 0.0 | 8.4 | NABA ECM REGULATORS | Genes encoding enzymes and their regulators involved in the remodeling of the extracellular matrix |
| 0.0 | 0.3 | PID FRA PATHWAY | Validated transcriptional targets of AP1 family members Fra1 and Fra2 |
| 0.0 | 2.0 | PID HES HEY PATHWAY | Notch-mediated HES/HEY network |
| 0.0 | 2.0 | PID ANGIOPOIETIN RECEPTOR PATHWAY | Angiopoietin receptor Tie2-mediated signaling |
| 0.0 | 1.0 | PID RAS PATHWAY | Regulation of Ras family activation |
| 0.0 | 1.0 | PID PS1 PATHWAY | Presenilin action in Notch and Wnt signaling |
| 0.0 | 1.4 | PID BMP PATHWAY | BMP receptor signaling |
| 0.0 | 0.4 | ST ADRENERGIC | Adrenergic Pathway |
| 0.0 | 0.4 | PID INTEGRIN A9B1 PATHWAY | Alpha9 beta1 integrin signaling events |
| 0.0 | 1.5 | PID TELOMERASE PATHWAY | Regulation of Telomerase |
| 0.0 | 1.1 | PID TRKR PATHWAY | Neurotrophic factor-mediated Trk receptor signaling |
Gene overrepresentation in curated gene sets: REACTOME pathways category:
| Log-likelihood per target | Total log-likelihood | Term | Description |
|---|---|---|---|
| 0.3 | 4.2 | REACTOME CREATION OF C4 AND C2 ACTIVATORS | Genes involved in Creation of C4 and C2 activators |
| 0.2 | 2.3 | REACTOME INITIAL TRIGGERING OF COMPLEMENT | Genes involved in Initial triggering of complement |
| 0.2 | 4.1 | REACTOME HDL MEDIATED LIPID TRANSPORT | Genes involved in HDL-mediated lipid transport |
| 0.1 | 4.7 | REACTOME AMINO ACID SYNTHESIS AND INTERCONVERSION TRANSAMINATION | Genes involved in Amino acid synthesis and interconversion (transamination) |
| 0.1 | 2.7 | REACTOME CHYLOMICRON MEDIATED LIPID TRANSPORT | Genes involved in Chylomicron-mediated lipid transport |
| 0.1 | 4.3 | REACTOME PTM GAMMA CARBOXYLATION HYPUSINE FORMATION AND ARYLSULFATASE ACTIVATION | Genes involved in PTM: gamma carboxylation, hypusine formation and arylsulfatase activation |
| 0.1 | 2.2 | REACTOME ORGANIC CATION ANION ZWITTERION TRANSPORT | Genes involved in Organic cation/anion/zwitterion transport |
| 0.1 | 1.6 | REACTOME VITAMIN B5 PANTOTHENATE METABOLISM | Genes involved in Vitamin B5 (pantothenate) metabolism |
| 0.1 | 2.9 | REACTOME ENOS ACTIVATION AND REGULATION | Genes involved in eNOS activation and regulation |
| 0.1 | 2.4 | REACTOME DEGRADATION OF THE EXTRACELLULAR MATRIX | Genes involved in Degradation of the extracellular matrix |
| 0.1 | 2.3 | REACTOME PLATELET CALCIUM HOMEOSTASIS | Genes involved in Platelet calcium homeostasis |
| 0.1 | 2.3 | REACTOME CHONDROITIN SULFATE BIOSYNTHESIS | Genes involved in Chondroitin sulfate biosynthesis |
| 0.0 | 2.4 | REACTOME DEADENYLATION OF MRNA | Genes involved in Deadenylation of mRNA |
| 0.0 | 2.0 | REACTOME TIE2 SIGNALING | Genes involved in Tie2 Signaling |
| 0.0 | 1.0 | REACTOME SEMA4D INDUCED CELL MIGRATION AND GROWTH CONE COLLAPSE | Genes involved in Sema4D induced cell migration and growth-cone collapse |
| 0.0 | 0.7 | REACTOME IL 7 SIGNALING | Genes involved in Interleukin-7 signaling |
| 0.0 | 0.7 | REACTOME PASSIVE TRANSPORT BY AQUAPORINS | Genes involved in Passive Transport by Aquaporins |
| 0.0 | 1.0 | REACTOME SYNTHESIS OF PE | Genes involved in Synthesis of PE |
| 0.0 | 1.4 | REACTOME PROLACTIN RECEPTOR SIGNALING | Genes involved in Prolactin receptor signaling |
| 0.0 | 1.6 | REACTOME HS GAG BIOSYNTHESIS | Genes involved in HS-GAG biosynthesis |
| 0.0 | 1.3 | REACTOME ZINC TRANSPORTERS | Genes involved in Zinc transporters |
| 0.0 | 0.5 | REACTOME SHC MEDIATED SIGNALLING | Genes involved in SHC-mediated signalling |
| 0.0 | 0.4 | REACTOME PROSTANOID LIGAND RECEPTORS | Genes involved in Prostanoid ligand receptors |
| 0.0 | 2.5 | REACTOME REGULATION OF BETA CELL DEVELOPMENT | Genes involved in Regulation of beta-cell development |
| 0.0 | 3.0 | REACTOME NCAM1 INTERACTIONS | Genes involved in NCAM1 interactions |
| 0.0 | 0.7 | REACTOME REGULATION OF RHEB GTPASE ACTIVITY BY AMPK | Genes involved in Regulation of Rheb GTPase activity by AMPK |
| 0.0 | 1.3 | REACTOME NEPHRIN INTERACTIONS | Genes involved in Nephrin interactions |
| 0.0 | 0.8 | REACTOME BRANCHED CHAIN AMINO ACID CATABOLISM | Genes involved in Branched-chain amino acid catabolism |
| 0.0 | 2.1 | REACTOME NETRIN1 SIGNALING | Genes involved in Netrin-1 signaling |
| 0.0 | 1.0 | REACTOME SYNTHESIS AND INTERCONVERSION OF NUCLEOTIDE DI AND TRIPHOSPHATES | Genes involved in Synthesis and interconversion of nucleotide di- and triphosphates |
| 0.0 | 0.5 | REACTOME SYNTHESIS OF PIPS AT THE LATE ENDOSOME MEMBRANE | Genes involved in Synthesis of PIPs at the late endosome membrane |
| 0.0 | 0.5 | REACTOME SIGNALING BY FGFR3 MUTANTS | Genes involved in Signaling by FGFR3 mutants |
| 0.0 | 0.4 | REACTOME REMOVAL OF THE FLAP INTERMEDIATE FROM THE C STRAND | Genes involved in Removal of the Flap Intermediate from the C-strand |
| 0.0 | 1.0 | REACTOME TIGHT JUNCTION INTERACTIONS | Genes involved in Tight junction interactions |
| 0.0 | 0.9 | REACTOME AMINE COMPOUND SLC TRANSPORTERS | Genes involved in Amine compound SLC transporters |
| 0.0 | 0.4 | REACTOME REVERSIBLE HYDRATION OF CARBON DIOXIDE | Genes involved in Reversible Hydration of Carbon Dioxide |
| 0.0 | 0.5 | REACTOME SYNTHESIS OF PC | Genes involved in Synthesis of PC |
| 0.0 | 0.8 | REACTOME POST TRANSLATIONAL MODIFICATION SYNTHESIS OF GPI ANCHORED PROTEINS | Genes involved in Post-translational modification: synthesis of GPI-anchored proteins |
| 0.0 | 1.6 | REACTOME ACTIVATION OF CHAPERONE GENES BY XBP1S | Genes involved in Activation of Chaperone Genes by XBP1(S) |
| 0.0 | 0.4 | REACTOME TANDEM PORE DOMAIN POTASSIUM CHANNELS | Genes involved in Tandem pore domain potassium channels |
| 0.0 | 0.2 | REACTOME EICOSANOID LIGAND BINDING RECEPTORS | Genes involved in Eicosanoid ligand-binding receptors |
| 0.0 | 1.1 | REACTOME METABOLISM OF VITAMINS AND COFACTORS | Genes involved in Metabolism of vitamins and cofactors |
| 0.0 | 0.5 | REACTOME SULFUR AMINO ACID METABOLISM | Genes involved in Sulfur amino acid metabolism |
| 0.0 | 2.1 | REACTOME RESPONSE TO ELEVATED PLATELET CYTOSOLIC CA2 | Genes involved in Response to elevated platelet cytosolic Ca2+ |
| 0.0 | 0.5 | REACTOME RECYCLING PATHWAY OF L1 | Genes involved in Recycling pathway of L1 |
| 0.0 | 0.5 | REACTOME SIGNALING BY HIPPO | Genes involved in Signaling by Hippo |
| 0.0 | 1.1 | REACTOME TRAFFICKING OF AMPA RECEPTORS | Genes involved in Trafficking of AMPA receptors |
| 0.0 | 0.4 | REACTOME CHOLESTEROL BIOSYNTHESIS | Genes involved in Cholesterol biosynthesis |
| 0.0 | 0.9 | REACTOME METABOLISM OF NON CODING RNA | Genes involved in Metabolism of non-coding RNA |
| 0.0 | 0.2 | REACTOME SYNTHESIS SECRETION AND INACTIVATION OF GIP | Genes involved in Synthesis, Secretion, and Inactivation of Glucose-dependent Insulinotropic Polypeptide (GIP) |