Project
Illumina Body Map 2 (GSE30611)
Navigation
Downloads
Results for KLF15
Z-value: 1.06
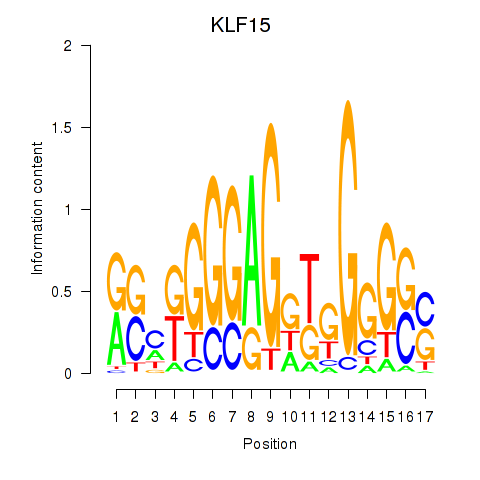
Motif logo
Transcription factors associated with KLF15
| Gene Symbol | Gene ID | Gene Info |
|---|---|---|
|
KLF15
|
ENSG00000163884.4 | Kruppel like factor 15 |
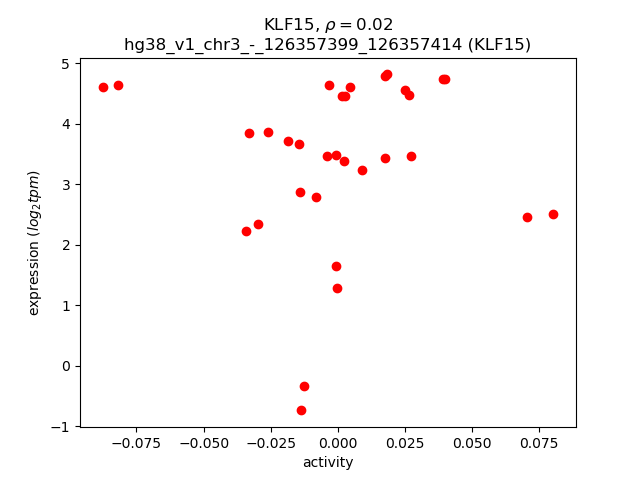
Activity-expression correlation:
| Gene | Promoter | Pearson corr. coef. | P-value | Plot |
|---|---|---|---|---|
| KLF15 | hg38_v1_chr3_-_126357399_126357414 | 0.02 | 9.1e-01 | Click! |
Activity profile of KLF15 motif
Sorted Z-values of KLF15 motif
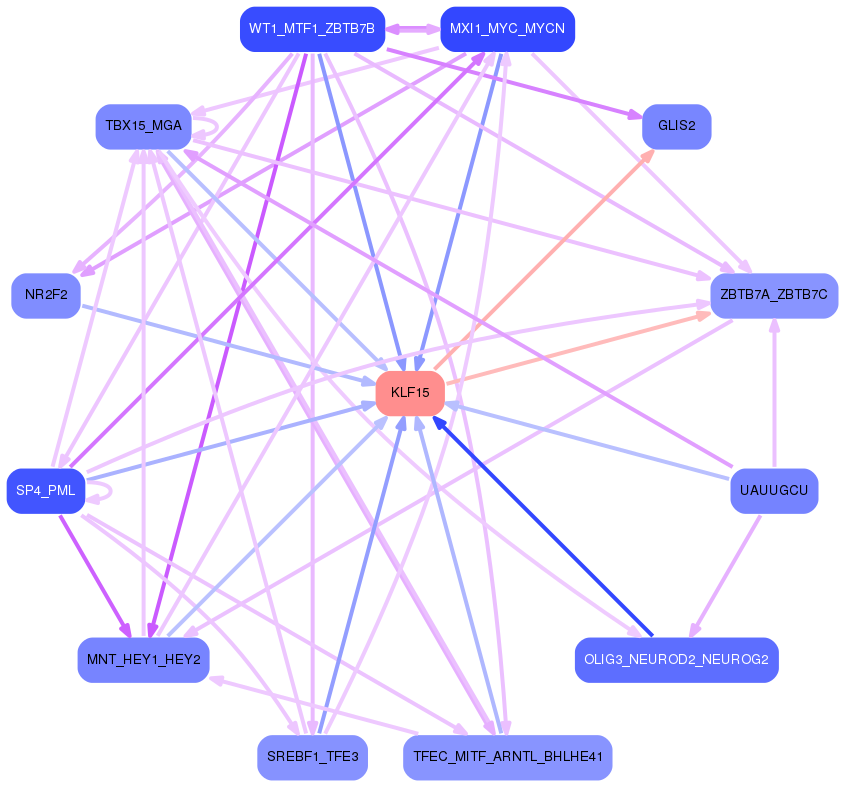
Network of associatons between targets according to the STRING database.

First level regulatory network of KLF15
Gene Ontology Analysis
Gene overrepresentation in biological process category:
| Log-likelihood per target | Total log-likelihood | Term | Description |
|---|---|---|---|
| 0.4 | 3.3 | GO:0034436 | glycoprotein transport(GO:0034436) |
| 0.4 | 2.6 | GO:0030421 | defecation(GO:0030421) |
| 0.4 | 1.5 | GO:0044691 | tooth eruption(GO:0044691) |
| 0.3 | 1.4 | GO:2000298 | regulation of Rho-dependent protein serine/threonine kinase activity(GO:2000298) |
| 0.3 | 1.4 | GO:0071422 | succinate transport(GO:0015744) succinate transmembrane transport(GO:0071422) |
| 0.3 | 1.0 | GO:1901492 | positive regulation of lymphangiogenesis(GO:1901492) |
| 0.3 | 1.3 | GO:1901165 | positive regulation of trophoblast cell migration(GO:1901165) |
| 0.3 | 1.1 | GO:1903225 | negative regulation of endodermal cell differentiation(GO:1903225) |
| 0.3 | 1.3 | GO:0098904 | regulation of AV node cell action potential(GO:0098904) |
| 0.3 | 0.8 | GO:0070904 | L-ascorbic acid transport(GO:0015882) transepithelial L-ascorbic acid transport(GO:0070904) |
| 0.3 | 1.1 | GO:0003095 | pressure natriuresis(GO:0003095) |
| 0.3 | 0.8 | GO:0021503 | neural fold bending(GO:0021503) |
| 0.2 | 1.3 | GO:0060994 | regulation of transcription from RNA polymerase II promoter involved in kidney development(GO:0060994) |
| 0.2 | 0.8 | GO:0006478 | peptidyl-tyrosine sulfation(GO:0006478) |
| 0.2 | 1.4 | GO:0003150 | muscular septum morphogenesis(GO:0003150) |
| 0.2 | 1.2 | GO:0006546 | glycine catabolic process(GO:0006546) glycine decarboxylation via glycine cleavage system(GO:0019464) |
| 0.2 | 1.2 | GO:0033615 | mitochondrial proton-transporting ATP synthase complex assembly(GO:0033615) |
| 0.2 | 0.9 | GO:0097211 | response to gonadotropin-releasing hormone(GO:0097210) cellular response to gonadotropin-releasing hormone(GO:0097211) |
| 0.2 | 1.2 | GO:0014859 | negative regulation of skeletal muscle cell proliferation(GO:0014859) negative regulation of skeletal muscle satellite cell proliferation(GO:1902723) |
| 0.2 | 0.8 | GO:0030573 | bile acid catabolic process(GO:0030573) |
| 0.2 | 0.6 | GO:2000297 | negative regulation of synapse maturation(GO:2000297) |
| 0.2 | 1.4 | GO:0034316 | negative regulation of Arp2/3 complex-mediated actin nucleation(GO:0034316) |
| 0.2 | 0.5 | GO:0002368 | B cell cytokine production(GO:0002368) protein import into mitochondrial intermembrane space(GO:0045041) |
| 0.1 | 0.4 | GO:0021526 | medial motor column neuron differentiation(GO:0021526) |
| 0.1 | 11.6 | GO:0015701 | bicarbonate transport(GO:0015701) |
| 0.1 | 0.4 | GO:0060032 | notochord regression(GO:0060032) |
| 0.1 | 0.6 | GO:0038098 | sequestering of BMP from receptor via BMP binding(GO:0038098) |
| 0.1 | 0.6 | GO:1902766 | skeletal muscle satellite cell migration(GO:1902766) |
| 0.1 | 0.7 | GO:0010701 | positive regulation of norepinephrine secretion(GO:0010701) |
| 0.1 | 1.2 | GO:0006657 | CDP-choline pathway(GO:0006657) |
| 0.1 | 0.3 | GO:0006597 | spermine biosynthetic process(GO:0006597) |
| 0.1 | 0.3 | GO:0035990 | tendon cell differentiation(GO:0035990) tendon formation(GO:0035992) |
| 0.1 | 0.5 | GO:0003065 | positive regulation of heart rate by epinephrine(GO:0003065) |
| 0.1 | 0.7 | GO:0072156 | distal tubule morphogenesis(GO:0072156) |
| 0.1 | 0.3 | GO:0051695 | actin filament uncapping(GO:0051695) |
| 0.1 | 0.3 | GO:0003192 | mitral valve formation(GO:0003192) |
| 0.1 | 0.4 | GO:0010728 | regulation of hydrogen peroxide biosynthetic process(GO:0010728) |
| 0.1 | 1.8 | GO:0015074 | DNA integration(GO:0015074) |
| 0.1 | 0.3 | GO:1904845 | response to L-glutamine(GO:1904844) cellular response to L-glutamine(GO:1904845) |
| 0.1 | 0.4 | GO:0018008 | N-terminal peptidyl-glycine N-myristoylation(GO:0018008) |
| 0.1 | 0.6 | GO:0033504 | floor plate development(GO:0033504) |
| 0.1 | 0.3 | GO:0070662 | erythropoietin-mediated signaling pathway(GO:0038162) mast cell proliferation(GO:0070662) |
| 0.1 | 0.4 | GO:0015891 | iron chelate transport(GO:0015688) siderophore transport(GO:0015891) |
| 0.1 | 0.2 | GO:0019085 | early viral transcription(GO:0019085) |
| 0.1 | 0.5 | GO:0042494 | detection of bacterial lipoprotein(GO:0042494) |
| 0.1 | 0.4 | GO:0015878 | biotin transport(GO:0015878) pantothenate transmembrane transport(GO:0015887) |
| 0.1 | 0.3 | GO:0060596 | mammary placode formation(GO:0060596) |
| 0.1 | 0.4 | GO:0006177 | GMP biosynthetic process(GO:0006177) |
| 0.1 | 0.3 | GO:1904529 | regulation of actin filament binding(GO:1904529) regulation of actin binding(GO:1904616) |
| 0.1 | 0.3 | GO:1904381 | Golgi apparatus mannose trimming(GO:1904381) |
| 0.1 | 0.1 | GO:0003342 | proepicardium development(GO:0003342) septum transversum development(GO:0003343) |
| 0.1 | 1.1 | GO:0010668 | ectodermal cell differentiation(GO:0010668) |
| 0.1 | 1.0 | GO:0016191 | synaptic vesicle uncoating(GO:0016191) |
| 0.1 | 0.2 | GO:0061182 | negative regulation of chondrocyte development(GO:0061182) |
| 0.1 | 0.5 | GO:0000395 | mRNA 5'-splice site recognition(GO:0000395) |
| 0.1 | 0.5 | GO:0006489 | dolichyl diphosphate biosynthetic process(GO:0006489) dolichyl diphosphate metabolic process(GO:0046465) |
| 0.1 | 0.3 | GO:0009257 | 10-formyltetrahydrofolate biosynthetic process(GO:0009257) |
| 0.1 | 0.4 | GO:0097368 | establishment of Sertoli cell barrier(GO:0097368) |
| 0.1 | 1.0 | GO:0036066 | protein O-linked fucosylation(GO:0036066) |
| 0.1 | 1.0 | GO:0009957 | epidermal cell fate specification(GO:0009957) |
| 0.1 | 1.0 | GO:0048671 | negative regulation of collateral sprouting(GO:0048671) |
| 0.1 | 0.6 | GO:0006552 | leucine catabolic process(GO:0006552) |
| 0.1 | 0.2 | GO:0042137 | sequestering of neurotransmitter(GO:0042137) |
| 0.1 | 1.7 | GO:0060732 | positive regulation of inositol phosphate biosynthetic process(GO:0060732) |
| 0.1 | 0.6 | GO:0001886 | endothelial cell morphogenesis(GO:0001886) |
| 0.1 | 0.5 | GO:0051725 | protein de-ADP-ribosylation(GO:0051725) |
| 0.1 | 0.5 | GO:0035865 | cellular response to potassium ion(GO:0035865) |
| 0.0 | 0.2 | GO:0043686 | co-translational protein modification(GO:0043686) |
| 0.0 | 0.8 | GO:1903025 | regulation of RNA polymerase II regulatory region sequence-specific DNA binding(GO:1903025) |
| 0.0 | 0.3 | GO:0050893 | sensory processing(GO:0050893) |
| 0.0 | 0.2 | GO:0045013 | carbon catabolite repression of transcription(GO:0045013) negative regulation of transcription by glucose(GO:0045014) |
| 0.0 | 0.3 | GO:0051792 | medium-chain fatty acid biosynthetic process(GO:0051792) |
| 0.0 | 1.1 | GO:0010991 | negative regulation of SMAD protein complex assembly(GO:0010991) |
| 0.0 | 0.4 | GO:1902231 | positive regulation of intrinsic apoptotic signaling pathway in response to DNA damage(GO:1902231) |
| 0.0 | 0.2 | GO:1902460 | regulation of mesenchymal stem cell proliferation(GO:1902460) positive regulation of mesenchymal stem cell proliferation(GO:1902462) |
| 0.0 | 0.8 | GO:1901748 | leukotriene D4 metabolic process(GO:1901748) leukotriene D4 biosynthetic process(GO:1901750) |
| 0.0 | 0.1 | GO:1905051 | regulation of base-excision repair(GO:1905051) positive regulation of base-excision repair(GO:1905053) |
| 0.0 | 0.6 | GO:0097116 | gephyrin clustering involved in postsynaptic density assembly(GO:0097116) |
| 0.0 | 0.2 | GO:1903588 | negative regulation of blood vessel endothelial cell proliferation involved in sprouting angiogenesis(GO:1903588) |
| 0.0 | 0.1 | GO:0003221 | right ventricular cardiac muscle tissue morphogenesis(GO:0003221) |
| 0.0 | 0.3 | GO:0051684 | maintenance of Golgi location(GO:0051684) |
| 0.0 | 0.4 | GO:0018230 | peptidyl-L-cysteine S-palmitoylation(GO:0018230) peptidyl-S-diacylglycerol-L-cysteine biosynthetic process from peptidyl-cysteine(GO:0018231) |
| 0.0 | 0.5 | GO:0018094 | protein polyglycylation(GO:0018094) |
| 0.0 | 0.6 | GO:1904628 | response to phorbol 13-acetate 12-myristate(GO:1904627) cellular response to phorbol 13-acetate 12-myristate(GO:1904628) |
| 0.0 | 0.6 | GO:0007258 | JUN phosphorylation(GO:0007258) |
| 0.0 | 0.2 | GO:0010133 | proline catabolic process to glutamate(GO:0010133) |
| 0.0 | 0.4 | GO:0042791 | 5S class rRNA transcription from RNA polymerase III type 1 promoter(GO:0042791) tRNA transcription from RNA polymerase III promoter(GO:0042797) |
| 0.0 | 0.5 | GO:0048251 | elastic fiber assembly(GO:0048251) |
| 0.0 | 1.5 | GO:0016338 | calcium-independent cell-cell adhesion via plasma membrane cell-adhesion molecules(GO:0016338) |
| 0.0 | 0.6 | GO:0010499 | proteasomal ubiquitin-independent protein catabolic process(GO:0010499) |
| 0.0 | 0.6 | GO:0051152 | positive regulation of smooth muscle cell differentiation(GO:0051152) |
| 0.0 | 0.3 | GO:0018211 | protein C-linked glycosylation(GO:0018103) peptidyl-tryptophan modification(GO:0018211) protein C-linked glycosylation via tryptophan(GO:0018317) protein C-linked glycosylation via 2'-alpha-mannosyl-L-tryptophan(GO:0018406) |
| 0.0 | 0.2 | GO:0009256 | 10-formyltetrahydrofolate metabolic process(GO:0009256) |
| 0.0 | 0.2 | GO:0040030 | regulation of molecular function, epigenetic(GO:0040030) |
| 0.0 | 0.7 | GO:0045721 | negative regulation of gluconeogenesis(GO:0045721) |
| 0.0 | 0.5 | GO:1902414 | protein localization to cell junction(GO:1902414) |
| 0.0 | 0.4 | GO:0060267 | positive regulation of respiratory burst(GO:0060267) |
| 0.0 | 0.4 | GO:1900122 | positive regulation of receptor binding(GO:1900122) |
| 0.0 | 0.4 | GO:0030091 | protein repair(GO:0030091) |
| 0.0 | 0.4 | GO:2000601 | positive regulation of Arp2/3 complex-mediated actin nucleation(GO:2000601) |
| 0.0 | 0.1 | GO:0060061 | Spemann organizer formation(GO:0060061) |
| 0.0 | 0.6 | GO:0007512 | adult heart development(GO:0007512) |
| 0.0 | 1.2 | GO:0014912 | negative regulation of smooth muscle cell migration(GO:0014912) |
| 0.0 | 0.1 | GO:0009405 | pathogenesis(GO:0009405) |
| 0.0 | 0.1 | GO:0016480 | negative regulation of transcription from RNA polymerase III promoter(GO:0016480) |
| 0.0 | 0.5 | GO:1990035 | calcium ion import across plasma membrane(GO:0098703) calcium ion import into cell(GO:1990035) |
| 0.0 | 0.7 | GO:0006474 | N-terminal protein amino acid acetylation(GO:0006474) |
| 0.0 | 0.8 | GO:0048172 | regulation of short-term neuronal synaptic plasticity(GO:0048172) |
| 0.0 | 0.1 | GO:0031508 | pericentric heterochromatin assembly(GO:0031508) |
| 0.0 | 2.1 | GO:0006904 | vesicle docking involved in exocytosis(GO:0006904) |
| 0.0 | 0.2 | GO:0060295 | regulation of cilium movement involved in cell motility(GO:0060295) regulation of cilium beat frequency involved in ciliary motility(GO:0060296) regulation of cilium-dependent cell motility(GO:1902019) |
| 0.0 | 0.5 | GO:0006610 | ribosomal protein import into nucleus(GO:0006610) |
| 0.0 | 0.1 | GO:1904692 | positive regulation of type B pancreatic cell proliferation(GO:1904692) |
| 0.0 | 0.4 | GO:0033227 | dsRNA transport(GO:0033227) |
| 0.0 | 0.2 | GO:2000048 | negative regulation of cell-cell adhesion mediated by cadherin(GO:2000048) |
| 0.0 | 0.2 | GO:0035583 | sequestering of TGFbeta in extracellular matrix(GO:0035583) |
| 0.0 | 0.1 | GO:2000740 | amniotic stem cell differentiation(GO:0097086) negative regulation of dense core granule biogenesis(GO:2000706) negative regulation of mesenchymal stem cell differentiation(GO:2000740) regulation of amniotic stem cell differentiation(GO:2000797) negative regulation of amniotic stem cell differentiation(GO:2000798) |
| 0.0 | 0.1 | GO:0014050 | negative regulation of glutamate secretion(GO:0014050) |
| 0.0 | 0.2 | GO:0097500 | receptor localization to nonmotile primary cilium(GO:0097500) |
| 0.0 | 0.3 | GO:0021894 | cerebral cortex GABAergic interneuron development(GO:0021894) |
| 0.0 | 0.3 | GO:0030050 | vesicle transport along actin filament(GO:0030050) |
| 0.0 | 0.5 | GO:0040015 | negative regulation of multicellular organism growth(GO:0040015) |
| 0.0 | 0.8 | GO:0071447 | cellular response to hydroperoxide(GO:0071447) |
| 0.0 | 0.0 | GO:1904693 | midbrain morphogenesis(GO:1904693) |
| 0.0 | 0.2 | GO:0033159 | negative regulation of protein import into nucleus, translocation(GO:0033159) |
| 0.0 | 0.5 | GO:0006750 | glutathione biosynthetic process(GO:0006750) |
| 0.0 | 1.0 | GO:0071711 | basement membrane organization(GO:0071711) |
| 0.0 | 0.1 | GO:0033484 | nitric oxide homeostasis(GO:0033484) |
| 0.0 | 1.2 | GO:0045671 | negative regulation of osteoclast differentiation(GO:0045671) |
| 0.0 | 0.7 | GO:0007158 | neuron cell-cell adhesion(GO:0007158) |
| 0.0 | 0.5 | GO:0031065 | positive regulation of histone deacetylation(GO:0031065) |
| 0.0 | 0.4 | GO:0038203 | TORC2 signaling(GO:0038203) |
| 0.0 | 0.2 | GO:0090116 | C-5 methylation of cytosine(GO:0090116) |
| 0.0 | 0.2 | GO:1902031 | regulation of NADP metabolic process(GO:1902031) |
| 0.0 | 1.1 | GO:1903861 | positive regulation of dendrite extension(GO:1903861) |
| 0.0 | 0.3 | GO:0002087 | regulation of respiratory gaseous exchange by neurological system process(GO:0002087) |
| 0.0 | 0.4 | GO:0019800 | peptide cross-linking via chondroitin 4-sulfate glycosaminoglycan(GO:0019800) |
| 0.0 | 0.4 | GO:0045741 | positive regulation of epidermal growth factor-activated receptor activity(GO:0045741) |
| 0.0 | 0.3 | GO:0090361 | platelet-derived growth factor production(GO:0090360) regulation of platelet-derived growth factor production(GO:0090361) |
| 0.0 | 0.4 | GO:1904714 | regulation of chaperone-mediated autophagy(GO:1904714) |
| 0.0 | 0.3 | GO:0032782 | bile acid secretion(GO:0032782) |
| 0.0 | 0.1 | GO:0050915 | sensory perception of sour taste(GO:0050915) |
| 0.0 | 0.7 | GO:0060122 | inner ear receptor stereocilium organization(GO:0060122) |
| 0.0 | 0.6 | GO:0007413 | axonal fasciculation(GO:0007413) |
| 0.0 | 0.1 | GO:0009137 | purine nucleoside diphosphate catabolic process(GO:0009137) purine ribonucleoside diphosphate catabolic process(GO:0009181) |
| 0.0 | 0.4 | GO:0042759 | long-chain fatty acid biosynthetic process(GO:0042759) |
| 0.0 | 0.3 | GO:0060613 | fat pad development(GO:0060613) |
| 0.0 | 0.4 | GO:0045162 | clustering of voltage-gated sodium channels(GO:0045162) |
| 0.0 | 0.1 | GO:0044336 | canonical Wnt signaling pathway involved in negative regulation of apoptotic process(GO:0044336) |
| 0.0 | 1.1 | GO:0031122 | cytoplasmic microtubule organization(GO:0031122) |
| 0.0 | 0.3 | GO:1904776 | regulation of protein localization to cell cortex(GO:1904776) positive regulation of protein localization to cell cortex(GO:1904778) |
| 0.0 | 0.9 | GO:0007214 | gamma-aminobutyric acid signaling pathway(GO:0007214) |
| 0.0 | 0.5 | GO:0098903 | regulation of membrane repolarization during action potential(GO:0098903) |
| 0.0 | 0.5 | GO:0042276 | error-prone translesion synthesis(GO:0042276) |
| 0.0 | 0.1 | GO:0061084 | regulation of protein refolding(GO:0061083) negative regulation of protein refolding(GO:0061084) |
| 0.0 | 0.1 | GO:0006203 | dGTP catabolic process(GO:0006203) |
| 0.0 | 0.5 | GO:0044030 | regulation of DNA methylation(GO:0044030) |
| 0.0 | 0.8 | GO:0046627 | negative regulation of insulin receptor signaling pathway(GO:0046627) |
| 0.0 | 0.1 | GO:0035879 | plasma membrane lactate transport(GO:0035879) |
| 0.0 | 0.5 | GO:0014850 | response to muscle activity(GO:0014850) |
| 0.0 | 1.0 | GO:0051965 | positive regulation of synapse assembly(GO:0051965) |
| 0.0 | 0.7 | GO:1900740 | regulation of protein insertion into mitochondrial membrane involved in apoptotic signaling pathway(GO:1900739) positive regulation of protein insertion into mitochondrial membrane involved in apoptotic signaling pathway(GO:1900740) |
| 0.0 | 0.1 | GO:0009644 | response to high light intensity(GO:0009644) |
| 0.0 | 0.2 | GO:0035268 | protein mannosylation(GO:0035268) |
| 0.0 | 0.9 | GO:0007157 | heterophilic cell-cell adhesion via plasma membrane cell adhesion molecules(GO:0007157) |
| 0.0 | 1.0 | GO:0007223 | Wnt signaling pathway, calcium modulating pathway(GO:0007223) |
| 0.0 | 4.8 | GO:0007160 | cell-matrix adhesion(GO:0007160) |
| 0.0 | 0.0 | GO:0043385 | mycotoxin metabolic process(GO:0043385) aflatoxin metabolic process(GO:0046222) organic heteropentacyclic compound metabolic process(GO:1901376) |
| 0.0 | 0.2 | GO:0035372 | protein localization to microtubule(GO:0035372) |
| 0.0 | 0.3 | GO:0008038 | neuron recognition(GO:0008038) |
| 0.0 | 0.5 | GO:0015721 | bile acid and bile salt transport(GO:0015721) |
| 0.0 | 0.7 | GO:0045638 | negative regulation of myeloid cell differentiation(GO:0045638) |
| 0.0 | 0.1 | GO:0010961 | cellular magnesium ion homeostasis(GO:0010961) |
Gene overrepresentation in cellular component category:
| Log-likelihood per target | Total log-likelihood | Term | Description |
|---|---|---|---|
| 0.5 | 1.5 | GO:0005584 | collagen type I trimer(GO:0005584) |
| 0.4 | 3.6 | GO:0016012 | sarcoglycan complex(GO:0016012) |
| 0.3 | 1.1 | GO:0005588 | collagen type V trimer(GO:0005588) |
| 0.1 | 1.1 | GO:0070695 | FHF complex(GO:0070695) |
| 0.1 | 0.7 | GO:0038039 | G-protein coupled receptor heterodimeric complex(GO:0038039) |
| 0.1 | 3.3 | GO:0034361 | very-low-density lipoprotein particle(GO:0034361) triglyceride-rich lipoprotein particle(GO:0034385) |
| 0.1 | 1.6 | GO:0008091 | spectrin(GO:0008091) |
| 0.1 | 2.9 | GO:0016327 | apicolateral plasma membrane(GO:0016327) |
| 0.1 | 0.5 | GO:0046696 | lipopolysaccharide receptor complex(GO:0046696) |
| 0.1 | 0.6 | GO:0044294 | dendritic growth cone(GO:0044294) |
| 0.0 | 0.5 | GO:0071953 | elastic fiber(GO:0071953) |
| 0.0 | 0.6 | GO:0001939 | female pronucleus(GO:0001939) |
| 0.0 | 0.5 | GO:0016602 | CCAAT-binding factor complex(GO:0016602) |
| 0.0 | 1.4 | GO:0031362 | anchored component of external side of plasma membrane(GO:0031362) |
| 0.0 | 0.7 | GO:0005862 | muscle thin filament tropomyosin(GO:0005862) |
| 0.0 | 0.4 | GO:0030896 | checkpoint clamp complex(GO:0030896) |
| 0.0 | 0.4 | GO:0000127 | transcription factor TFIIIC complex(GO:0000127) |
| 0.0 | 1.1 | GO:0031235 | intrinsic component of the cytoplasmic side of the plasma membrane(GO:0031235) |
| 0.0 | 0.9 | GO:0031045 | dense core granule(GO:0031045) |
| 0.0 | 0.4 | GO:0016589 | NURF complex(GO:0016589) |
| 0.0 | 0.4 | GO:0005853 | eukaryotic translation elongation factor 1 complex(GO:0005853) |
| 0.0 | 0.4 | GO:0031209 | SCAR complex(GO:0031209) |
| 0.0 | 0.6 | GO:1990454 | L-type voltage-gated calcium channel complex(GO:1990454) |
| 0.0 | 2.4 | GO:0030669 | clathrin-coated endocytic vesicle membrane(GO:0030669) |
| 0.0 | 0.2 | GO:0070081 | clathrin-sculpted monoamine transport vesicle(GO:0070081) clathrin-sculpted monoamine transport vesicle membrane(GO:0070083) |
| 0.0 | 0.3 | GO:0046581 | intercellular canaliculus(GO:0046581) |
| 0.0 | 0.3 | GO:0044352 | pinosome(GO:0044352) macropinosome(GO:0044354) |
| 0.0 | 2.1 | GO:0031526 | brush border membrane(GO:0031526) |
| 0.0 | 0.1 | GO:0031501 | mannosyltransferase complex(GO:0031501) |
| 0.0 | 0.8 | GO:0044298 | neuronal cell body membrane(GO:0032809) cell body membrane(GO:0044298) |
| 0.0 | 0.2 | GO:0034464 | BBSome(GO:0034464) |
| 0.0 | 0.3 | GO:0008074 | guanylate cyclase complex, soluble(GO:0008074) |
| 0.0 | 1.3 | GO:0032420 | stereocilium(GO:0032420) |
| 0.0 | 0.3 | GO:0043020 | NADPH oxidase complex(GO:0043020) |
| 0.0 | 0.4 | GO:0031932 | TORC2 complex(GO:0031932) |
| 0.0 | 0.2 | GO:0061673 | mitotic spindle astral microtubule(GO:0061673) |
| 0.0 | 0.2 | GO:0008250 | oligosaccharyltransferase complex(GO:0008250) |
| 0.0 | 0.2 | GO:0032591 | dendritic spine membrane(GO:0032591) |
| 0.0 | 0.2 | GO:0070449 | elongin complex(GO:0070449) |
| 0.0 | 1.2 | GO:0030670 | phagocytic vesicle membrane(GO:0030670) |
| 0.0 | 1.2 | GO:0031463 | Cul3-RING ubiquitin ligase complex(GO:0031463) |
| 0.0 | 0.3 | GO:0001527 | microfibril(GO:0001527) fibril(GO:0043205) |
| 0.0 | 0.6 | GO:0032281 | AMPA glutamate receptor complex(GO:0032281) |
Gene overrepresentation in molecular function category:
| Log-likelihood per target | Total log-likelihood | Term | Description |
|---|---|---|---|
| 0.8 | 3.3 | GO:0034189 | very-low-density lipoprotein particle binding(GO:0034189) |
| 0.4 | 12.5 | GO:0008510 | sodium:bicarbonate symporter activity(GO:0008510) |
| 0.4 | 1.2 | GO:0004047 | aminomethyltransferase activity(GO:0004047) |
| 0.3 | 1.7 | GO:0004991 | parathyroid hormone receptor activity(GO:0004991) |
| 0.3 | 1.4 | GO:0015141 | succinate transmembrane transporter activity(GO:0015141) |
| 0.3 | 1.2 | GO:0004605 | diacylglycerol cholinephosphotransferase activity(GO:0004142) phosphatidate cytidylyltransferase activity(GO:0004605) |
| 0.3 | 0.8 | GO:0015229 | L-ascorbate:sodium symporter activity(GO:0008520) L-ascorbic acid transporter activity(GO:0015229) sodium-dependent L-ascorbate transmembrane transporter activity(GO:0070890) |
| 0.2 | 0.8 | GO:0008476 | protein-tyrosine sulfotransferase activity(GO:0008476) |
| 0.2 | 0.7 | GO:1990189 | peptide-serine-N-acetyltransferase activity(GO:1990189) |
| 0.2 | 0.5 | GO:0015275 | stretch-activated, cation-selective, calcium channel activity(GO:0015275) |
| 0.2 | 1.1 | GO:0018685 | alkane 1-monooxygenase activity(GO:0018685) leukotriene-B4 20-monooxygenase activity(GO:0050051) |
| 0.1 | 0.6 | GO:0098770 | FBXO family protein binding(GO:0098770) |
| 0.1 | 1.0 | GO:0097108 | smoothened binding(GO:0005119) hedgehog family protein binding(GO:0097108) |
| 0.1 | 1.4 | GO:0034235 | GPI anchor binding(GO:0034235) |
| 0.1 | 2.5 | GO:0010314 | phosphatidylinositol-5-phosphate binding(GO:0010314) |
| 0.1 | 1.3 | GO:0071253 | connexin binding(GO:0071253) |
| 0.1 | 2.4 | GO:0048407 | platelet-derived growth factor binding(GO:0048407) |
| 0.1 | 0.7 | GO:0004965 | G-protein coupled GABA receptor activity(GO:0004965) |
| 0.1 | 0.5 | GO:0008332 | low voltage-gated calcium channel activity(GO:0008332) |
| 0.1 | 1.2 | GO:0042731 | PH domain binding(GO:0042731) |
| 0.1 | 0.4 | GO:0004379 | glycylpeptide N-tetradecanoyltransferase activity(GO:0004379) myristoyltransferase activity(GO:0019107) |
| 0.1 | 0.4 | GO:0003938 | IMP dehydrogenase activity(GO:0003938) |
| 0.1 | 1.4 | GO:0071933 | Arp2/3 complex binding(GO:0071933) |
| 0.1 | 1.0 | GO:0008046 | axon guidance receptor activity(GO:0008046) |
| 0.1 | 0.5 | GO:0034186 | apolipoprotein A-I binding(GO:0034186) |
| 0.1 | 0.4 | GO:0008523 | sodium-dependent multivitamin transmembrane transporter activity(GO:0008523) |
| 0.1 | 0.5 | GO:0102008 | cytosolic dipeptidase activity(GO:0102008) |
| 0.1 | 0.6 | GO:0045545 | syndecan binding(GO:0045545) |
| 0.1 | 0.3 | GO:0004315 | 3-oxoacyl-[acyl-carrier-protein] synthase activity(GO:0004315) |
| 0.1 | 0.5 | GO:0050733 | RS domain binding(GO:0050733) |
| 0.1 | 0.8 | GO:0004969 | histamine receptor activity(GO:0004969) |
| 0.1 | 0.5 | GO:0070736 | protein-glycine ligase activity, initiating(GO:0070736) |
| 0.1 | 1.2 | GO:0031821 | G-protein coupled serotonin receptor binding(GO:0031821) |
| 0.1 | 0.3 | GO:0052810 | 1-phosphatidylinositol-5-kinase activity(GO:0052810) |
| 0.1 | 0.5 | GO:0004477 | methenyltetrahydrofolate cyclohydrolase activity(GO:0004477) methylenetetrahydrofolate dehydrogenase (NADP+) activity(GO:0004488) |
| 0.1 | 0.6 | GO:1990226 | histone methyltransferase binding(GO:1990226) |
| 0.1 | 1.4 | GO:0042813 | Wnt-activated receptor activity(GO:0042813) |
| 0.1 | 0.4 | GO:0051032 | nucleic acid transmembrane transporter activity(GO:0051032) RNA transmembrane transporter activity(GO:0051033) |
| 0.0 | 0.2 | GO:0043035 | chromatin insulator sequence binding(GO:0043035) |
| 0.0 | 0.4 | GO:0033743 | peptide-methionine (R)-S-oxide reductase activity(GO:0033743) |
| 0.0 | 0.6 | GO:0036122 | BMP binding(GO:0036122) |
| 0.0 | 0.4 | GO:0008853 | exodeoxyribonuclease III activity(GO:0008853) |
| 0.0 | 0.8 | GO:0036374 | glutathione hydrolase activity(GO:0036374) |
| 0.0 | 0.2 | GO:0015222 | serotonin transmembrane transporter activity(GO:0015222) |
| 0.0 | 0.9 | GO:0016500 | protein-hormone receptor activity(GO:0016500) |
| 0.0 | 6.0 | GO:0005070 | SH3/SH2 adaptor activity(GO:0005070) |
| 0.0 | 0.5 | GO:0004300 | enoyl-CoA hydratase activity(GO:0004300) |
| 0.0 | 0.2 | GO:0050436 | microfibril binding(GO:0050436) |
| 0.0 | 0.1 | GO:0004584 | dolichyl-phosphate-mannose-glycolipid alpha-mannosyltransferase activity(GO:0004584) |
| 0.0 | 0.3 | GO:0008467 | [heparan sulfate]-glucosamine 3-sulfotransferase 1 activity(GO:0008467) |
| 0.0 | 0.6 | GO:0003996 | acyl-CoA ligase activity(GO:0003996) |
| 0.0 | 1.6 | GO:0001968 | fibronectin binding(GO:0001968) |
| 0.0 | 0.1 | GO:0001601 | peptide YY receptor activity(GO:0001601) |
| 0.0 | 0.6 | GO:0005078 | MAP-kinase scaffold activity(GO:0005078) |
| 0.0 | 0.5 | GO:0052650 | NADP-retinol dehydrogenase activity(GO:0052650) |
| 0.0 | 0.6 | GO:0042975 | peroxisome proliferator activated receptor binding(GO:0042975) |
| 0.0 | 0.1 | GO:0008413 | 8-oxo-7,8-dihydroguanosine triphosphate pyrophosphatase activity(GO:0008413) 8-oxo-7,8-dihydrodeoxyguanosine triphosphate pyrophosphatase activity(GO:0035539) |
| 0.0 | 1.1 | GO:0008331 | high voltage-gated calcium channel activity(GO:0008331) |
| 0.0 | 1.1 | GO:0005031 | tumor necrosis factor-activated receptor activity(GO:0005031) death receptor activity(GO:0005035) |
| 0.0 | 0.4 | GO:0097322 | 7SK snRNA binding(GO:0097322) |
| 0.0 | 0.2 | GO:0004571 | mannosyl-oligosaccharide 1,2-alpha-mannosidase activity(GO:0004571) |
| 0.0 | 0.6 | GO:0003995 | acyl-CoA dehydrogenase activity(GO:0003995) |
| 0.0 | 1.1 | GO:0051959 | dynein light intermediate chain binding(GO:0051959) |
| 0.0 | 0.2 | GO:0030160 | GKAP/Homer scaffold activity(GO:0030160) |
| 0.0 | 0.2 | GO:0008379 | thioredoxin peroxidase activity(GO:0008379) |
| 0.0 | 0.1 | GO:0001716 | L-amino-acid oxidase activity(GO:0001716) |
| 0.0 | 1.4 | GO:0005158 | insulin receptor binding(GO:0005158) |
| 0.0 | 0.2 | GO:0004471 | malate dehydrogenase (decarboxylating) (NAD+) activity(GO:0004471) malate dehydrogenase (decarboxylating) (NADP+) activity(GO:0004473) |
| 0.0 | 0.9 | GO:0008395 | steroid hydroxylase activity(GO:0008395) |
| 0.0 | 0.8 | GO:0005251 | delayed rectifier potassium channel activity(GO:0005251) |
| 0.0 | 0.7 | GO:0050321 | tau-protein kinase activity(GO:0050321) |
| 0.0 | 0.6 | GO:0097109 | neuroligin family protein binding(GO:0097109) |
| 0.0 | 0.7 | GO:0031005 | filamin binding(GO:0031005) |
| 0.0 | 0.6 | GO:0005003 | ephrin receptor activity(GO:0005003) |
| 0.0 | 0.2 | GO:0003886 | DNA (cytosine-5-)-methyltransferase activity(GO:0003886) |
| 0.0 | 0.0 | GO:0004165 | dodecenoyl-CoA delta-isomerase activity(GO:0004165) |
| 0.0 | 0.3 | GO:0070679 | inositol 1,4,5 trisphosphate binding(GO:0070679) |
| 0.0 | 0.5 | GO:0008191 | metalloendopeptidase inhibitor activity(GO:0008191) |
| 0.0 | 0.2 | GO:0035252 | UDP-xylosyltransferase activity(GO:0035252) xylosyltransferase activity(GO:0042285) |
| 0.0 | 0.2 | GO:0004118 | cGMP-stimulated cyclic-nucleotide phosphodiesterase activity(GO:0004118) |
| 0.0 | 0.2 | GO:0004579 | dolichyl-diphosphooligosaccharide-protein glycotransferase activity(GO:0004579) |
| 0.0 | 0.3 | GO:0004383 | guanylate cyclase activity(GO:0004383) |
| 0.0 | 0.2 | GO:0043533 | inositol 1,3,4,5 tetrakisphosphate binding(GO:0043533) |
| 0.0 | 0.3 | GO:0030297 | transmembrane receptor protein tyrosine kinase activator activity(GO:0030297) |
| 0.0 | 0.3 | GO:0008140 | cAMP response element binding protein binding(GO:0008140) |
| 0.0 | 0.5 | GO:0004653 | polypeptide N-acetylgalactosaminyltransferase activity(GO:0004653) |
| 0.0 | 0.2 | GO:0022851 | GABA-gated chloride ion channel activity(GO:0022851) |
| 0.0 | 0.1 | GO:0005114 | type II transforming growth factor beta receptor binding(GO:0005114) |
| 0.0 | 1.3 | GO:0008028 | monocarboxylic acid transmembrane transporter activity(GO:0008028) |
| 0.0 | 1.3 | GO:0019003 | GDP binding(GO:0019003) |
| 0.0 | 0.8 | GO:0017075 | syntaxin-1 binding(GO:0017075) |
| 0.0 | 0.3 | GO:0004716 | receptor signaling protein tyrosine kinase activity(GO:0004716) |
| 0.0 | 0.4 | GO:0030296 | protein tyrosine kinase activator activity(GO:0030296) |
| 0.0 | 0.3 | GO:0016175 | superoxide-generating NADPH oxidase activity(GO:0016175) |
| 0.0 | 0.1 | GO:1990254 | keratin filament binding(GO:1990254) |
| 0.0 | 0.5 | GO:0015269 | calcium-activated potassium channel activity(GO:0015269) |
| 0.0 | 0.2 | GO:0102336 | fatty acid elongase activity(GO:0009922) 3-oxo-arachidoyl-CoA synthase activity(GO:0102336) 3-oxo-cerotoyl-CoA synthase activity(GO:0102337) 3-oxo-lignoceronyl-CoA synthase activity(GO:0102338) |
| 0.0 | 2.8 | GO:0008083 | growth factor activity(GO:0008083) |
| 0.0 | 0.5 | GO:0008139 | nuclear localization sequence binding(GO:0008139) |
| 0.0 | 0.3 | GO:0000030 | mannosyltransferase activity(GO:0000030) |
| 0.0 | 0.4 | GO:0003746 | translation elongation factor activity(GO:0003746) |
| 0.0 | 0.4 | GO:0003887 | DNA-directed DNA polymerase activity(GO:0003887) |
| 0.0 | 0.9 | GO:0070412 | R-SMAD binding(GO:0070412) |
| 0.0 | 0.2 | GO:0015643 | toxic substance binding(GO:0015643) |
Gene overrepresentation in curated gene sets: canonical pathways category:
| Log-likelihood per target | Total log-likelihood | Term | Description |
|---|---|---|---|
| 0.1 | 3.2 | PID LIS1 PATHWAY | Lissencephaly gene (LIS1) in neuronal migration and development |
| 0.0 | 5.9 | PID INTEGRIN1 PATHWAY | Beta1 integrin cell surface interactions |
| 0.0 | 1.6 | PID WNT SIGNALING PATHWAY | Wnt signaling network |
| 0.0 | 1.8 | PID PDGFRA PATHWAY | PDGFR-alpha signaling pathway |
| 0.0 | 1.4 | PID INTEGRIN3 PATHWAY | Beta3 integrin cell surface interactions |
| 0.0 | 0.9 | PID S1P S1P4 PATHWAY | S1P4 pathway |
| 0.0 | 1.0 | NABA BASEMENT MEMBRANES | Genes encoding structural components of basement membranes |
| 0.0 | 1.0 | PID HEDGEHOG 2PATHWAY | Signaling events mediated by the Hedgehog family |
| 0.0 | 0.9 | PID TOLL ENDOGENOUS PATHWAY | Endogenous TLR signaling |
| 0.0 | 0.6 | PID ERBB2 ERBB3 PATHWAY | ErbB2/ErbB3 signaling events |
| 0.0 | 3.2 | PID RAC1 REG PATHWAY | Regulation of RAC1 activity |
| 0.0 | 0.9 | PID ANGIOPOIETIN RECEPTOR PATHWAY | Angiopoietin receptor Tie2-mediated signaling |
| 0.0 | 0.6 | ST GRANULE CELL SURVIVAL PATHWAY | Granule Cell Survival Pathway is a specific case of more general PAC1 Receptor Pathway. |
| 0.0 | 0.8 | PID EPHA FWDPATHWAY | EPHA forward signaling |
| 0.0 | 1.0 | ST GA12 PATHWAY | G alpha 12 Pathway |
| 0.0 | 0.6 | PID PRL SIGNALING EVENTS PATHWAY | Signaling events mediated by PRL |
| 0.0 | 2.1 | PID RAC1 PATHWAY | RAC1 signaling pathway |
| 0.0 | 1.2 | PID PI3KCI PATHWAY | Class I PI3K signaling events |
| 0.0 | 0.4 | PID NETRIN PATHWAY | Netrin-mediated signaling events |
| 0.0 | 1.4 | PID BMP PATHWAY | BMP receptor signaling |
| 0.0 | 0.7 | PID ERBB NETWORK PATHWAY | ErbB receptor signaling network |
| 0.0 | 0.6 | PID EPHB FWD PATHWAY | EPHB forward signaling |
| 0.0 | 0.8 | PID AMB2 NEUTROPHILS PATHWAY | amb2 Integrin signaling |
| 0.0 | 0.6 | PID CDC42 REG PATHWAY | Regulation of CDC42 activity |
| 0.0 | 0.6 | PID RET PATHWAY | Signaling events regulated by Ret tyrosine kinase |
| 0.0 | 0.1 | PID EPHRINB REV PATHWAY | Ephrin B reverse signaling |
| 0.0 | 0.6 | PID IL2 STAT5 PATHWAY | IL2 signaling events mediated by STAT5 |
| 0.0 | 0.1 | SIG REGULATION OF THE ACTIN CYTOSKELETON BY RHO GTPASES | Genes related to regulation of the actin cytoskeleton |
Gene overrepresentation in curated gene sets: REACTOME pathways category:
| Log-likelihood per target | Total log-likelihood | Term | Description |
|---|---|---|---|
| 0.1 | 1.5 | REACTOME BILE SALT AND ORGANIC ANION SLC TRANSPORTERS | Genes involved in Bile salt and organic anion SLC transporters |
| 0.1 | 1.5 | REACTOME PLATELET ADHESION TO EXPOSED COLLAGEN | Genes involved in Platelet Adhesion to exposed collagen |
| 0.1 | 0.8 | REACTOME SYNTHESIS OF BILE ACIDS AND BILE SALTS VIA 24 HYDROXYCHOLESTEROL | Genes involved in Synthesis of bile acids and bile salts via 24-hydroxycholesterol |
| 0.0 | 1.3 | REACTOME SYNTHESIS OF GLYCOSYLPHOSPHATIDYLINOSITOL GPI | Genes involved in Synthesis of glycosylphosphatidylinositol (GPI) |
| 0.0 | 9.7 | REACTOME TRANSPORT OF INORGANIC CATIONS ANIONS AND AMINO ACIDS OLIGOPEPTIDES | Genes involved in Transport of inorganic cations/anions and amino acids/oligopeptides |
| 0.0 | 0.8 | REACTOME ROLE OF DCC IN REGULATING APOPTOSIS | Genes involved in Role of DCC in regulating apoptosis |
| 0.0 | 2.2 | REACTOME INHIBITION OF INSULIN SECRETION BY ADRENALINE NORADRENALINE | Genes involved in Inhibition of Insulin Secretion by Adrenaline/Noradrenaline |
| 0.0 | 0.5 | REACTOME SYNTHESIS OF SUBSTRATES IN N GLYCAN BIOSYTHESIS | Genes involved in Synthesis of substrates in N-glycan biosythesis |
| 0.0 | 1.5 | REACTOME TIE2 SIGNALING | Genes involved in Tie2 Signaling |
| 0.0 | 1.5 | REACTOME TIGHT JUNCTION INTERACTIONS | Genes involved in Tight junction interactions |
| 0.0 | 1.0 | REACTOME RETROGRADE NEUROTROPHIN SIGNALLING | Genes involved in Retrograde neurotrophin signalling |
| 0.0 | 0.5 | REACTOME MITOCHONDRIAL FATTY ACID BETA OXIDATION | Genes involved in Mitochondrial Fatty Acid Beta-Oxidation |
| 0.0 | 0.4 | REACTOME MEMBRANE BINDING AND TARGETTING OF GAG PROTEINS | Genes involved in Membrane binding and targetting of GAG proteins |
| 0.0 | 0.7 | REACTOME CLASS C 3 METABOTROPIC GLUTAMATE PHEROMONE RECEPTORS | Genes involved in Class C/3 (Metabotropic glutamate/pheromone receptors) |
| 0.0 | 0.4 | REACTOME PURINE RIBONUCLEOSIDE MONOPHOSPHATE BIOSYNTHESIS | Genes involved in Purine ribonucleoside monophosphate biosynthesis |
| 0.0 | 2.7 | REACTOME CLASS B 2 SECRETIN FAMILY RECEPTORS | Genes involved in Class B/2 (Secretin family receptors) |
| 0.0 | 0.6 | REACTOME BRANCHED CHAIN AMINO ACID CATABOLISM | Genes involved in Branched-chain amino acid catabolism |
| 0.0 | 0.3 | REACTOME ADENYLATE CYCLASE ACTIVATING PATHWAY | Genes involved in Adenylate cyclase activating pathway |
| 0.0 | 6.2 | REACTOME SIGNALING BY RHO GTPASES | Genes involved in Signaling by Rho GTPases |
| 0.0 | 0.2 | REACTOME G PROTEIN ACTIVATION | Genes involved in G-protein activation |
| 0.0 | 1.6 | REACTOME NCAM1 INTERACTIONS | Genes involved in NCAM1 interactions |
| 0.0 | 0.4 | REACTOME VITAMIN B5 PANTOTHENATE METABOLISM | Genes involved in Vitamin B5 (pantothenate) metabolism |
| 0.0 | 1.1 | REACTOME CYTOCHROME P450 ARRANGED BY SUBSTRATE TYPE | Genes involved in Cytochrome P450 - arranged by substrate type |
| 0.0 | 0.4 | REACTOME CS DS DEGRADATION | Genes involved in CS/DS degradation |
| 0.0 | 0.4 | REACTOME CRMPS IN SEMA3A SIGNALING | Genes involved in CRMPs in Sema3A signaling |
| 0.0 | 0.7 | REACTOME REGULATION OF INSULIN SECRETION BY GLUCAGON LIKE PEPTIDE1 | Genes involved in Regulation of Insulin Secretion by Glucagon-like Peptide-1 |
| 0.0 | 0.4 | REACTOME ENOS ACTIVATION AND REGULATION | Genes involved in eNOS activation and regulation |
| 0.0 | 0.5 | REACTOME SULFUR AMINO ACID METABOLISM | Genes involved in Sulfur amino acid metabolism |
| 0.0 | 0.7 | REACTOME SMOOTH MUSCLE CONTRACTION | Genes involved in Smooth Muscle Contraction |
| 0.0 | 1.3 | REACTOME IMMUNOREGULATORY INTERACTIONS BETWEEN A LYMPHOID AND A NON LYMPHOID CELL | Genes involved in Immunoregulatory interactions between a Lymphoid and a non-Lymphoid cell |
| 0.0 | 0.8 | REACTOME METABOLISM OF VITAMINS AND COFACTORS | Genes involved in Metabolism of vitamins and cofactors |
| 0.0 | 0.5 | REACTOME DOWNREGULATION OF TGF BETA RECEPTOR SIGNALING | Genes involved in Downregulation of TGF-beta receptor signaling |